Control of Slc7a5 sensitivity by the voltage-sensing domain of Kv1 channels
- Department of Pharmacology, Alberta Diabetes Institute, University of Alberta, Canada
- School of Dentistry, Faculty of Medicine and Dentistry, University of Alberta, School of Dentistry, Edmonton Clinic Health Academy (ECHA), Canada
- Department of Biochemistry, Dokkyo Medical University School of Medicine, Japan
- Department of Medicine, Faculty of Medicine and Dentistry, University of Alberta, Canada
Figures
Figure 1
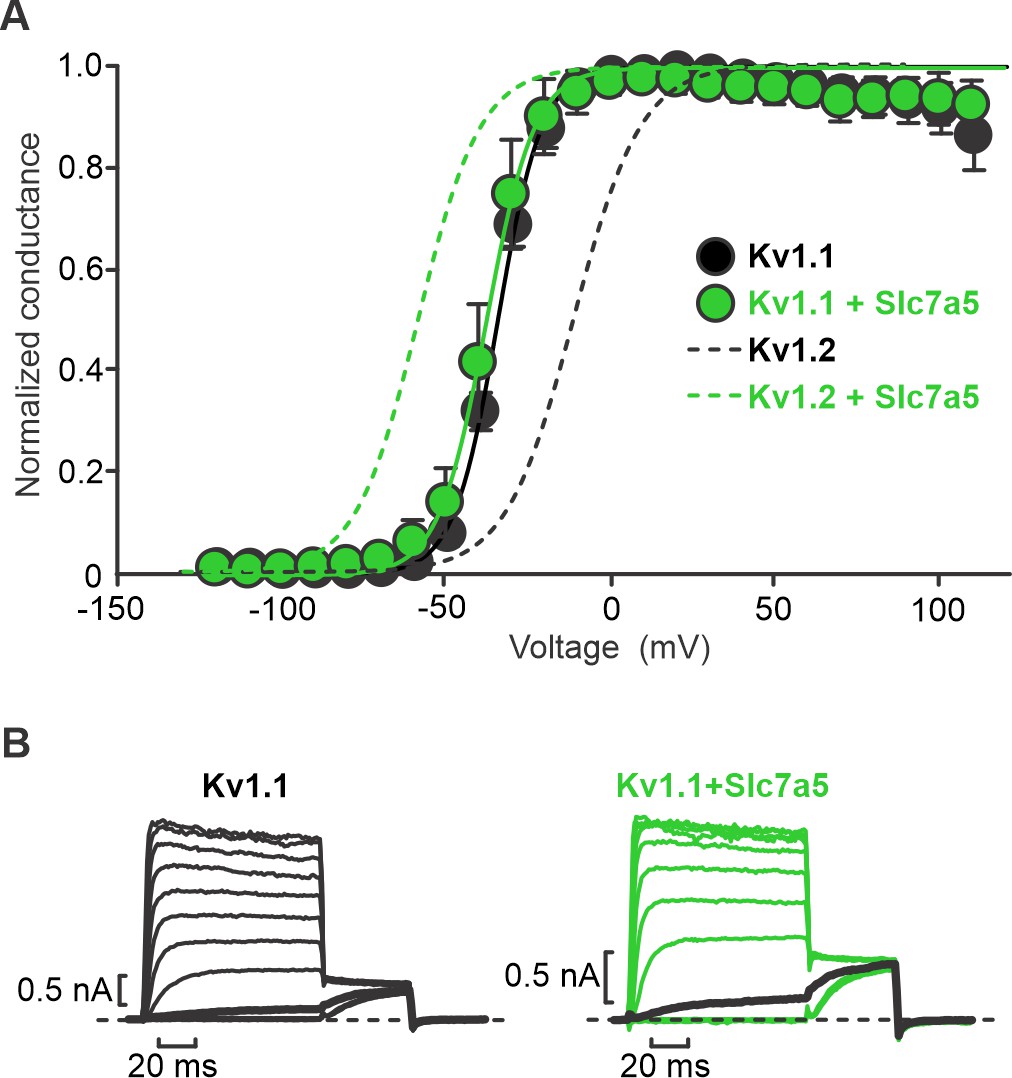
Slc7a5 has no effect on voltage-dependent activation of Kv1.1.
(A) Conductance-voltage relationships were determined for indicated combinations of Kv1.1 and Slc7a5 expressed in LM mouse fibroblasts. Cells were stepped between −130 mV and +110 mV in 10 mV increments, with a tail current voltage of −20 mV. Dashed lines indicate previously reported conductance-voltage relationship in Kv1.2±Slc7a5 (Baronas et al., 2018). Fit parameters for Kv1.1 were (co-expression with Slc7a5 in parentheses): V1/2 = -34.9 ± 0.3 mV (−37.5 ± 0.2 mV); k = 6.9 ± 0.9 mV (7.3 ± 0.9 mV). No statistical difference in voltage-dependent gating parameters were detected for Kv1.1±Slc7a5. (B) Exemplar records illustrating voltage-dependent activation of Kv1.1±Slc7a5 (20 mV interval between voltage steps). Current traces with a −30 mV step are bolded in black.
-
Figure 1—source data 1
Slc7a5 effects on voltage-dependence of activation of Kv1.1.
- https://cdn.elifesciences.org/articles/54916/elife-54916-fig1-data1-v2.xlsx
Figure 2

Kv1.1 exhibits prominent disinhibition in response to hyperpolarizing (−120 mV) voltage.
(A,B) Disinhibition of Kv1.2 (A) or Kv1.1 (B) was tested by delivering repetitive 50 ms depolarizations to +10 mV (every 2 s), with an interpulse holding voltage of −120 mV. When Kv1.2 is expressed alone, currents remain stable during this protocol (A), whereas Kv1.1 exhibits prominent recovery from Slc7a5-mediated inhibition (B). (C–F) Cell-by-cell currents before and after a hyperpolarizing pulse train to −120 mV is illustrated for indicated combinations of Kv1.1, Kv1.2, and Slc7a5 (1st pulse refers to current density of the first +10 mV depolarization, post-train refers to current density of the final +10 mV pulse). Data for Kv1.2±Slc7a5 is reproduced from Lamothe and Kurata, 2020. A prominent difference between Kv1.2 and Kv1.1 is that Kv1.1 exhibits disinhibition without a requirement for overexpression of Slc7a5 by co-transfection. Current density pre and post-train was compared using a paired t-test (* indicates p<0.05). Kv1.2 (n = 11, no statistical difference); Kv1.2 + Slc7a5 (n = 16, p=0.001); Kv1.1 (n = 11, p=0.004); Kv1.1 + Slc7a5 (n = 13, p=0.003).
-
Figure 2—source data 1
Disinhibition of Kv1.1 at hyperpolarized voltages.
- https://cdn.elifesciences.org/articles/54916/elife-54916-fig2-data1-v2.xlsx
Figure 3 with 3 supplements
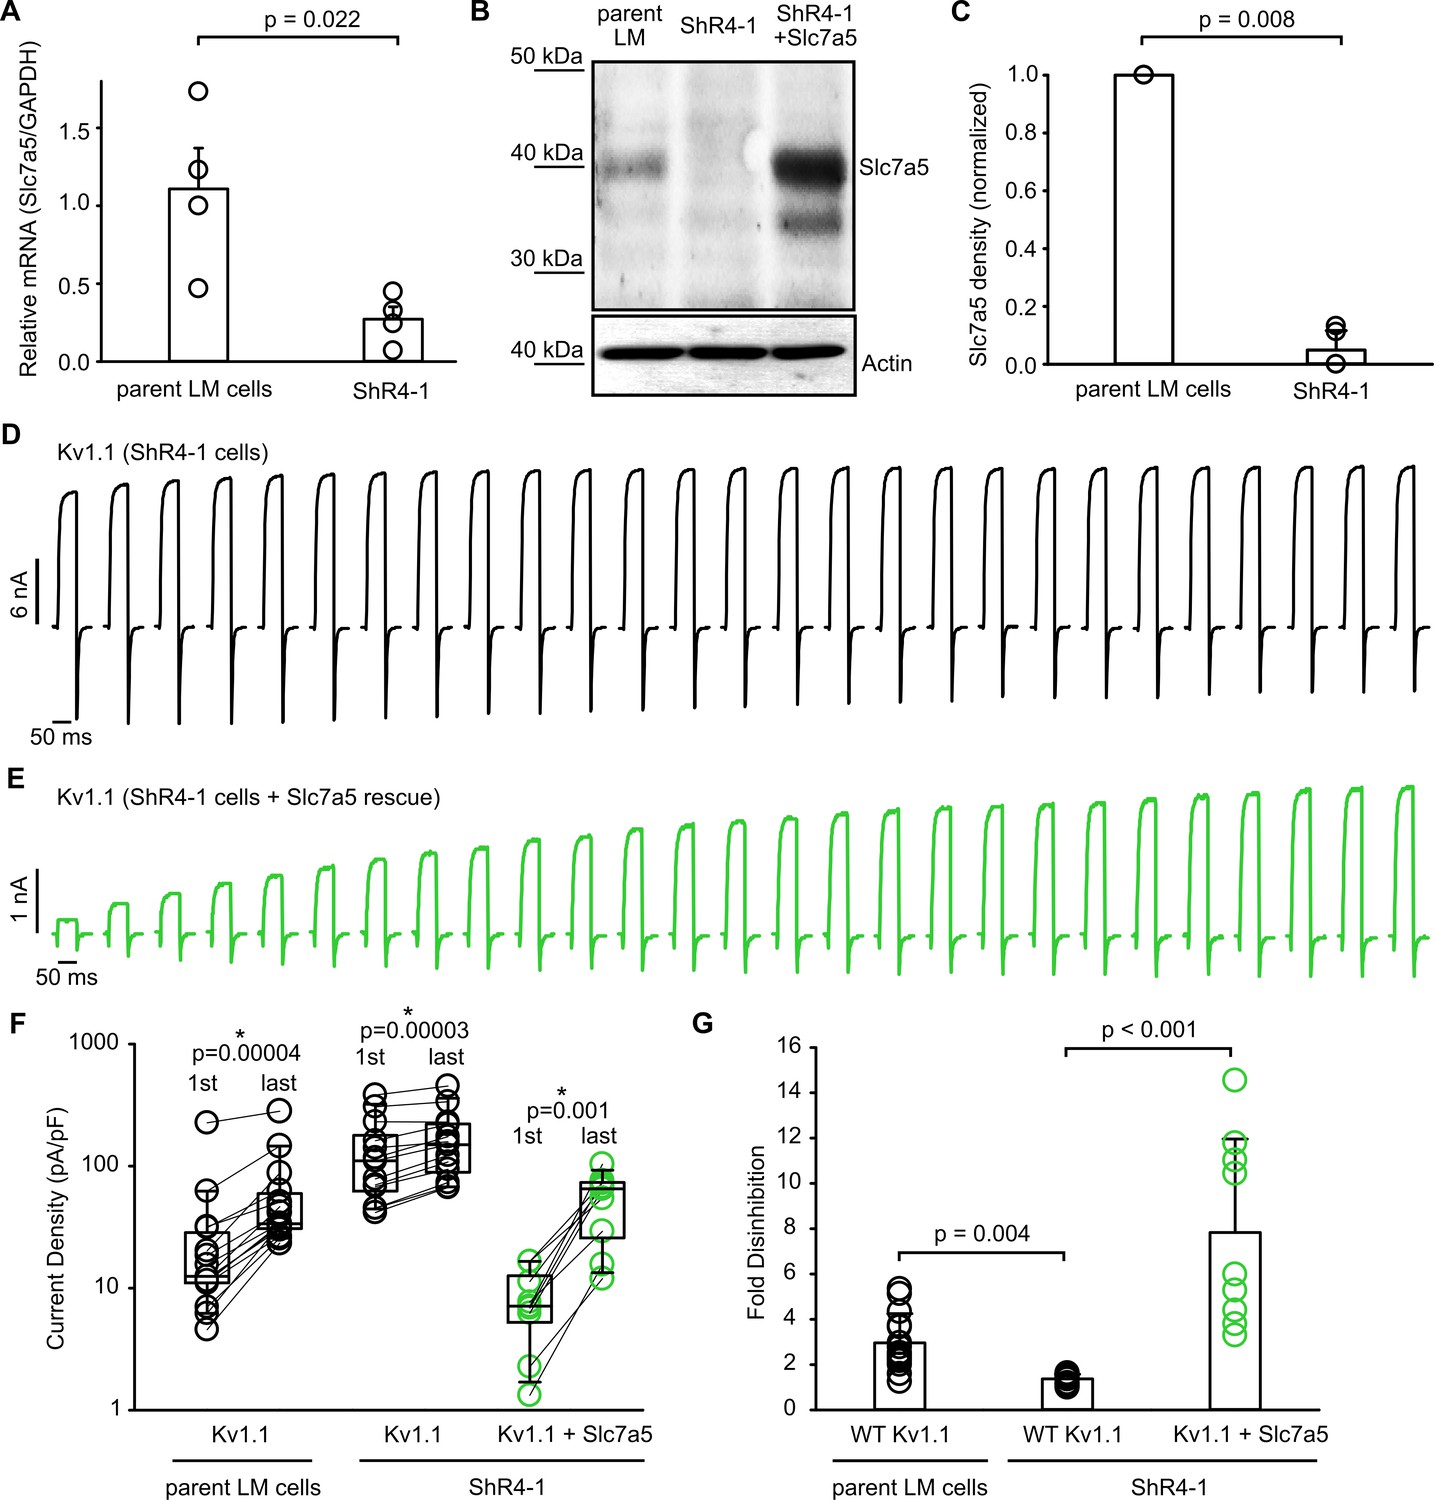
Modulation of Kv1.1 function by knockdown and rescue of Slc7a5.
(A) Quantitative real-time PCR of RNA extracted from parental mouse LM fibroblasts or ShR4-1 (Slc7a5 knockdown cell line) (n = 4, student’s t-test). (B) Western blot of endogenous Slc7a5 in parental LM cells or ShR4-1 cells. Actin was used as a loading control. (C) Densitometry measurements of Slc7a5 expression from parental and ShR4-1 cells (statistical comparison with paired t-test, n = 5). (D,E) Exemplar current records illustrating recovery from Slc7a5 inhibition of Kv1.1 during at −120 mV, as described in Figure 2, using LM or ShR4-1 cells as indicated. In panel (E), Slc7a5 expression is rescued by overexpression with a plasmid encoding human Slc7a5. (F) Cell-by-cell currents before and after the −120 mV pulse train of Kv1.1, in parental LM cells or ShR4-1 cell line (n = 9–15, statistical comparison with paired t-test between 1 st pulse and last pulse). (G) Fold disinhibition from the first to last pulses of a −120 mV pulse train of Kv1.1 in parental LM cells (mean ± S.D.; 2.96 ± 1.29), ShR4-1 cells (1.36 ± 0.20), or ShR4-1 with Slc7a5 rescue (7.83 ± 4.12)(n = 9–15, Kruskal-Wallis multiple comparisons test, Dunn’s post-hoc test).
-
Figure 3—source data 1
Modulation of Kv1.1 by endogenous Slc7a5.
- https://cdn.elifesciences.org/articles/54916/elife-54916-fig3-data1-v2.xlsx
Figure 3—figure supplement 1
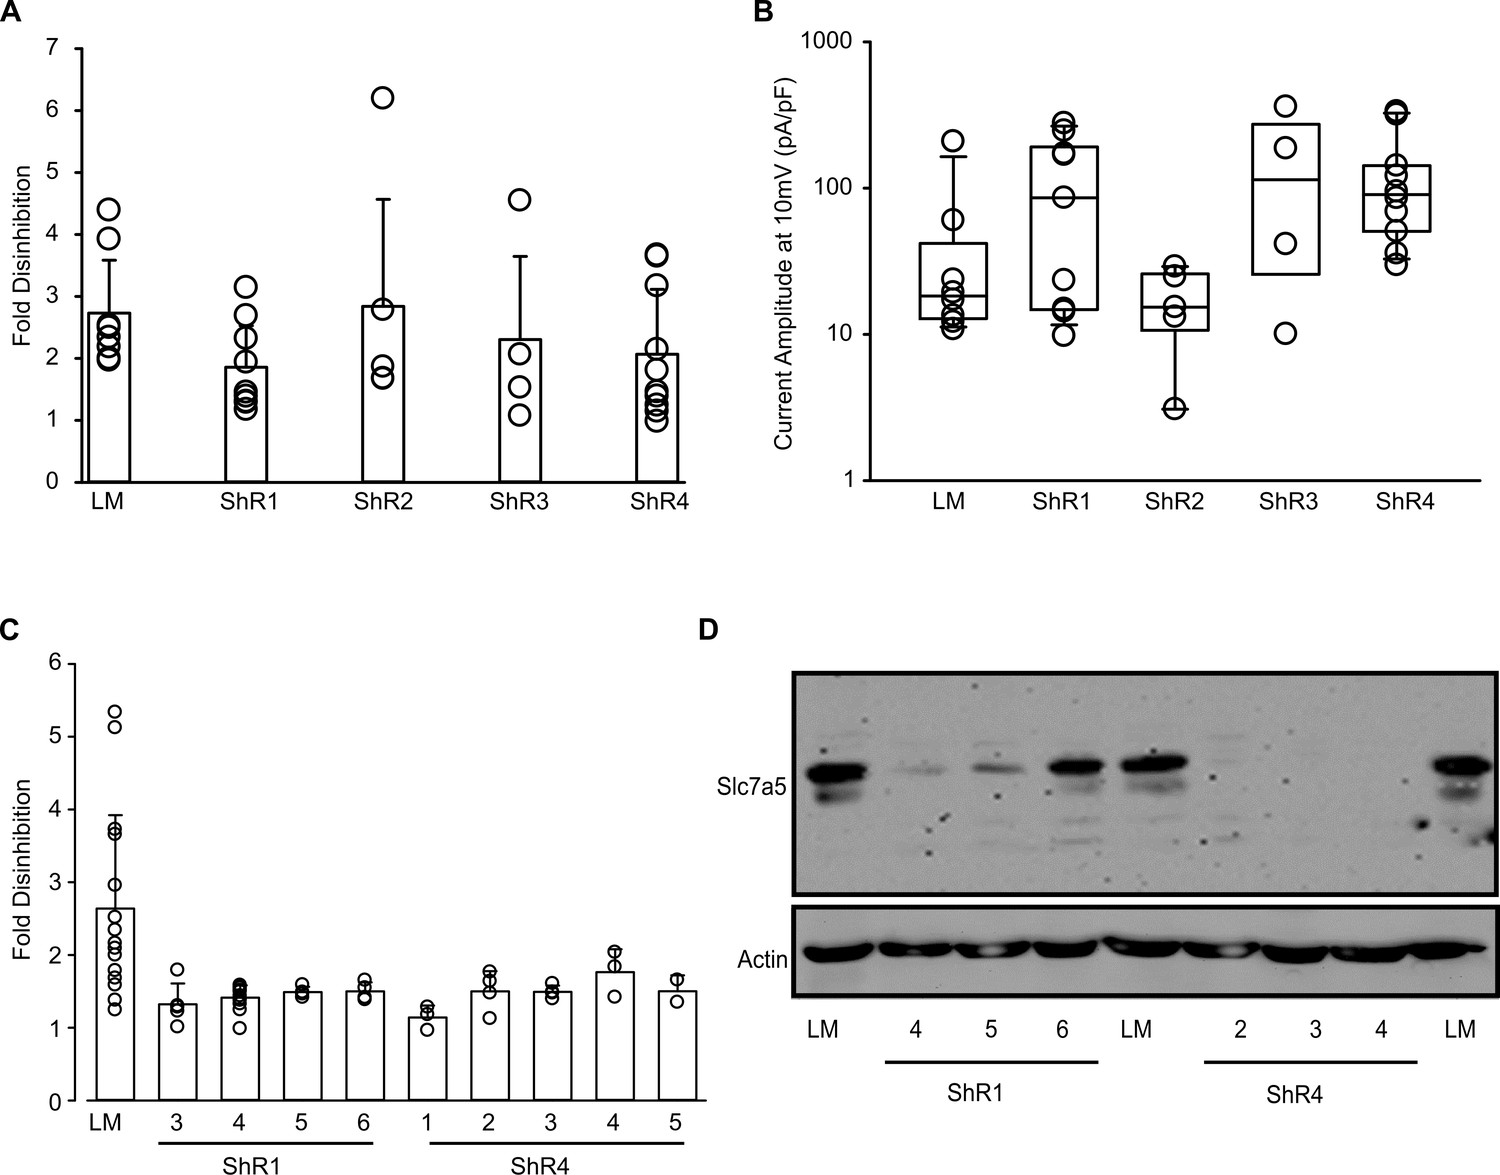
Generation of Slc7a5 knockdown cell lines.
(A,B) Multiple puromycin-resistant cell lines infected with shRNA1-4 constructs were transfected with Kv1.1 cDNA and tested for current disinhibition and current magnitude, as described in Figure 2. Fold disinhibition of Kv1.1 current between first and last pulses of a −120 mV pulse train, in LM cells and Slc7a5 shRNA cell lines mean +/- S.D.; LM (2.73 ± 0.91, n = 8), ShR1 (1.86 ± 0.71, n = 9), ShR2 (2.84 ± 1.93, n = 5), ShR3 (2.31 ± 1.55, n = 4), ShR4 (2.07 ± 1.05, n = 10). (C,D) Multiple clonal cell lines were generated by serial dilution of the ShR1 and ShR4 cell lines, and screened for disinhibition of current (C) and Slc7a5 expression by Western blot (D). Detailed characterization of the ShR4-1 cell line is described in the main text. Fol disinhibition of Kv1.1 current from the first to last pulses of a −120 mV pulse train of are: mean +/- S.D.; LM (2.63 ± 1.29, n = 15), ShR1-3 (1.32 ± 0.71, n = 5), ShR1-4 (1.41 ± 0.17, n = 12), ShR1-5 (1.49 ± 0.07, n = 4), ShR1-6 (1.49 ± 0.12, n = 4), ShR4-1 (1.14 ± 0.16, n = 3), ShR4-2 (1.50 ± 0.28, n = 4), ShR4-3 (1.49 ± 0.08, n = 4), ShR4-4 (1.76 ± 0.31, n = 3), ShR4-5 (1.50 ± 0.27, n = 2).
Figure 3—figure supplement 2
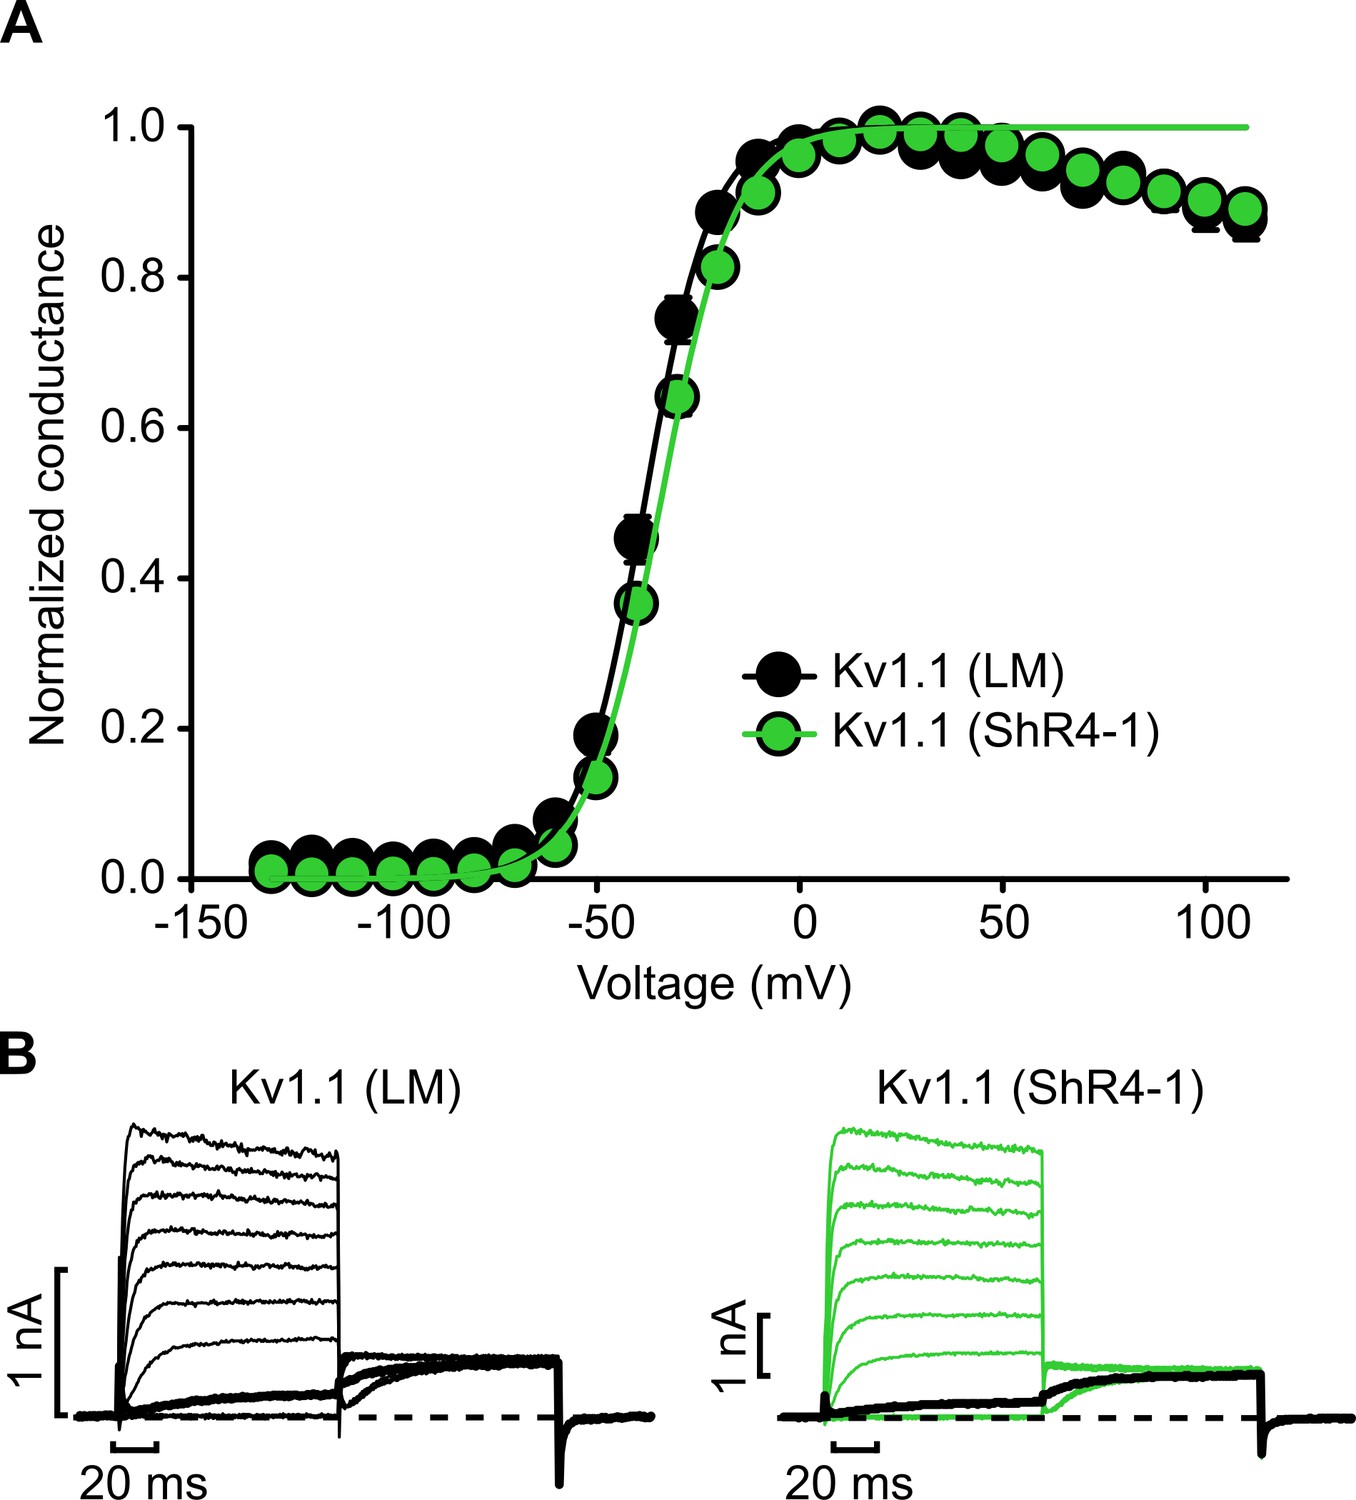
Knockdown of Slc7a5 does not alter voltage-dependent activation of Kv1.1.
(A) Conductance-voltage relationships for combinations of Kv1.1 and Slc7a5 expressed in LM mouse fibroblasts. Cells were stepped between −130 mV and +110 mV in 10 mV increments, with a tail current voltage of −20 mV. Fit parameters for Kv1.1 were: parent LM cells (V1/2 = -38.2 ± 3.3 mV; k = 8.5 ± 1.5 mV; n = 10), ShR4-1 cells (V1/2 = -34.4 ± 2.3 mV; k = 9.2 ± 1.4 mV; n = 10). No statistical difference was detected between the two conditions. (B) Exemplar records illustrating voltage-dependent activation of Kv1.1 in parental LM or ShR4-1 cells. Current traces with step voltages of −30 mV are bolded in black (steps shown in 20 mV increments).
Figure 3—figure supplement 3
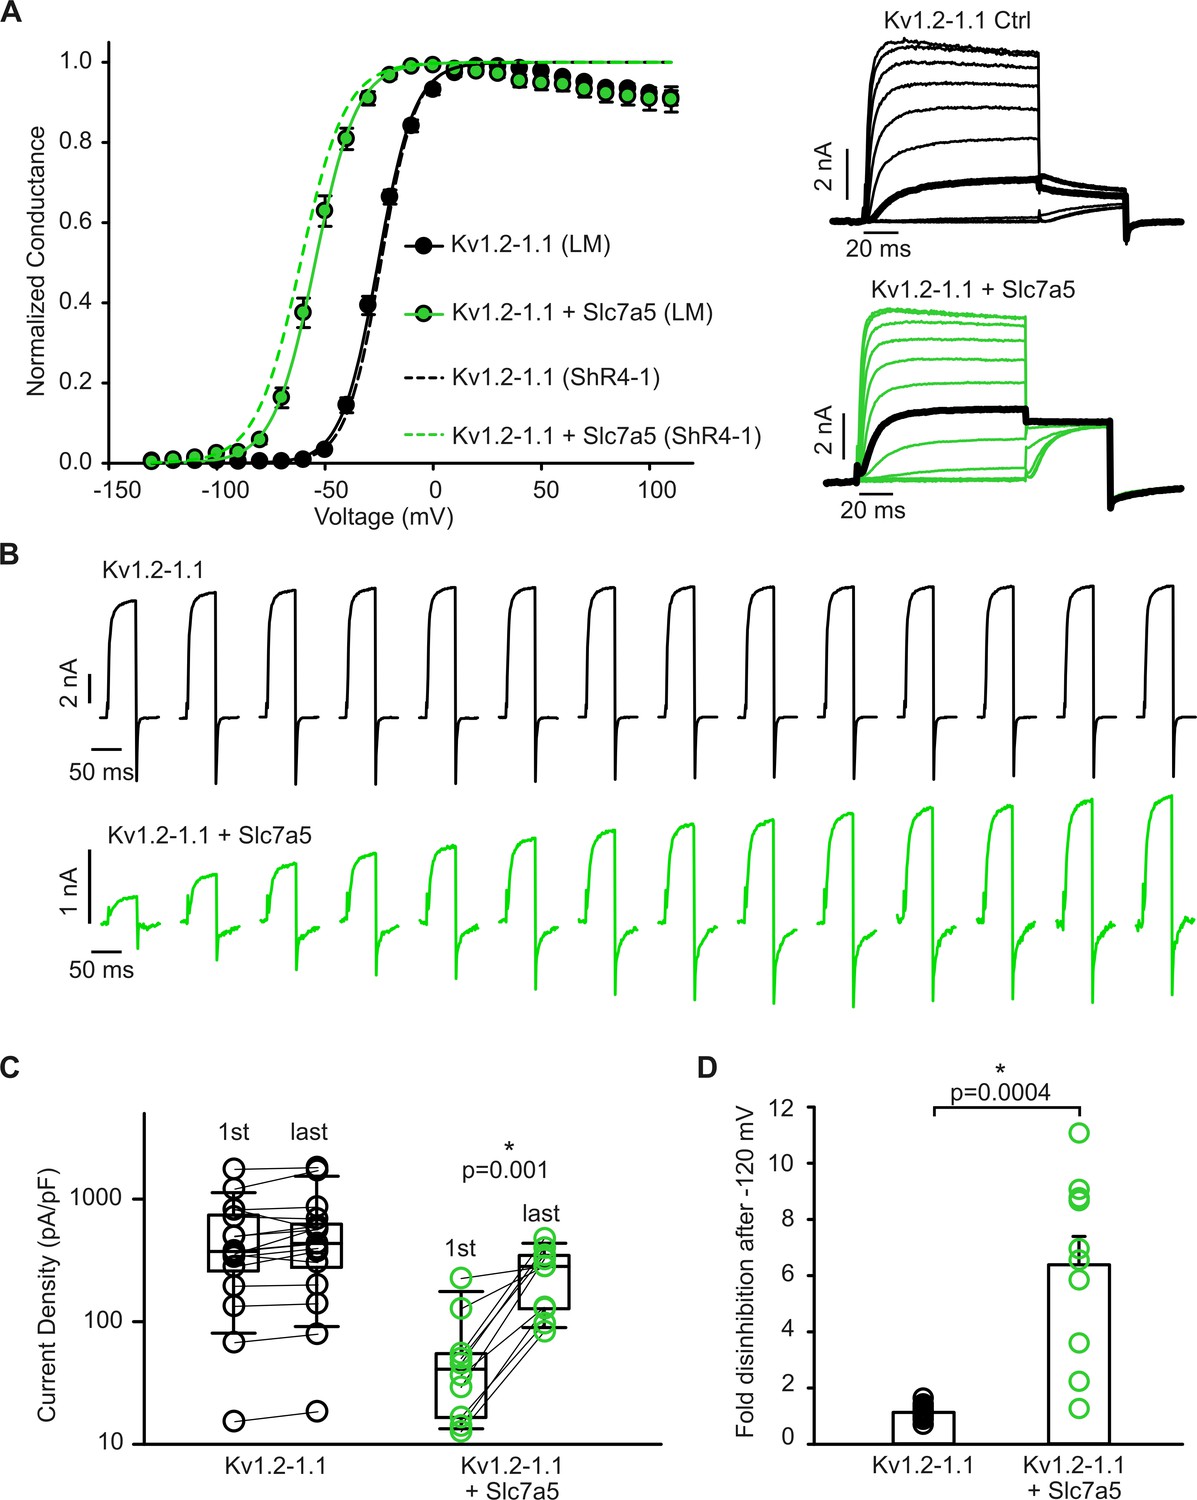
Slc7a5 suppresses current and shifts the voltage-dependence of activation of Kv1.2–1.1 heterotetramers.
(A) Conductance-voltage relationships for the indicated combinations of Kv1.2–1.1 heterotetramers and Slc7a5 expressed in LM cells or ShR4-1 cells. Cells were stepped between −130 mV and +110 mV in 10 mV increments, followed by a tail current voltage of −30 mV. Representative current traces illustrate the protocol (20 mV increments are shown, with the step to −20 mV bolded in black). Fit parameters for Kv1.2–1.1 in parental LM cells were (with +Slc7a5 in parentheses): V1/2 = -25.5 ± 2.8 mV (−54.6 ± 3.4 mV); k = 8.6 ± 1.4 mV (9.7 ± 0.8 mV). Fit parameters for Kv1.2–1.1 in ShR4-1 were (with +Slc7a5 in parentheses): V1/2 = -24.2 ± 3.3 mV (−61.3 ± 1.6 mV); k = 8.1 ± 1.1 mV (10.5 ± 1.1 mV). (B) Exemplar current records illustrating disinhibition of Kv1.2–1.1 heteromers +/- Slc7a5 during a −120 mV hyperpolarizing voltage, as described in Figure 2. (C) Cell-by-cell current density before and after a −120 mV pulse train (30 s) of Kv1.2–1.1 heteromers alone (n = 17) or co-expressed (n = 10) with human Slc7a5. (D) Fold disinhibition of Kv1.2–1.1 currents, between the first and the last pulses of the −120 mV pulse train.
Figure 4 with 1 supplement
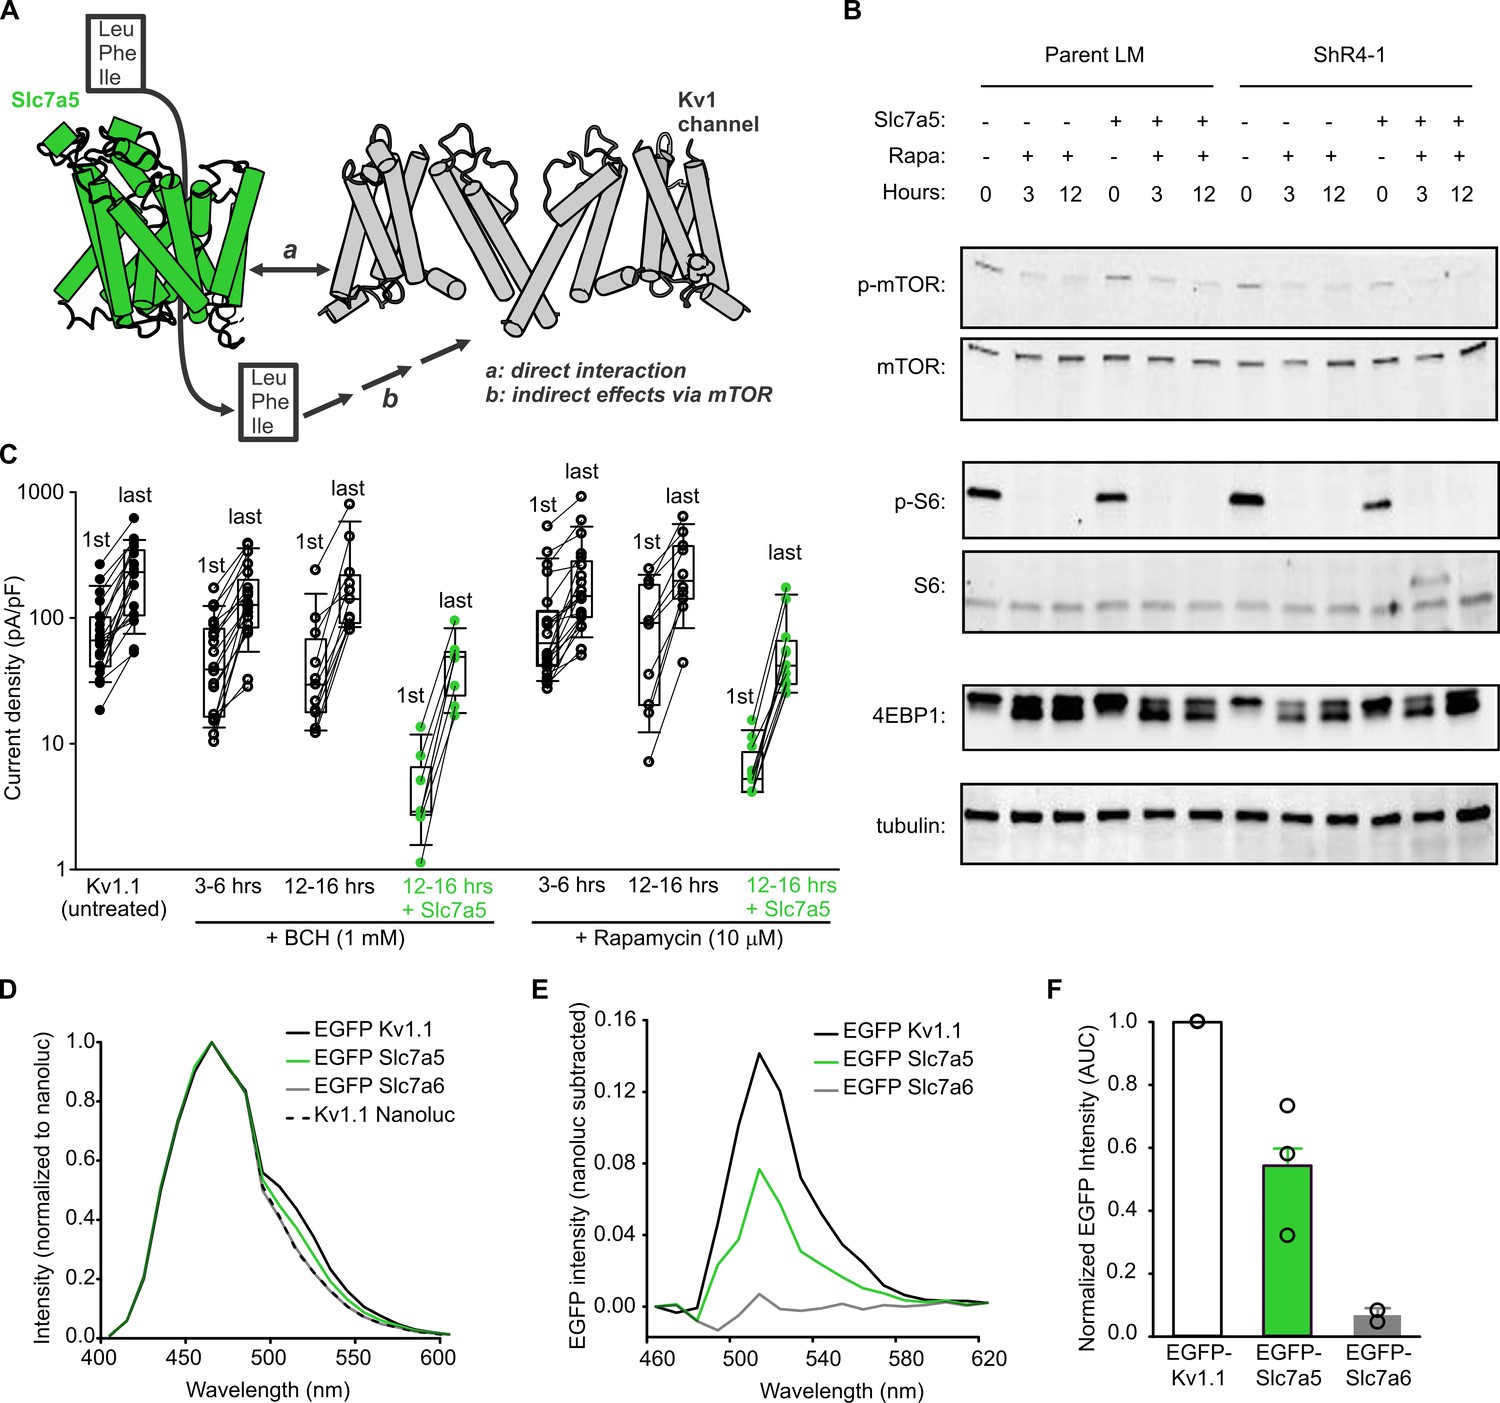
Slc7a5-mediated inhibition of Kv1.1 is resistant to suppression of the Slc7a5-mTORC1 signaling axis.
(A) Schematic model depicting distinct possibilities for Slc7a5 modulation of Kv1 channels via (a) direct interaction or (b) indirect effects arising from amino acid activation of mTOR. (B) Western blot detection of markers of mTOR activation, including total mTOR, phospho-mTOR, total S6, phospho-S6, total 4EBP, in parental LM or ShR4-1 cells treated with 10 µM rapamycin (Rapa) and/or Slc7a5 overexpression, as indicated. β-tubulin was used as a loading control. (C) Cell by cell current density before and after a −120 mV pulse train (30 s) is illustrated for Kv1.1 channels ± Slc7a5 (LM cells) treated with 1 mM BCH, or 10 µM rapamycin as indicated. (D) Emission spectra were collected from LM cells transfected with indicated combinations of Kv1.1-nanoluc, EGFP-Kv1.1, EGFP-Slc7a5, or EGFP-Slc7a6. (E) EGFP spectra (nanoluc-subtracted) were measured for the indicated EGFP-tagged acceptors co-expressed with Kv1.1-nanoluc. (F) Area under the curve (AUC) for each BRET acceptor in (E) was normalized to the positive control AUC (Kv1.1-nanoluc + EGFP-Kv1.1).
-
Figure 4—source data 1
Rapamycin and BCH effects on Slc7a5 modulation of Kv1.1.
- https://cdn.elifesciences.org/articles/54916/elife-54916-fig4-data1-v2.xlsx
Figure 4—figure supplement 1
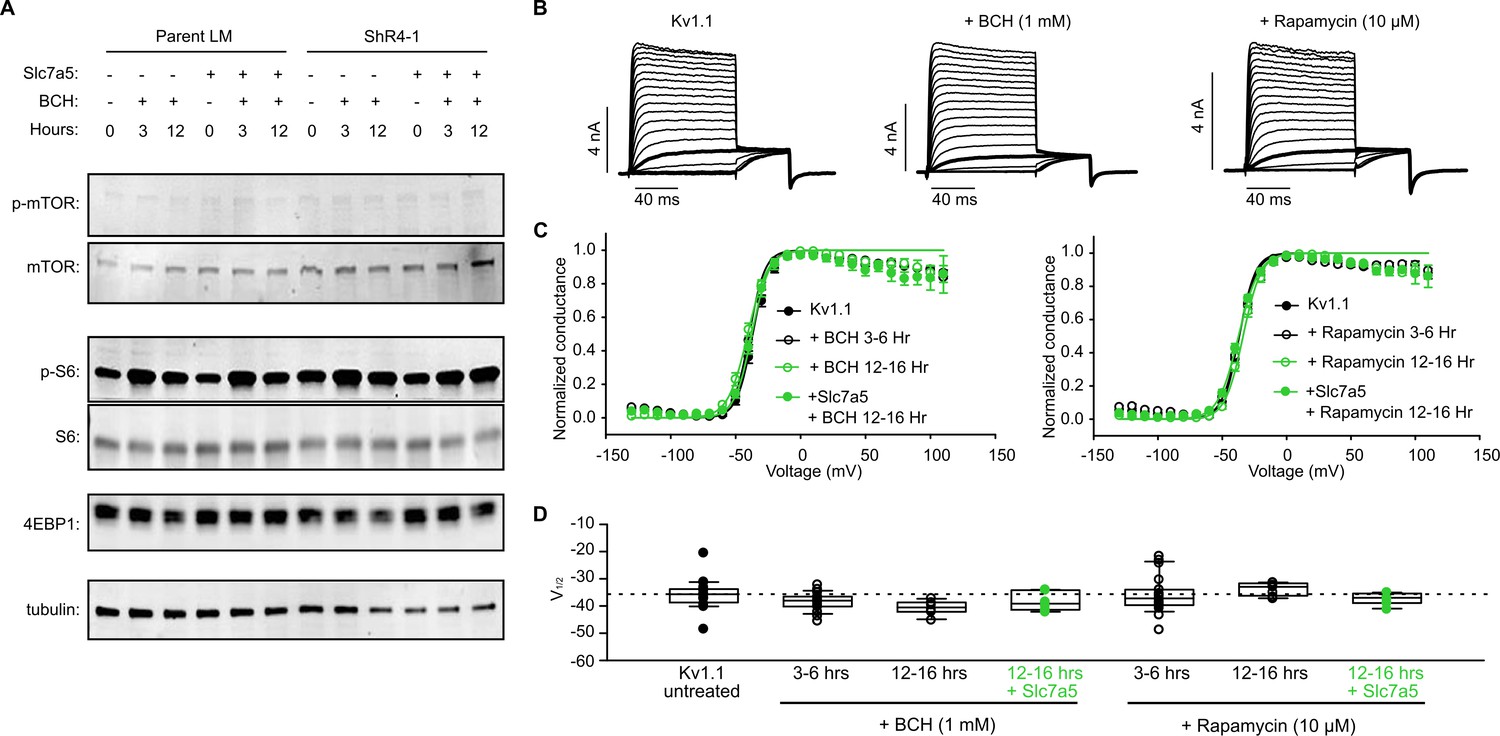
Slc7a5 or mTORC1 inhibition does not influence voltage-dependent gating of Kv1.1.
(A) Western blot detection of markers of mTOR activation, including total mTOR, phospho-mTOR, total S6, phospho-S6, total 4EBP, in parental LM or ShR4-1 cells treated with 1 mM BCH and/or Slc7a5 overexpression, as indicated. β-tubulin was used as a loading control. (B) Exemplar records illustrating voltage-dependent activation of Kv1.1 + 1 mM BCH or 10 µM rapamycin. (C) Conductance-voltage relationships plots for Kv1.1 (parental LM) with 1 mM BCH (left), or 10 µM rapamycin (right) as indicated. Fit parameters were as follows: WT Kv1.1, V1/2 = -36.8 ± 1.2 mV; k = 5.6 ± 0.2 mV; n = 19; for Kv1.1 + BCH (3–6 hr), V1/2 = -39.5 ± 0.7 mV; k = 5.7 ± 0.4 mV; n = 20; Kv1.1 + (BCH 12–16 hr), V1/2 = -33.9 ± 0.9 mV; k = 7.2 ± 1.6 mV; n = 7; Kv1.1+ Slc7a5 + BCH (12–16 hr), V1/2 = -37.4 ± 2.3 mV; k = 8.0 ± 1.3 mV; n = 8; Kv1.1 + Rapamycin (3–6 hr), V1/2 = -36.9 ± 1.5 mV; k = 6.6 ± 0.5 mV; n = 20; Kv1.1 + Rapamycin (12–16 hr), V1/2 = -40.7 ± 1.2 mV; k = 7.9 ± 1.5 mV; n = 6; Kv1.1 + Slc7a5 + Rapamycin (12–16 hr): V1/2 = -37.6 ± 1.4 mV; k = 6.9 ± 1.4 mV; n = 7; (D) V1/2 of individual cells from data in panel C. V1/2 of untreated Kv1.1 is highlighted with a dotted line for reference.
Figure 5 with 1 supplement
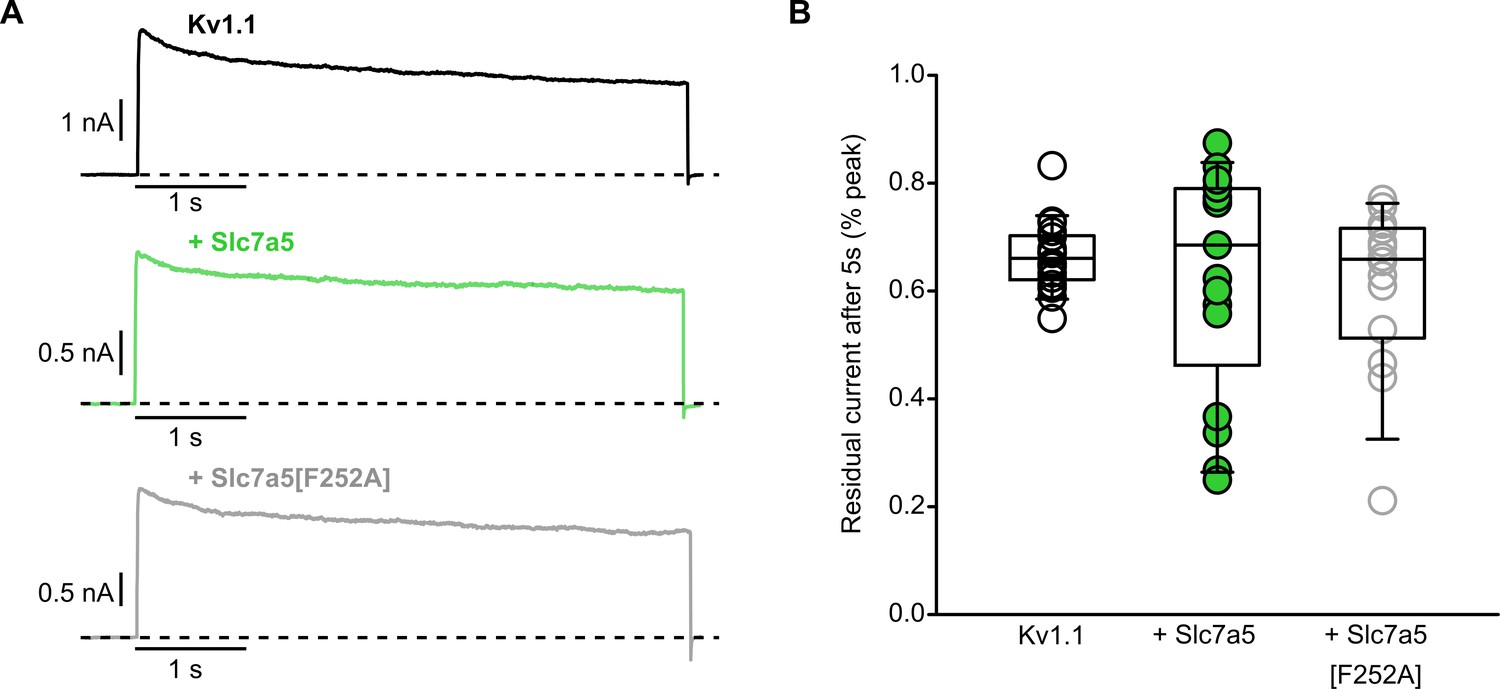
Slc7a5 does not accelerate WT Kv1.1 inactivation.
(A) WT Kv1.1 channels were expressed in mouse LM cells with Slc7a5 or Slc7a5[F252A], as indicated. Exemplar current traces illustrate inactivation elicited by depolarization to 40 mV for 5 s (−80 mV holding potential). Prior to this long depolarization, currents have been disinhibited with a −120 mV holding voltage, as described in Figure 2. (B) Cell-by-cell inactivation of WT Kv1.1±Slc7a5 and Slc7a5[F252A]. Current amplitude after 5 s was normalized to peak current (% of peak) on a cell-by-cell basis. No statistical difference was detected in the % residual current between all three groups.
-
Figure 5—source data 1
Modulation of Kv1.1 inactivation by Slc7a5.
- https://cdn.elifesciences.org/articles/54916/elife-54916-fig5-data1-v2.xlsx
Figure 5—figure supplement 1
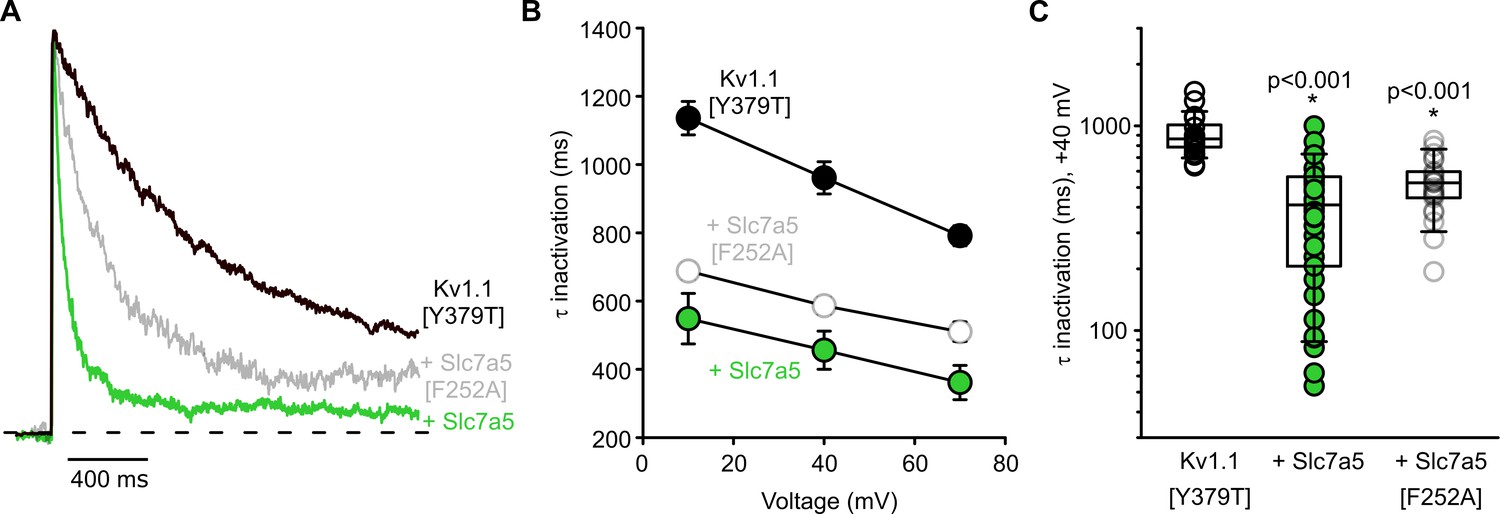
Slc7a5 enhances inactivation of Kv1.1[Y379T] channels.
(A) Kv1.1[Y379T] channels were expressed in mouse LM fibroblasts with Slc7a5 or Slc7a5[F252A], as indicated. Exemplar traces illustrate currents elicited by depolarization to +40 mV from a holding potential of −100 mV. Prior to this experiment, currents have been disinhibited with a holding voltage of −120 mV, as described in Figure 2. (B) Mean time constant of inactivation for Kv1.1±Slc7a5 or Slc7a5[F252A], over a range of voltages (+10 mV, +40 mV and +70 mV). (C) Time constants of inactivation of Kv1.1 at +40 mV ±Slc7a5 or Slc7a5[F252A] (Kv1.1 τ = 960 ± 50 ms, n = 17; Kv1.1 + Slc7a5 τ = 460 ± 60 ms, n = 19, Kv1.1 + Slc7a5[F252A] τ = 586 ± 23 ms). Inactivation time constants were compared with a Kruskal-Wallis followed by Dunn’s post-hoc tests (* indicates p<0.001 relative to Kv1.1[Y379T]).
Figure 6 with 1 supplement

Distinct recovery from Slc7a5 inhibition versus inactivation of Kv1.1.
(A) Exemplar patch clamp recordings of Kv1.1 and Slc7a5 combinations as indicated, in ShR4-1 cells. Left panel illustrates recovery from Slc7a5 inhibition. Currents were recorded at 10 mV after break-in, after 30 s at −80 mV holding voltage, and after 30 s at −120 mV. Right panel illustrates recovery from inactivation (measured after the recovery from Slc7a5 inhibition shown in the left panel). Cells were depolarized to 40 mV for 5 s, held at a −80 mV recovery potential (25 s) followed by a 2nd pulse to 40 mV. (B) Cell-by-cell changes in current density (at +10 mV) in response to recovery from Slc7a5 (depicted in panel A, left). Currents were measured where indicated by a, b, c, in panel A (Kv1.1, n = 11; Kv1.1 + Slc7a5, n = 11; Kv1.1 + Slc7a5[F252A], n = 17). (C) Cell-by-cell changes in peak current density in response to recovery from inactivation (depicted in panel A, right). Currents were measured where indicated by d, e, in panel A (Kv1.1, n = 14; Kv1.1 + Slc7a5, n = 15; Kv1.1 + Slc7a5[F252A], n = 17). (D) Percentage of peak current achieved during the −80 mV disinhibition protocol (calculated as b/c in panel A) versus the −80 mV recovery from inactivation protocol (calculated as e/d). See Figure supplement for additional details on Kv1.1[Y379T].
-
Figure 6—source data 1
Distinct voltage-dependence of recovery from inactivation versus Slc7a5-mediated inhibition.
- https://cdn.elifesciences.org/articles/54916/elife-54916-fig6-data1-v2.xlsx
Figure 6—figure supplement 1
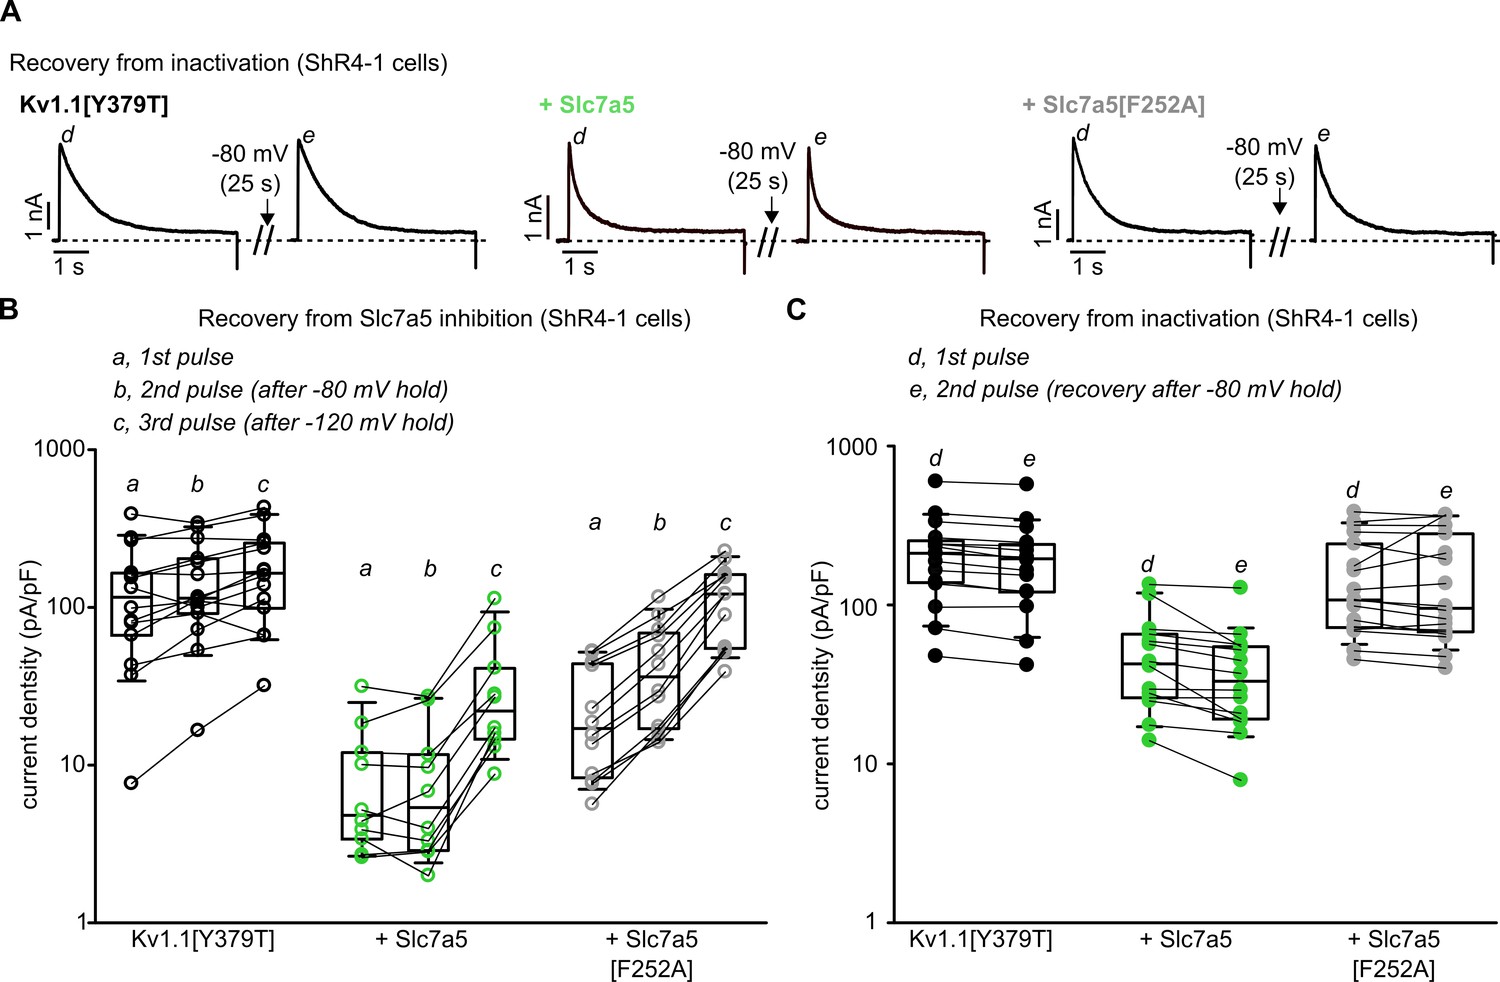
Distinct recovery from Slc7a5 inhibition versus inactivation of Kv1.1[Y379T].
(A) Exemplar patch clamp traces of Kv1.1[Y379T] and Slc7a5 combinations as indicated, expressed in ShR4-1 cells. Traces depict recovery from inactivation by delivering a 40 mV pulse for 5 s, a −80 mV recovery potential for 25 s, followed by a 2nd pulse to 40 mV. (B) Cell-by-cell changes in current density (at +10 mV) in response to recovery from Slc7a5 (depicted in panel A, left). Currents were measured where indicated by a, b, c, in Figure 6, panel A (Kv1.1[Y379T], n = 14; Kv1.1[Y379T] + Slc7a5, n = 10; Kv1.1[Y379T] + Slc7a5[F252A], n = 12). (C) Cell-by-cell changes in peak current density in response to recovery from inactivation (depicted in panel A, right). Currents were measured where indicated by d, e, in Figure 6, panel A (Kv1.1[Y379T], n = 16; Kv1.1[Y379T] + Slc7a5, n = 15; Kv1.1[Y379T] + Slc7a5[F252A], n = 17).
Figure 7 with 2 supplements
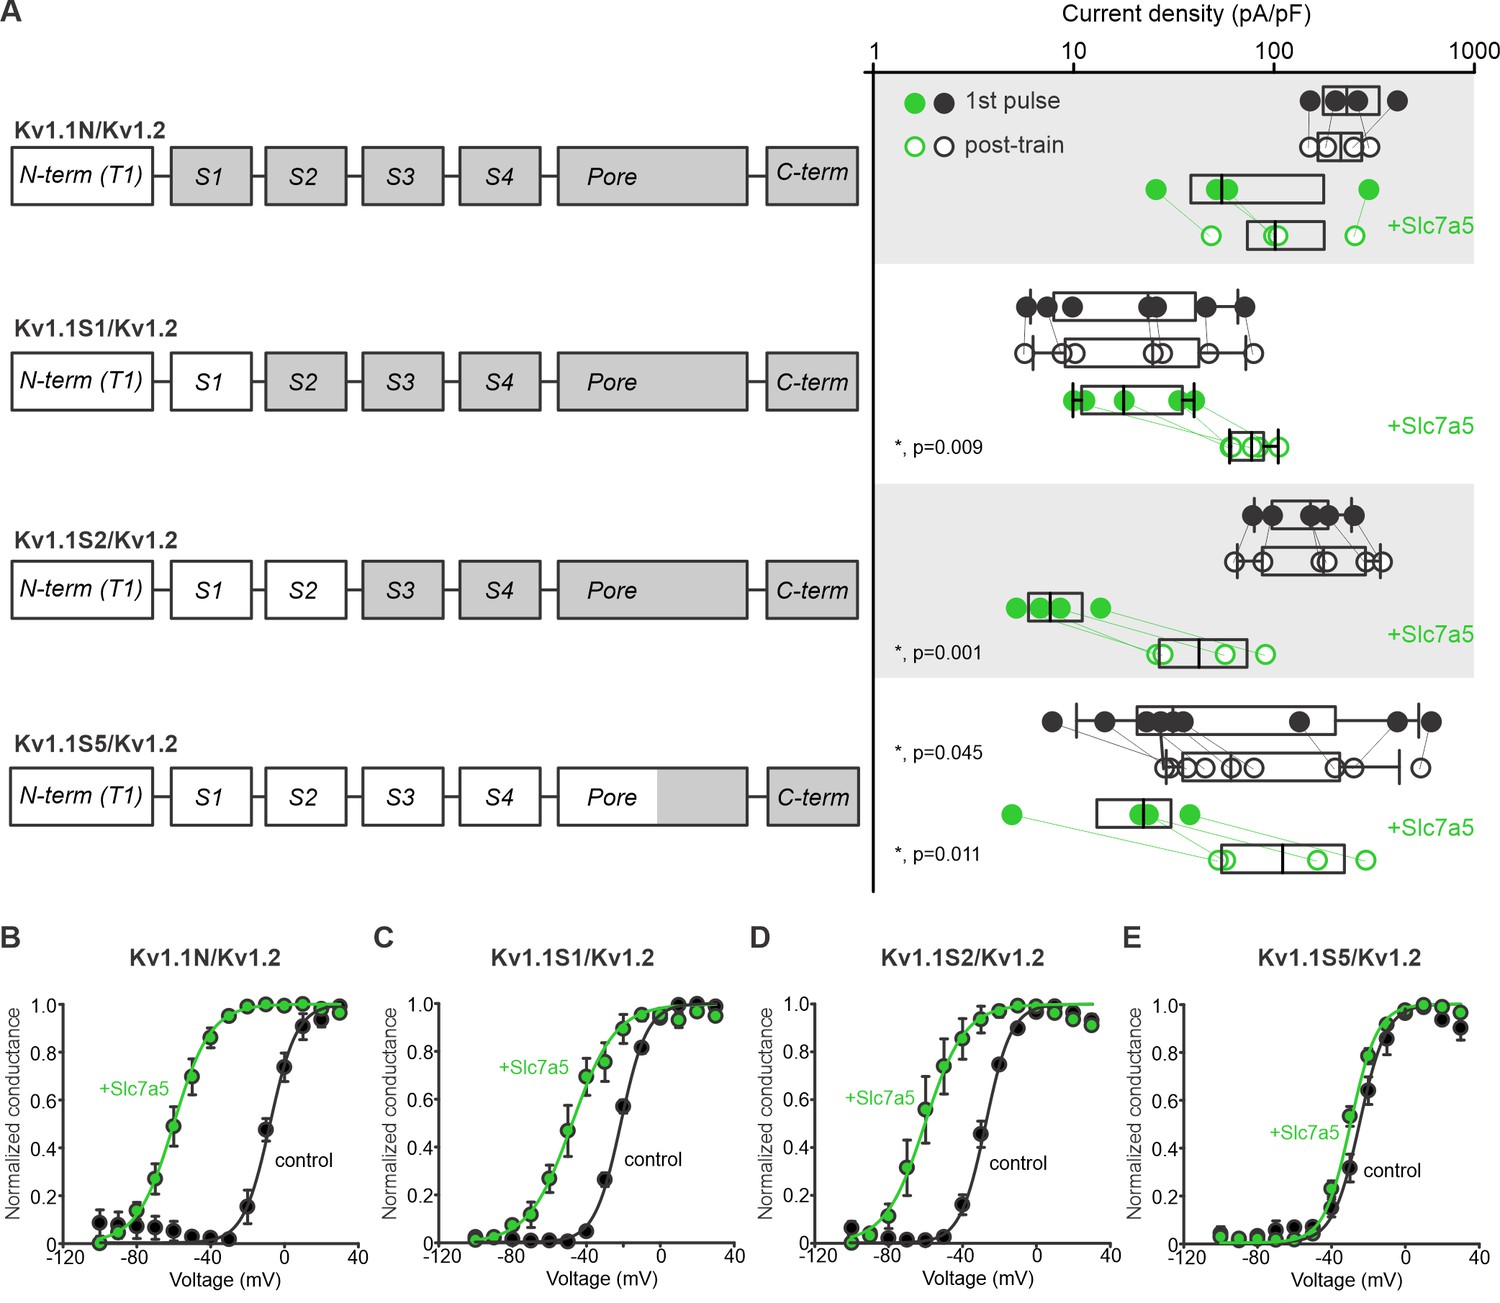
Chimeric analysis of Kv1.1 and Kv1.2 sensitivity to Slc7a5-mediated disinhibition and shifts of voltage-dependent activation.
(A) Cartoons illustrate chimeric channel design, in which increasing segments of Kv1.1 (white) were introduced into Kv1.2 (grey), beginning with the N-terminus. Current disinhibition by a hyperpolarizing train to −120 mV was assessed as described in Figure 2, in the presence or absence of Slc7a5. (B–E) Conductance-voltage relationships were measured for all chimeric channels, in the presence and absence of Slc7a5. Gating parameters (+Slc7a5 in parentheses) for Kv1.1N/Kv1.2 were: V1/2 = -8.7 ± 2 mV (−61 ± 3 mV); k = 7 ± 1 mV (8.3 ± 0.5 mV); for Kv1.1S1/Kv1.2: V1/2 = -21.5 ± 0.7 mV (−42 ± 6 mV); k = 7.1 ± 0.2 mV (9 ± 1 mV), for Kv1.1S2/Kv1.2: V1/2 = -30.1 ± 0.4 mV (−53 ± 8 mV); k = 7.4 ± 0.2 mV (8.2 ± 0.4 mV), and for Kv1.1S5/Kv1.2: V1/2 = −25 ± 2 mV (−30 ± 2 mV); k = 7.4 ± 0.3 mV (7.2 ± 0.3 mV). Prominent shifts in voltage-dependent gating were observed in all chimeras except the Kv1.1S5/Kv1.2, comprising primarily the transmembrane domains of Kv1.1.
-
Figure 7—source data 1
Voltage sensor modulation of Slc7a5 sensitivity of Kv1.1 and Kv1.2.
- https://cdn.elifesciences.org/articles/54916/elife-54916-fig7-data1-v2.xlsx
Figure 7—figure supplement 1
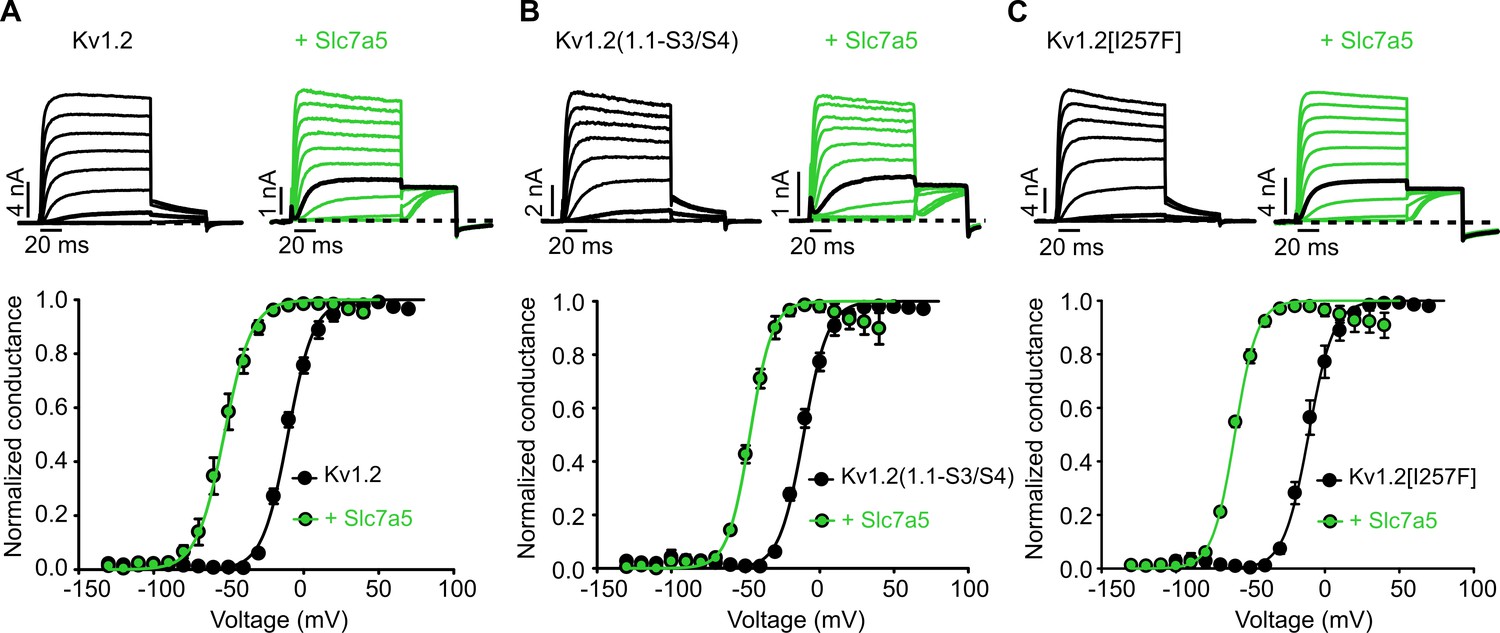
Slc7a5-mediated gating shift is preserved in I257 or S3-S4 linker mutants of Kv1.2.
(A–C) Conductance-voltage relationships of WT Kv1.2 (A), Kv1.2(1.1-S3/S4) (residues 274–288 of the S3-S4 linker replaced with corresponding sequence from Kv1.1)(B), and Kv1.2[I257F] (C), with Slc7a5 as indicated. Data were collected using the voltage protocol described in Figure 1. Exemplar traces for each construct in the presence (black) or absence of Slc7a5 (green) are included above each graph 20 mV increments are shown voltage step to −20 mV is bolded in black. Gating parameters were (+ Slc7a5 in parentheses): for Kv1.2, V1/2 = -9.9 ± 2.7 mV (−50.6 ± 4.0 mV); k = 9.4 ± 2.2 mV (9.5 ± 1.8 mV); for Kv1.2(1.1-S3/S4), V1/2 = -10.9 ± 3 mV (−47.8 ± 2.6 mV); k = 8.7 ± 2.5 mV (7.4 ± 1.6 mV); for Kv1.2[I257F], V1/2 = -10.8 ± 3.2 mV (−61.1 ± 3.0 mV); k = 8.0 ± 2.0 mV (7.4 ± 1.0 mV).
Figure 7—figure supplement 2
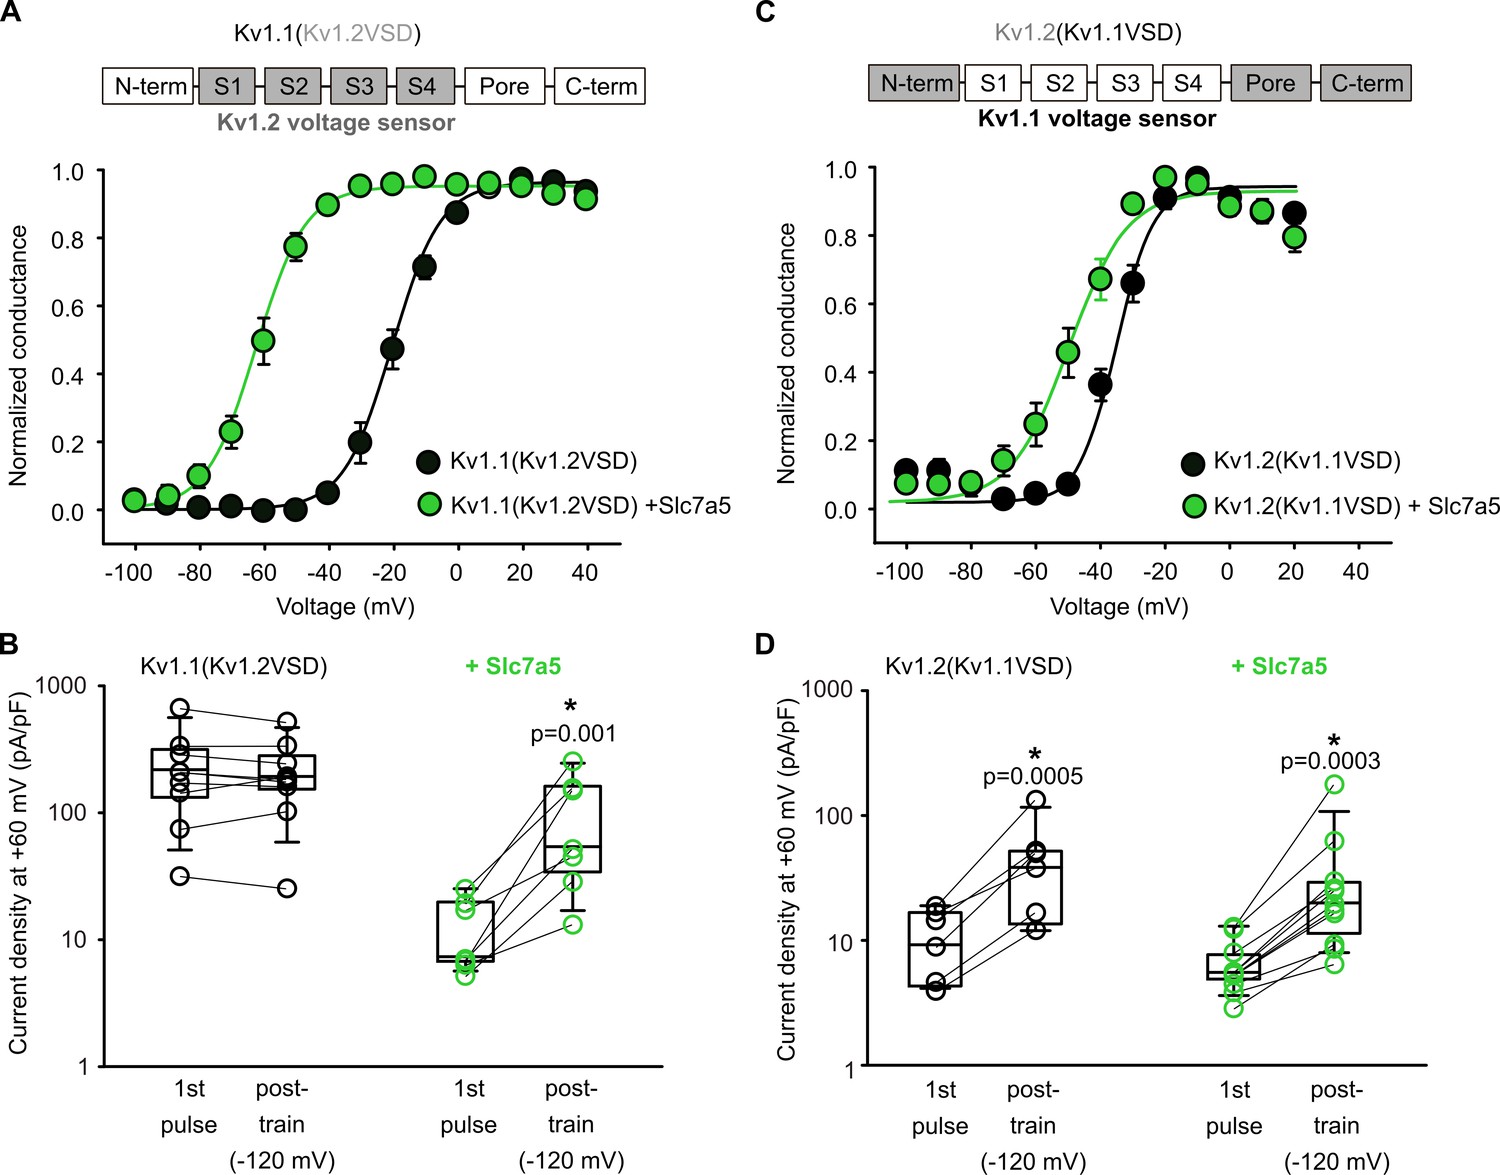
The voltage-sensing domain influences Slc7a5 sensitivity and response.
(A,C) Top: Chimera design is shown with the voltage-sensing domains of Kv1.1 (white) and Kv1.2 (grey) switched as indicated. Gating parameters for the resulting chimeras were (+Slc7a5 in parentheses), for Kv1.1(Kv1.2VSD): V1/2 = -19.7 ± 2 mV (−62 ± 2 mV); k = 7.5 ± 0.5 mV (7.7 ± 0.9 mV); for Kv1.2(Kv1.1VSD): V1/2 = −37 ± 2 mV (−53 ± 3 mV); k = 5.5 ± 0.4 mV (7.6 ± 0.9 mV). (B,D) Disinhibition of both chimeras was measured in the presence and absence of Slc7a5, in response to a −120 mV hyperpolarizing train, as described in Figure 2. Current densities pre- and post-train were compared using a paired t-test (* indicates p<0.05). Fold disinhibition of Kv1.1(Kv1.2VSD) was 1 ± 0.1 (n = 9, no statistical difference), and with Slc7a5 was 8 ± 3 (n = 7, p=0.034). Fold disinhibition of Kv1.2(Kv1.1VSD) was 4.1 ± 0.8 (n = 6, p=0.0005), and with Slc7a5 was 4.3 ± 0.9 (n = 11, p=0.0003).
Figure 8 with 2 supplements
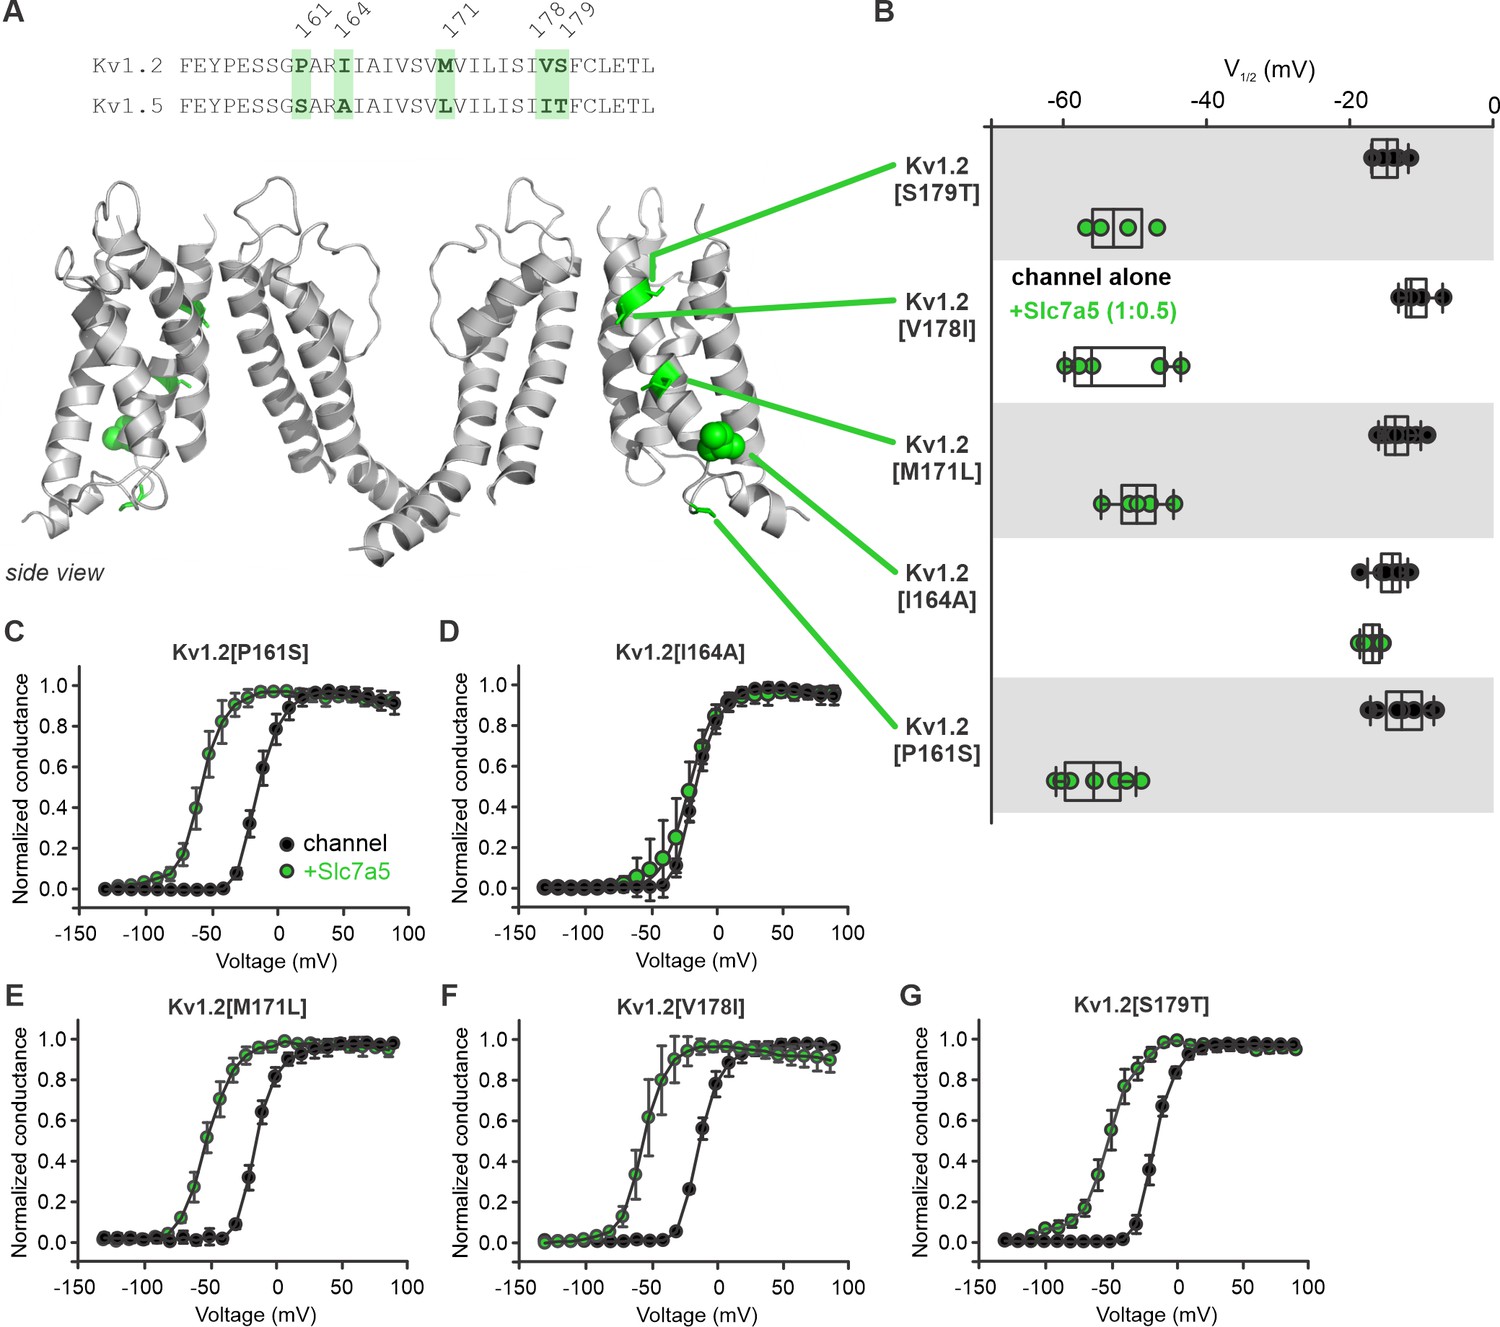
Amino acid residue I164 influences Kv1.2 sensitivity to Slc7a5 modulation.
(A) Top, amino acid sequence comparison of the S1 domain between Kv1.2 and Kv1.5. Different amino acid residues between the two channels are highlighted in green. Bottom, Schematic model (side view) of the Kv1.2 channel with dissimilar amino acids from Kv1.5 highlighted in green. (B) Voltage at half activation (V1/2) plots of individual cells of Kv1.2 point mutants in the S1 domain substituted with the corresponding amino acid in Kv1.5. The Kv1.2 point mutants were recorded and analyzed in the presence or absence of Slc7a5. (C–G) Conductance-voltage relationships of the Kv1.2 point mutants were measured in the presence or absence of Slc7a5. Fit parameters were (mean ± S.D., Slc7a5 in parentheses): P161S, V1/2 = -12.6 ± 3.0 mV (−55.7 ± 4.4 mV), k = 8.7 ± 1.4 mV (10 ± 2.5 mV); I164A, V1/2 = -14.4 ± 2.1 mV (−16.9 ± 1.2 mV), k = 8.4 ± 1.3 mV (11.0 ± 3.9 mV); M171L, V1/2 = -8.6 ± 2.1 mV (−49.5 ± 3.7 mV), k = 8.7 ± 1.4 mV (10.8 ± 1.2 mV); V178I, V1/2 = -8.9 ± 2.3 mV (−52.8 ± 7.2 mV), k = 8.8 ± 1.8 mV (9.2 ± 2.6 mV); S179T, V1/2 = -11.9 ± 2.0 mV (−52.5 ± 4.4 mV), k = 7.8 ± 0.5 mV (−11.9 ± 0.2 mV).
-
Figure 8—source data 1
Voltage sensor modulation of Slc7a5 sensitivity of Kv1.2 and Kv1.5.
- https://cdn.elifesciences.org/articles/54916/elife-54916-fig8-data1-v2.xlsx
Figure 8—figure supplement 1
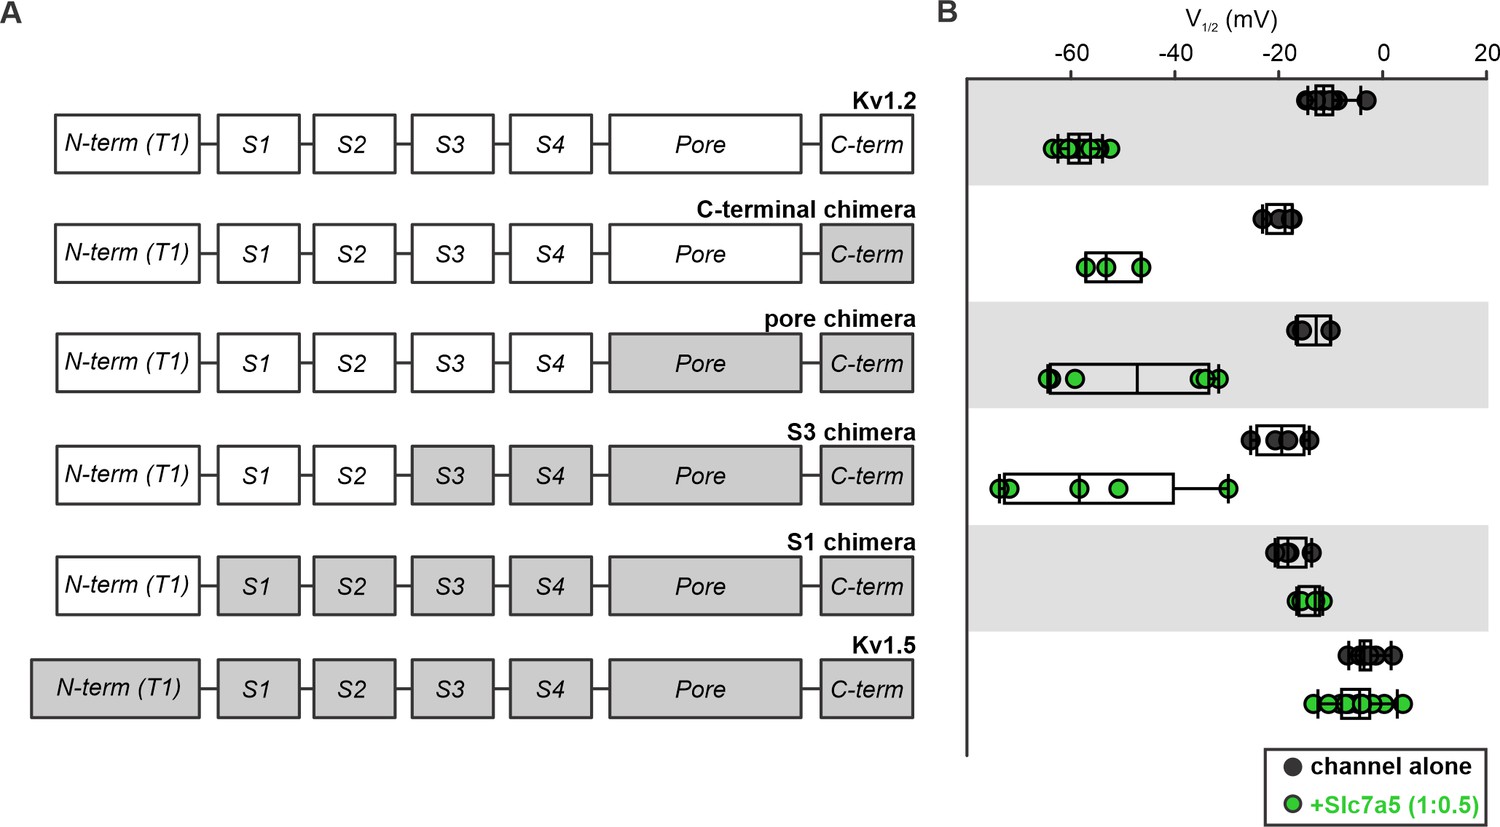
Chimeric analysis of Kv1.5 and Kv1.2 sensitivity to Slc7a5-mediated shifts of voltage-dependent activation.
(A) Cartoons illustrate chimeric channel design, with segments of Kv1.5 (grey) introduced into Kv1.2 (white), beginning with the C-terminus. (B) Voltage at half activation (V1/2) of individual cells, for all chimeric channels, in the presence and absence of Slc7a5 (channel:Slc7a5 ratio; 1:0.5).
Figure 8—figure supplement 2
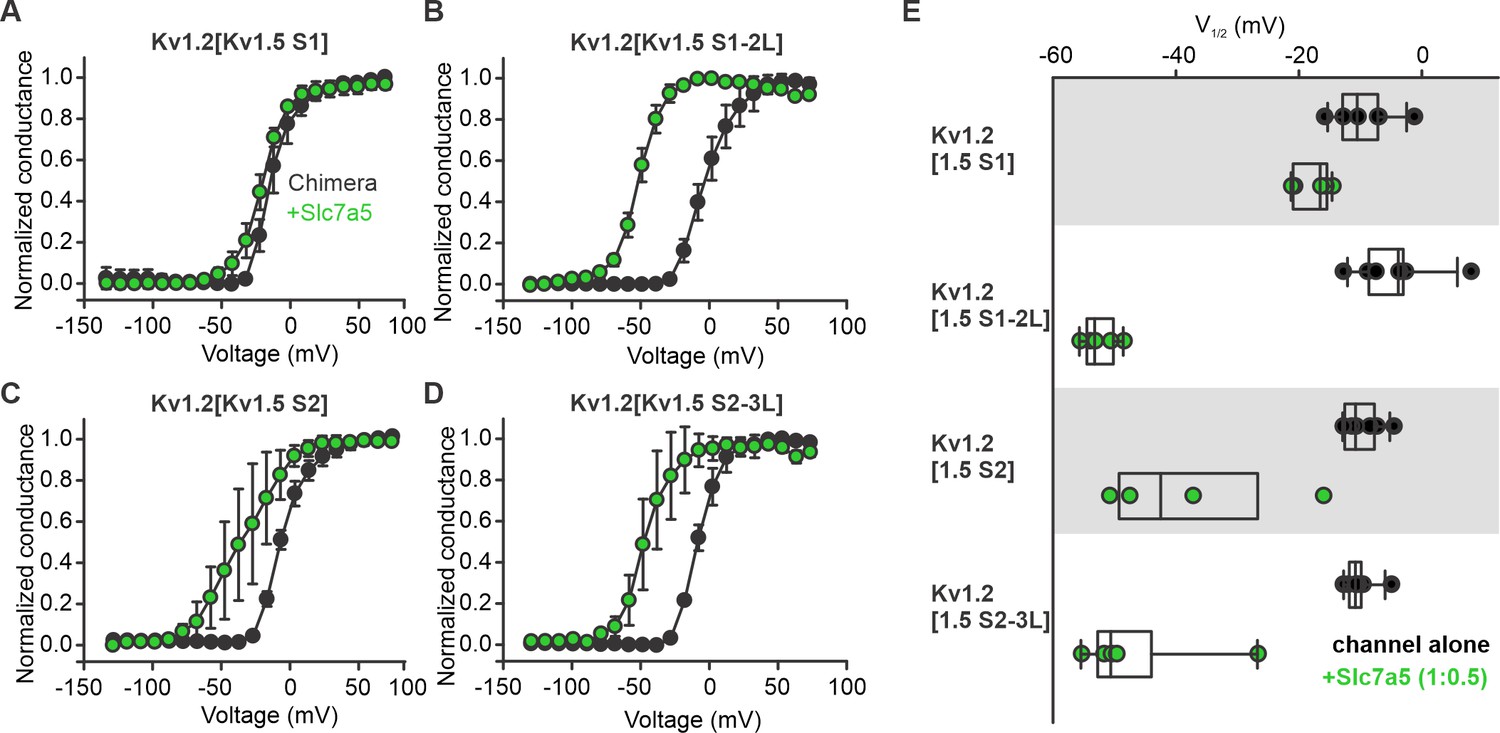
Kv1.2 sensitivity to Slc7a5 is localized to the S1 transmembrane segment.
(A–D) Conductance-voltage relationships of Kv1.2 chimeras with the S1 segment (A), S1-S2 linker (B), S2 segment (C), and S2-S3 linker of Kv1.5. Chimeras were transfected in the absence or presence of Slc7a5 (channel:slc7a5 ratio; 1:0.5). (E) Voltage at half activation (V1/2) of individual cells for all chimeric channels, in the presence and absence of Slc7a5. G/V relationships and V1/2 measurements were obtained using the voltage protocol described in Figure 1. Fit parameters were (mean ± S.D., Slc7a5 in parentheses): Kv1.2[Kv1.5 S1], V1/2 = -10.2 ± 4.1 mV (−17.8 ± 3.1 mV), k = 8.3 ± 1.8 mV (10.3 ± 1.5 mV); Kv1.2[Kv1.5 S1-2L], V1/2 = -3.2 ± 5.9 mV (−52.5 ± 2.8 mV), k = 10.9 ± 2.4 mV (9.2 ± 1.1 mV); Kv1.2[Kv1.5 S2], V1/2 = -7.8 ± 2.6 mV (−38.0 ± 15.7 mV), k = 9.7 ± 1.7 mV (14.7 ± 3.9 mV); Kv1.2[Kv1.5 S2-3L], V1/2 = −9.6 ± 2.7 mV (−47 ± 11 mV), k = 8.0 ± 1.7 mV (9.8 ± 2.5 mV).
Figure 9
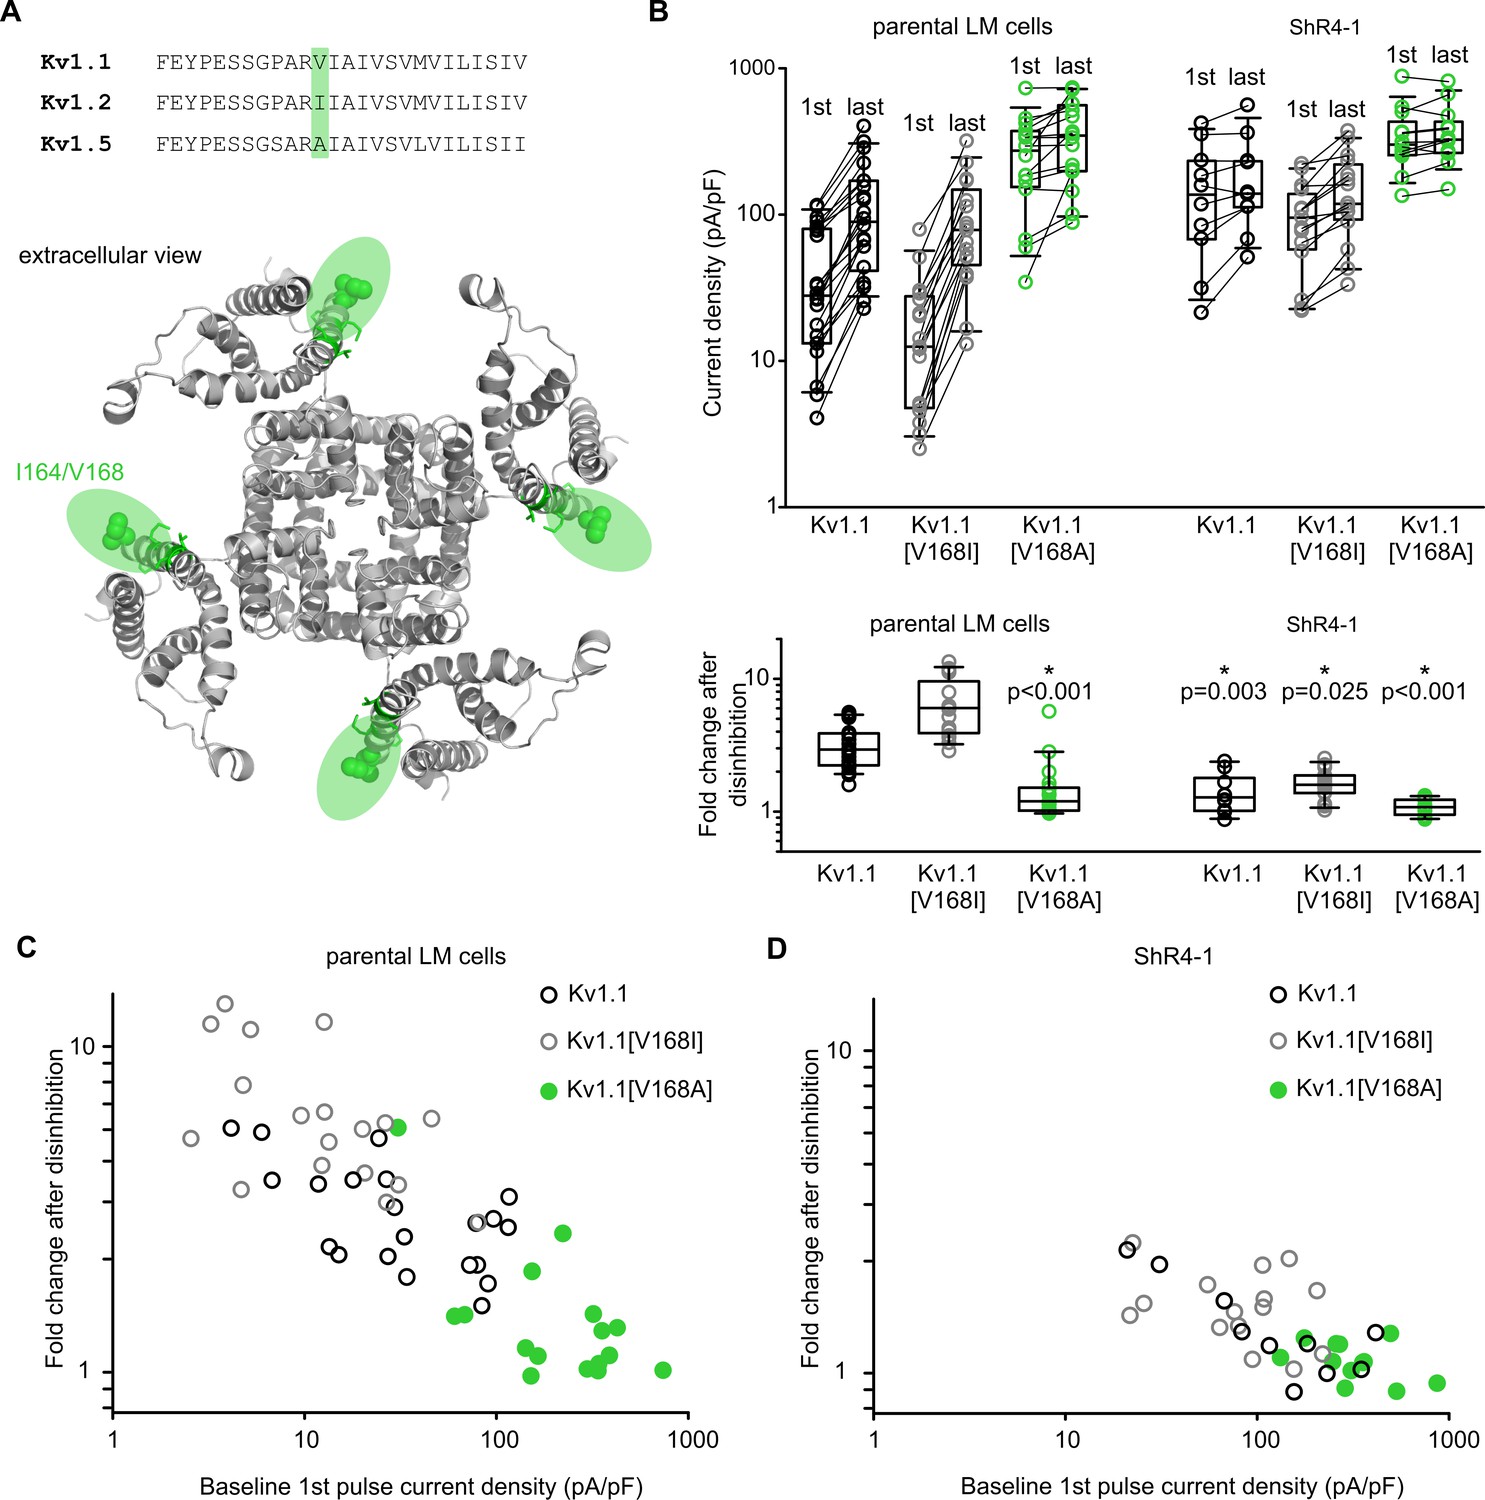
Altered Slc7a5 modulation of Kv1.1 V168 mutations.
(A) Top, amino acid sequence comparison of S1 in Kv1.1, Kv1.2 and Kv1.5. Sequence variation at Kv1.1 position V168 is highlighted in green (I164 in Kv1.2, A251 in Kv1.5). Bottom, structural model of Kv1.2 channel highlighting amino acid position I164 (equivalent to Kv1.1 V168). (B) Cell-by-cell current density before and after a −120 mV pulse train of indicated channel mutants, in the parental LM cells or ShR4-1 cell line. Lower panel, fold disinhibition for Kv1.1 S1 mutant channels (fold disinhibition = last pulse/1st pulse) after a −120 mV pulse train. (C and D) Cell-by-cell correlation of baseline (1st pulse) current density and fold disinhibition after a −120 mV pulse train, for Kv1.1 mutants and cell lines as indicated.
-
Figure 9—source data 1
Altered Slc7a5 sensitivity in S1 mutant Kv1.1 channels.
- https://cdn.elifesciences.org/articles/54916/elife-54916-fig9-data1-v2.xlsx
Tables
Key resources table
| Reagent type (species) or resource | Designation | Source or reference | Identifiers | Additional information |
|---|---|---|---|---|
| Cell line (Mus musculus) | LM(tk-) cells | ATCC | CCL-1.3 | Fibroblast cells (Male) |
| Cell line (Homo-sapiens) | Human Embryonic Kidney 293T (HEK 293T) cells | ATCC | CRL-3216 | |
| Chemical compound, drug | jetPrime | Polyplus | transfection reagent | |
| Gene | GFP | Addgene | 54705 | |
| Gene | mCherry | Addgene | 30125 | |
| Gene (Rattus norvegicus) | Kv1.2 | Lab clone | Accession: NM_012970.3 | |
| Gene (Homo sapiens) | Kv1.5 | Lab clone | Accession: NM_002234.4 | |
| Gene (Homo sapiens) | Kv1.1 | Lab clone | Accession: NM_000217.3 | |
| Gene | eGFP | Addgene | 54759 | |
| Gene (Homo sapiens) | Slc7a5 | DNASU | Accession: NM_003486.7 | |
| Gene (Homo sapiens) | Slc7a6 | DNASU | Accession: NM_001076785.3 | |
| Recombinant DNA reagent | pcDNA3.1(-) | Invitrogen | ||
| Recombinant DNA reagent | pcDNA3.1(-)-ccdB-Nanoluc | Addgene | 87067 | |
| Strain (Escherichia-coli) | DH5-α | Prepared in lab | ||
| Antibody | anti-Slc7a5 (rabbit polyclonal) | Trans Genic Inc | KE026 | 1:1000 dilution |
| Antibody | HRP-conjugated (goat anti-rabbit) | Applied Biological Materials | SH012 | 1:15,000 dilution |
| Antibody | Anti-β actin (mouse monoclonal) | GeneTex | Cat #: GTX629630 | 1:2000 dilution |
| Antibody | HRP-conjugated (goat anti-mouse) | Applied Biological Materials | SH023 | 1:20,000 dilution |
| Antibody | β-tubulin | CST | Ref: #86298, D3U1W | |
| Antibody | Mouse IgG | CST | Ref: #5470 | DyLight 680-conjugated |
| Antibody | Rabbit IgG | CST | Ref: #5151 | DyLight 800-conjugated |
| Antibody | mTOR | CST | Ref: #4517, L27D4 | |
| Antibody | mTOR (phosphor-Ser2448) | CST | Ref: #5536 | |
| Antibody | S6 | CST | Ref: #2317, 54D2 | |
| Antibody | S6 (phosphor-Ser240/244) | CST | Ref: #5364, D68F8 | |
| Antibody | 4-EBP1 | CST | Ref: #9644, 53H11 | |
| Reagent | SuperSignal West Femto Max Sensitivity Substrate | Thermo Fisher Scientific | 34095 | Chemiluminescent detection reagent |
| Chemical compound, drug | 2-Amino-bicyclo[2,2,1]heptane-2-carboxylic acid (BCH) | Sigma Aldrich | A7902-100MG | |
| Chemical compound, drug | Rapamycin | Alfa Aesar, Fisher Scientific | J62473-MF | |
| Sequence-based reagent | Slc7a5Taqman probe | Thermo Fisher | Cat #: (Mm00441516_m1) | |
| Sequence-based reagent | GAPDH | Thermo Fisher | Cat #: (Mm99999915_g1) | |
| Commercial assay, kit | Taqman Fast Advance Master Mix | Applied Biosystems | 4444556 | |
| Commercial assay, kit | Superscript IV First-strand synthesis system | Invitrogen | 18091050 | |
| Commercial assay, kit | Nano-Glo live cell assay reagent | Promega | N1620 | |
| Chemical compound, drug | Puromycin | Gibco | Ref #: A11138-03 | |
| Chemical compound, drug | Polybrene | Sigma Aldrich | TR-1003-G | |
| Genetic reagent | pLV-RNAi vector system | Biosettia | Cat #: Sort-B21 |
Additional files
-
Supplementary file 1
List of primers.
- https://cdn.elifesciences.org/articles/54916/elife-54916-supp1-v2.docx
-
Transparent reporting form
- https://cdn.elifesciences.org/articles/54916/elife-54916-transrepform-v2.pdf
Download links
A two-part list of links to download the article, or parts of the article, in various formats.
Downloads (link to download the article as PDF)
Open citations (links to open the citations from this article in various online reference manager services)
Cite this article (links to download the citations from this article in formats compatible with various reference manager tools)
Control of Slc7a5 sensitivity by the voltage-sensing domain of Kv1 channels
eLife 9:e54916.
https://doi.org/10.7554/eLife.54916


