A broad mutational target explains a fast rate of phenotypic evolution
- Institut de Biologie de l'École Normale Supérieure, CNRS, Inserm, France
- Laboratoire Reproduction et Développement des Plantes, Univ Lyon, ENS de Lyon, UCB Lyon 1, CNRS, INRAE, Inria, France
Figures
Figure 1 with 1 supplement
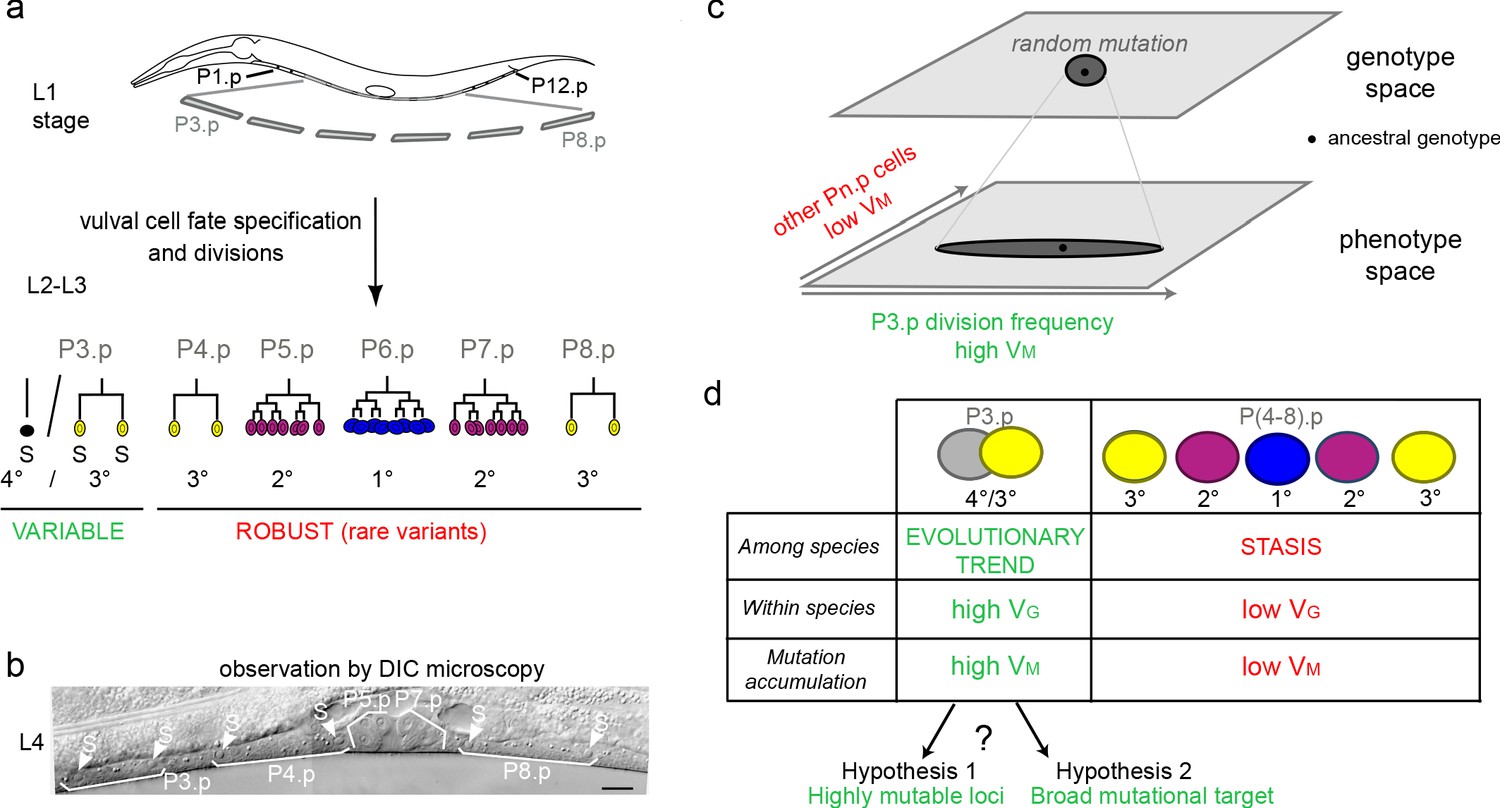
Specific evolutionary features of P3.p among vulva precursor cells and the question of the origin of its high mutational variance.
(a) Schematic description of development of the six vulva precusor cells (VPCs). The six cells P(3-8).p are born during the L1 larval stage. At the end of larval stage L2, P3.p either fuses with the surrounding hypodermal syncytium (hyp7) or escapes fusion like the other VPCs. The VPCs that have not fused divide in the L3 stage according to a fixed fate and lineage (1°, 2° and 3° fates, color-coded). (b) Nomarski picture of a mid-L4 stage animal showing the descendants of VPCs. In this individual, P3.p divides like P4.p and P8.p, as shown by the presence of two nuclei per mother Pn.p cell (labeled 'S' for syncytial). (c) Schematic genotype-phenotype map for the Pn.p cells, showing that P3.p has a high mutational variance. The black dot depicts the ancestral genotype and phenotype, and the dark grey shape schematizes the distribution after random mutation. (d) Unlike P(4-8).p, P3.p displays evolutionary change among Caenorhabditis species (evolutionary trend), a high polymorphism within species (standing genetic variance VG), and a high mutational variance (VM) found in mutation accumulation lines (Delattre and Félix, 2001; Braendle et al., 2010; Pénigault and Félix, 2011a). The high mutational variance of P3.p may be explained by a high mutation rate at specific loci or by a broad mutational target.
Figure 1—figure supplement 1
Comparison of mutational and standing genetic variance among different vulva precursor cells.
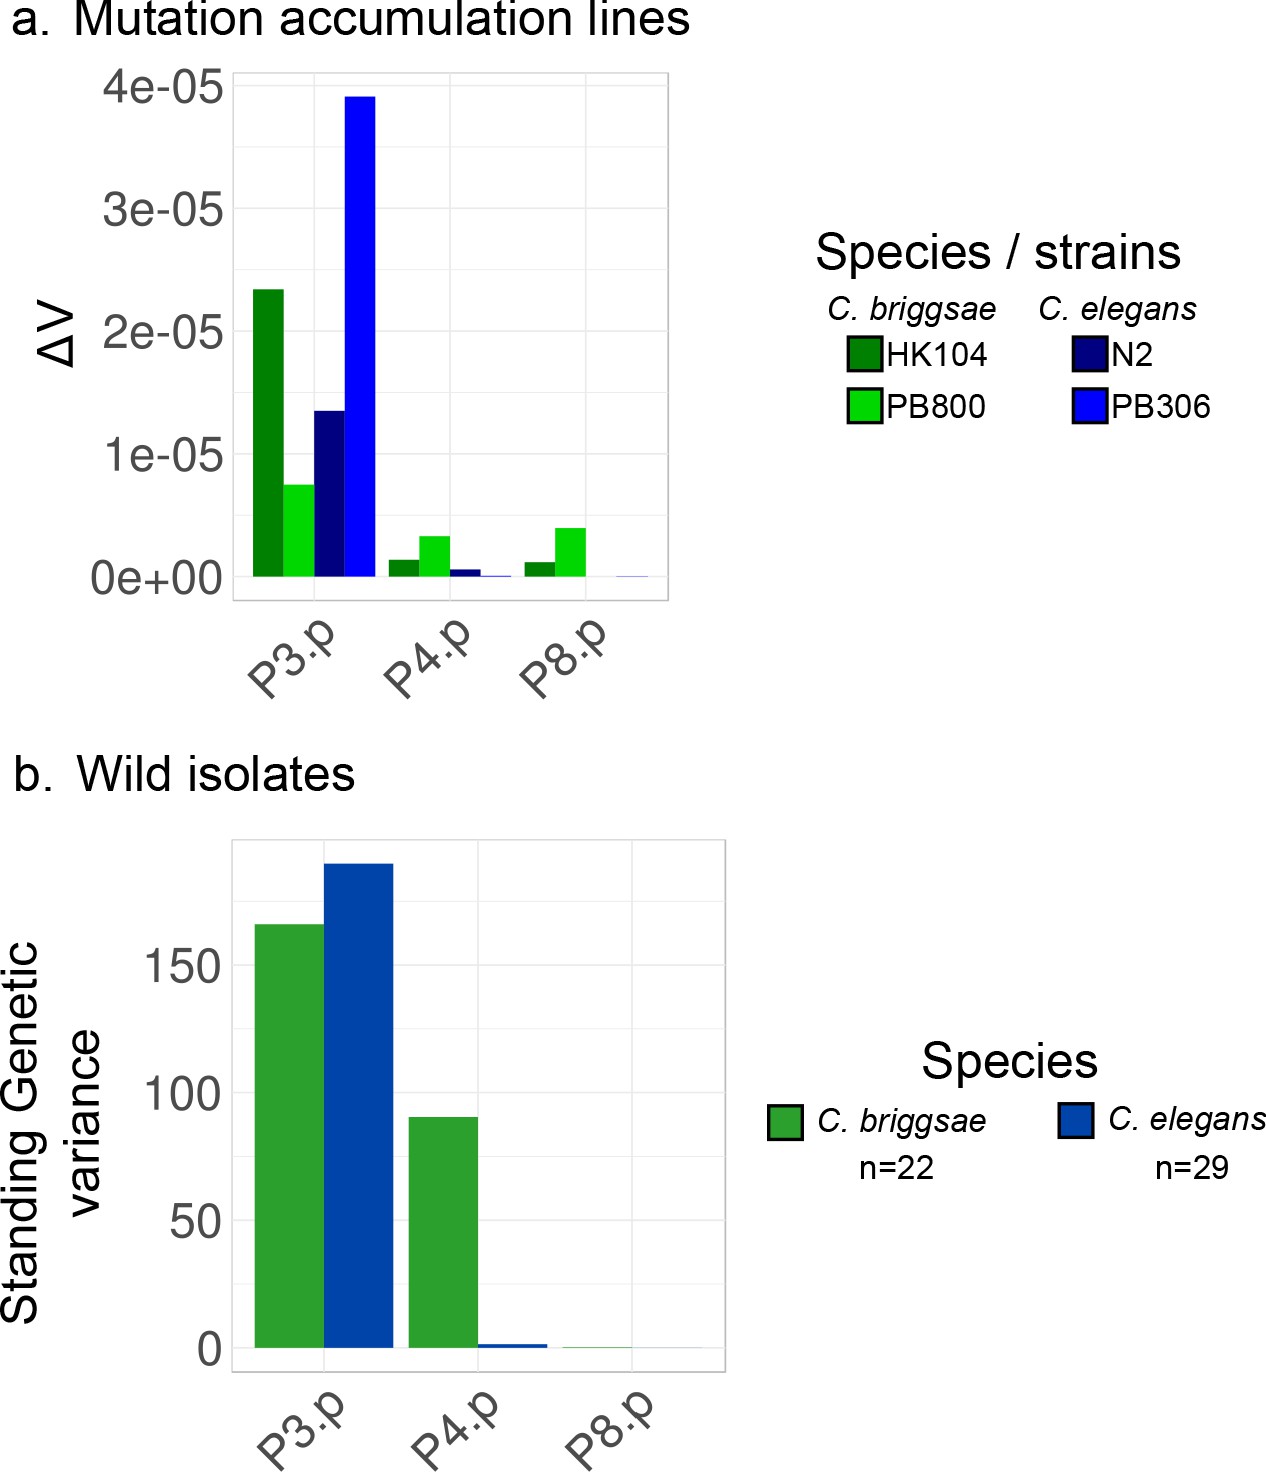
(a) The mutational variance measurements from Braendle et al., 2010 are plotted for P3.p, P4.p and P8.p (the central cells vary even less). Four sets of about 50 MA lines were studied, derived from C. elegans or C. briggsae ancestor strains. The mutational variance is here estimated by computing the per-generation change in mean frequencies of variant vulva patterns among MA lines, ΔV. ΔV is an order of magnitude higher for P3.p than for the other cells (10−5 vs 10−6, respectively). (b) Standing genetic variance is estimated as the variance of division frequencies of P3.p, P4.p and P8.p in a collection of wild strains of C. briggsae and C. elegans. Data from Pénigault and Félix, 2011a.
Figure 2 with 1 supplement
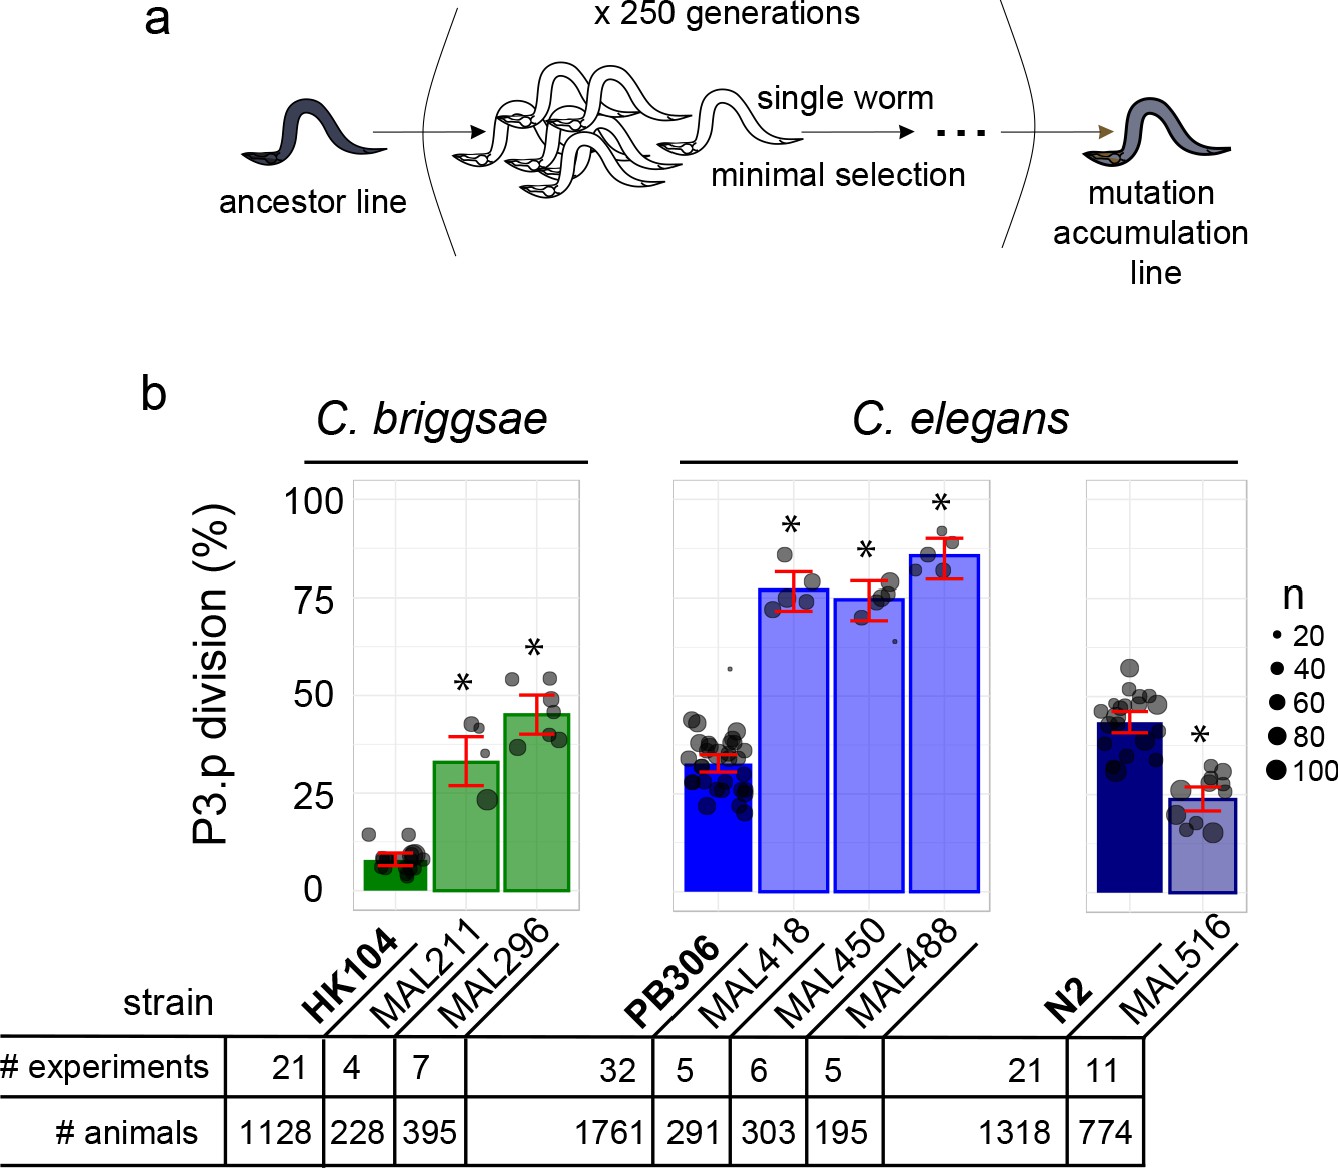
Choice of Caenorhabditis MA lines displaying evolution of P3.p cell fate compared to their ancestral line.
(a) Schematic depiction of the generation of mutation accumulation (MA) lines. Starting from an ancestral line, each new generation is propagated through a single worm for many cycles (250 generations in the present case). This treatment with minimal selection at low population size increases the likelihood of fixing de novo spontaneous mutation by drift. (b) The panel of this study consists of three cohorts of ancestral lines and derived MA lines, one in the nematode species C. briggsae (derived from HK104 ancestor, colored in green in the figures) and two in C. elegans (derived from ancestors PB306 and N2, in blue). The bar charts represent the mean frequency of P3.p division for each strain in the three cohorts over several replicate experiments. Each dot represents an independent experiment, with dot size scaled to the number of scored individuals (n). The ancestral line is the leftmost strain (in bold). The number of independent experiments and individuals are indicated below the graphs. Stars indicate a significant difference with the ancestor line (Fisher's exact test) and error bars indicate 95% confidence intervals.
Figure 2—figure supplement 1

Selection of MA lines with evolution of P3.p cell fate compared to their ancestor line.
(a–d) Data from Braendle et al., 2010. Each MA line was scored once (n = 50 individuals) while each ancestor was scored 17 times (n = 17×50=850). Scores for the ancestor are summarized with a colored bar on the right side of each plot. Red dots indicate lines with a P3.p division frequency significantly different from the ancestor (Fisher's exact test corrected for mutliple tests, fdr level: 0.05). MA lines that were scored again in the present study (E–H) are indicated by an arrowhead. (e–h) Scoring of P3.p division frequency for a subset of MA lines. The bar charts represent the mean frequency of P3.p division over several independent experiments featured as dots whose size scales to the number of animals scored. Data for ancestors and selected MA lines are also reported in Figure 2B. Stars indicate significant differences of mean P3.p division frequency between a MA line and its ancestor (Fisher's exact test, fdr level: 0.05). Error bars are 95% confidence intervals.
Figure 3 with 8 supplements
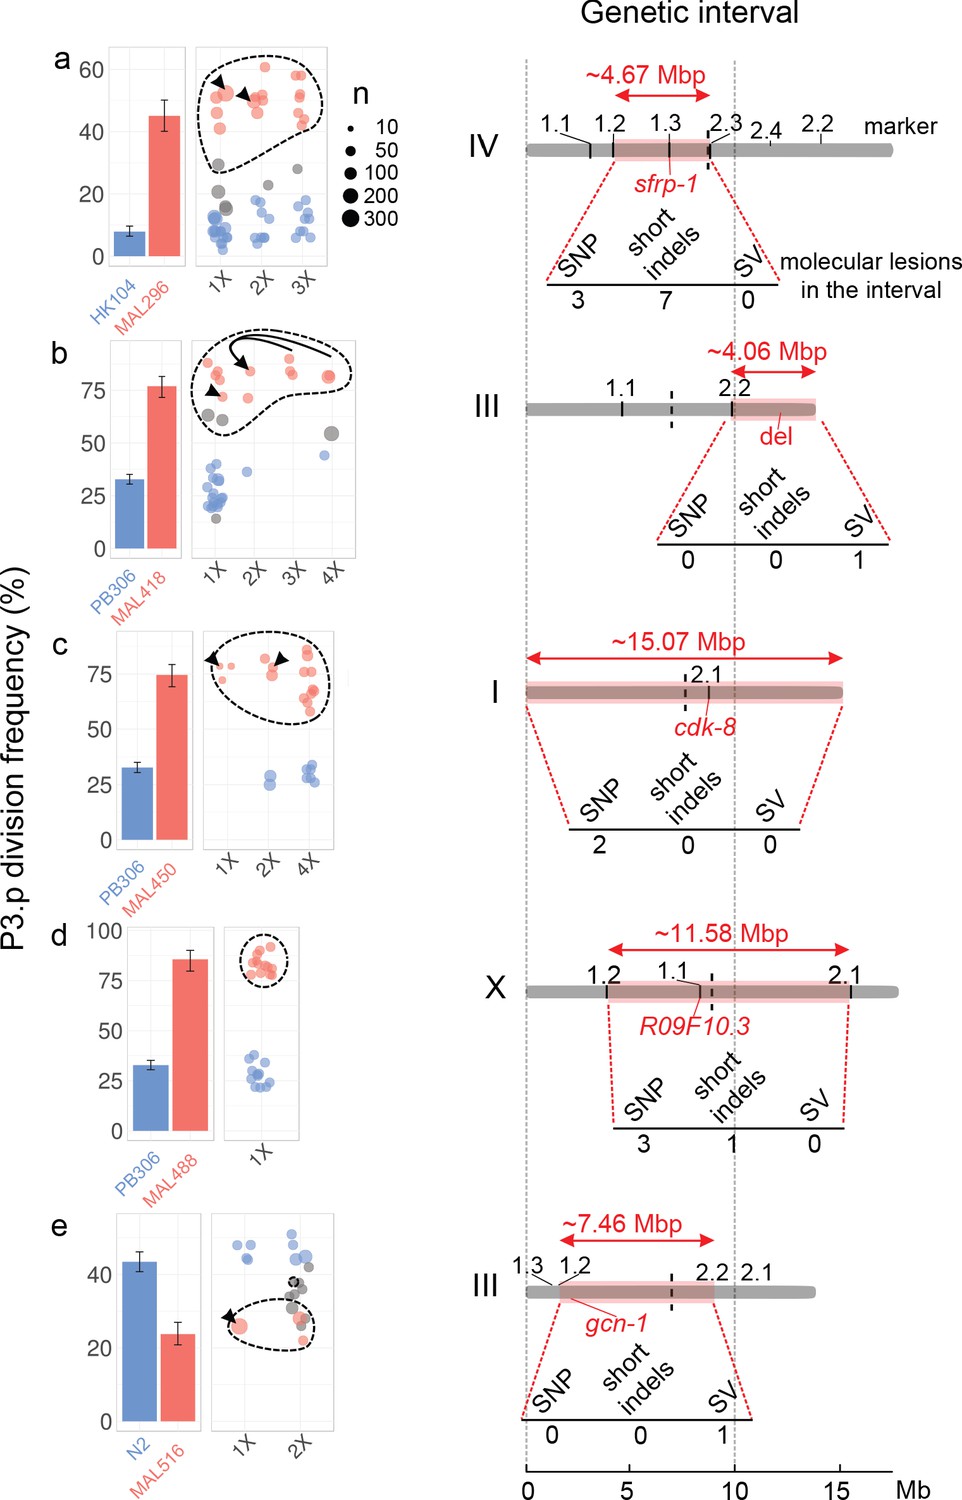
The evolution of P3.p fate maps to a single locus in each mutation accumulation line, each in a different genomic region.
For each panel (a–e), plots on the left indicate the frequency of P3.p division for the ancestral line, the MA line and successive rounds of backcrosses (designated 1x to 4x, see Materials and methods). Data for ancestor and MA lines in the leftmost panel are those shown in Figure 2b. Error bars are 95% confidence intervals. Each dot is a different backcrossed line, the size of which indicates the number of animals assayed (n, several independent replicates may be pooled). Dot colors correspond to statistical groups determined by post-hoc analysis of pair-wise Fisher's tests among backcrossed lines (fdr level: 0.05): red dots are not different from the parent MA line but different from ancestor, blue dots are not different from ancestor but different from MA lines and gray dots are either different from both or not different from either. Dashed lines indicate the backcrossed lines that carry the candidate mutation in the mapping interval. Black arrowheads point to the strain that was used as a parent for the next backcross. In panel b, the same 2x parent was used to independently yield 3x and 4x backcross lines, the latter through crossing the hybrid males to the parental line. Diagrams on the right indicate the position and size of the genetic interval (red rectangle) on the chromosome (gray bar), as identified by combining P3.p scores and genotyping data. The identifiers indicated above the chromosome ('1.1', '1.2', etc.) correspond to the pyrosequencing markers. The number of de novo mutations predicted in each interval is indicated below each diagram. 'SV': structural variant. The position of the causal gene (or mutation) is indicated in red.
Figure 3—figure supplement 1
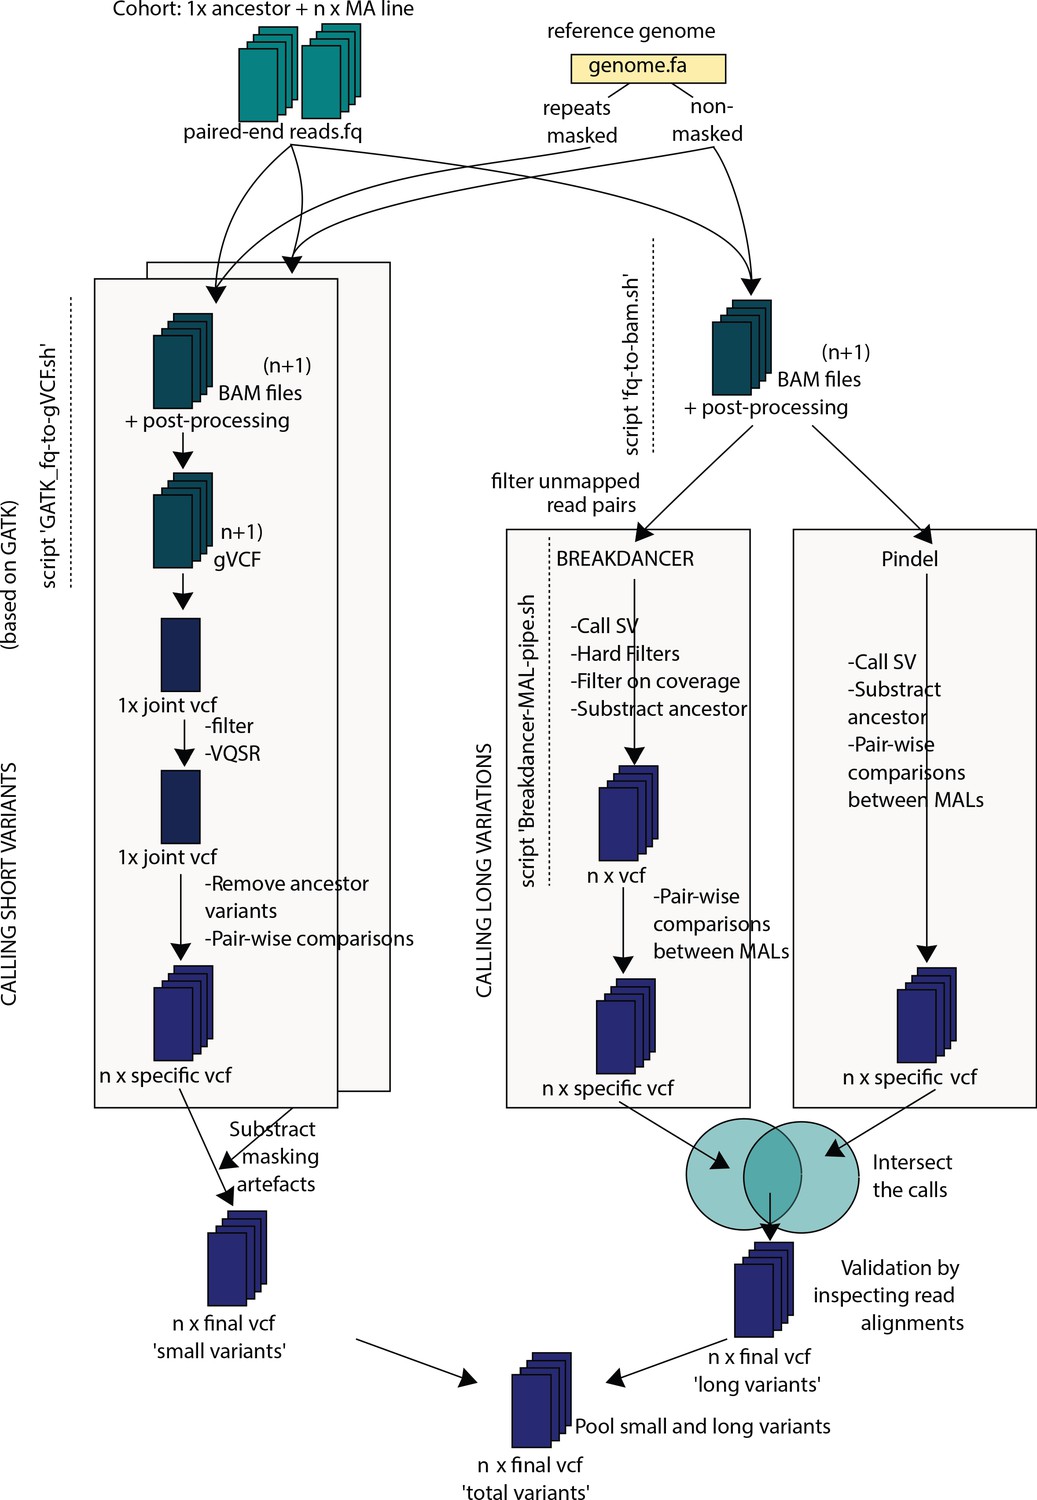
Schematic workflow used for variant discovery in the sequenced genomes.
See Materials and methods for details.
Figure 3—figure supplement 2
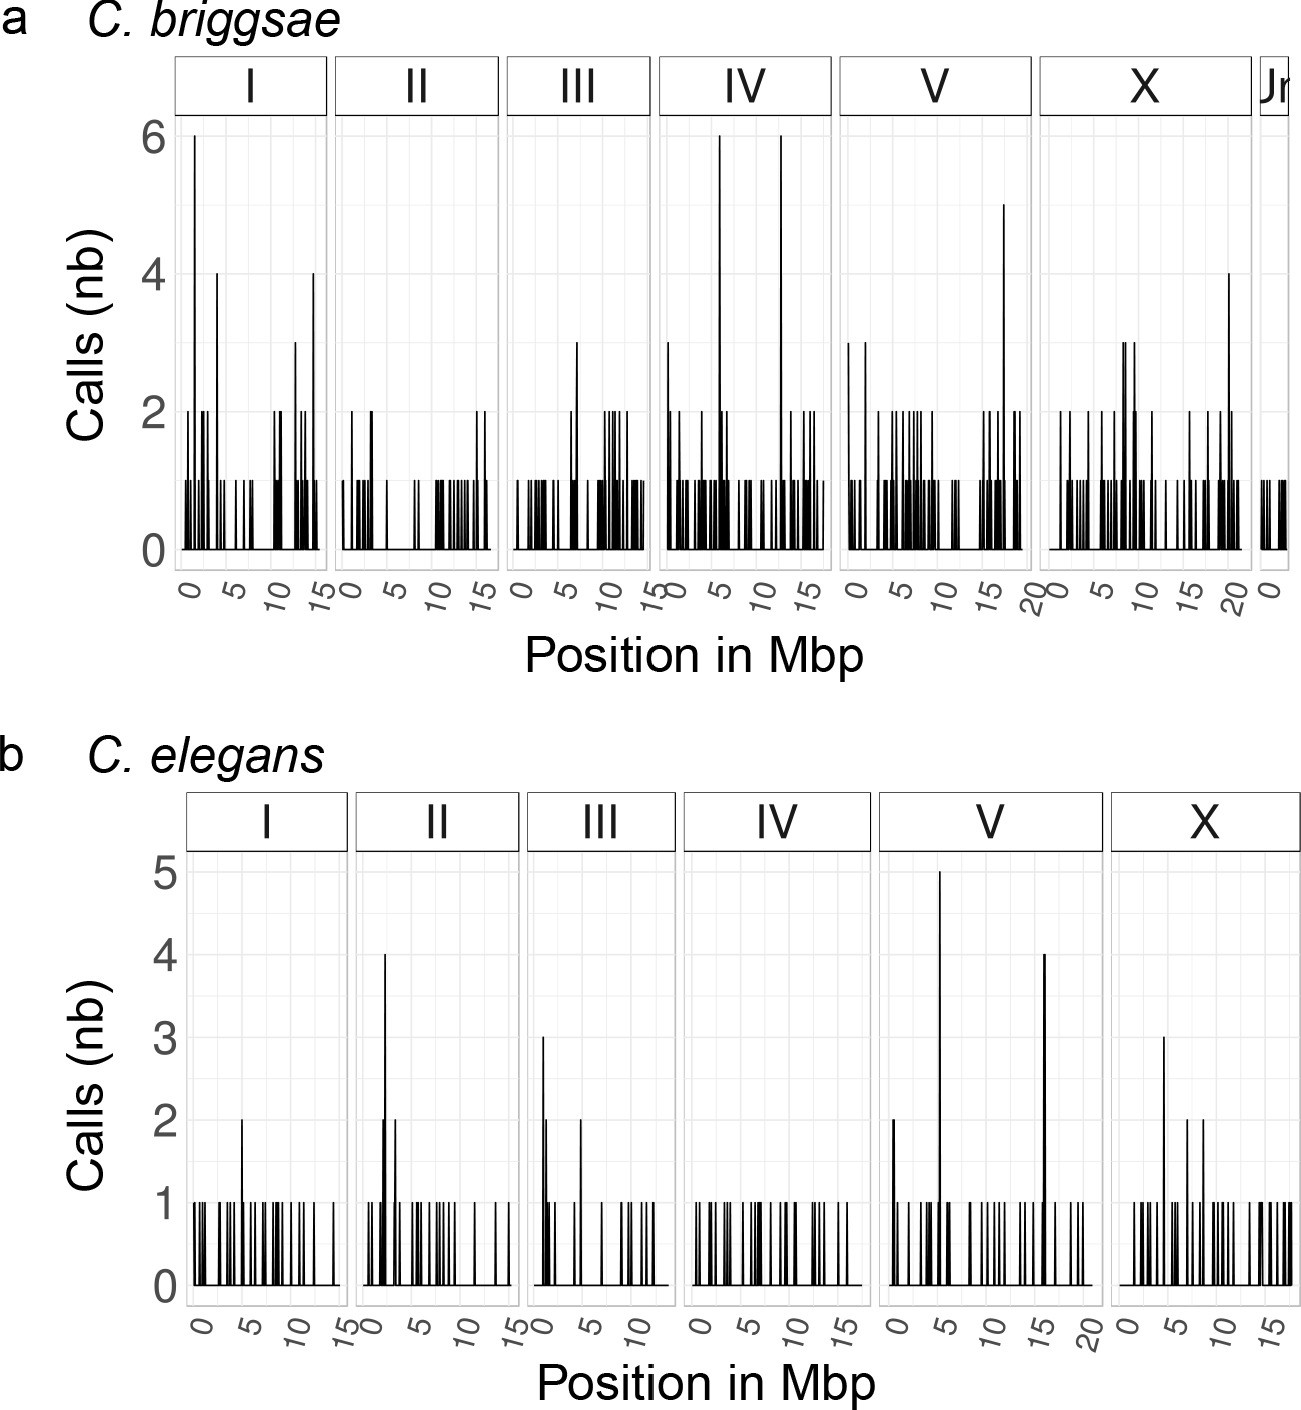
Genome-wide distribution of spontaneous mutations accumulated in the MA lines sequenced for this study.
The number of predicted variant calls in all MA lines per non-overlapping 50 kbp window is plotted over the entire nuclear genome of C. briggsae (A) and C. elegans (B). The data corrspond to two MA lines in C. briggsae and four MA lines in C. elegans.
Figure 3—figure supplement 3

Variant discovery and validation in mutation accumulation lines.
Raw counts of SNPs (a), short indels (b, bars with ‘d’ and ‘i’ are deletions and insertions, respectively) and large deletions (c) predicted by our variant discovery pipeline in each line of the panel. For each category, a subset was tested by direct re-sequencing (see Materials and methods), yielding a high rate of validation (d–f). 'Del.': deletions. 'Ins': insertions. 'pos.': positive. Note that for the SNPs, which show a good validation rate, the C. briggsae lines appear to have a higher rate of mutation, in accordance with their about twice higher rate of fitness decrease (Baer et al., 2005).
Figure 3—figure supplement 4
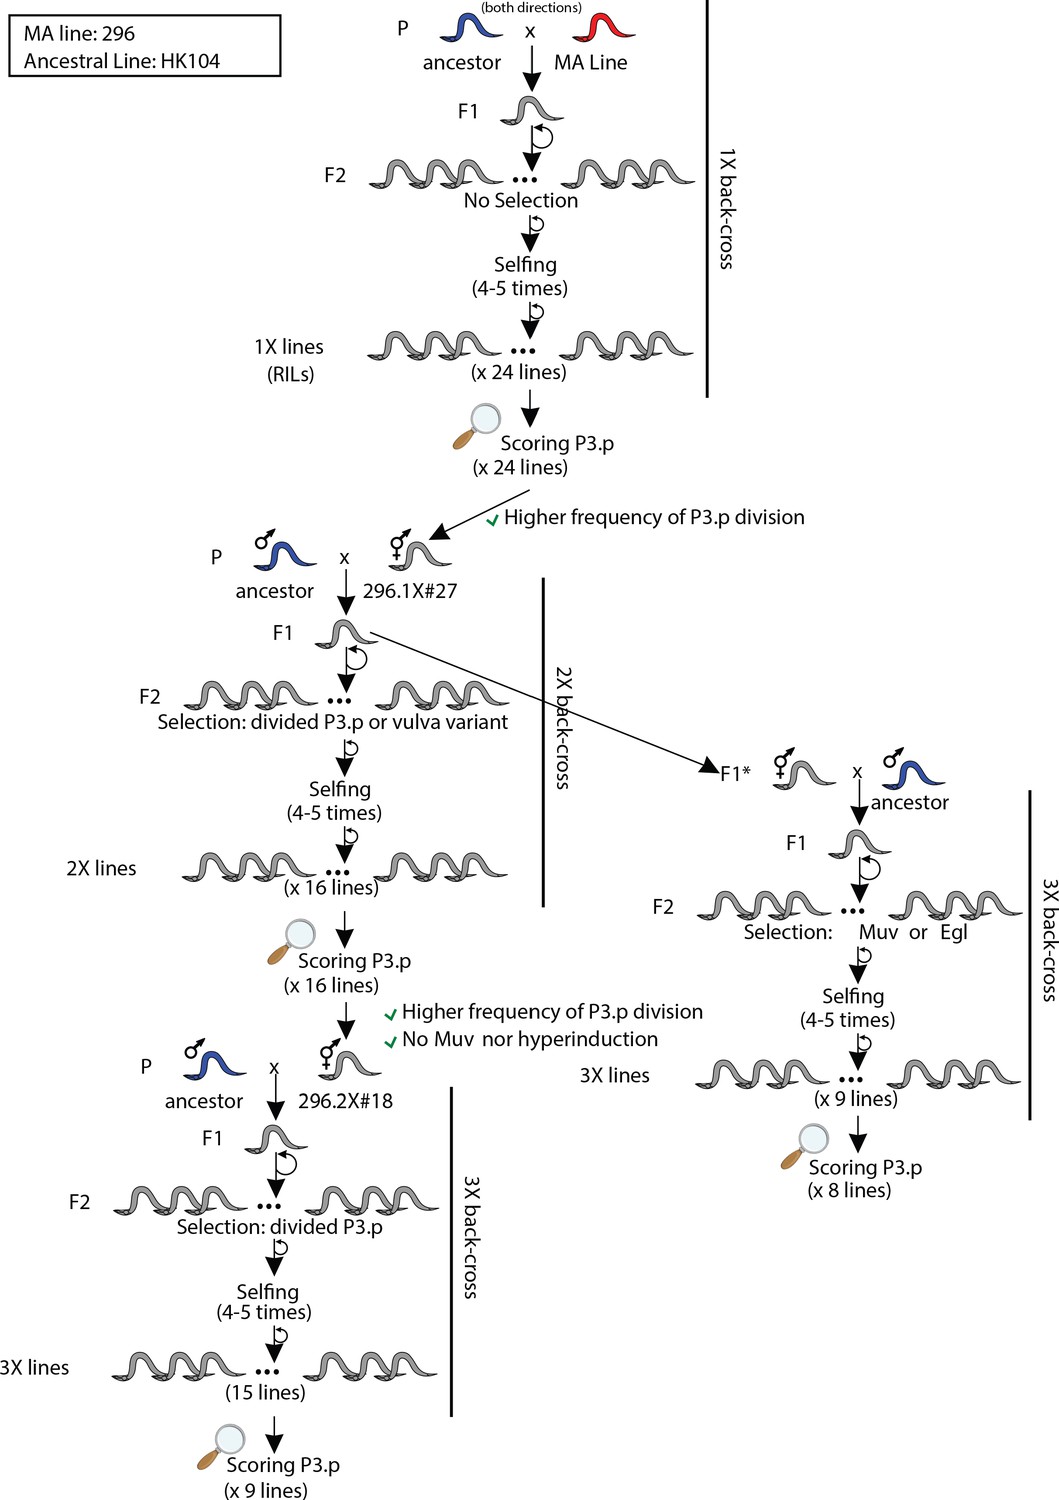
Crossing scheme and selection strategies used to backcross MA line 296 into its ancestral line HK104.
The animals designated as F1* were directly isolated to perform another round of backcross. 'Muv': Multivulva. 'Egl': Egg-laying defective. 'RILs': Recombinant Inbred Lines. '(x 24 lines)' means that 24 lines were derived or scored. '2X' refers to the number of backcrosses.
Figure 3—figure supplement 5

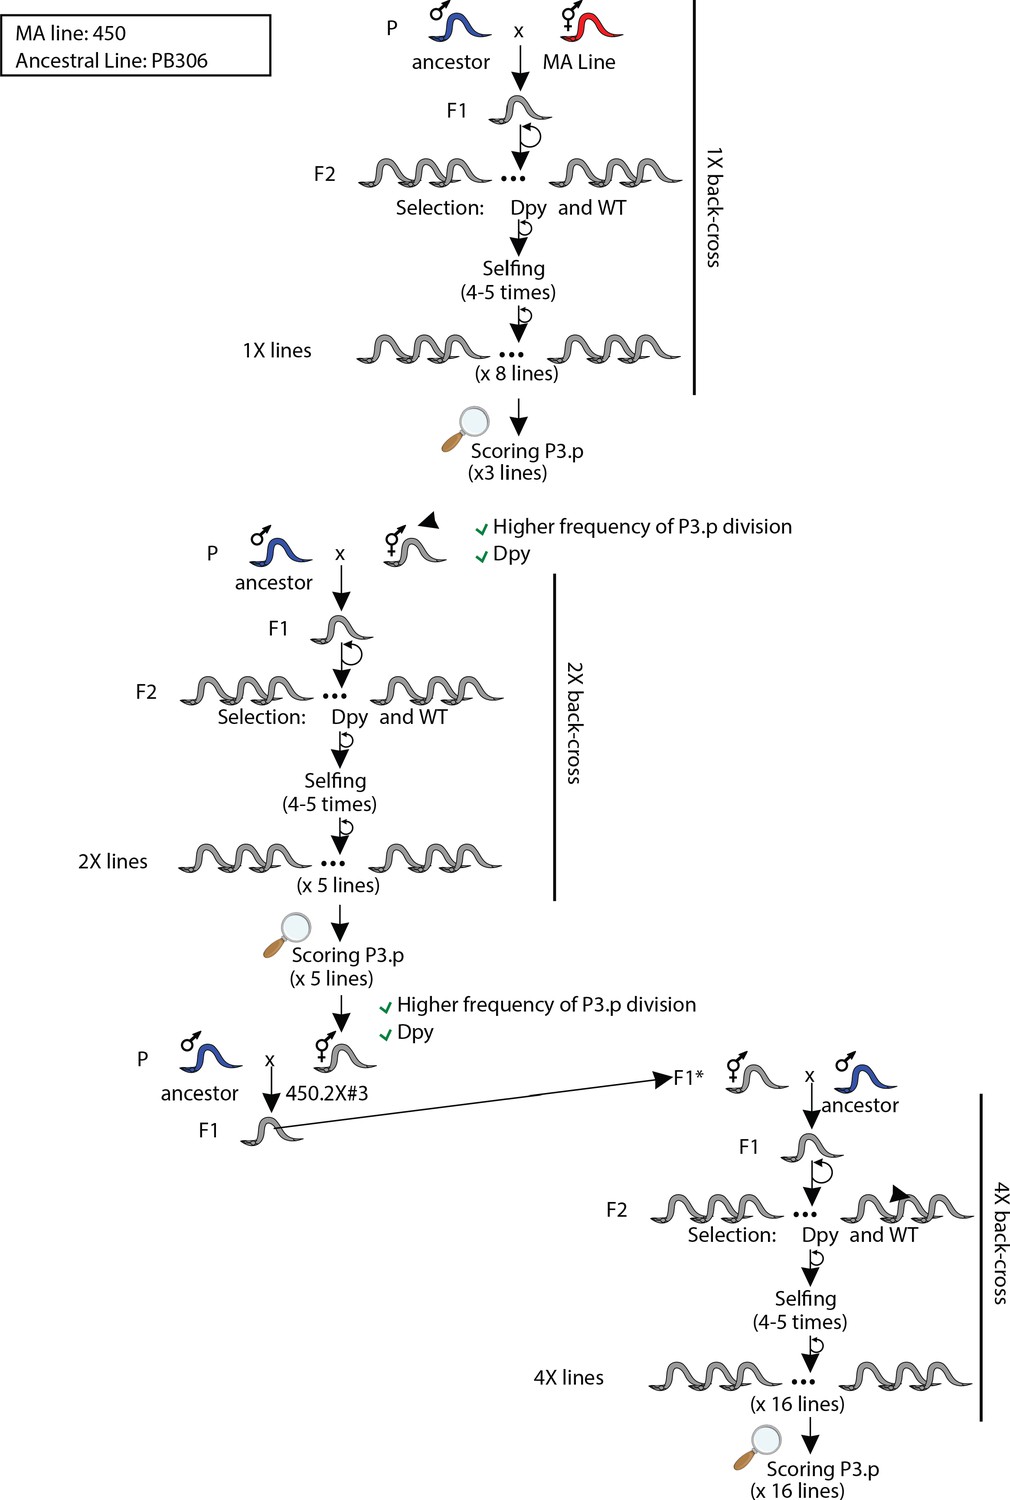
Crossing scheme and selection strategies used to backcross MA line 418 into its ancestral line PB306.
The animals designated as F1* were directly isolated to perform another round of backcross. 'Dpy': Dumpy. 'WT': wild-type. '2X' refers to the number of backcrosses.
Figure 3—figure supplement 6
Crossing scheme and selection strategies used to backcross MA line 450 into its ancestral line PB306.
The animals designated as F1* were directly isolated to perform another round of backcross. '2X' refers to the number of backcrosses.
Figure 3—figure supplement 7
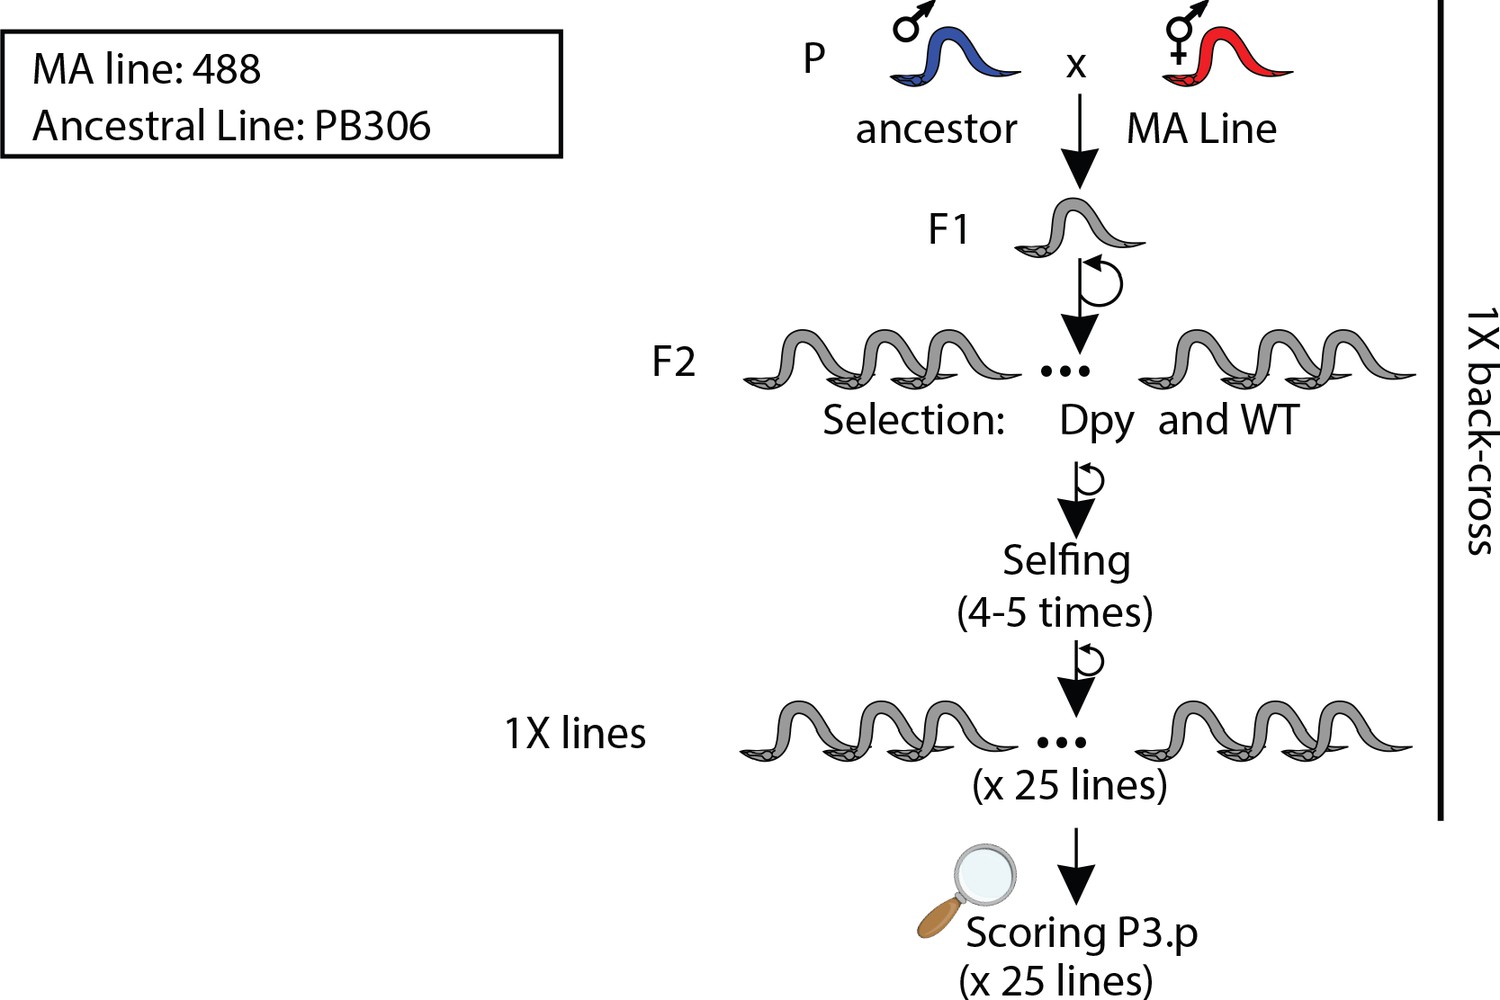
Crossing scheme and selection strategies used to backcross MA line 488 into its ancestral line PB306.
'1X' refers to the number of backcrosses.
Figure 3—figure supplement 8

Crossing scheme and selection strategies used to backcross MA line 516 into its ancestral line N2.
The animals designated as F1* were genotyped by pyrosequencing to confirm they were true cross-progeny. 'Pvl': Protruding vulva. 2X' refers to the number of backcrosses.
Figure 4 with 2 supplements
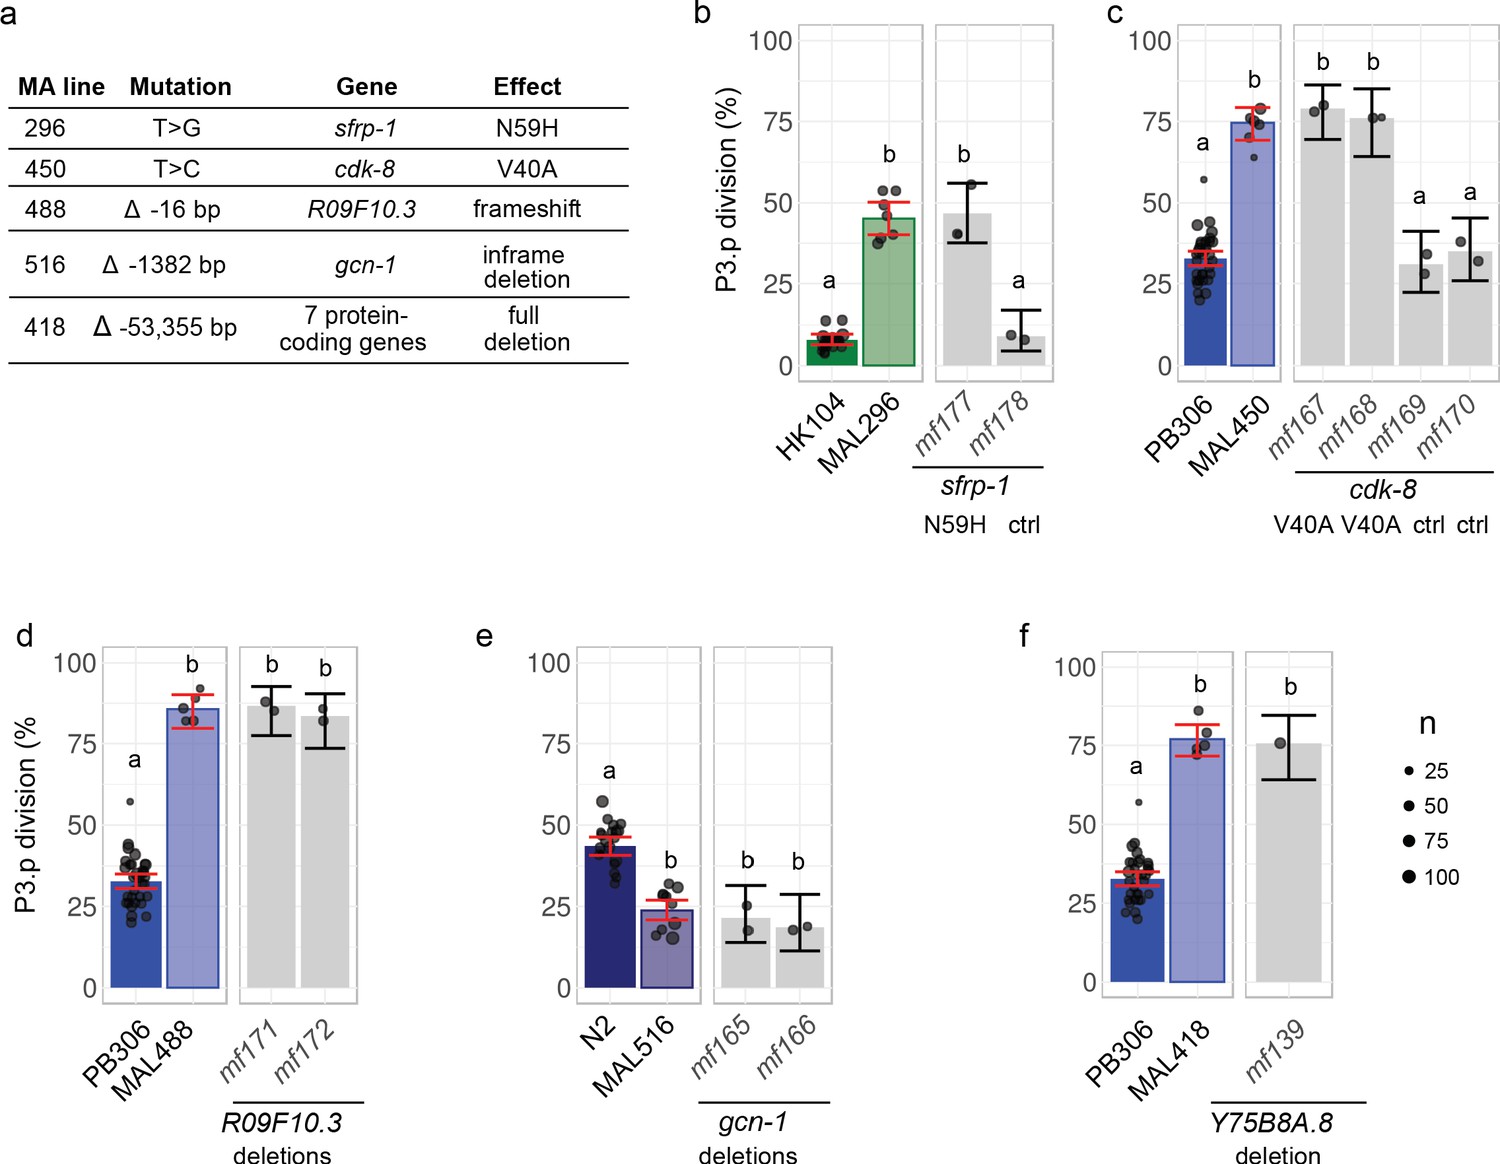
Validation by precise genome editing of candidate causal mutations responsible for P3.p cell fate evolution in MA lines.
(a) Summary table of the molecular nature, underlying gene and molecular effect of the candidate mutations. (b) P3.p division frequency after editing the sfrp-1 locus in ancestor HK104 with a repair template coding only for synonymous substitutions (mf178) or introducing the N59H substitution as well (mf177). (c) P3.p division frequency after editing the cdk-8 locus in ancestor PB306 with a repair template coding for synonymous substitutions only (independent edits mf169 and mf170) or introducing the V40A substitution as well (independent edits mf167 and mf168). (d) P3.p division frequency after editing the R09F10.3 locus in ancestor PB306 to reproduce the exact same 16 bp deletion as in MA line 488 (independent edits mf171 and mf172). (e) P3.p division frequency after editing the gcn-1 locus in ancestor N2 to reproduce the exact same 1344 bp deletion as in MA line 516 (independent edits mf165 and mf166). (f) P3.p division frequency after deleting the entire Y75B8A.8 locus in ancestor PB306. Each dot is an independent experiment, with dot size scaled to the number of scored individuals(n). The bar is the mean frequency obtained by pooling all replicates; error bars indicate 95% confidence intervals. For each graph, leftmost panels provide the scores of ancestor and MA lines as reference (identical data to Figure 2b). Different letters indicate a significant difference (Fisher's exact test, fdr level: 0.05).
Figure 4—figure supplement 1
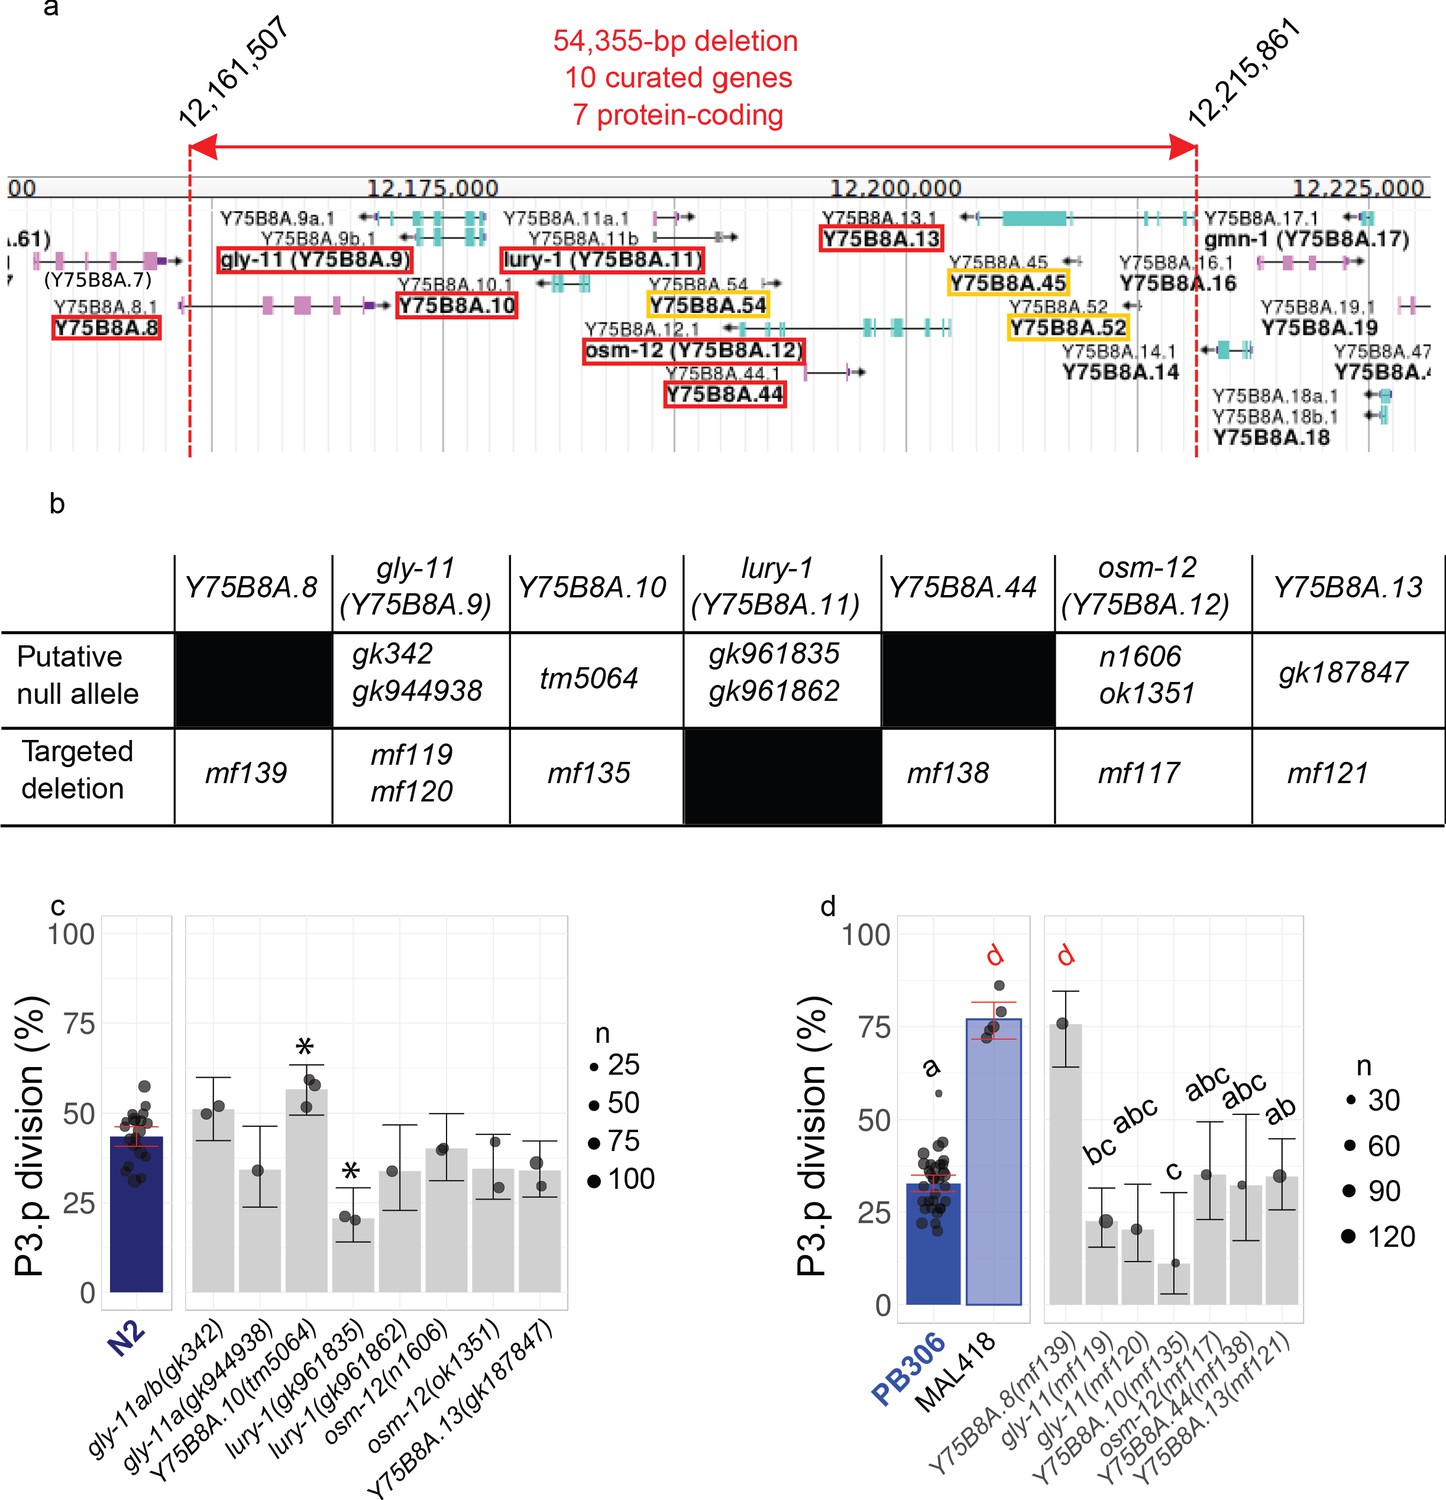
P3.p division frequency in mutants of individual genes within the large deletion of MA line 418.
(a) Gene content of the genomic interval containing the candidate deletion identified in MA line 418 (source Wormbase/Jbrowse: rectangles are exons, arrows span open reading frames, green/magenta color indicates the coding strand). Genes altered by the deletion are boxed in red for protein-coding genes and in yellow for non-protein-coding genes. (b) Table of the mutant alleles used to specifically invalidate each protein-coding gene of the interval. (c–d) P3.p division frequency in different lines. Dots are independent experiments; the size of the dot indicates the number of scored individuals. The bar is the mean frequency over all replicates and error bars indicate 95% confidence intervals. The leftmost panels indicate the scores of controls (N2 reference in C and PB306 ancestor and MA line 418 in D; identical data to Figure 2b). (c) P3.p division frequency of mutant lines in N2 background, stars indicate a significant difference with N2 over all experiments (Fisher's exact test, fdr 0.05). (d) P3.p division frequency of edited lines bearing specific gene indels. Different letters indicate a significant difference (Fisher's exact test, fdr 0.05).
Figure 4—figure supplement 2
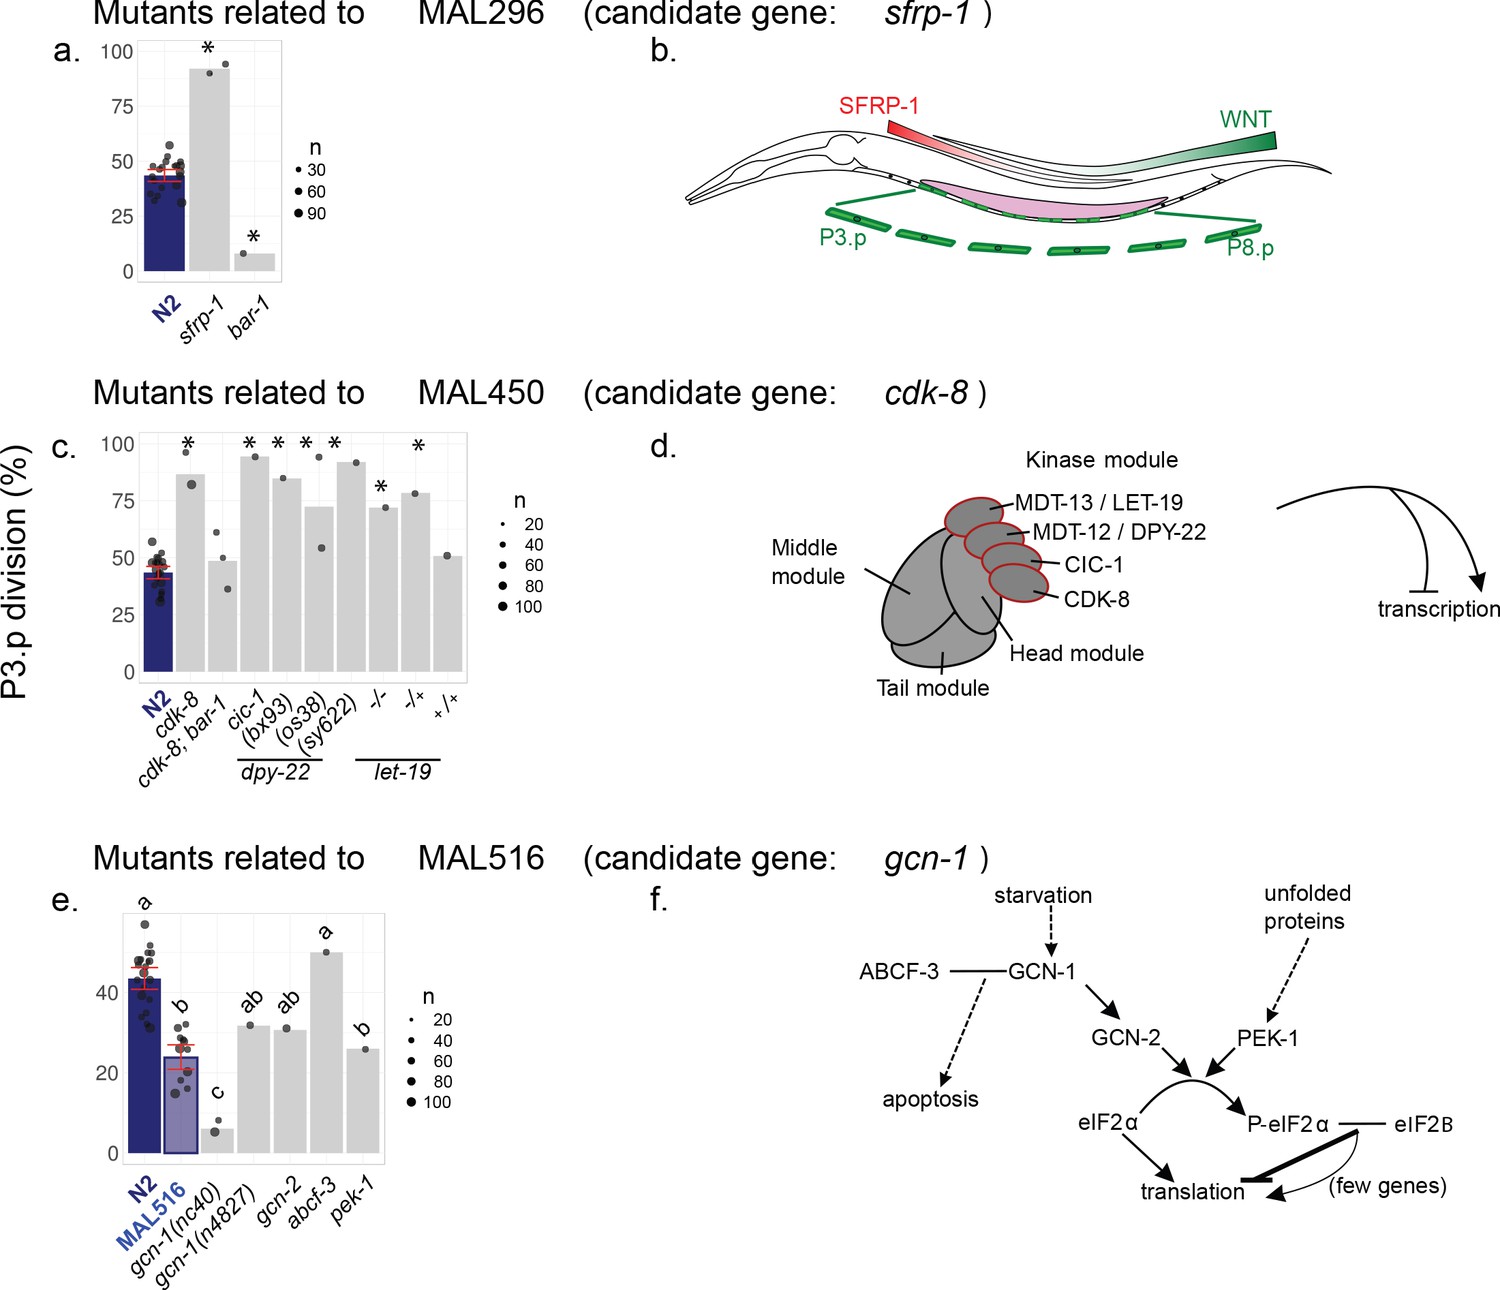
P3.p cell fate in different mutants related to the candidate mutation found in MA lines 296 (a), 450 (c) and 516 (e).
All mutants are derived from the N2 laboratory reference strain. Bar charts represent the mean frequency of P3.p division. Each dot is an independent experiment, whose size scales to the number of animals scored (n). Data for N2 (from Figures 2–4) are repeated on each panel as a reference. Error bars indicate 95% confidence intervals. Stars indicate significant differences with N2 in P3.p division frequency over all experiments and in (e), different letters indicate a significant difference (Fisher's exact test, fdr 0.05). Panels b,d,f provide information about the genes studied in each panel. (b) SFRP-1 expression generates a head-to-tail gradient counter-acting the tail-to-head Wnt gradient. Wnt signaling is known to promote VPC competence and lack of fusion in the L2 stage. (d) Schematic structure of the Mediator complex in C. elegans, made of four multiprotein complexes (head, middle, tail and kinase modules). The Mediator regulates transcription both positively and negatively. Mutants for the four proteins of the kinase module were assayed in (c). (f) Functional pathways related to the GCN-1 kinase in C. elegans. GCN-1 directly activates GCN-2 under starvation condition, which in turns phosphorylates eiF2α leading to a global repression of translation. PEK-1 kinase acts like GCN-2 under unfolded-protein stress. Physical interaction of GCN-1 with ABCF-3 has been shown to promote apoptosis in specific cells, although the involvement of translational regulation is unclear (plain arrows = direct activation, plain T-bar = direct inhibition, dotted arrow = indirect activation, plain line = physical interaction).
Figure 5 with 1 supplement
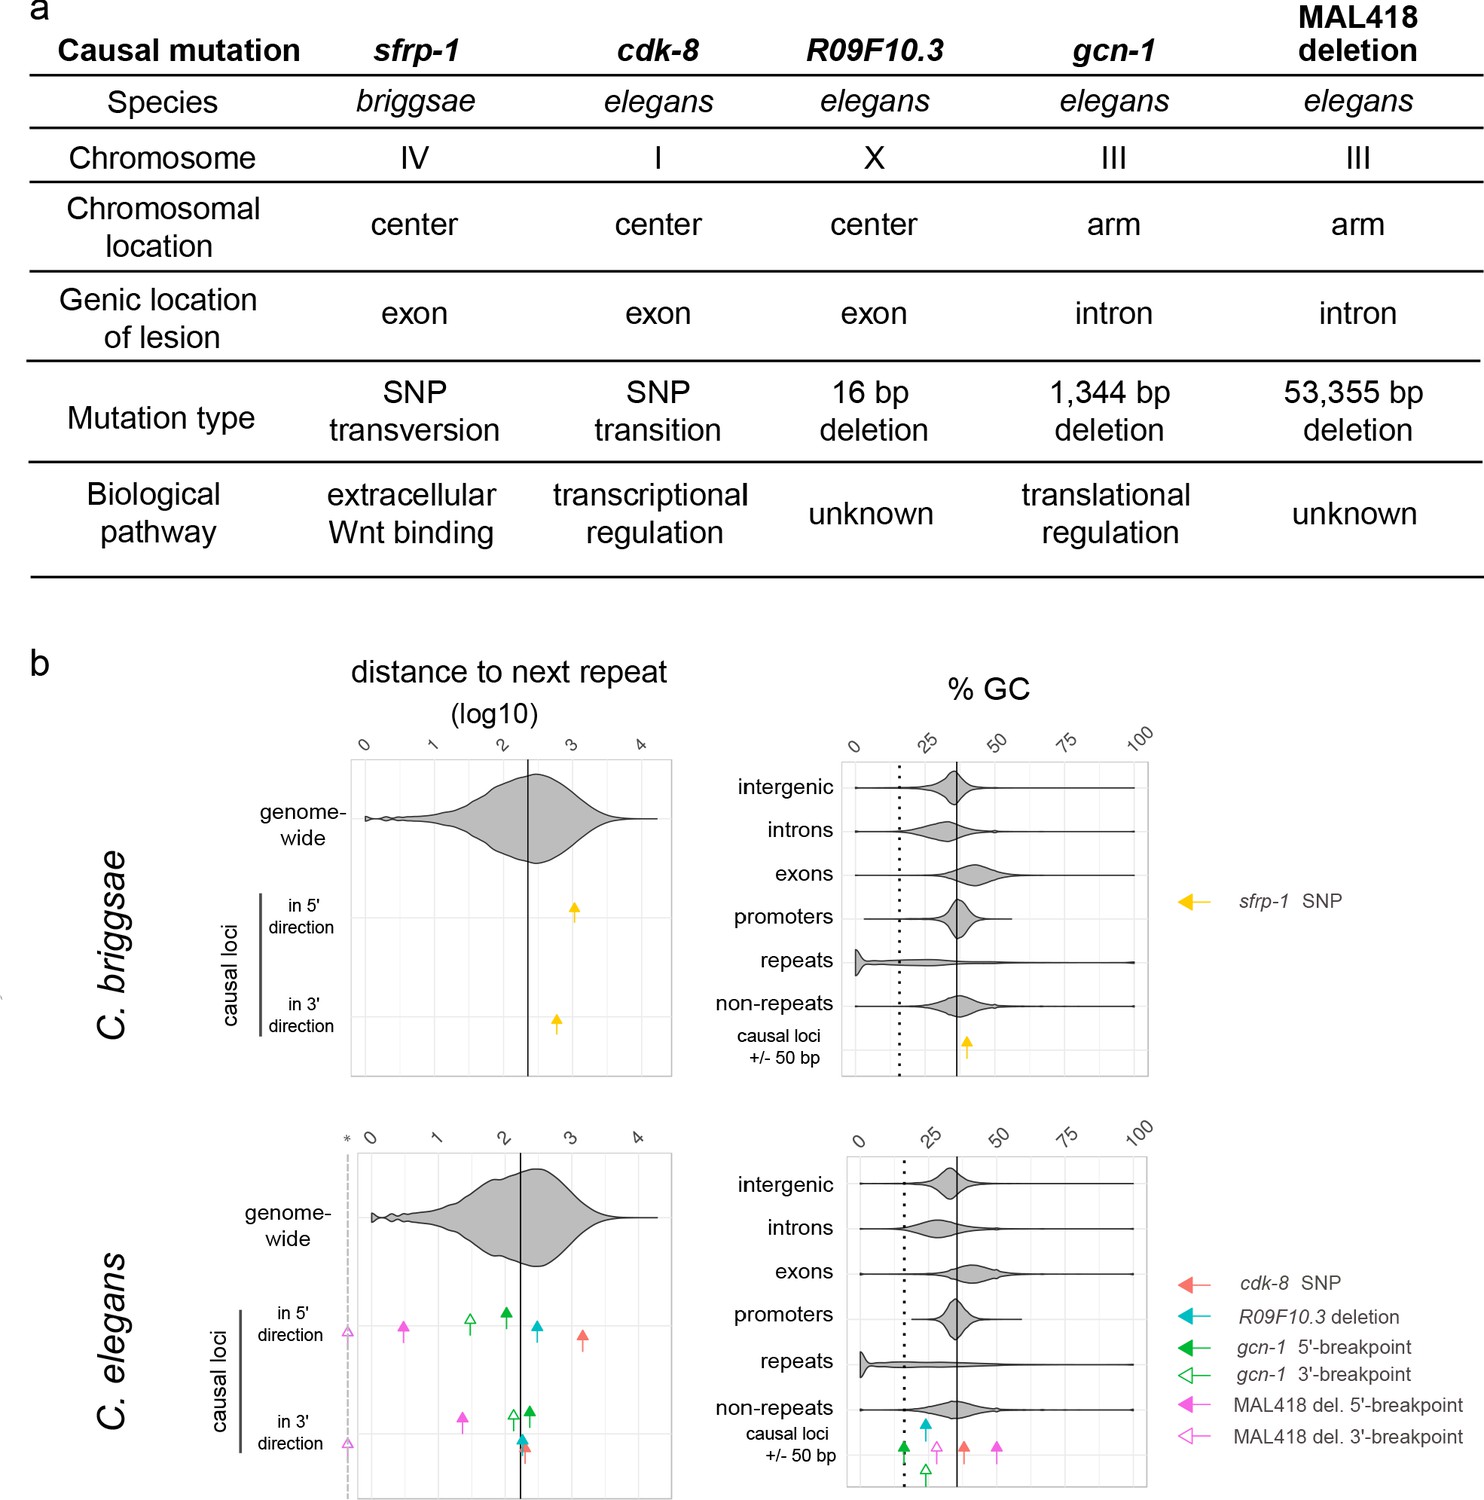
The causal mutations and underlying genes are diverse and do not correspond to repeats.
(a) The five causal mutations correspond to a diversity of chromosomal locations, molecular lesions, genes and biochemical pathways. (b) The five causal mutations correspond to a diversity of locations relative to repeats and GC content. Upper and lower panels show data from C. briggsae and C. elegans, respectively. For each graph, violin plots show the distribution for genomic sequences, while colored arrows indicate the value for each causal locus. In the left panels, arrows indicate the distance in base pairs (log10) of each causal locus to the closest repeat in 5' or in 3', while the violin plot shows the distribution of all inter-repeat distances in the genome. The vertical line corresponds to the genome median value. For large deletions, 5' and 3' breakpoints have been considered as two distinct loci. The dashed gray line marked with a star in the x-axis indicates zero values for the deletion 3' end lying within a repeat. Note that the Y75B8A.8 gene lies towards the 5' end of the large deletion in MA line 418, thus the repeat corresponding to the 3' end is far from the gene. In the right panels, the percentage of GC in a small 50 bp window centered around each causal locus is compared to the GC values of different types of genomic sequences. The plain vertical line is the GC content of the entire genome and the dashed vertical line is the median GC content of repeats.
Figure 5—figure supplement 1
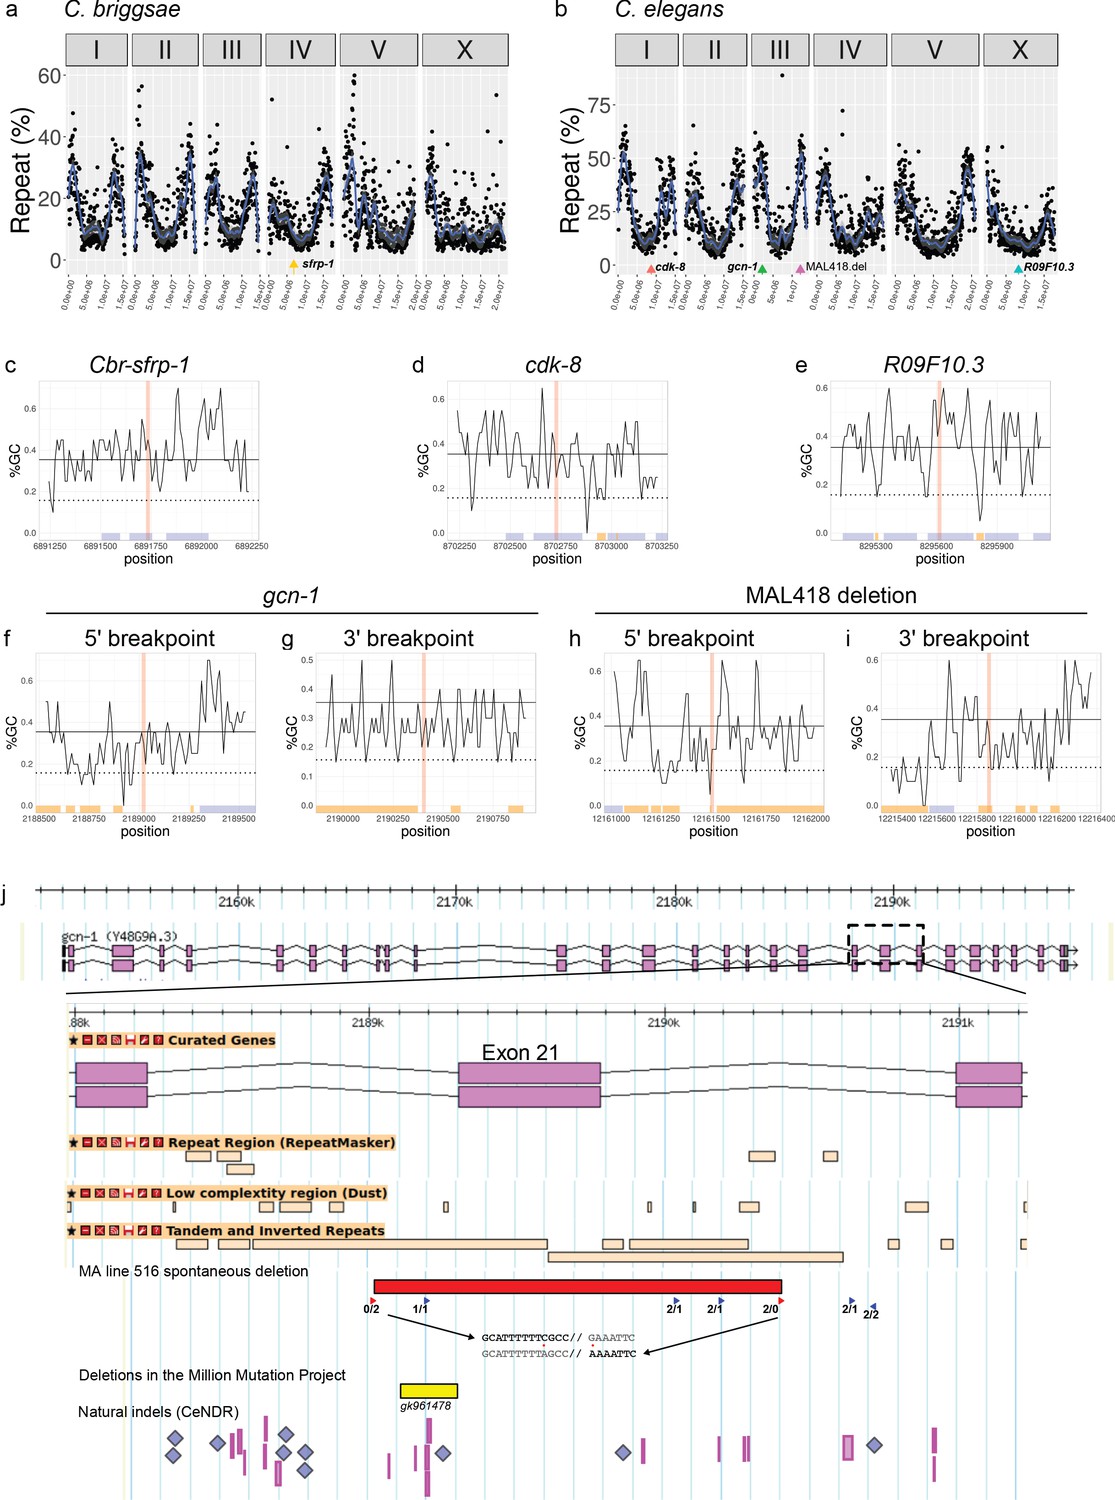
Global and local sequence context of causal mutations.
(a,b) The locus of each causal mutation is indicated by a colored arrow on a genome-wide plot showing the local repeat content along each chromosome, expressed as the percent of total repeat length over 50-kbp non-overlapping window. (c–i) Local scans of the percent of GC bases in the DNA sequences over 1,000 bp centered on each locus. For large deletions, 5' and 3' breakpoints have been considered as two distinct loci. GC contents were computed over 20 bp by successive sliding windows overlapping over 10 bp. The red vertical rectangles indicate the bin containing the causal locus. Along the x-axis, blue and orange boxes show exons and repeats, respectively. (j) Locus of the causal deletion in gcn-1. The entire gene is displayed on the top, the dashed rectangle indicates the region from exons 20 to 22, which is zoomed underneath. The display is adapted from Wormbase/Jbrowse, with exons as magenta rectangles, and repeats from three different tracks displayed as beige rectangles. The 1344 bp causal deletion found in MA line 516 is depicted as a red rectangle. Red arrowheads indicate a similar 20 bp sequence (with two mismatches) repeated at the deletion breakpoint sites. The 5'/3' breakpoint sequences are shown below (same strand): red dots point to mismatches; grey letters belong to the deletion; the deletion site is marked by '//'. Blue arrowheads are direct or indirect repeats of this sequence (right or left pointing arrowhead, respectively) with two or less mismatches. Numbers below the arrowheads give the number of mismatches with either the 5' or the 3' breakpoint sequence (left/right, respectively). Indels from other datasets are reported at the bottom: the deletion from the Million Mutation Project (yellow rectangle), insertions (blue diamonds) and deletions (magenta rectangles) from the Caenorhabditis Natural Diversity Resource.
Figure 6 with 1 supplement

Mutational properties of the five causative genes.
(a) Distribution of number of hits in protein-coding genes in MA lines (this study + 75 lines from Saxena et al., 2019). Throughout the figure, the left panels show cumulative length and mutations of exons only, while the right panels show the length and mutations of genes, defined as the primary transcript sequence (including exons, introns and untranslated regions). Inset focuses on genes with at least two hits, the color code indicating whether hits were found in the same or independent MA lines. Colored dots indicate the value for each causative gene of this study, which were hit only once, except sfrp-1 which was not hit in the C. elegans data set (it was found in a C. briggsae MA line). (b) Correlation between the cumulative exon length (left) and gene length (right) and the number of corresponding mutations in the Million Mutation Project (Thompson et al., 2013). (e) Correlation between the cumulative exon length (left) and gene length (right) and the corresponding number of polymorphic sites, from data from the Caenorhabditis Natural Diversity Resource (CeNDR; Cook et al., 2017). In (b,c), R is the Pearson's correlation coefficient (p-value<2.10−16 in all cases).
Figure 6—figure supplement 1

Mutational properties of causative genes.
(a) Distribution among protein-coding genes of their total length. The left panel shows the cumulative length of exons only, while the right panels show the length of genes, defined as the primary transcript sequence (including exons, introns and untranslated regions). Colored arrows indicate the value for each causative gene, dashed and dotted vertical line correspond to the upper 5% and 1% quantiles, respectively. (b) Distribution among protein-coding genes of cumulative repeat length in their exons or along their total length. Y75B8A.8 is a poly-Q containing protein and thus an outlier concerning repeats in exons. However, the causal mutation we found does not affect these repeats. (c) Frequencies of haplotypes in the five causative genes at CeNDR (N = 330), as a function of the number of high and moderate impact variants compared to the reference N2 sequence (predicted by snpEff, see Materials and methods). Average frequencies are given for all protein-coding genes in the lower panel.
Tables
Key resources table
| Reagent type (species) or resource | Designation | Source or reference | Identifiers | Additional information |
|---|---|---|---|---|
| Gene (C. elegans) | cdk-8 | WormBase | WBGene00000409 | |
| Gene (C. elegans) | gcn-1 | WormBase | WBGene00021697 | |
| Gene (C. elegans) | R09F10.3 | WormBase | WBGene00019987 | |
| Gene (C. elegans) | Y75B8A.8 | WormBase | WBGene00013545 | |
| Gene (C. elegans) | sfrp-1 | WormBase | WBGene00022242 | |
| Gene (C. briggsae) | Cbr-sfrp-1 | WormBase | WBGene00027904 | |
| Strain, strain background (C. briggsae) | HK104 | DOI:10.1073/pnas.0406056102 | HK104CB WormBase ID: WBStrain00041077 | Wild isolate. Ancestor strain of MA lines. |
| Strain, strain background (C. briggsae) | MAL211 | DOI:10.1371/journal.pgen.1000877 | MAL211 | Mutation Accumulation line (250 generations) |
| Strain, strain background (C. briggsae) | MAL296 | DOI:10.1371/journal.pgen.1000877 | MAL296 | Mutation Accumulation line (250 generations) |
| Strain, strain background (C. elegans) | N2 | DOI:10.1073/pnas.0406056102 | N2CB WormBase ID: WBStrain00000001 | Lab reference strain. Ancestor strain of MA lines. |
| Strain, strain background (C. elegans) | MAL516 | DOI:10.1371/journal.pgen.1000877 | MAL516 | Mutation Accumulation line (250 generations) |
| Strain, strain background (C. elegans) | PB306 | DOI:10.1073/pnas.0406056102 | PB306CB WormBase ID: WBStrain00030546 | Lab reference strain. Ancestor strain of MA lines. |
| Strain, strain background (C. elegans) | MAL418 | DOI:10.1371/journal.pgen.1000877 | MAL418 | Mutation Accumulation line (250 generations) |
| Strain, strain background (C. elegans) | MAL450 | DOI:10.1371/journal.pgen.1000877 | MAL450 | Mutation Accumulation line (250 generations) |
| Strain, strain background (C. elegans) | MAL488 | DOI:10.1371/journal.pgen.1000877 | MAL488 | Mutation Accumulation line (250 generations) |
| Genetic reagent (C. briggsae) | Cbr-sfrp-1 (mf177) | this paper | JU3707 | N59H edited allele. Background strain: HK104CB cf Suppl. File 5. |
| Genetic reagent (C. briggsae) | Cbr-sfrp-1 (mf178) | this paper | JU3708 | Control edited allele with synonymous mutations. Background strain: HK104CB cf Suppl. File 5. |
| Genetic reagent (C. elegans) | gcn-1(mf165) | this paper | JU3641 | Precise deletion of exon 21 as in MAL516. Background strain: N2CB cf Suppl. File 5. |
| Genetic reagent (C. elegans) | gcn-1(mf166) | this paper | JU3642 | Precise deletion of exon 21 as in MAL516. Background strain: N2CB cf Suppl. File 5. |
| Genetic reagent (C. elegans) | cdk-8(mf167) | this paper | JU3643 | V40A edited allele. Background strain: PB306CB cf Suppl. File 5. |
| Genetic reagent (C. elegans) | cdk-8(mf168) | this paper | JU3644 | V40A edited allele. Background strain: PB306CB cf Suppl. File 5. |
| Genetic reagent (C. elegans) | cdk-8(mf169) | this paper | JU3645 | Control edited allele with synonymous mutations. Background strain: PB306CB cf Suppl. File 5. |
| Genetic reagent (C. elegans) | cdk-8(mf170) | this paper | JU3646 | Control edited allele with synonymous mutations. Background strain: PB306CB cf Suppl. File 5. |
| Genetic reagent (C. elegans) | R09F10.3(mf171) | this paper | JU3647 | 16 bp deletion as in MAL488. Background strain: PB306CB cf Suppl. File 5. |
| Genetic reagent (C. elegans) | R09F10.3(mf172) | this paper | JU3648 | 16 bp deletion as in MAL488. Background strain: PB306CB cf Suppl. File 5. |
| Genetic reagent (C. elegans) | Y75B8A.8(mf139) | this paper | JU3357 | Deletion in exon 3. Background strain: PB306CB cf Suppl. File 5. |
| Recombinant DNA reagent | pJA58 (plasmid) | Addgene | Addgene:Plasmid #59933 | |
| Sequence-based reagent | Alt-R CRISPR-Cas9 tracrRNA | IDT | Cat#: 1072533 | |
| Sequence-based reagent | crRNA (for cdk-8; gcn-1; R09F10.3; sfrp-1; Y75B8A.8) | this paper | CRISPR RNA guides. Sequences provided in Suppl. File 10 | |
| Sequence-based reagent | ssDORT (for cdk-8; gcn-1; R09F10.3; sfrp-1) | this paper | Single-stranded DNA oligonucleotide repair templates.Sequences provided in Suppl. File 10 | |
| Peptide, recombinant protein | Streptococcus pyogenes Cas9 nuclease V3 | IDT | Cat#:1081058 | |
| Software, algorithm | GATK | DOI: 10.1002/0471250953.bi1110s43 | RRID:SCR_001876 | v3.6 or v3.7 |
| Software, algorithm | breakdancer | DOI:10.1038/nmeth.1363 | RRID:SCR_001799 | v1.4.5-unstable-66-4e44b43 |
| Software, algorithm | pindel | DOI:10.1093/bioinformatics/btp394 | RRID:SCR_000560 | v0.2.5b9, 20160729 |
| Software, algorithm | Tablet | DOI:10.1093/bib/bbs012 | RRID:SCR_000017 | v1.17.08.17 |
| Software, algorithm | samtools | DOI:10.1093/bioinformatics/btp352 | RRID:SCR_002105 | 1.9 |
| Software, algorithm | bwa | PMID:19451168 | RRID:SCR_010910 | 0.7.12-r1044 or later |
| Software, algorithm | picard | http://broadinstitute.github.io/picard/ | RRID:SCR_006525 | 1.110 or later |
| Software, algorithm | snpEff | PMID:22728672 | RRID:SCR_005191 | 4.1 g up to 4.3 t |
| Software, algorithm | R project for statistical computing | R Core Team | RRID:SCR_001905 | v3.4.4 |
| Software, algorithm | R package ggplot2 | H. Wickham | RRID:SCR_014601 | v3.2.1 |
| Software, algorithm | R package gridExtra | Baptiste Auguie (2017) | https://CRAN.R-project.org/package=gridExtra | v2.3 |
| Software, algorithm | R package igraph | Csardi G, Nepusz T | https://igraph.org/r/ | v1.1.1 |
| Software, algorithm | R package stats | R Development Core Team, 2015 | https://www.R-project.org/ | v3.4.4 |
| Software, algorithm | R package fmsb | Minato Nakazawa (2019) | https://CRAN.R-project.org/package=fmsb | v0.6.3 |
| Software, algorithm | R package plyr | Hadley Wickham (2011) | 10.18637/jss.v040.i01 | v1.8.4 |
| Software, algorithm | R package reshape2 | Hadley Wickham (2007) | 10.18637/jss.v021.i12 | v1.4.3 |
| Software, algorithm | R package GenomicFeatures | DOI:10.1371/journal.pcbi.1003118 | RRID:SCR_016960 | v1.30.3 |
| Software, algorithm | R package rtracklayer | DOI:10.1093/bioinformatics/btp328 | http://www.bioconductor.org/ | v1.38.3 |
| Software, algorithm | R Studio Desktop | RStudio Team (2020) | Version 1.0.143 |
Additional files
-
Supplementary file 1
P3.p division frequency scoring.
n (last column) is the number of animals.
- https://cdn.elifesciences.org/articles/54928/elife-54928-supp1-v2.pscores.xlsx
-
Supplementary file 2
Accession numbers for the sequencing data.
- https://cdn.elifesciences.org/articles/54928/elife-54928-supp2-v2.xlsx
-
Supplementary file 3
Mutations found in MA lines.
The columns are named according to the vcf format. In addition, column I provides the identifier of the tested marker and column H whether it was validated. The lines highlighted with a red background are the causative mutations.
- https://cdn.elifesciences.org/articles/54928/elife-54928-supp3-v2.xlsx
-
Supplementary file 4
Genetic mapping of causative mutations in MA lines.
The first sheet provides the summary of the interval. Each successive sheet shows the backcross genotyping and phenotying (column F gives the statistical groups computed in Figure 3): 'AL' as in the ancestor line; 'MAL' as in the Mutation Accumulation line; ND: not determined; HET: heterozygote.
- https://cdn.elifesciences.org/articles/54928/elife-54928-supp4-v2.xlsx
-
Supplementary file 5
Sequences of the causal mutations in the MA lines and of the CRISPR edits.
- https://cdn.elifesciences.org/articles/54928/elife-54928-supp5-v2.docx
-
Supplementary file 6
List of pleiotropic phenotypes observed in selected Mutation Accumulation Lines and CRISPR genome editings.
- https://cdn.elifesciences.org/articles/54928/elife-54928-supp6-v2.xlsx
-
Supplementary file 7
Analysis of mutations found around the five causal mutations in the three comparison datasets.
(a) No mutations were found in the vicinity of the five causal mutations in the MA line dataset, and the regions do not contain a particularly high level of mutations/polymorphisms in the MMP and CeNDR datasets. (b) The second sheet provides the list of mutation accumulation lines from Saxena et al., 2019.
- https://cdn.elifesciences.org/articles/54928/elife-54928-supp7-v2.xlsx
-
Supplementary file 8
Strains used in this study.
The superscript 'CB' (e.g. N2CB) refers to the strain origin in Charles Baer's laboratory.
- https://cdn.elifesciences.org/articles/54928/elife-54928-supp8-v2.xlsx
-
Supplementary file 9
List of high-confidence variants between the C. briggsae strains HK104 and AF16.
File is in vcf format. This list was used as prior knowledge for the VQSR procedure computed with GATK (see Materials and methods).
- https://cdn.elifesciences.org/articles/54928/elife-54928-supp9-v2.vcf
-
Supplementary file 10
Genotyping primers for mutation accumulation lines.
(a) Genotyping of MA lines from this study. (b) Re-sequencing of MA lines from Saxena et al., 2019.
- https://cdn.elifesciences.org/articles/54928/elife-54928-supp10-v2.xlsx
-
Supplementary file 11
Oligonucleotides used for CRISPR/Cas9 genome edition.
- https://cdn.elifesciences.org/articles/54928/elife-54928-supp11-v2.xlsx
-
Transparent reporting form
- https://cdn.elifesciences.org/articles/54928/elife-54928-transrepform-v2.docx
Download links
A two-part list of links to download the article, or parts of the article, in various formats.
Downloads (link to download the article as PDF)
Open citations (links to open the citations from this article in various online reference manager services)
Cite this article (links to download the citations from this article in formats compatible with various reference manager tools)
A broad mutational target explains a fast rate of phenotypic evolution
eLife 9:e54928.
https://doi.org/10.7554/eLife.54928


