Cell lineage-dependent chiral actomyosin flows drive cellular rearrangements in early Caenorhabditis elegans development
- Max Planck Institute of Molecular Cell Biology and Genetics, Germany
- Biotechnology Center, TU Dresden, Germany
- Cluster of Excellence Physics of Life, TU Dresden, Germany
- Max Planck Institute for the Physics of Complex Systems, Germany
- Chair of Scientific Computing for Systems Biology, Faculty of Computer Science, TU Dresden, Germany
- Center for Systems Biology Dresden, Germany
- Department of Mathematics, Massachusetts Institute of Technology, United States
Figures
Figure 1 with 10 supplements

Chiral counter-rotating flows are cell-lineage specific.
(A) Representative images of cortical myosin (grey, NMY-2::GFP) for the first (P0, yellow) and the second (AB, blue) cell division of C. elegans embryos. Arrows indicate the cortical flow field as measured by PIV and time-averaged over 21 s and over the onset of cytokinesis. Arrow colors indicate the y-direction velocity (parallel to the cytokinesis furrow, coordinate systems are indicated). Dotted lines indicate cell boundaries, black boxes represent the regions of interest used for calculating velocities. Scale bar, 10 µm. (B) Histograms of the instantaneous chiral counter-rotating flow velocity (see Materials and methods for definition). Solid lines indicate the best-fit gaussian probability density function. Dotted vertical colored lines represent the mean , grey boxes represent the error of the mean. Thin black solid lines indicate a chiral flow velocity of zero. Inset, colored cells indicate the cell analyzed; AB lineage in blue, P/EMS lineage in yellow. (C) Dotted lines with shaded error region indicate the average myosin concentration profile along the long axis of the AB (blue) and P1 (orange) dividing cell, solid lines represent a best fit with a combined step and gaussian function (see Materials and methods) Inset, colored cells indicate the cell analyzed; grey stripe indicates the region used for averaging. (D) Average relative position of the cytokinetic ring along the long axis of the dividing cell for the first 6 cell divisions. Black thin lines in (C) and (D) indicate the center of the cell (n = 8 for all cell divisions). (E) Myosin asymmetry ratio (Anterior [NMY-2::GFP]/Posterior [NMY-2::GFP]) (see Materials and methods) for the first six-cell divisions along the long axis of the dividing cell (n = 8 for all cell divisions). Errors indicate the error of the mean at 95% confidence.
Figure 1—figure supplement 1
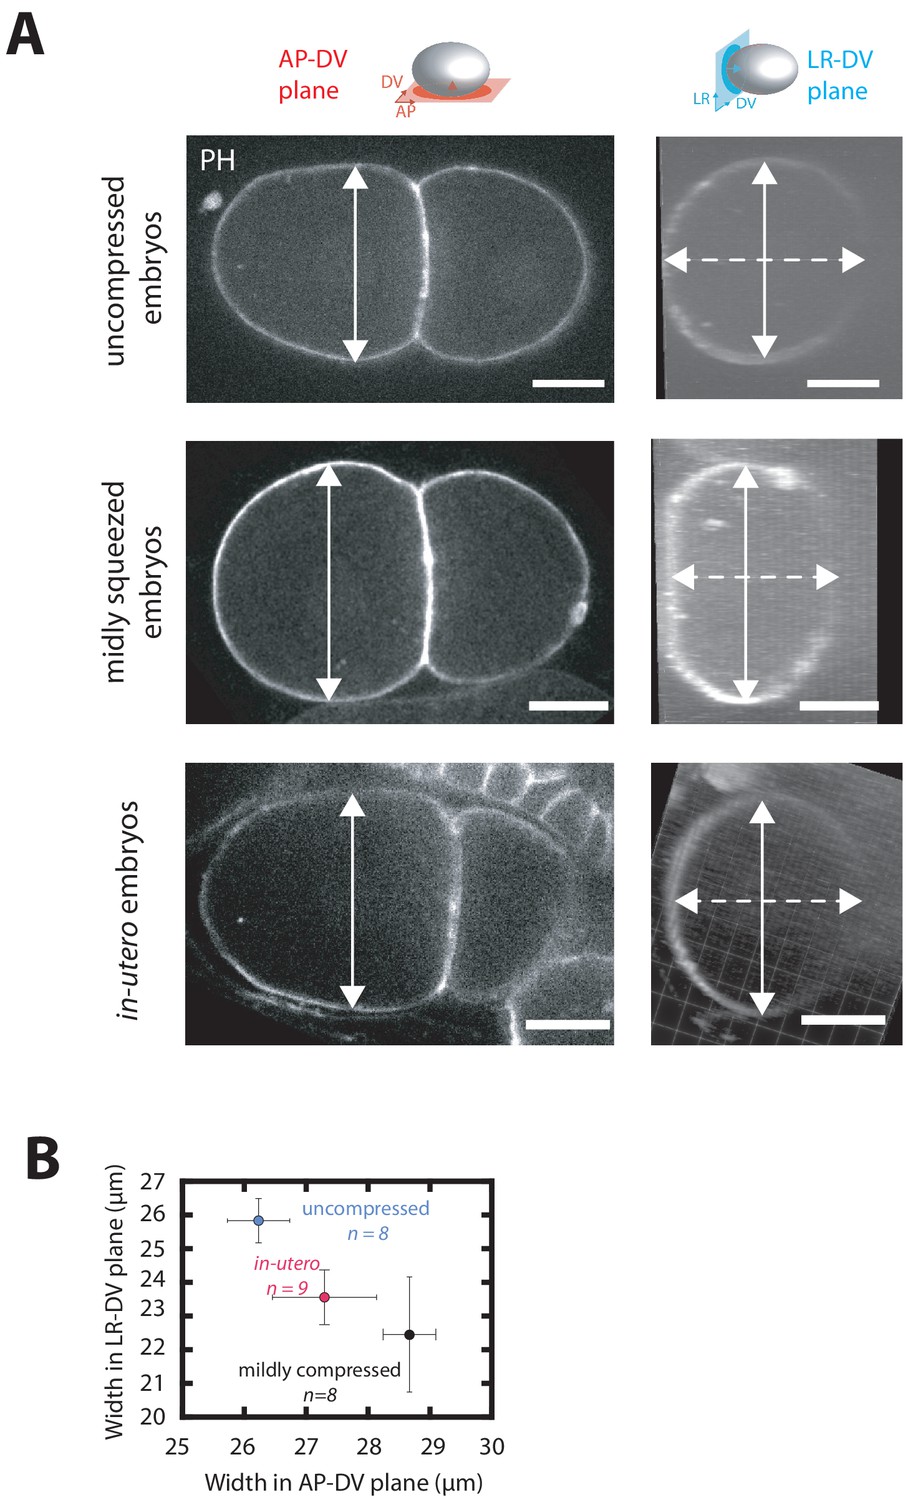
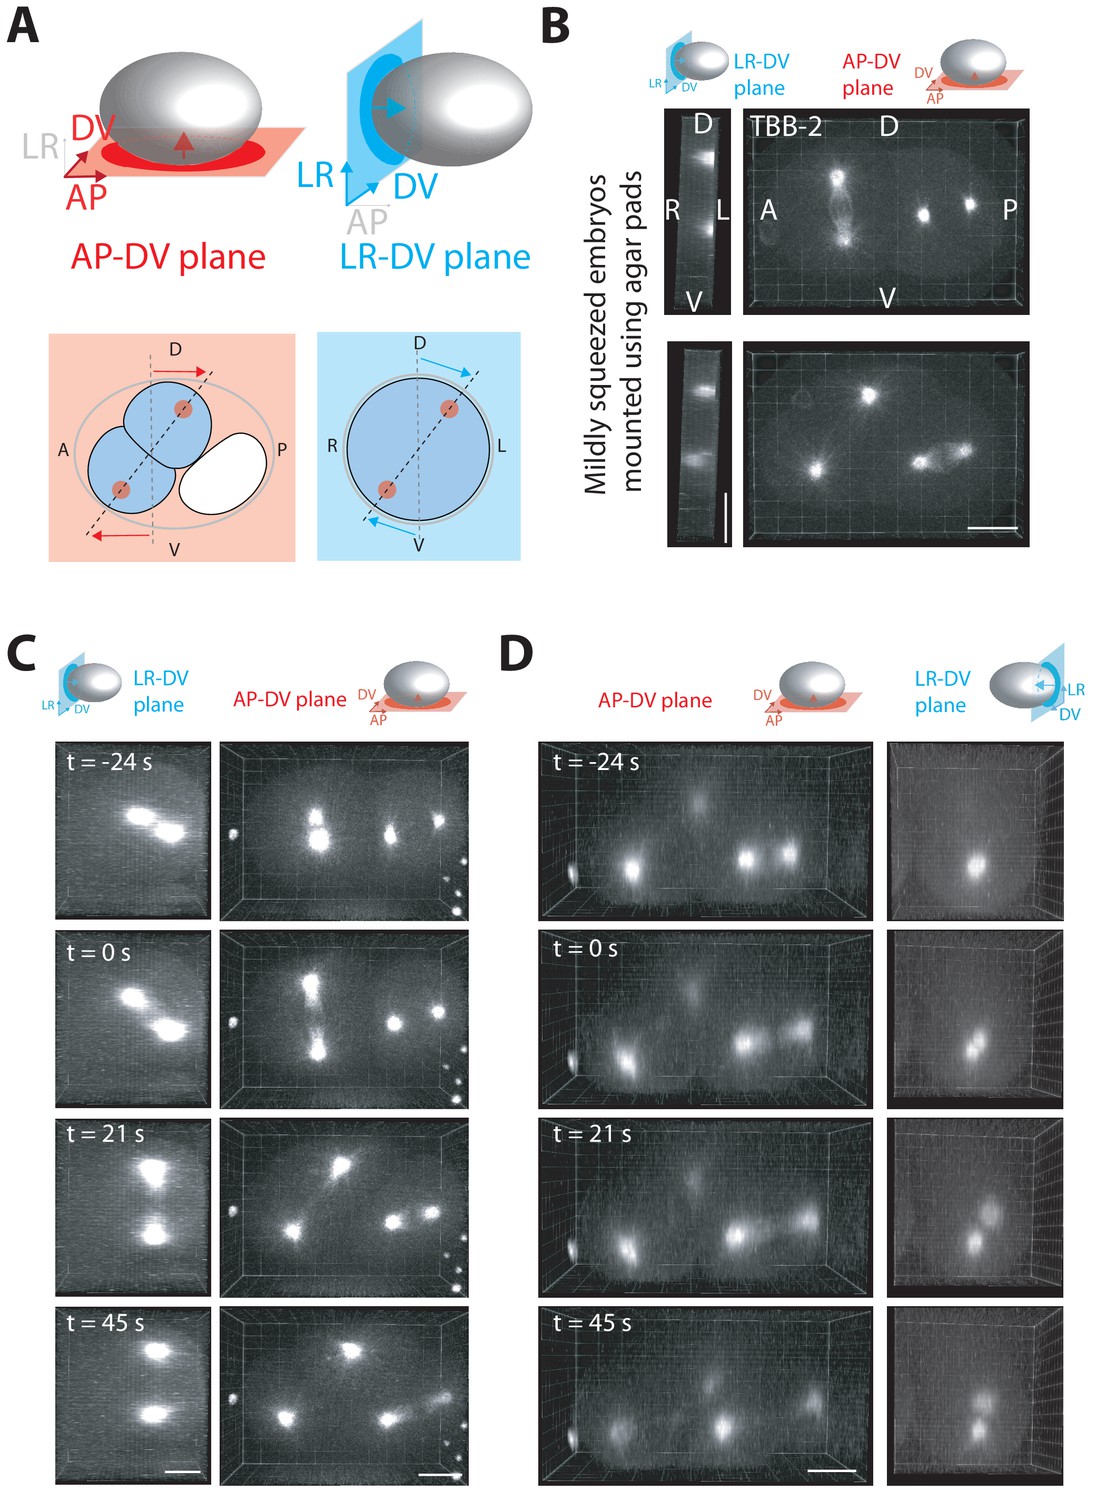
Effect of embryo compression on embryo thickness in AP-DV and LR-DV plane.
(A) Representative fluorescence images of two cell embryos projected onto the anteroposterior-dorsoventral (denoted AP-DV) plane (left) or the left-right-dorsoventral (denoted LR-DV) plane (right) mounted using three different methods: embedded in low-melt agarose (top), applied to an agarose pad (middle) and imaged in-utero (bottom). Solid white line marks embryo thickness in AP-DV plane whereas dotted white line indicates embryo thickness along the LR-DV plane. Scale bar 10 µm. Embryo schematic with the colored plane denotes the plane of projection and colored arrow inside the schematic indicates the direction of view. (B) Quantification of thickness of embryos in AP-DV and LR-DV plane as projected in (A).
Figure 1—figure supplement 2
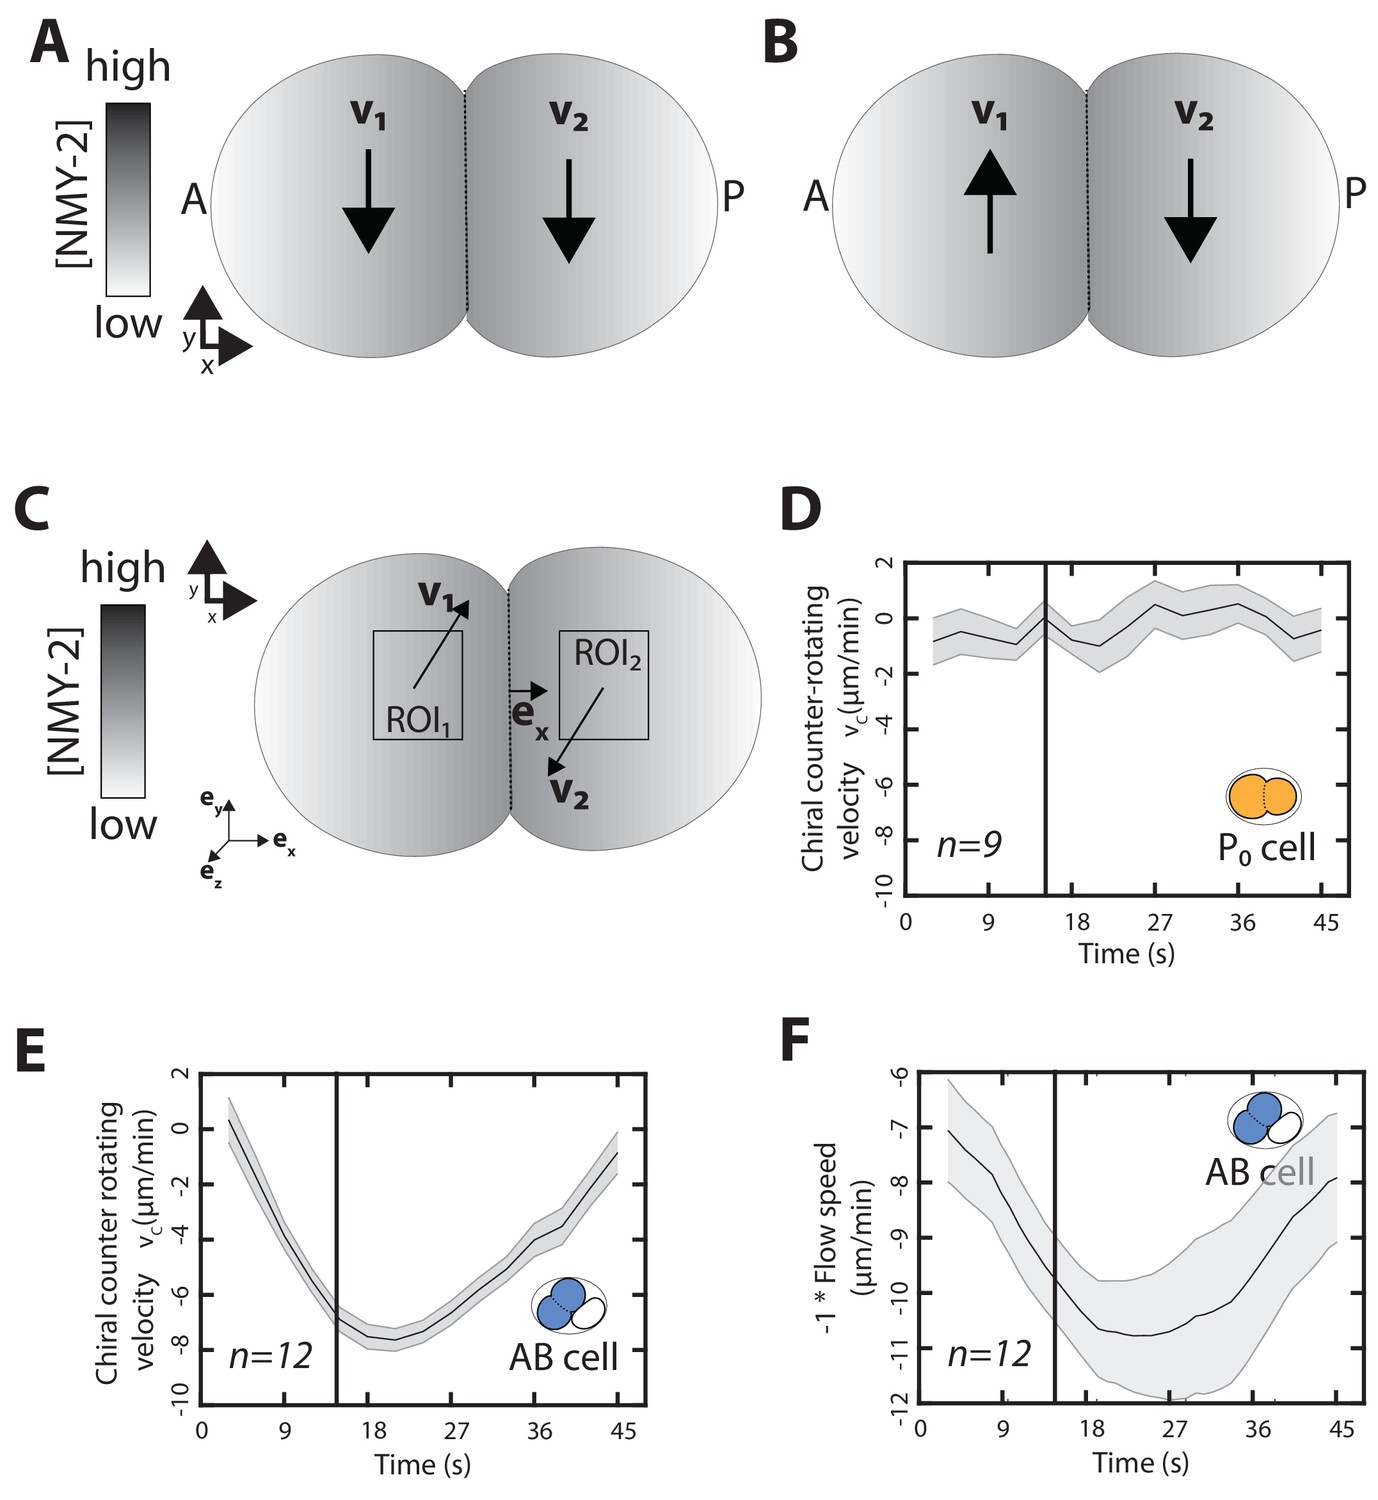
Time evolution of chiral counter-rotating velocity during cytokinesis.
(A,B) Simplified representative sketch of y-direction flows during cell divisions observed in early development. The cleavage furrow is represented by the dotted line and is marked by high concentration of myosin (grey-shaded area). Black arrows represent y-direction flow in the two halves of the the dividing cell. (A) depicts chiral net-rotating flows, observed in the P/EMS lineage, in which both halves move in the same direction. (B) depicts chiral counter-rotating flows, observed in the AB lineage, where the two halves of the dividing cell rotate in opposite direction. Notably, both these types of flow are chiral. (C) Schematic illustrating the measured chiral counter-rotating velocities in a dividing cell. . Here, , and are orthonormal vectors depicted in left corner. In this definition, the magnitude of gives us the speed of the flows and the sign of denotes the handedness of chiral counter-rotating flows. In this sketch, the counter-rotating pair has right-handedness as observed in the AB lineage (see Materials and methods for more information on definition of handedness and ; upper left indicates the coordinate system). (D, E) Chiral counter-rotating flow speed () measured over seven subsequent frames for different stages for (D) the P0 and (E) the AB cell from the beginning of cytokinesis until completion of cytokinesis. Vertical black line marks the 10% cytokinetic furrow ingression, used as a reference timepoint to measure . The curve represents the mean , grey-shaded bar indicates error of the mean at 95% confidence interval. Inset, colored cell indicates the cell analyzed. (F) Total flow speed measured over seven subsequent frames for different stages for the AB cell from the onset of cytokinesis until late cytokinesis. Vertical black line marks the 10% cytokinetic furrow ingression, used as a reference timepoint to measure flow speed. The curve represents the mean flow speed, grey-shaded bar indicates error of the mean at 95% confidence interval.
Figure 1—figure supplement 3
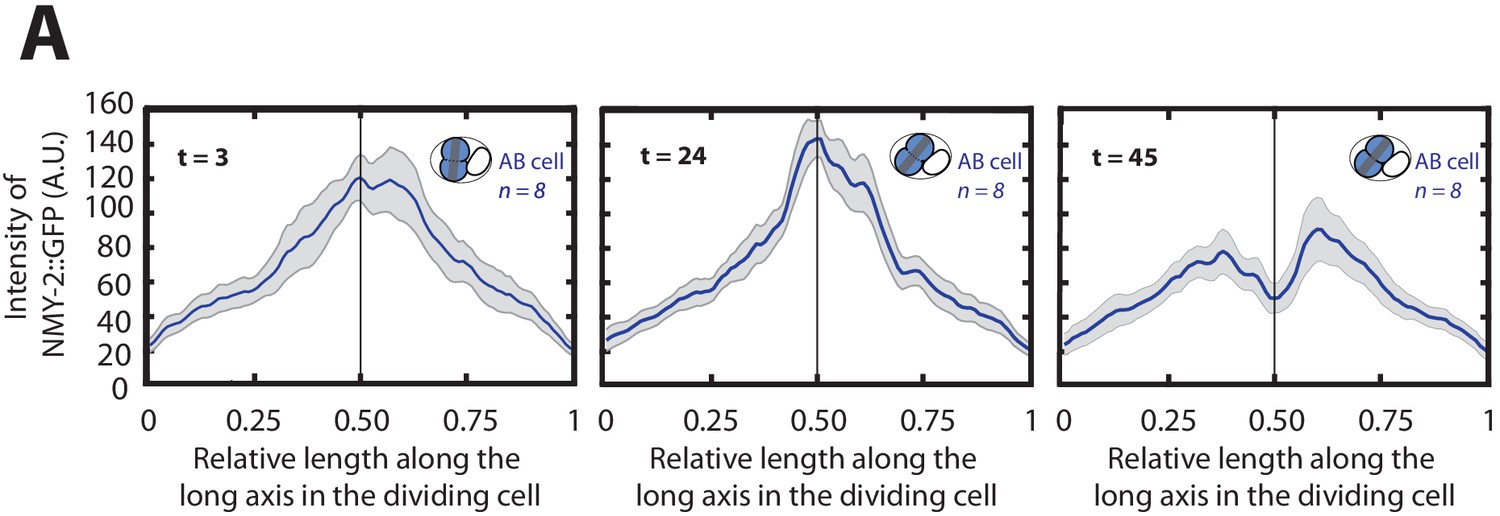
Evolution of myosin distibution profile along the cell division axis of the AB cell.
(A) Mean myosin concentration profile along the cell division axis of the AB cell at three timepoints: 3 s (left), 24 s (middle) and 45 s (right) after the onset of cytokinesis. Black vertical line indicates the center of the cell.
Figure 1—figure supplement 4
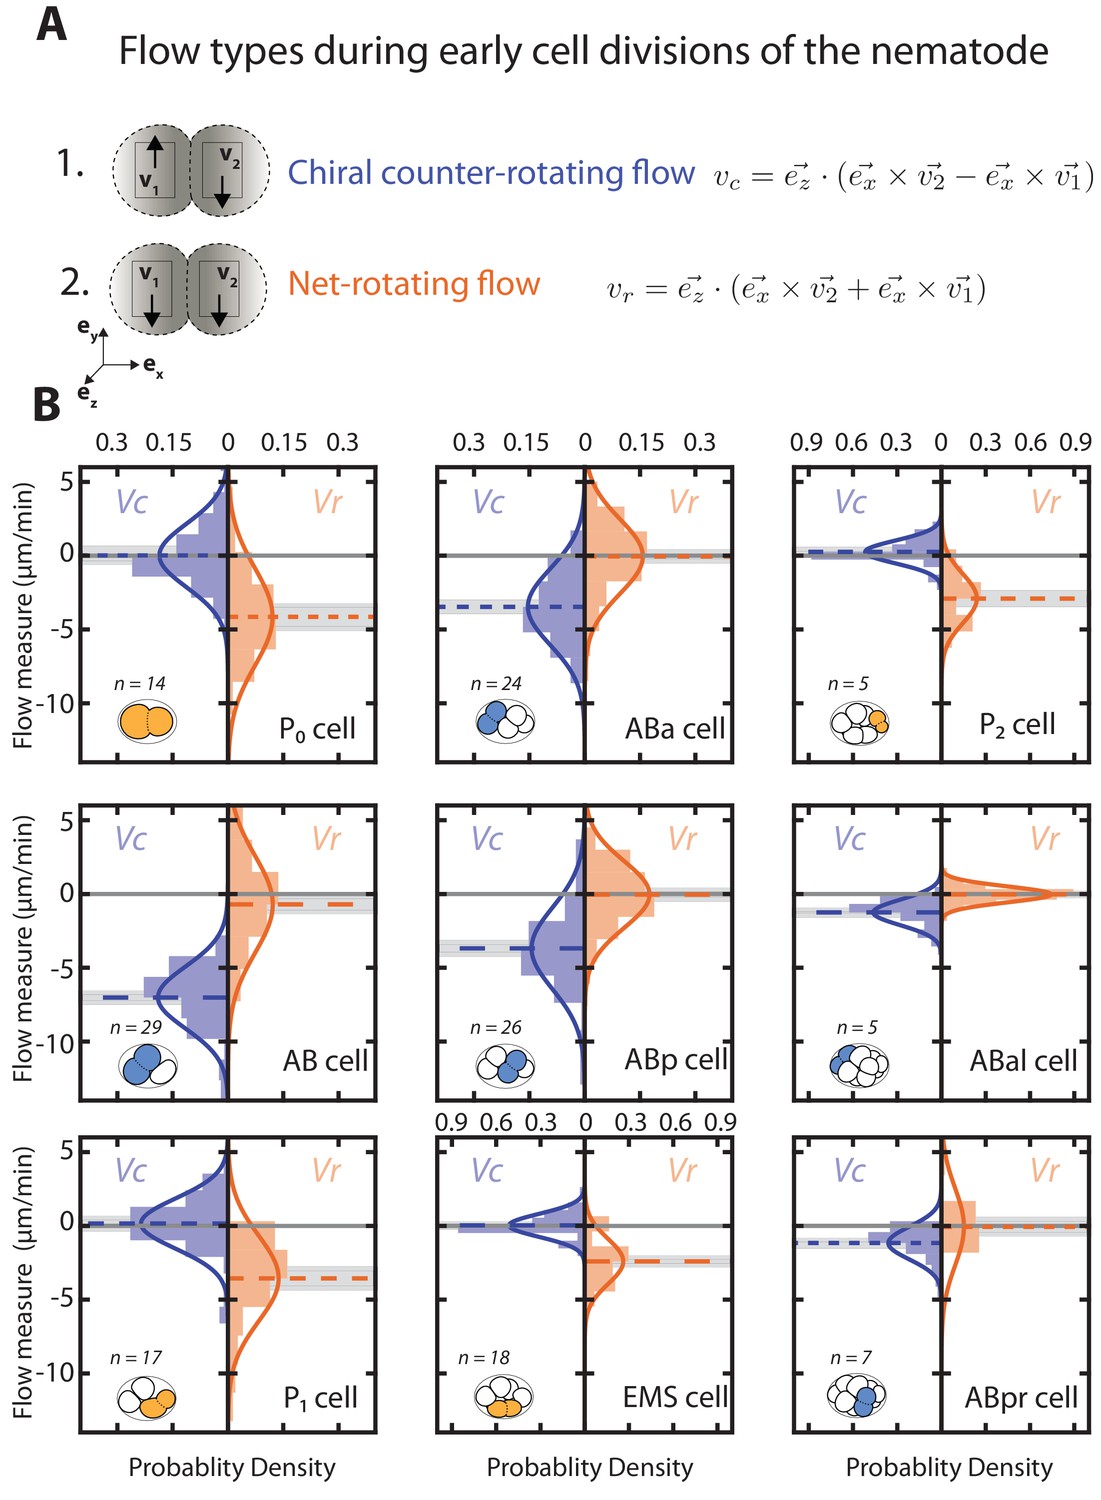
Early cell divisions display different types of rotatory flows.
(A) Schematics of chiral counter-rotating flows (upper part) and net-rotating flows (lower part) observed in the AB and P/EMS lineage respectively. Arrows mark flow direction. When the rotatory flows in the two halves of the dividing cell counter-rotate, is maximum in magnitude and is minimum in magnitude. This type of flow is seen in the case of cells of AB lineage. However, when rotatory flows in the two halves of the cell rotate in the same direction, is minimum and is maximum. Such a flow is observed in the case of cells of the P/EMS lineage. (B) Histograms of the instantaneous chiral counter-rotating flow velocity (left; blue) and instantaneous net-rotating velocity (right; orange) plotted for first nine cell divisions. and are calculated with denoted equations in A (see Materials and methods for more information). Solid lines indicate the best-fit gaussian probability density function. Dotted colored lines represent the mean on the left and mean on the right, grey shaded bar represent the error of the mean at 95% confidence interval. Thin black solid lines indicate a chiral flow velocity of zero. Inset, colored cells indicate the cell analyzed, AB lineage in blue and P/EMS lineage in orange.
Figure 1—figure supplement 5
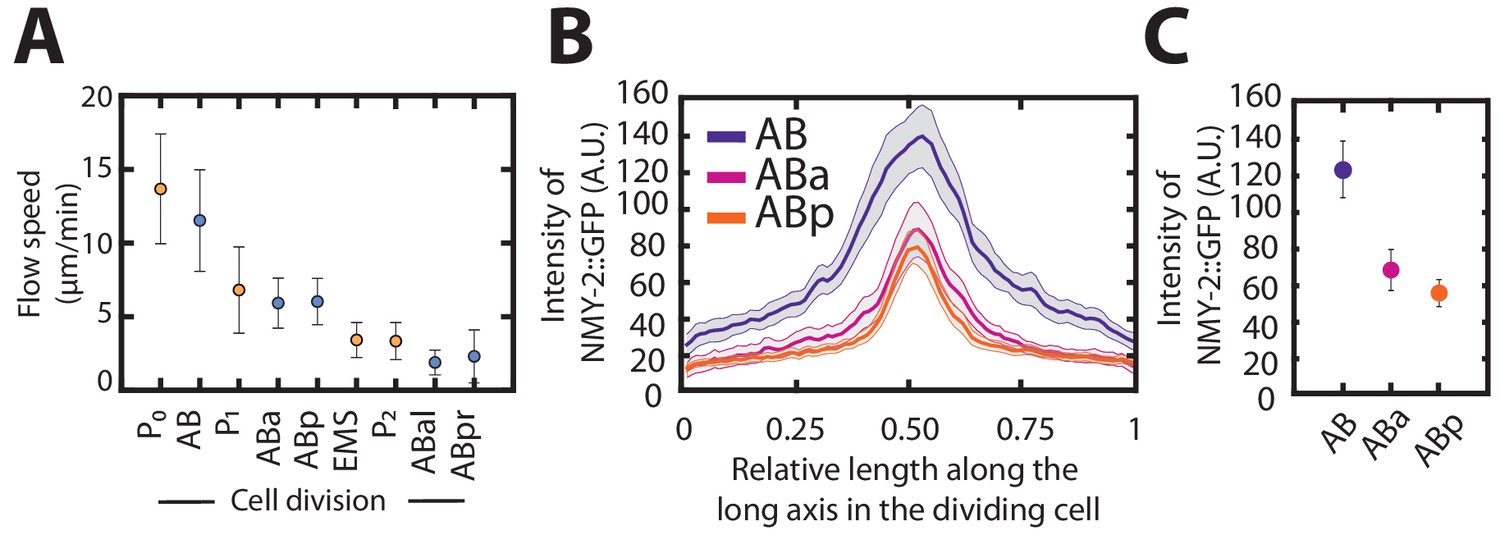
Myosin density and total flow velocity in development.
(A) Mean flow speeds for the first nine embryonic cell divisions. Colors indicate the lineage of the cell analyzed. (B) Mean myosin concentration profile along the cell division axis for the AB, ABa and ABp cell. (C) Mean myosin intensity levels in the cytokinetic ring for AB, ABa and ABp cells. The mean was taken from the central 20% of relative length along the cell division axis. Shaded errors and error bars indicate the error of mean at 95% confidence.
Figure 1—figure supplement 6
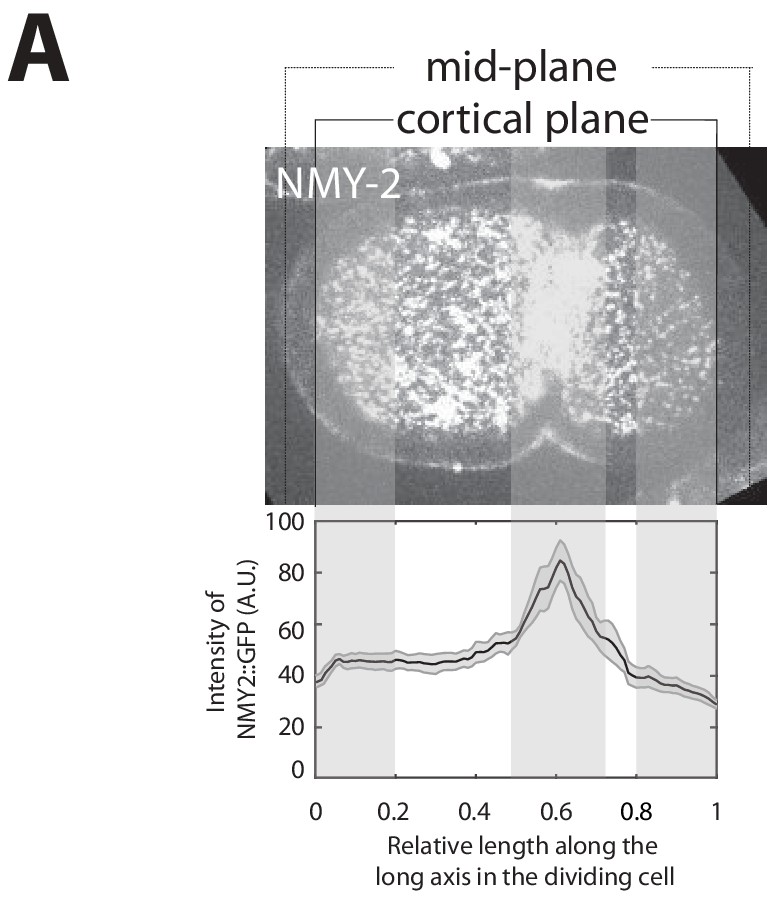
Determining myosin ratio during cell division.
(A) Illustration of mid-plane and cortical image of NMY-2::GFP marked by a dotted and solid line, respectively. Solid black line with shaded error region indicate the average myosin concentration profile along the long axis of the P0 cell. Shaded vertical bars (left and right) indicate 20% outer segments over the myosin intensity profile along long axis of the dividing P0 cell. Middle bar indicates myosin intensity recruited by cytokinetic ring in ingressing furrow. Black thin line indicate center of the cell.
Figure 1—figure supplement 7
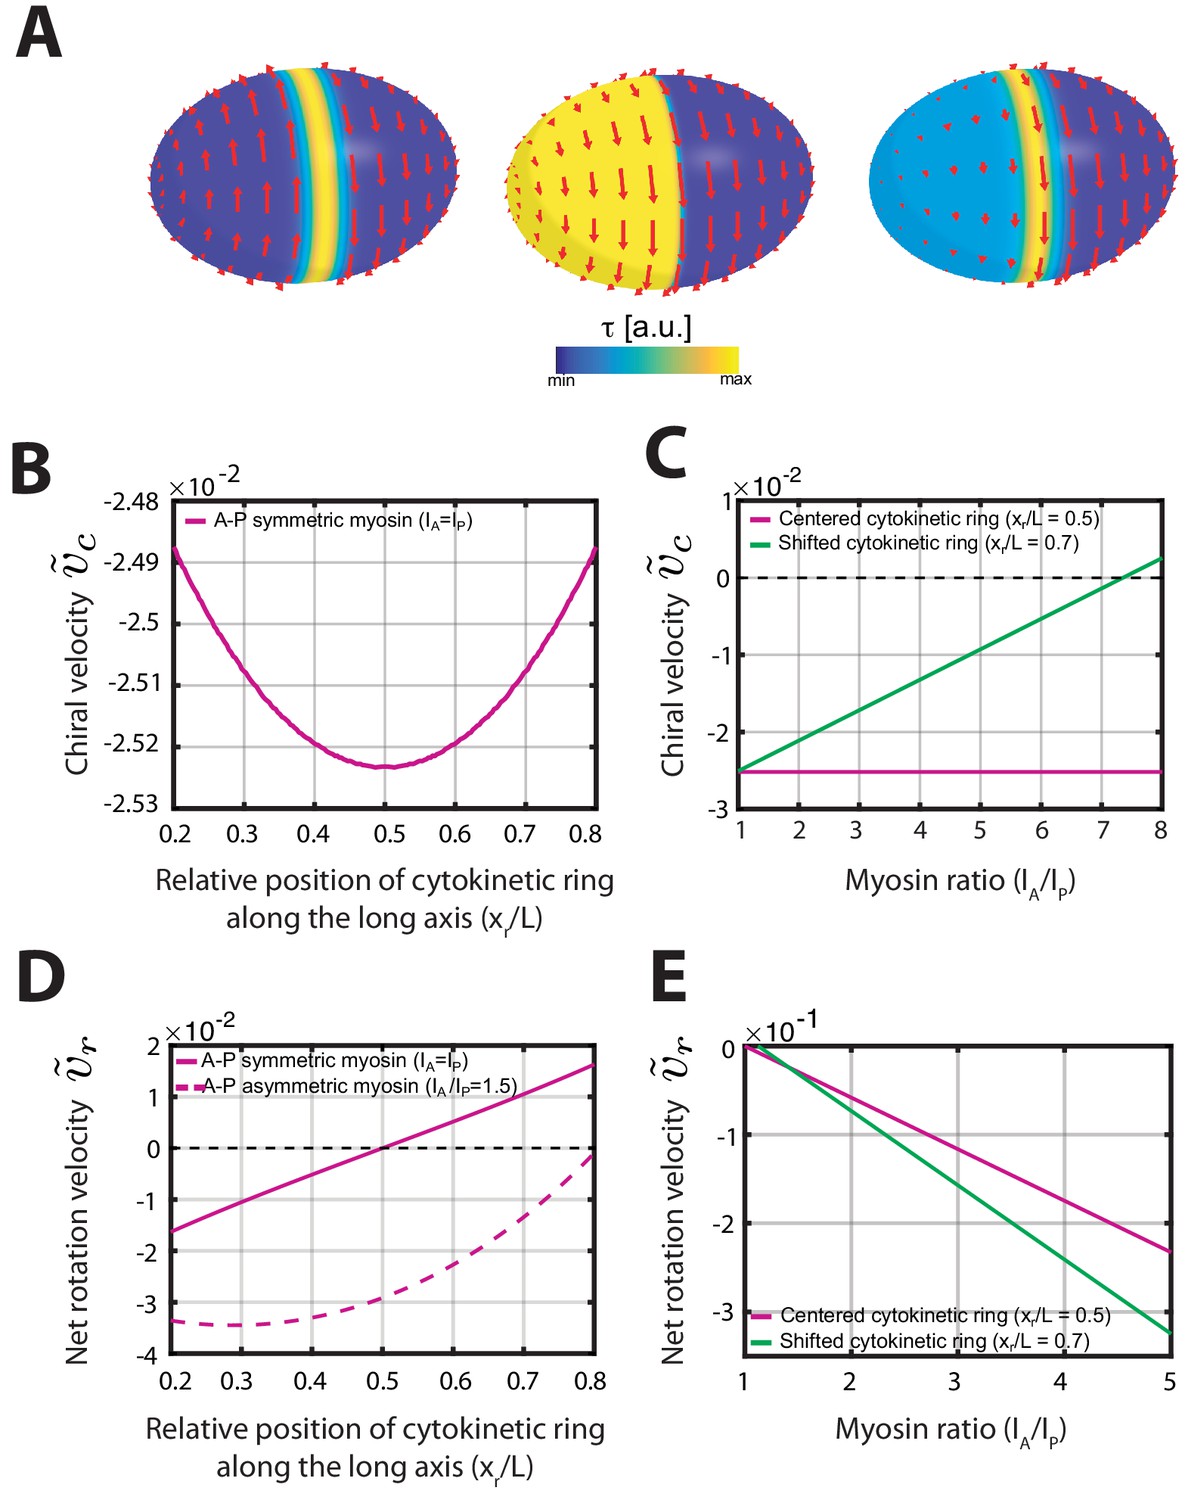
Active chiral fluid theory can recapitulate the flows observed during early development.
(A) Active chiral thin film model Equation S2 solved on an ellipsoidal surface for three different profiles of active torques . Left: A centered ring of active torques (described by a Gaussian of width , where is the meridional length on the surface from one pole to another. Active torques organized in this fashion lead to counter-rotating flows. Middle: Pole-to-pole asymmetry of active torques described by an error function with step width (see Equation 5 in Materials and methods). Such a large-scale asymmetry leads to net-rotating flows. Right: Flows that result from combined contributions of a centered ring and a large-scale asymmetry of active torques. (B– E) Properties of counter-rotating and net-rotating flows in a minimal model (Fixed parameters: , , ). (B) Chiral counter-rotating velocity for a symmetric myosin distribution and varying position of the contractile ring. has a weak maximum for a centered contractile ring at . (C) Chiral counter-rotating velocity for varying asymmetry of myosin between anterior and posterior poles. While is independent of any myosin asymmetry for a centered contractile ring (magenta curve), counter-rotating flows may vanish for sufficiently large myosin asymmetries, if the contractile ring is positioned off-center (green curve). (D) Net-rotating flow velocity for varying position of the contractile ring. If , net-rotating flows vanish for a centered contractile ring (solid line). In the presence of a sufficiently large anterior-posterior myosin asymmetry one finds for any ring position (dashed curve). (E) Net-rotating velocity for varying asymmetry of myosin between anterior and posterior poles. Irrespective of the contractile ring position, myosin asymmetries (here shown for ) generally contribute to net-rotating flows.
Figure 1—figure supplement 8
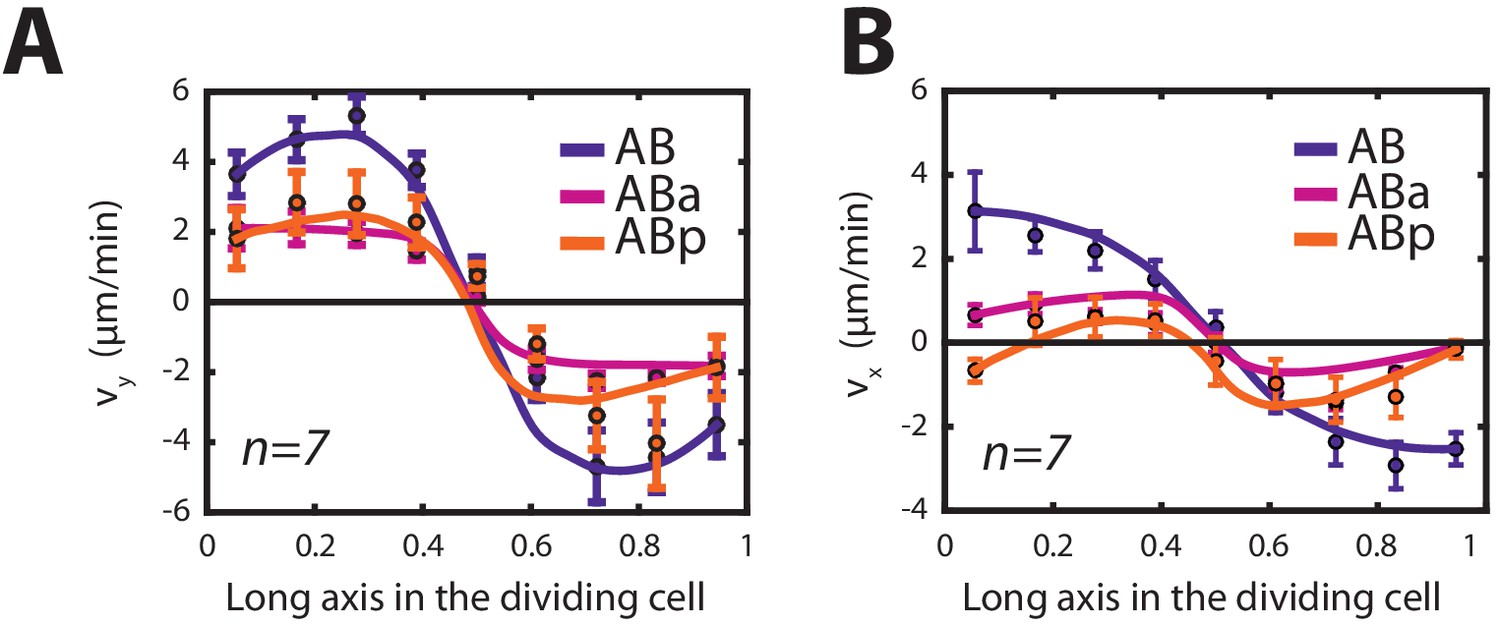
Thin film active chiral fluid theory (see Appendix) can recapitulate the contractile and rotatory flows observed in the cells of the AB-lineage.
(A, B) Velocity profiles (black filled circles) along the long axis of the dividing cell and theoretical prediction (solid line) for (A) chiral counter-rotating flow velocity and (B) contractile on-axis flow velocity in the cells belonging to the AB lineage (blue, AB; magenta, ABa; orange, ABp) obtained from thin film active chiral fluid theory using NMY-2::GFP gradients measured during cytokinesis. The fitting parameters used are given in Appendix 1—table 1. For the AB cell, a representative NMY-2::GFP gradient is shown in Figure 1C.
Figure 1—figure supplement 9
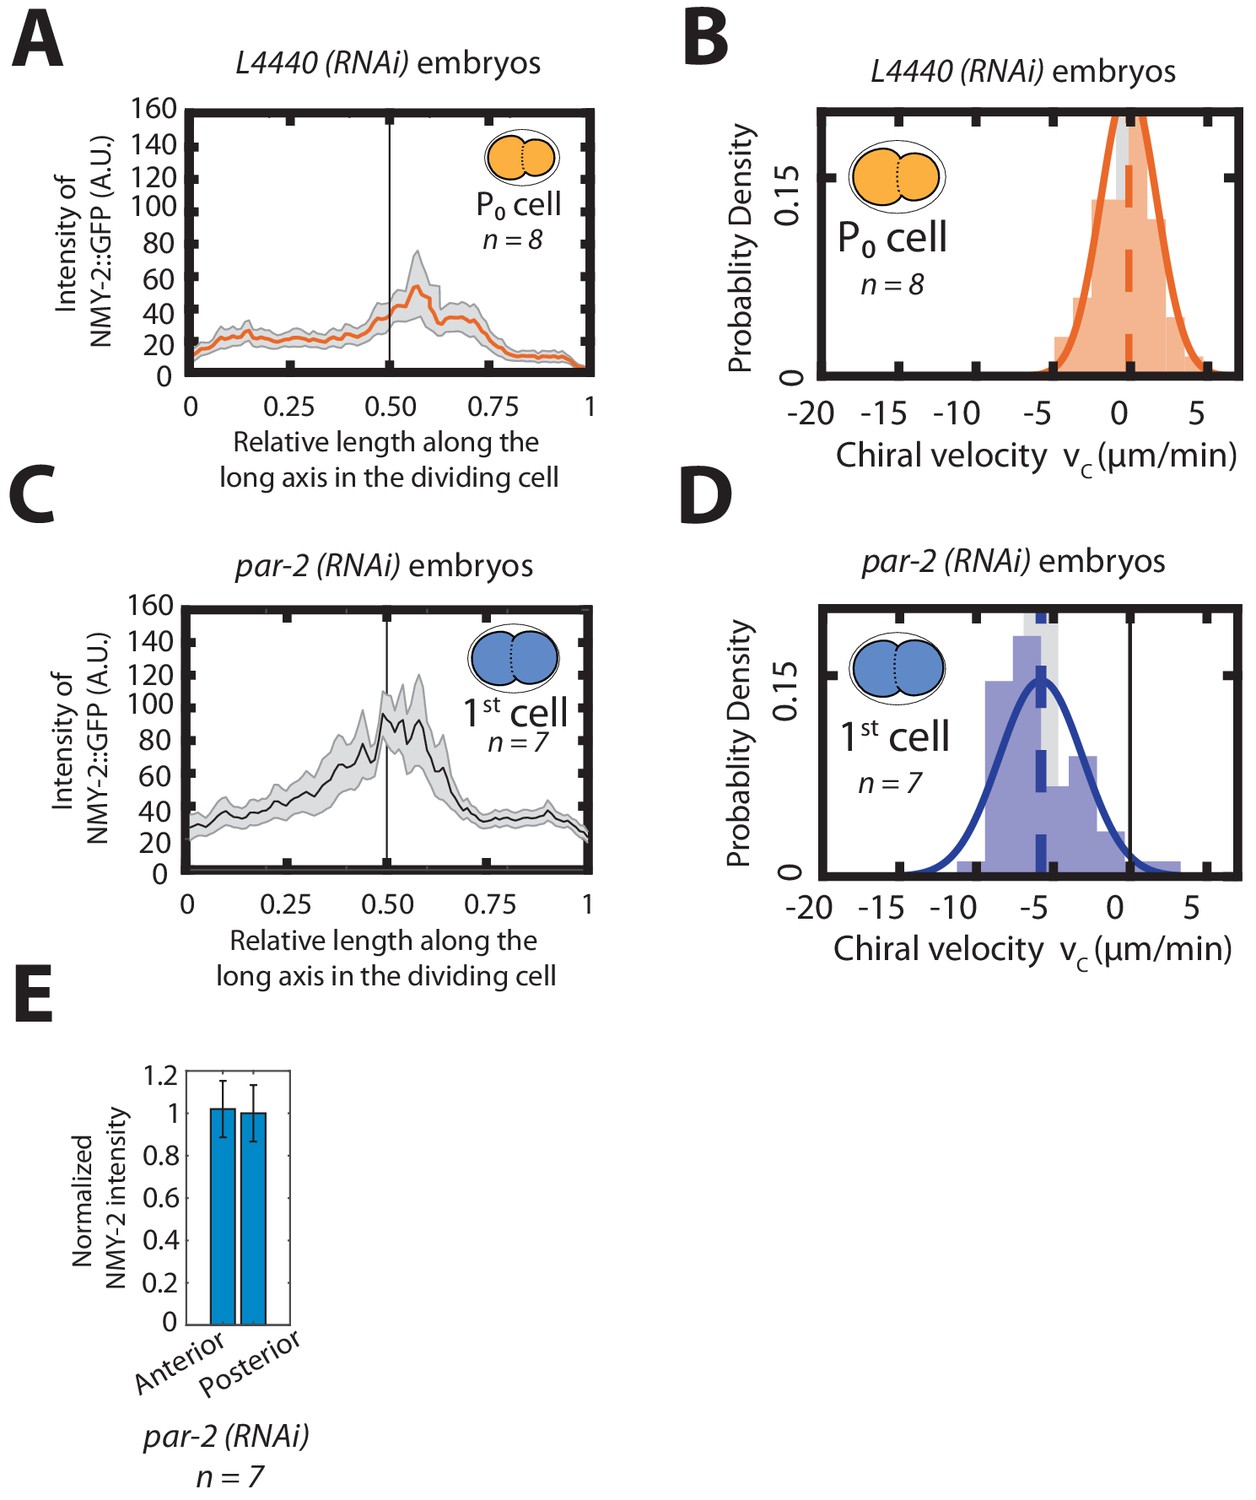
Chiral counter-rotating flows during first cell division in par-2 (RNAi) embryos.
(A, C) Histogram of instantaneous chiral counter-rotating velocity for the first, P0 cell division in, control (A) and par-2 (RNAi) embryos (C). Solid line indicate the best fit Gaussian probability density function. Dotted vertical lines indicate mean ; grey boxes represent the error of the mean at a 95% confidence. (B, D) Mean myosin concentration profile along the cell division axis for the P0 cell in control (B) and par-2 (RNAi) embryos (D). Inset, colored cells indicate the cell analyzed; grey stripe indicate the region used for averaging. (E) Normalized myosin intensity in the anterior and posterior sides upon par-2 (RNAi).
Figure 1—figure supplement 10
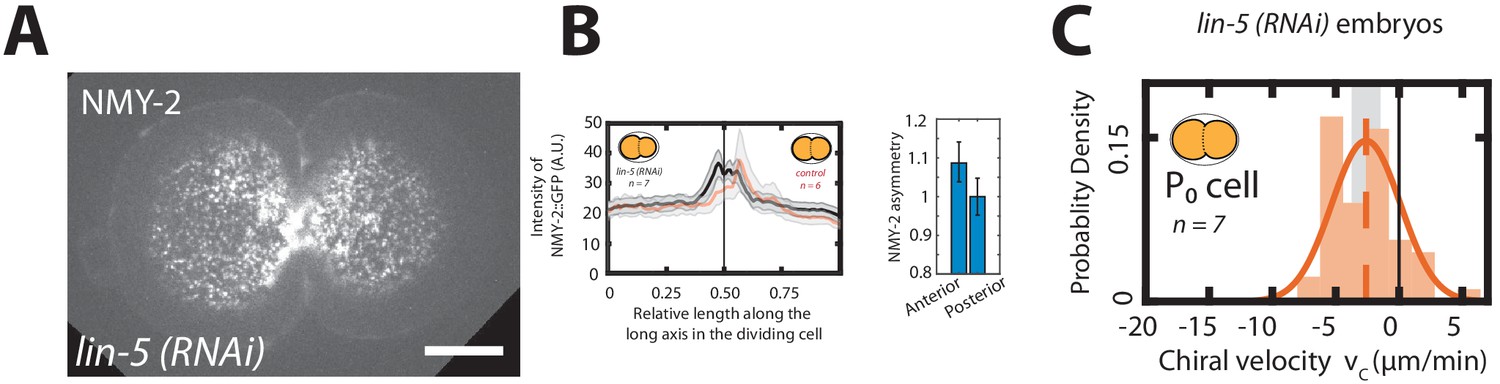
Symmetric cell division is required for chiral flows to emerge.
(A) Representative fluorescence image for the P0 cell division upon lin-5 (RNAi) in an embryo labeled with NMY2::GFP. (B) Mean myosin concentration profile along the cell division axis of the P0 cell in control and lin-5 (RNAi) embryos. Vertical black line indicate center of the cell. Right, Myosin asymmetry ratio (Anterior [NMY-2::GFP]/Posterior [NMY-2::GFP]) for control and lin-5 (RNAi) during the first, P0 cell division. (C) Histogram of instantaneous chiral counter-rotating velocity for the first, P0 cell division in lin-5 (RNAi) embryos. Solid line indicate the best fit Gaussian probability density function. Dotted vertical lines indicate mean .
Figure 2
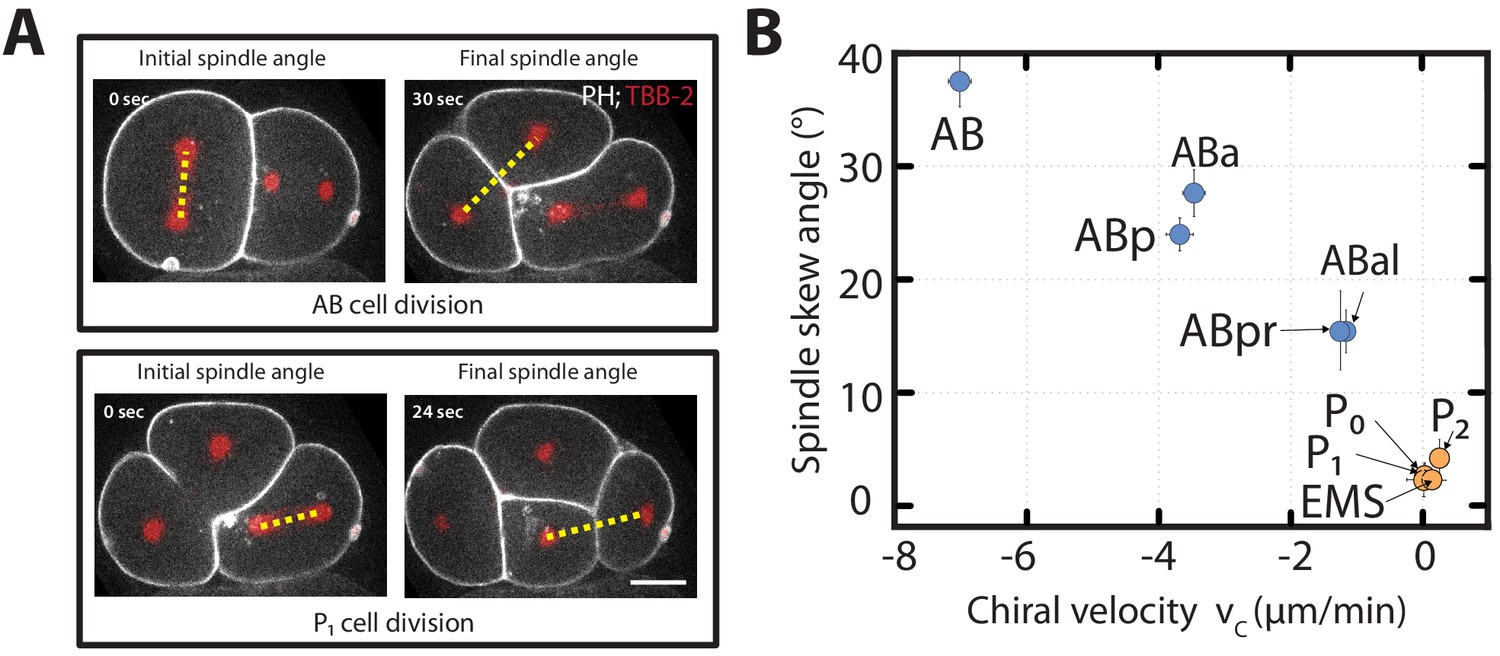
Chiral counter-rotating flow velocity and spindle skew decreases as development progresses.
(A) Representative images show the angle of the mitotic spindle (yellow dotted line) before the onset (left) and at the end (right) of the second (AB, top) and the third (P1, bottom) cell division. White, cell membrane imaged by PH::GFP; red, spindle poles as imaged by TBB-2::mCherry. (B) Spindle skew angle (final minus initial spindle angle) vs. chiral velocity for the first nine cell divisions (N = 8 for all cell diviisons).
Figure 3 with 2 supplements
Chiral counter-rotating flows are cell-lineage dependent.
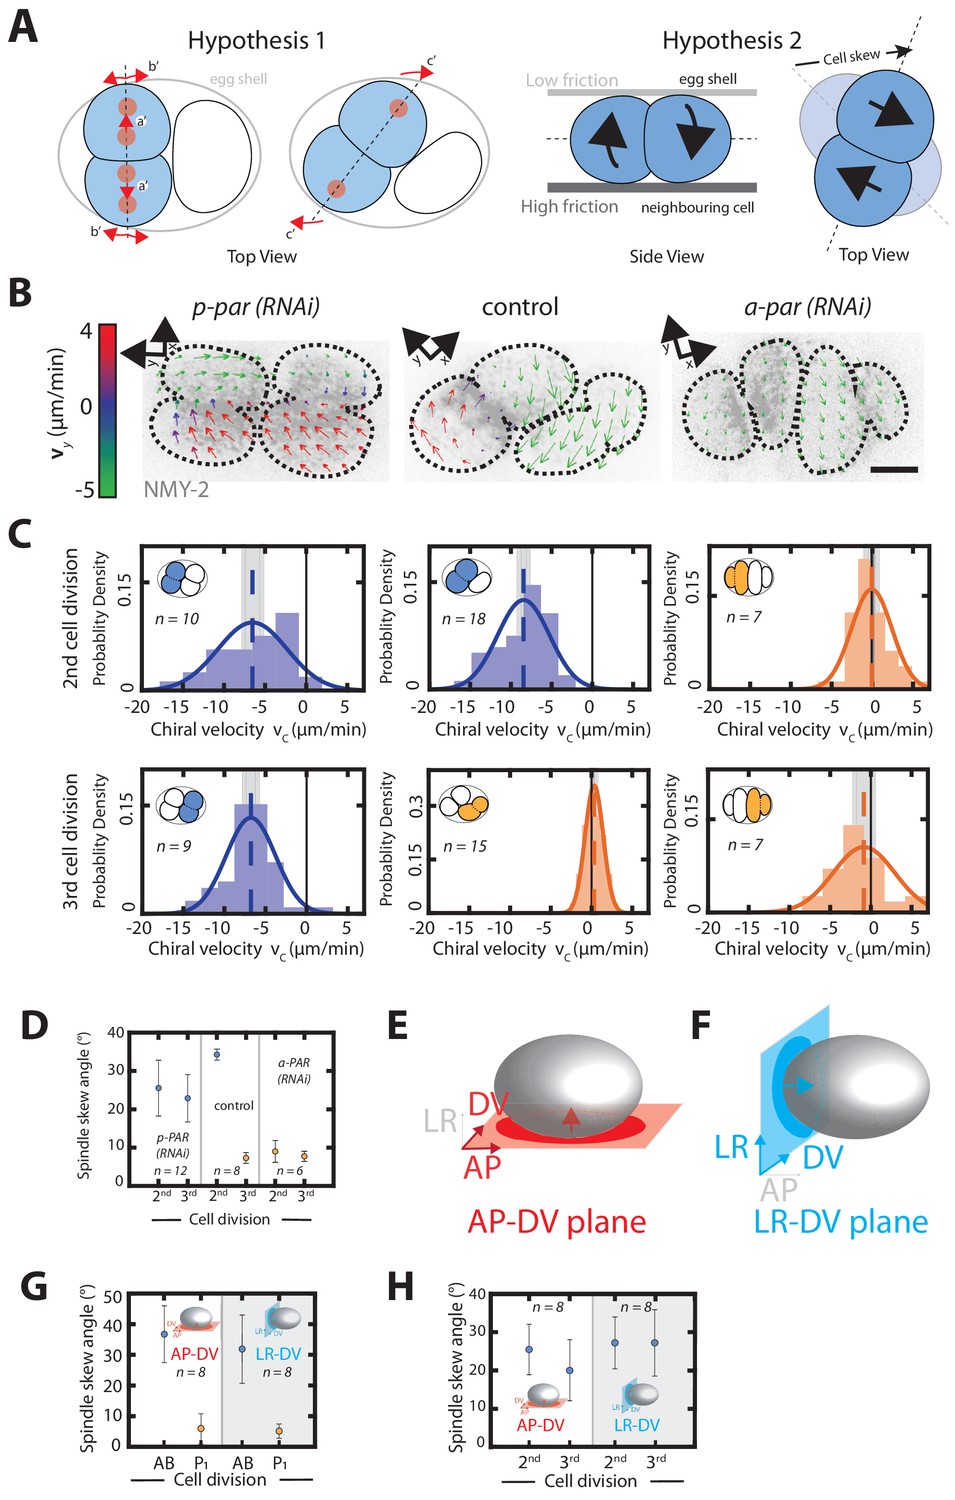
(A) Possible mechanisms of spindle skew and cell rearrangement. Hypothesis one: spindle skews are driven by spindle elongation. The mitotic spindle initially elongates along the dorsoventral axis (a’ and b’), but then skews (c’) because there is not enough space given the physical constraints imposed by the eggshell. Dashed line depicts the cell division axis, red dots depict spindle poles, arrows indicate spindle pole movements. Hypothesis two: spindle skews are driven by counter-rotating flows of the dividing cell halves. Left: top view, right: side view. Chiral counter-rotation of the two halves of a dividing cell gives rise to a cell skew if the dividing cell experiences non-uniform friction with its surroundings, e.g. a lower friction with the eggshell above and a higher friction with the cell below. (B) Representative images of cortical myosin (grey, NMY-2::GFP) for the second and the third cell division of C. elegans embryos. Arrows indicate the cortical flow field as measured by PIV and time-averaged over 21 s and over the onset of cytokinesis. Arrow colors indicate the y-direction velocity (parallel to the cytokinesis furrow, coordinate systems are indicated). (C) Histograms of the instantaneous chiral counter-rotating flow velocity for par perturbations (see Materials and methods for definition). Solid lines indicate the best-fit gaussian probability density function. Dotted vertical colored lines represent the mean , grey boxes represent the error of the mean. Thin black solid lines indicate a chiral flow velocity of zero. Inset, colored cells indicate the cell analyzed; AB lineage in blue, P/EMS lineage in orange. (D) Spindle skew angle for control (L4440), par-2; chin-1; lgl-1 (RNAi) and par-6 (RNAi) embryos. (E, F) Schematic of a C. elegans embryo. 3-D recordings capturing spindle pole movements and corresponding spindle skews were projected on either the (E) anteroposterior-dorsoventral (AP-DV) plane (red) or the (F) left-right-dorsoventral (LR-DV) plane (blue). (G, H) Spindle skew angles during the second and third cell division in control (G) and upon par-2 (RNAi) (H) projected onto the anteroposterior-dorsoventral plane (termed AP-DV plane, left) or onto the dorsoventral-left-right plane (termed LR-DV plane, right). The embryo schematic denotes the plane of projection (rectangle) and the direction of view (arrow) as described above. Scale bars, 10 µm. Errors indicate the error of the mean at 95% confidence.
Figure 3—figure supplement 1
3-D spindle skew dynamics in the AB cell and the P1 cell.
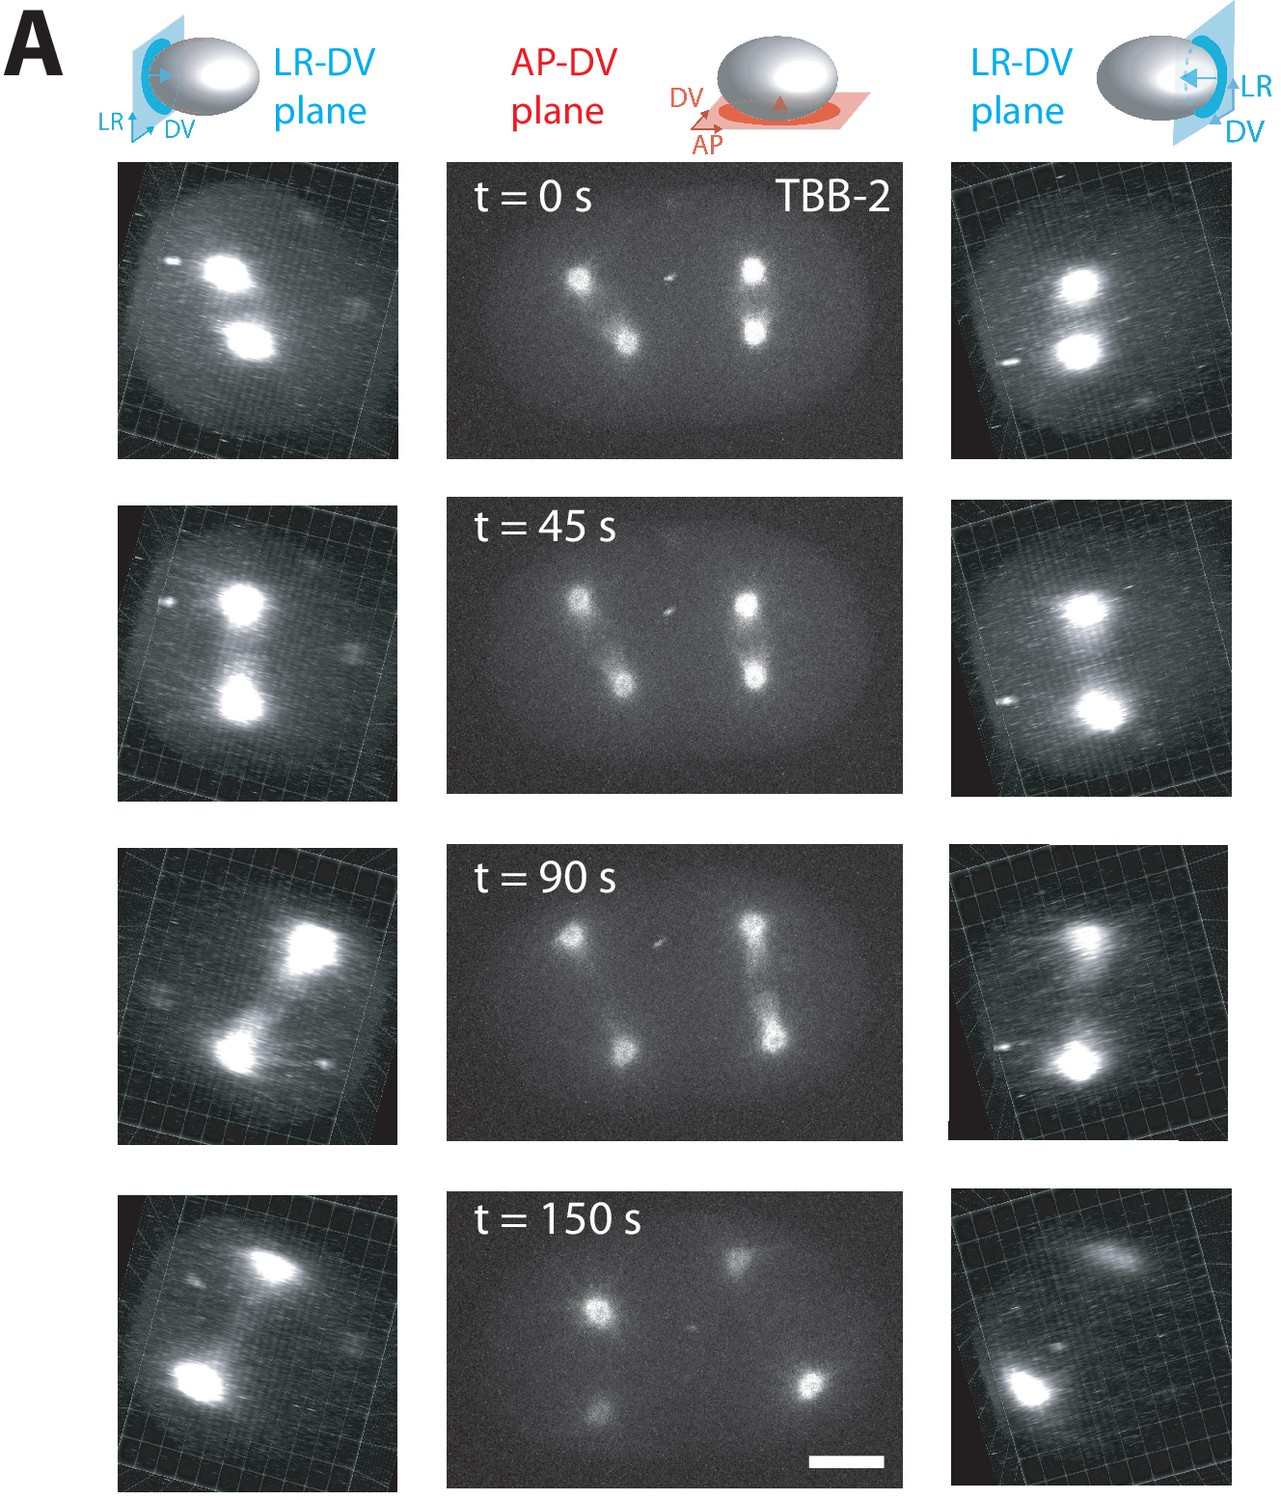
(A) Top panels: schematics of a C. elegans embryo with the anteroposterior-dorsoventral (AP-DV) projection plane (red) and the left-right-dorsoventral (LR-DV) projection plane (blue) indicated. Arrows indicate the direction of the projection. Bottom panels: Schematics of a two cell embryo projected onto the AP-DV plane (red) or LR-DV plane (blue) with the spindle skew indicated. The dotted grey line marks the initial cell division axis and the dotted black line marks the final cell division axis. Arrows indicate the direction of spindle pole (red circles) movements during cytokinesis. (B) Representative fluorescence images of a two cell embryo expressing a tubulin marker (TBB-2::mCherry) at anaphase onset (top) and at the end of cytokinesis (bottom) in mildly compressed embryos mounted using the agar pad method. Left panels show projections onto the left-right-dorsoventral plane (denoted LR-DV), and right panels show projections onto the anteroposterior-dorsoventral plane (denoted AP-DV). (C) Representative fluorescence images of a two-cell embryo expressing TBB-2::mCherry undergoing AB cell division in uncompressed embryos mounted by embedding in low-melt agarose. Projections as in (A). (D) Representative florescence images of three cell embryo expressing TBB2::mCherry undergoing P1 cell division in uncompressed embryos mounted using low-melt agar method. Projections as in (A). Scale bar 10 µm. Embryo schematic denotes the plane of projection marked by the rectangle and arrow indicates the direction of view.
Figure 3—figure supplement 2
3-D Spindle skew dynamics in par-2 (RNAi) embryos.
(A) Representative fluorescence images of a two-cell embryo expressing TBB2::mCherry upon par-2(RNAi) undergoing cell division mounted by embedding in low-melt agarose. Left panels show projections onto the dorsoventral-left-right plane, middle panels show projections onto the anteroposterior-dorsoventral plane and right panels show projections onto the dorsoventral-right-left plane. Note that right and left panels are both viewing along the anteroposterior axis but in opposite directions. Scale bar 10 µm. Embryo schematic denotes the plane of projection marked by the rectangle and arrow indicates the direction of view.
Figure 4 with 2 supplements
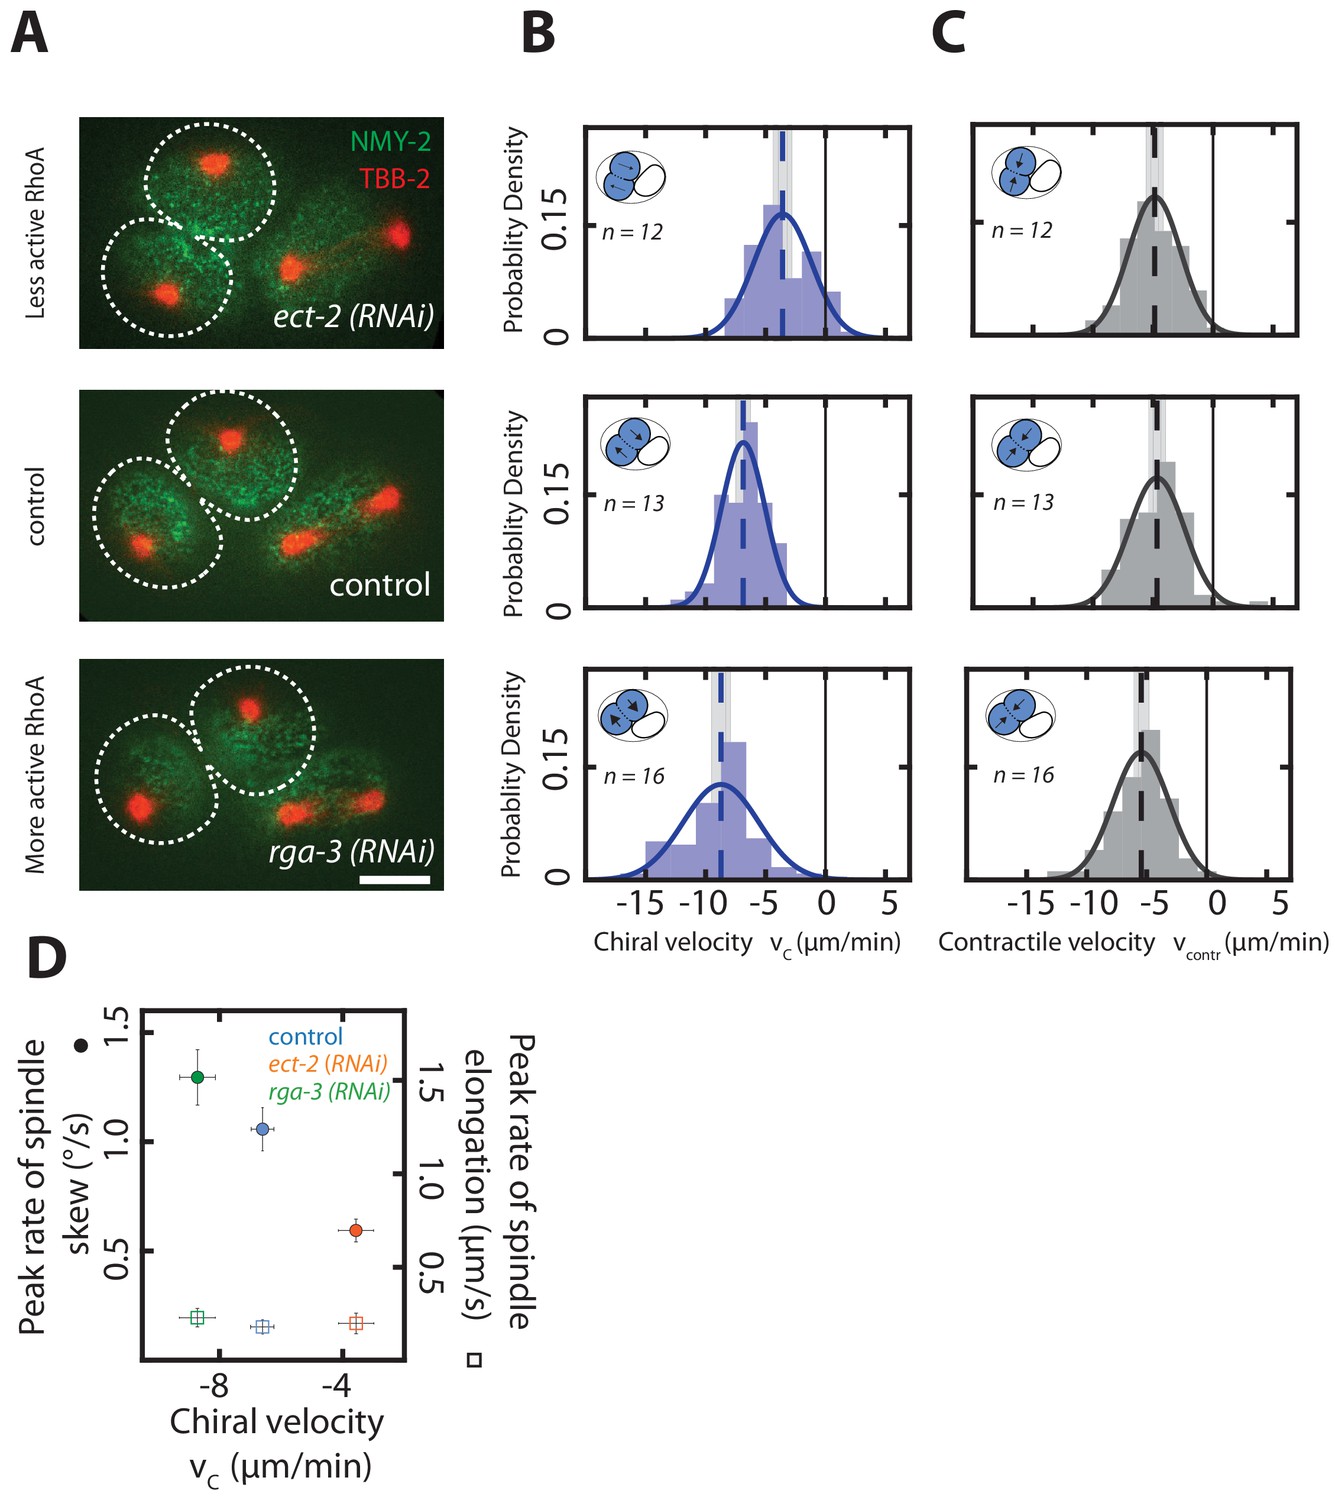
Chiral counter-rotating flow velocity determines the rate of spindle skew in the AB cell.
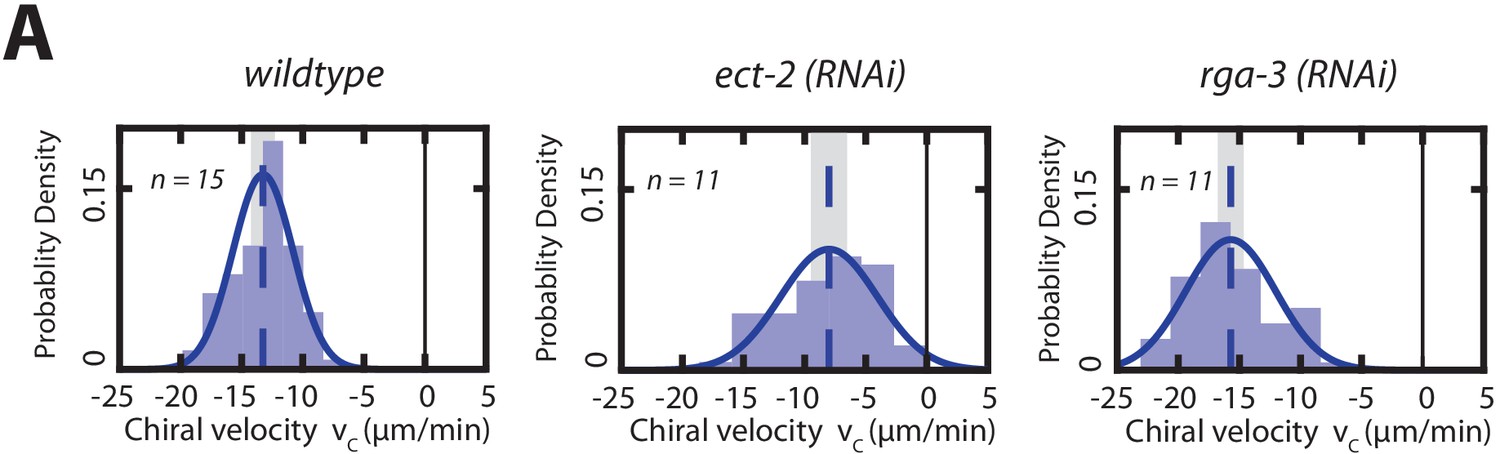
(A) Fluorescence images of two-cell embryos during cytokinesis upon ect-2 (RNAi) and rga-3 (RNAi). Spindle poles are marked by TBB-2::mCherry (red), the cortex is marked by NMY-2::GFP (green). Dotted white lines indicate boundaries of the dividing AB cells. Scale bar, 10 µm. (B, C) Histograms of (B) the instantaneous chiral counter-rotating flow velocity (see Materials and methods for definition) and (C) the instantaneous contractile flow velocity , representing the flow velocity along the long axis of the dividing cell (see Materials and methods for definition). Dotted vertical colored lines represent the mean or mean , grey boxes represent the error of the mean. Thin black solid lines indicate zero velocities. Inset, blue shading indicates the AB cell analyzed, arrows indicate rotatory cortical flow. (D) Peak rate of spindle skew (filled circles) and peak rate of spindle elongation (open squares) with the RNAi feeding control (control, n = 10; ect-2 (RNAi), n = 12; rga-3 (RNAi), n = 9). The full time series is given in Figure 4—figure supplement 1. Errors indicate the error of the mean at 95% confidence.
Figure 4—figure supplement 1
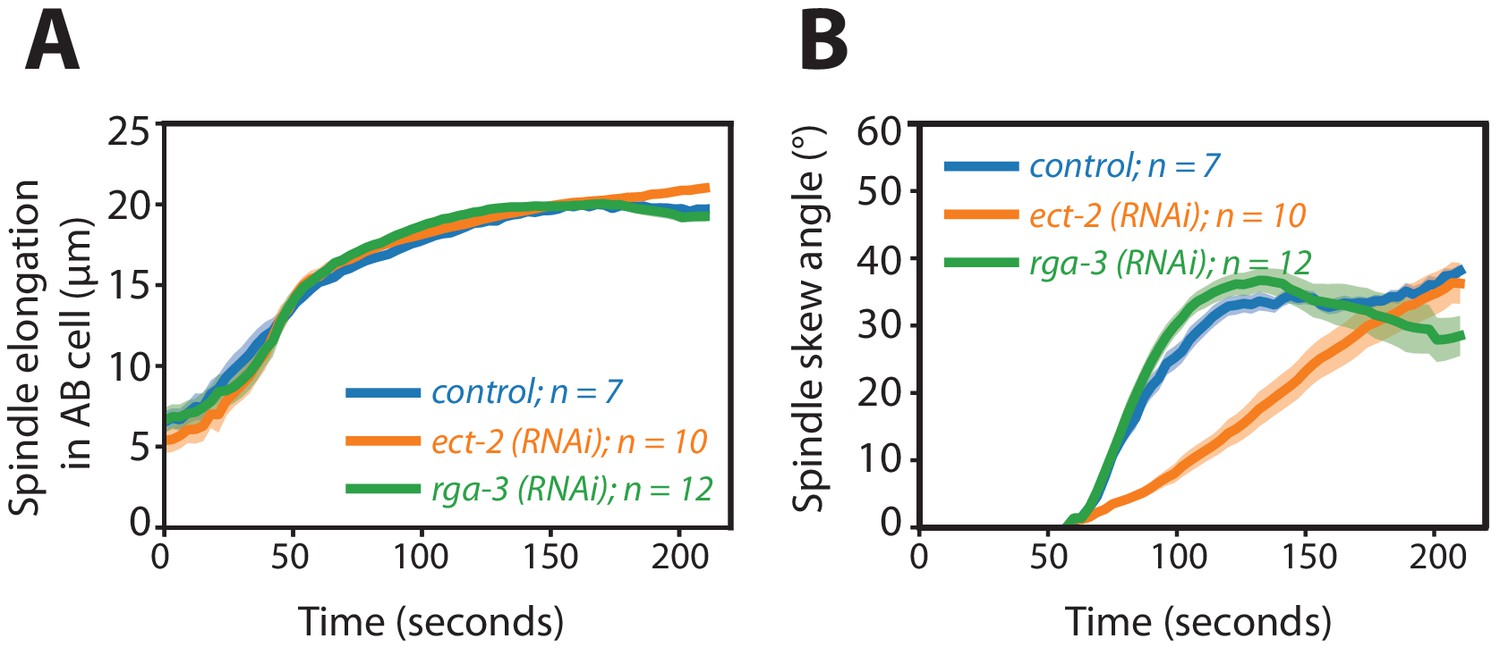
Spindle elongation and spindle skew dynamics during cytokinesis in the AB cell upon Rho pertubations.
(A, B) Dynamics of (A) spindle elongation length and (B) spindle skew angle in the AB cell during cytokinesis for RNAi feeding control and ect-2 (RNAi) embryos and rga-3 (RNAi) embryos. The dynamics of spindle length in these perturbations is not affected refuting the first hypothesis and supporting the alternative hypothesis proposed (hypothesis two), as illustrated in Figure 3A (see main text).
Figure 4—figure supplement 2
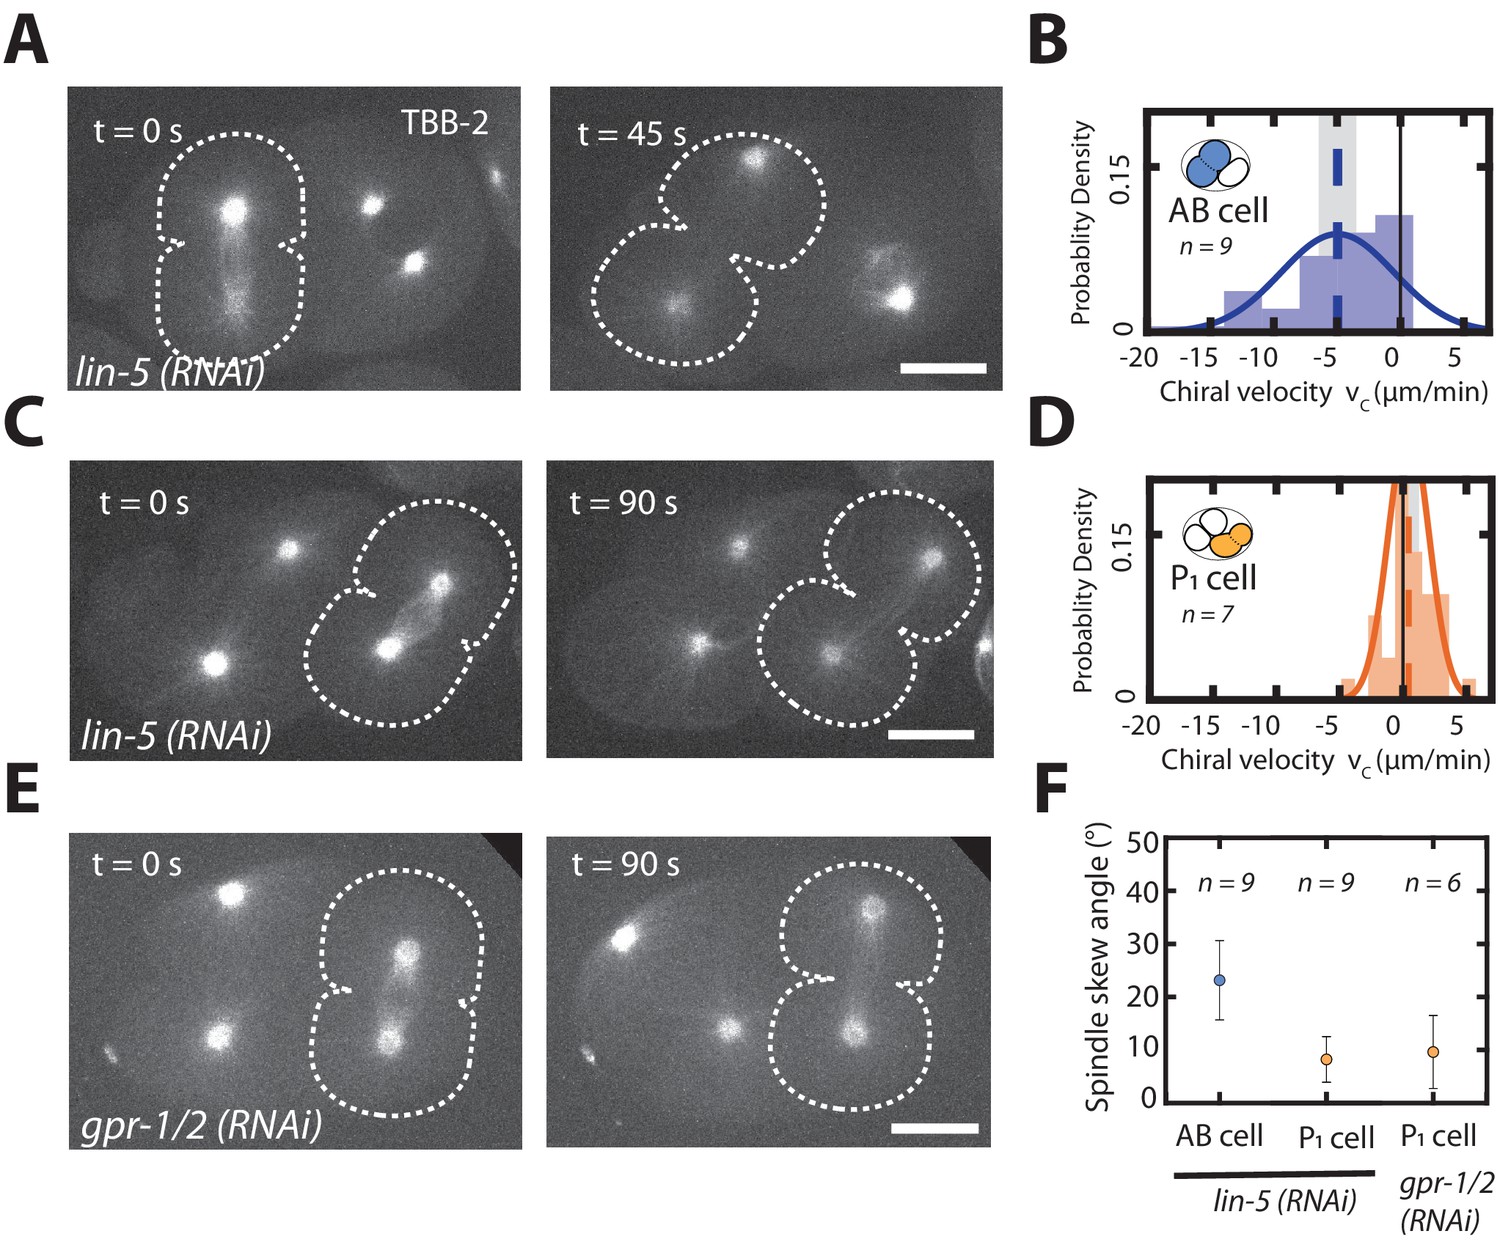
Chiral counter-rotating flow and spindle skew quantification for spindle perturbations.
(A) Representative forescence images of a two-cell embryo expressing TBB-2::mCherry undergoing AB cell division upon lin-5 (RNAi). Dotted white line marks the cell borders. (B) Histogram of instantaneous chiral counter-rotating velocity for the second, AB cell division in lin-5 (RNAi) embryos. Solid line indicate the best fit Gaussian probability density function. Dotted vertical lines indicate mean . (C) Representative florescence images of a three-cell embryo expressing TBB-2::mCherry undergoing P1 cell division upon lin-5 (RNAi). Spindle pole positions are marked in white and dotted white line marks the cell borders. (D) Histogram of instantaneous chiral counter-rotating velocity for the third, P1 cell division in lin-5 (RNAi) embryos. Solid line indicate the best fit Gaussian probability density function. Dotted vertical lines indicate mean . (E) Representative fluorescence images of three-cell embryo expressing TBB-2::mCherry undergoing P1 cell division upon lin-5 (RNAi). Dotted white line marks the cell borders. (F) Spindle skew angle quantifications for the AB and P1 cell upon lin-5 (RNAi) and P1 cell upon gpr-1/2 (RNAi) embryos. Error bars and shaded error bars indicate error of the mean at a 95% confidence. Solid black line in (B) and (D) indicate chiral flow velocity of zero. Inset, colored cell indicates the cell analyzed; AB lineage in blue and P/EMS lineage in orange. Embryo schematic denotes the plane of projection marked by the rectangle and arrow indicates the direction of view. Scale bar 10 µm.
Figure 5 with 3 supplements
Spindle skews in early development are driven by chiral actomyosin flows.
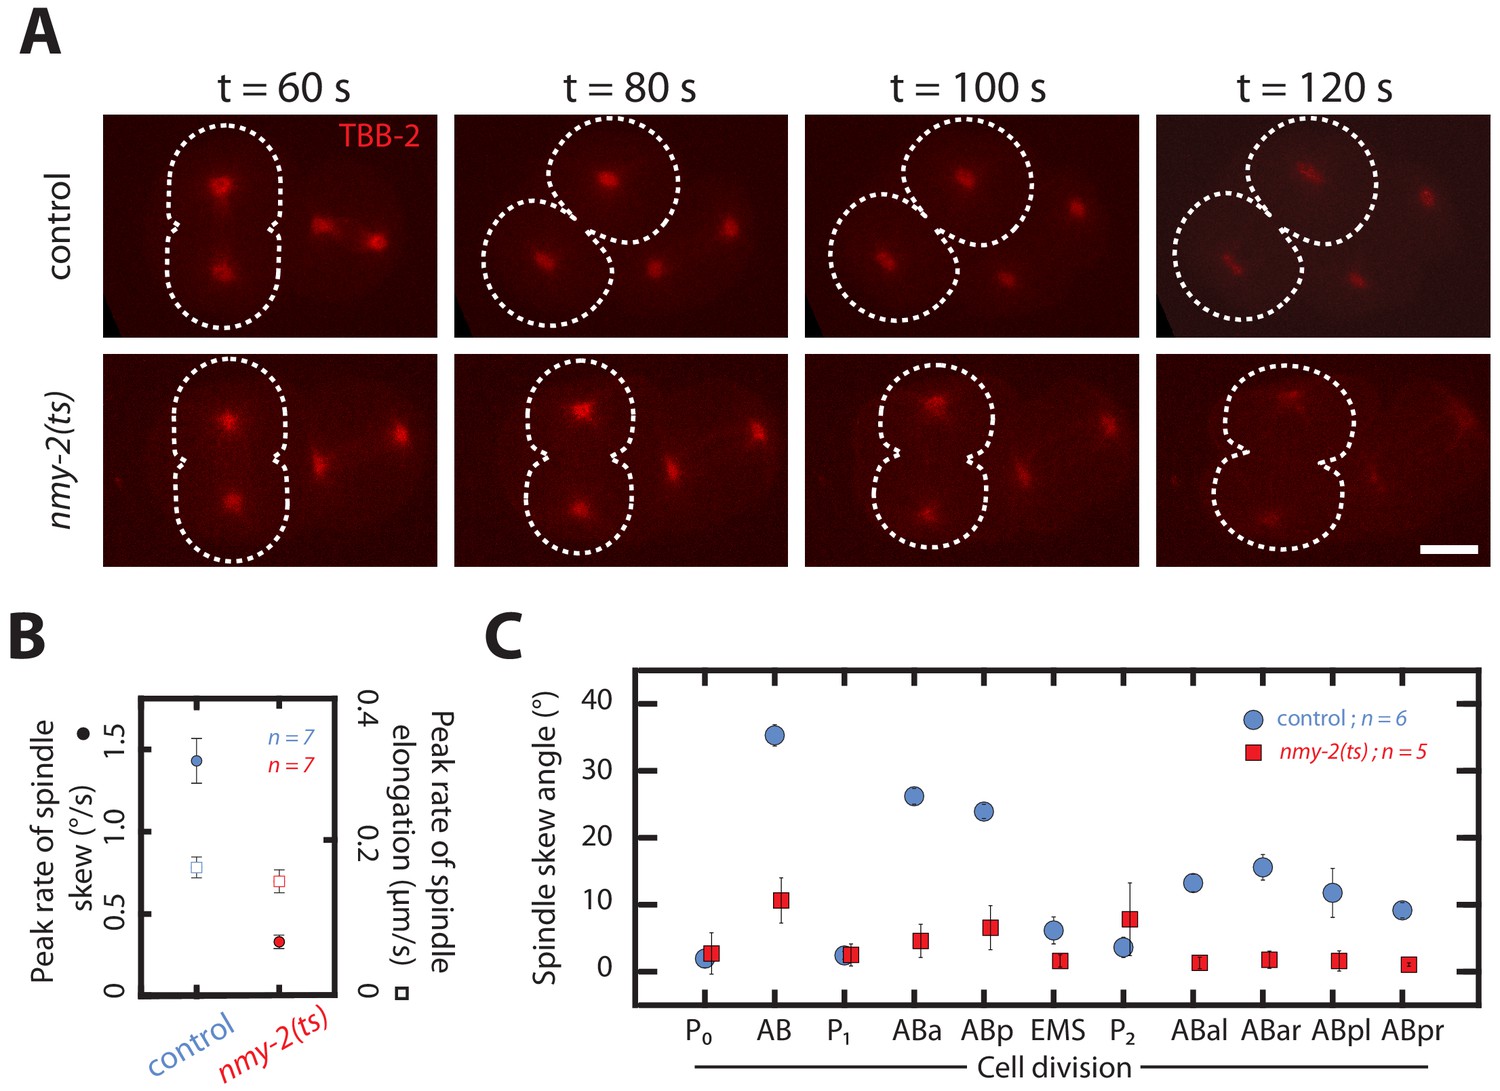
(A) Fluorescence images of control and myosin temperature-sensitive (ts) mutants (nmy-2(ts) ,permissive at 15°C, restrictive at 25°C) two-cell embryos with TBB-2::mCherry labelled for visualizing spindle poles (red). All embryos were shifted from 15°C to 25°C at the end of the first division. Dotted white lines indicate boundaries of the dividing AB cells. Time t = 60 s indicates the onset of cytokinesis. Scale bar, 10 µm. (B) Corresponding peak rate of spindle skew (circles) and spindle elongation (squares) for the AB cell in control and nmy-2(ts) embryos. The full time series is given in Figure 5—figure supplement 1. (C) Spindle skew angle in control embryos (blue circles) and nmy-2(ts) embryos (red squares) during the first 11 cell divisions at temperature of 25°C. Errors indicate the error of the mean at 95% confidence.
Figure 5—figure supplement 1
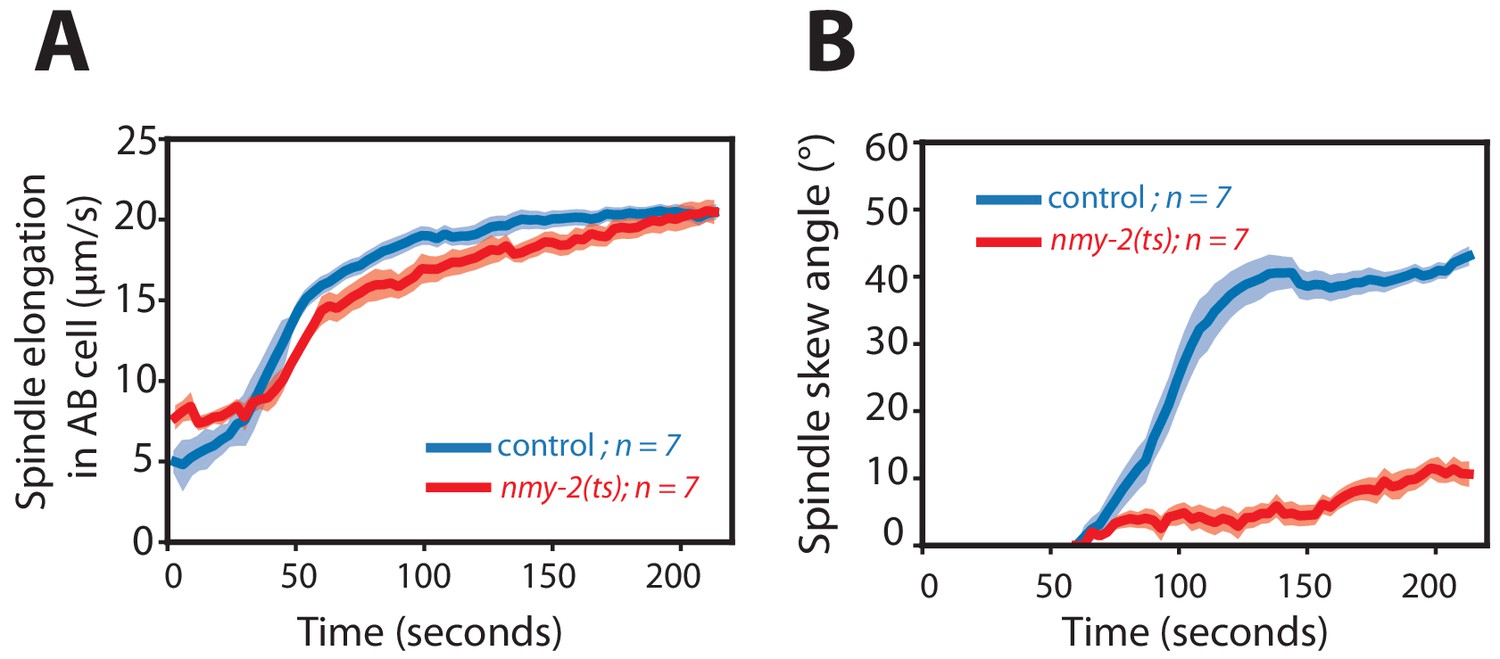
Spindle elongation and spindle skew dynamics during cytokinesis in the AB cell in temperature-sensitive embryos.
(A, B) Dynamics of (A) spindle elongation length and (B) spindle skew angle in the AB cell during cytokinesis for tbb-2::mCherry (control) and nmy-2(ts); tbb-2::mCherry embryos at 25°C. Solid line represents mean whereas the shaded region is error of the mean at 95% confidence.
Figure 5—figure supplement 2
Chiral counter-rotating flow velocities on the future left side of the dividing AB cell.
(A) Histogram of instantaneous chiral counter-rotating velocity for the second, AB cell division in wild-type and rho perturbations (ect-2 (RNAi) and rga-3 (RNAi)). Solid line indicate the best fit Gaussian probability density function. Dotted vertical lines indicate mean . Shaded error bar indicate error of the mean at 95% confidence.
Figure 5—figure supplement 3
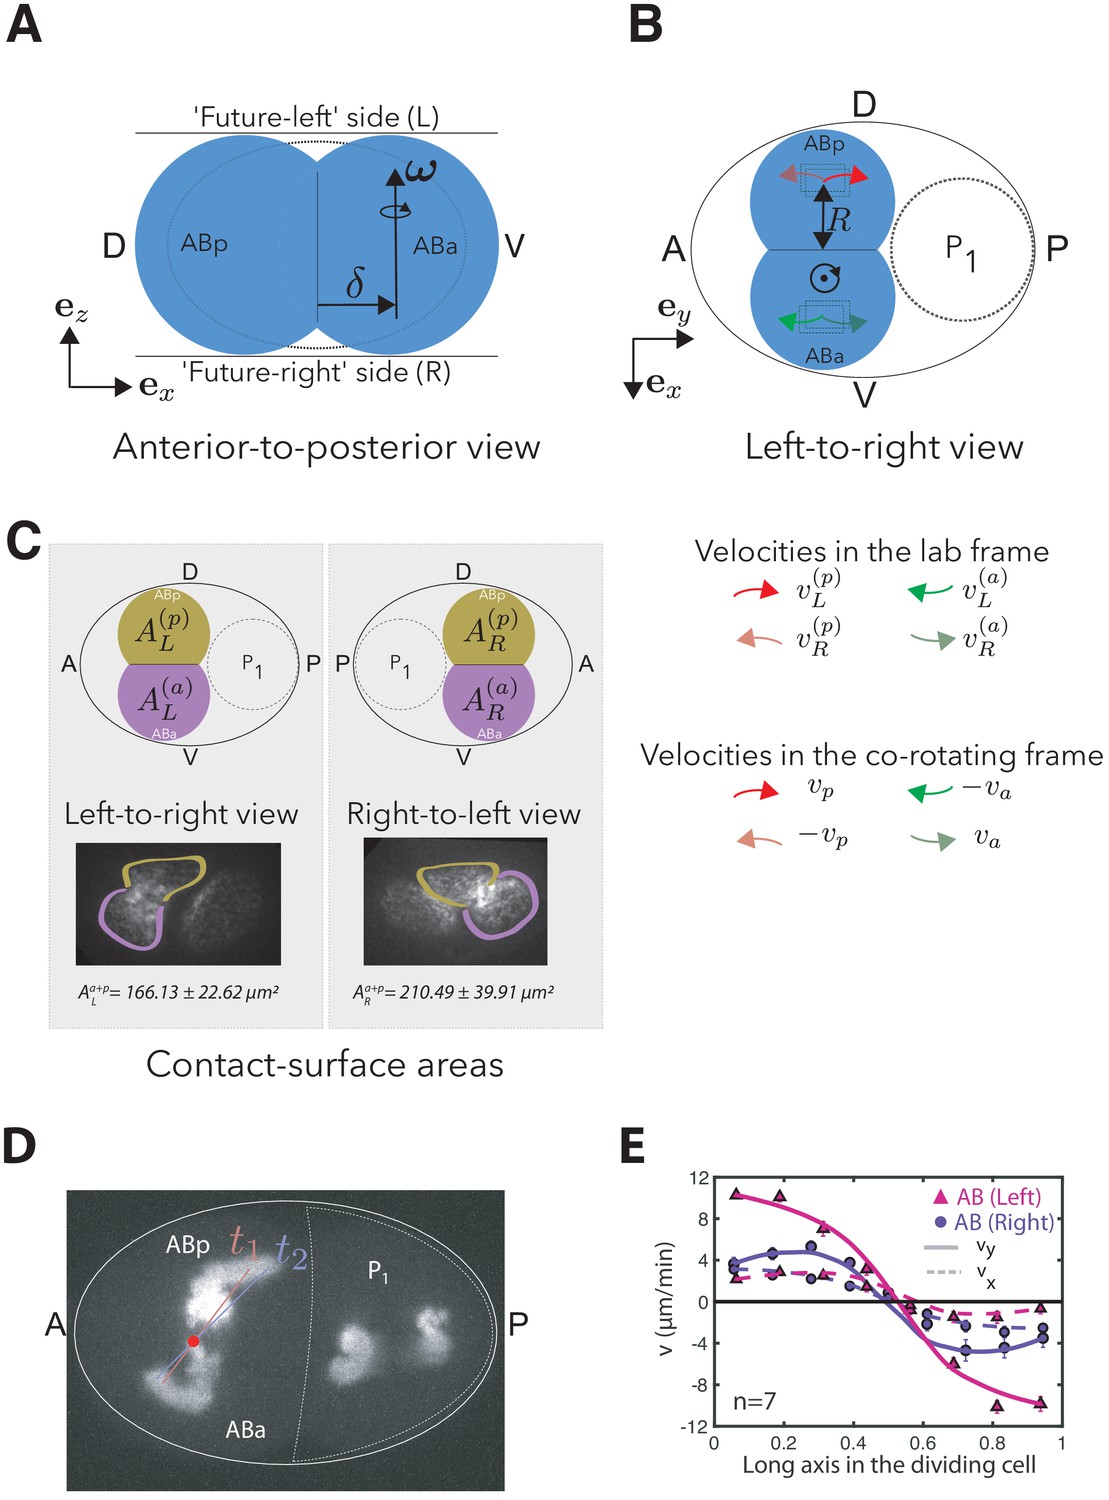
Parameterization of the minimal model of AB cell skews in the AP-DV plane.
(A) Anterior to posterior view: Schematic of the AB cell (depicted in blue) when observed from anterior pole. The axis of rotation of the angular cell skew can be shifted from the position of the cytokinetic ring by a distance . For () the axis of rotation is shifted toward the ABa (ABp) cell. In the model, we use , such that the sign of defines the skew handedness. The coordinate system is oriented such that the LR-DV and the AP-DV plane correspond to the - and -plane, respectively. (B) Left-to-right view: Schematic of the AB cell (depicted in blue) when observed from the future left side of the embryo. Cortical flows on the future ABa and ABp cells (, , ) are measured and averaged on each side in ROIs at a distance of away from the cytokinetic ring (see Materials and methods). These velocities can be mapped to a simplified geometrical model of two counter-rotating surfaces that are represented by the skewing parameters and and velocities and measured in the co-rotating frame. (C) Depiction of the different contact surface areas in the dividing AB cell (top left: left-to-right view, top right: right-to-left view). The insets illustrate the cortical boundaries of ABa (purple) and ABp (brown) in dividing two-cell embryos viewed from each side. Values denote the average total surface area on left and right side (mean ± error at 95% confidence, ). (D) Maximum intensity projection of spindle pole dynamics during the AB cell division (TBB-2::mCherry): At late stages of the spindle skew, a faster movement of the ABp spindle pole leads to a shift of the axis of rotation (red dot) toward the ABa cell, which is also picked up by the geometric model (, see Appendix 1—table 3). White dashed line approximately outlines cell. (E) Analysis of cortical flow measurements on the future left (magenta) and right (blue) side of the AB cell. Velocity profiles on the left (filled circles) and right (filled triangles) measured along the long axis of the dividing AB cell. Theoretical predictions for the chiral counter-rotating flow velocity (, solid lines) and contractile on-axis flow velocity (, dashed lines) based on the thin chiral active fluid theory (see Appendix). Fit parameters are given for AB (right) in Appendix 1—table 1 and for AB (left) by , /min, /min.
Author response image 1
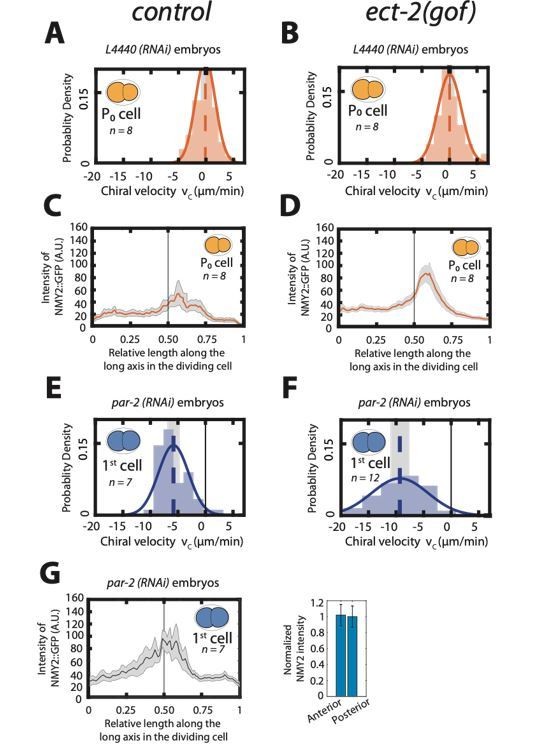
Enhancing actomyosin activity is not sufficient to generate chiral counterrotating flows during cytokinesis.
A, B: Histogram of instantaneous chiral counter-rotating velocity vc for the first, P0 cell division in, control (A) and ect-2 (gof) embryos (B). C, D: Mean myosin concentration profile along the cell division axis of the P0 cell in control and ect-2 (gof) embryos. Vertical black line indicate centre of the cell. E, F: Histogram of instantaneous chiral counter-rotating velocity vc for the first cell division in par-2 (RNAi) embryos in control (E) and ect-2 (gof) embryos (F). Solid lines in A, B, E and F indicate the best fit Gaussian probability density function. Dotted vertical lines indicate mean vc; grey boxes represent the error of the mean at 95% confidence interval. G: Mean myosin concentration profile along the cell division axis of the first cell division in control, par-2 (RNAi) embryos. Vertical black line indicate centre of the cell. Right, normalized myosin concentration levels in the 20% anterior end of the cell compared to 20% of posterior end of the dividing cell. Shaded region indicates error at 95% confidence interval.
Videos
Video 1
Movie of the actomyosin cortex during the first cell division.
The cortex is marked by NMY-2::GFP. The P0 cell does not exhibit chiral counter-rotating flows during its division. Cortical flows in the two dividing halves of the P0 cell flow in the same y-direction. Scale bar 10 µm.
Video 2
Movie of the actomyosin cortex during the second cell division.
The AB cell division exhibits chiral counter-rotating flows. The two dividing halves of the AB cell counter rotate in opposite y-directions. Scale bar 10 µm.
Video 3
Movie of the actomyosin cortex during the third cell division (left) and with PIV flow fields (right).
The cortex is marked by NMY-2::GFP. The P1 cell division does not exhibit chiral counter-rotating flows. The nature of the flow is similar to the one observed in case of P0 cell division. Scale bar 10 µm.
Video 4
Movie of the actomyosin cortex during the ABa and the ABp cell divisions (left) and with PIV flowfield (right).
The cortex is marked by NMY-2::GFP. ABa and ABp exhibit chiral counter-rotating flows during division similar to the flows observed in the AB cell division. Scale bar 10 µm.
Video 5
Movie of the actomyosin cortex during the EMS division (left) and with PIV flowfield (right).
The cortex is marked by NMY-2::GFP. No chiral counter-rotating flows are observed during the EMS division. Scale bar 10 µm.
Video 6
Chiral surface flows on an ellipsoidal surface for a centered contractile ring, , and varying myosin asymmetries.
Video 7
Chiral surface flows on an ellipsoidal surface for a symmetric myosin profile, and varying positions of the contractile ring.
Video 8
Chiral surface flows on an ellipsoidal surface for an asymmetric myosin profile, and varying positions of the contractile ring.
Video 9
Movie of maximum intensity projection of dividing embryo from one-cell stage to 24-cell stage.
Spindle apparatus and spindle poles are marked by TBB-2::mCherry (red) and membrane (grey) is marked by PH::GFP. Scale bar 10 µm.
Video 10
Spindle skew in the AB cell imaged in uncompressed wild type embryos (SWG63) projected along the (left) LR-DV plane and (right) AP-DV plane by visualizing TBB-2::mCherry.
Scale bar 10 µm.
Video 11
Chiral counter-rotating cortical flows during the second and third cell division in par-2; chin-1; lgl-1(RNAi) embryos.
The cortex is marked by NMY-2::GFP. Scale bar 10 µm.
Video 12
Cortical flows during the second and third cell division in control embryos.
The second cell division exhibits chiral counter-rotating flows whereas the third cell division shows absence of chiral counter-rotating flows. Scale bar 10 µm.
Video 13
Cortical flows during the second and third cell division in par-6 (RNAi) embryos.
No chiral counter-rotating flows are observed during either of these cell divisions. Scale bar 10 µm.
Video 14
Spindle skew in uncompressed par-2 (RNAi) anteriorized embryos during third and fourth cell division projected in the AP-DV plane by visualizing TBB-2::mCherry.
Embryos were mounted using low melt agarose method. Scale bar 10 µm.
Video 15
Spindle skew in uncompressed par-2 (RNAi) anteriorized embryos during (left) third and (right) fourth cell division projected along the (left) LR-DV plane viewed from anterior end and (right) LR-DV plane viewed from posterior end by visualizing TBB-2::mCherry.
Scale bar 10 µm.
Video 16
Spindle skew in uncompressed par-2 (RNAi) anteriorized embryos in two juxtaposed AB-like cells when projected along LR-DV plane and viewed from anterior end.
Spindle poles are visualized using TBB-2::mCherry. Scale bar 10 µm.
Video 17
Cortical flows during the second cell division in ect-2 (RNAi) embryos. 4 hr of ect-2 (RNAi) leads to reduction in chiral counter-rotating flow velocity (NMY-2::GFP, cortex marked in green and TBB-2::mCherry, spindle poles marked in red) Scale bar 10 µm.
Video 18
Cortical flows during the second cell division in L4440 embryos (feeding control) (NMY-2::GFP, cortex marked in green and TBB-2::mCherry, spindle poles marked in red) Scale bar 10 µm.
Video 19
Cortical flows during the second cell division in rga-3 (RNAi) embryos.
6 hr of rga-3 (RNAi) leads to increase in chiral counter-rotating flow velocity (NMY-2::GFP, cortex marked in green and TBB-2::mCherry, spindle poles marked in red). Scale bar 10 µm.
Video 20
Spindle skew in the AB cell imaged in control embryos (SWG63) by visualizing TBB-2::mCherry at restrictive temperature of 25°C.
Scale bar 10 µm.
Video 21
Spindle skew in the AB cell imaged in the mutant nmy-2(ts) embryos (SWG204) by visualizing TBB-2::mCherry at restrictive temperature of 25°C.
Scale bar 10 µm.
Tables
Appendix 1—table 1
Best fit parameters.
The average domain lengths (approximately the size of the cell’s long axis) on which the myosin profiles were given were , and . The corresponding fits are shown in Figure 1—figure supplement 8.
| Cell type | [µm] | [µm/min] | [µm/min] |
|---|---|---|---|
| AB | 18.7 | 0.15 | 0.25 |
| ABa | 10.4 | 0.19 | 0.15 |
| ABp | 8.2 | 0.4 | 0.4 |
Appendix 1—table 2
Qualitative properties of myosin distributions and chiral flows consistently observed in P/EMS lineage (P0, P1, EMS, P2) and AB-lineage (AB, ABa, ABp, ABal, ABar) cells.
| Myosin peak position | Anterior-posterior myosin | Chiral flow properties | |
|---|---|---|---|
| AB-lineage | Centered | Symmetric | , |
| P/EMS lineage | Off-center | Asymmetric | , |
Appendix 1—table 3
Chiral counter-rotations in experiments and in a minimal geometric model.
Left: Experimentally measured chiral cortical flows (± error at 95 % confidence interval) of the ABa and ABp cell at late stages of the spindle skew for different conditions. Flows on both cells are measured on the future left (, ) and right side (, ). Right: Assuming two rigid, counter-rotating and skewing surfaces, the velocities measured in the lab frame (left) can be mapped via Equations S13–S16 to the skewing properties (, ) and surface velocities (, ) in the co-rotating frame (± propagated uncertainty). Distance between cytokinetic ring and points of velocity measurements: .
| Measured vel. | wt | ect-2 | rga-3 | Equations S13–S16 | wt | ect-2 | rga-3 |
|---|---|---|---|---|---|---|---|
| [µm/min] | [°/s] | ||||||
| [µm/min] | |||||||
| [µm/min] | [µm/min] | ||||||
| [µm/min] | [µm/min] |
Appendix 1—table 4
Comparison of the angular velocity determined from the physical skew model with experimentally measured average spindle skew rates.
The angular velocity is calculated for each condition using Equations S21 with and (see Appendix 1—table 3). is given by Equation S23, with the hydrodynamic lengths and (Figure 5—figure supplement 3), and the measured contact surface areas on the future left and right side given by and , respectively. Theory error: ± propagated uncertainty, Measurement error: ± 95 % confidence interval
| Condition | Angular skew velocity [°/s] from theory | Measured average spindle skew rate [°/s] |
|---|---|---|
| wt | ||
| ect-2 | ||
| rga-3 |
Additional files
-
Source data 1
Data values that have been depicted in the figures of the manuscript.
- https://cdn.elifesciences.org/articles/54930/elife-54930-data1-v2.xlsx
-
Source code 1
MATLAB code for tracking spindle skews.
- https://cdn.elifesciences.org/articles/54930/elife-54930-code1-v2.zip
-
Transparent reporting form
- https://cdn.elifesciences.org/articles/54930/elife-54930-transrepform-v2.docx
Download links
A two-part list of links to download the article, or parts of the article, in various formats.
Downloads (link to download the article as PDF)
Open citations (links to open the citations from this article in various online reference manager services)
Cite this article (links to download the citations from this article in formats compatible with various reference manager tools)
Cell lineage-dependent chiral actomyosin flows drive cellular rearrangements in early Caenorhabditis elegans development
eLife 9:e54930.
https://doi.org/10.7554/eLife.54930


