Distinct signals in medial and lateral VTA dopamine neurons modulate fear extinction at different times
- Princeton Neuroscience Institute, Princeton University, United States
- Department of Computer Science, Princeton University, United States
- Department of Psychology, Princeton University, United States
Figures
Figure 1 with 1 supplement
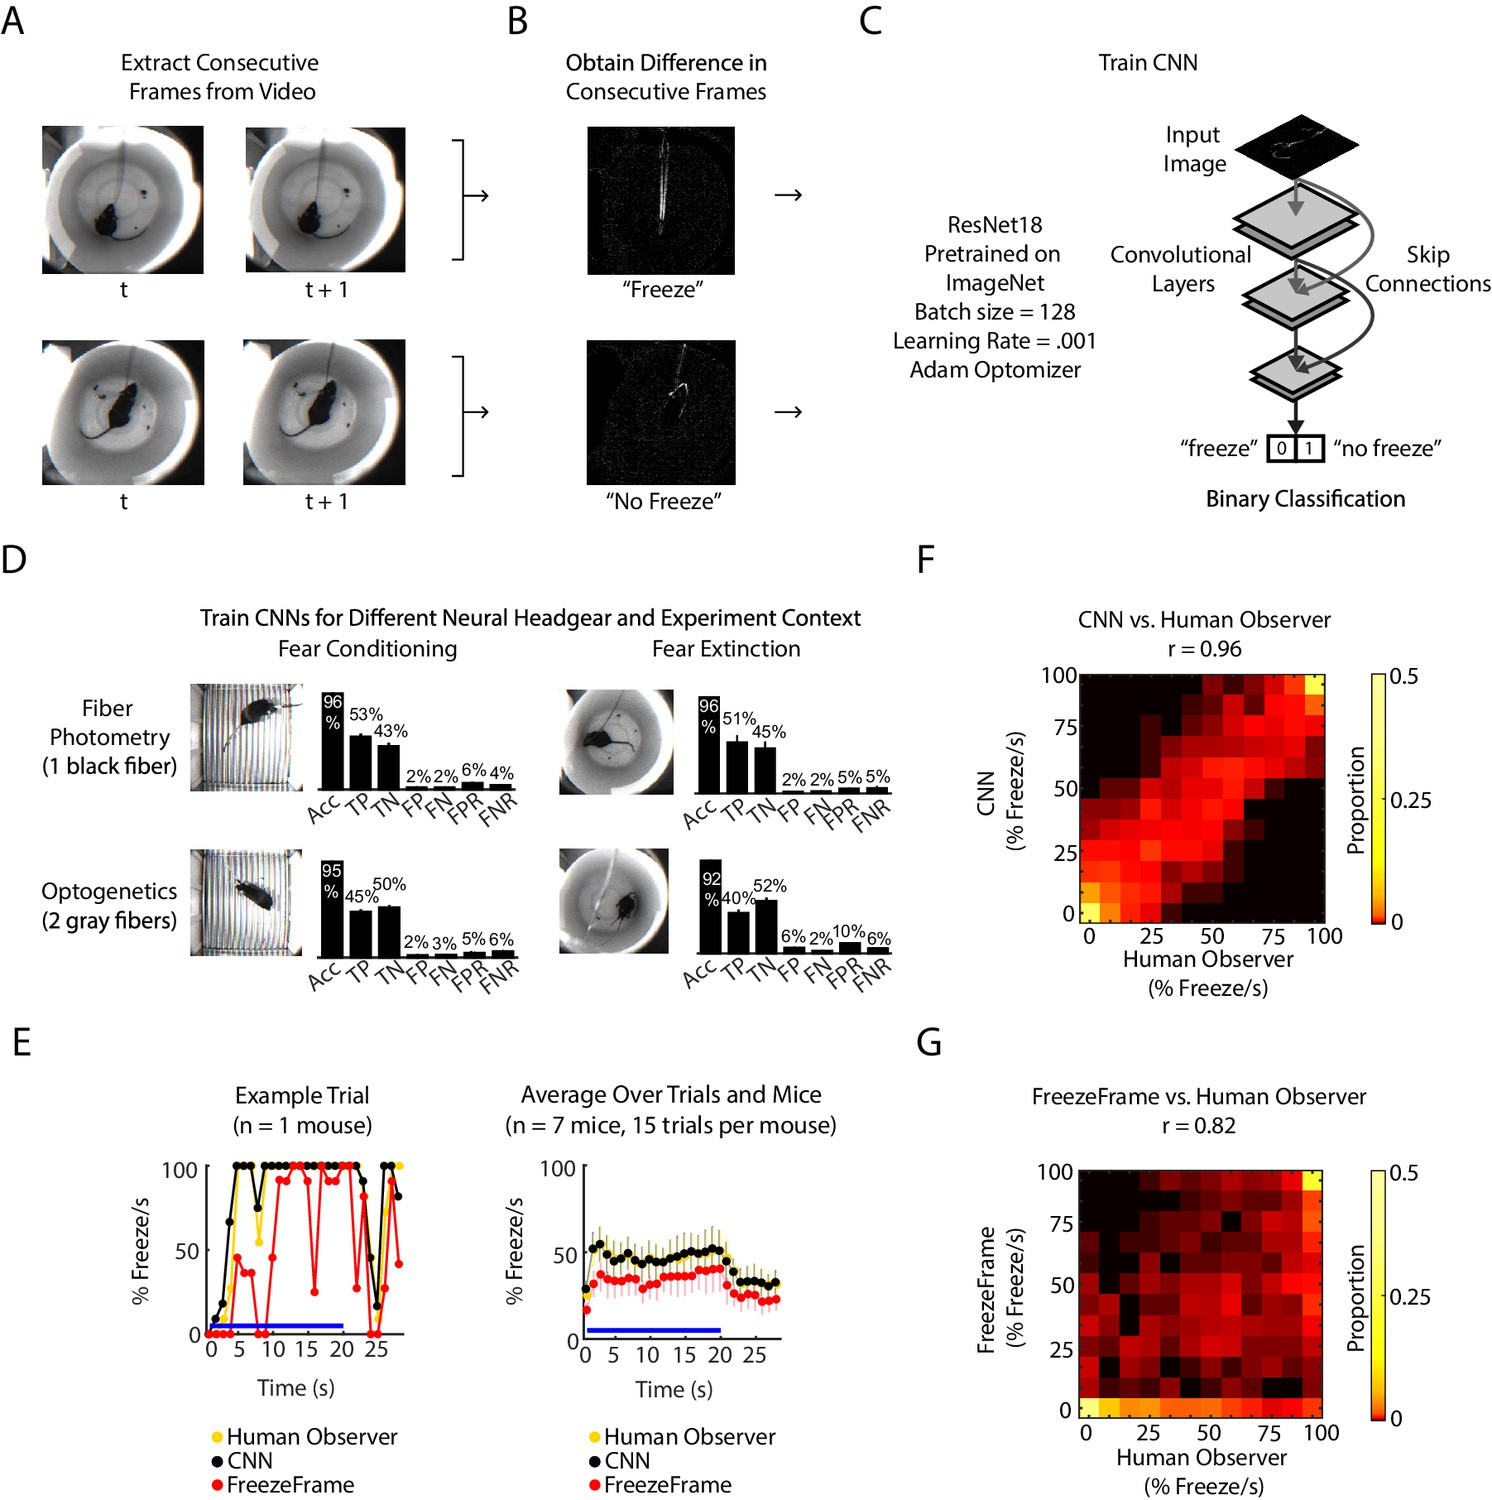
CNN classifies frame-by-frame freezing with high accuracy.
(A) Extract consecutive frames from experiment video. (B) Obtain ‘difference images,’ which are the pixel intensity difference between consecutive frames, and human label a subset as ‘freeze’ or ‘not freeze.’ (C) Train the CNN classifier to predict ‘freeze’ or ‘no freeze’, see Materials and methods for details. (D) Train four separate CNNs for two types of neural headgear (fiber photometry and optogenetics) and two experimental backgrounds (fear conditioning and fear extinction). For each CNN, plot shows its accuracy (Acc), false positive rate (FPR), false negative rate (FNR), false negatives (FN), false positives (FP), true negatives (TN), and true positives (TP). Error bars denote SEM of n different training and test datasets (n = 23 for fiber photometry conditioning context, n = 6 for fiber photometry extinction context, n = 15 for optogenetics fear conditioning context, n = 6 for optogenetics extinction context), see Materials and methods and Figure 1—figure supplement 1 for details. (E-G) Comparison between human observer, CNN and FreezeFrame performance on held-out data in the fiber photometry extinction context. (E) Left: A trial from an example mouse showing percent freezing per second as measured by human observer (yellow), CNN (black), and FreezeFrame (red). For human observer and CNN, percent freezing per second is the mean value of 11 frames where each frame is assigned ‘1’ for ‘freeze’ and ‘0’ for ‘no freeze’ relative to previous frame (video acquired at 11.2 Hz). Right: Data from all trials and seven mice showing percent freezing per second as measured by human observer (yellow), CNN (black), and FreezeFrame (red). (n = 7 mice, 15 trials per mouse). In both subplots, blue lines denote 20 s tone duration and error bars denote SEM. (F) 2-dimensional histogram to compare CNN labeling to human observer (Pearson correlation coefficient r = 0.96, p=0, n = 2940 samples). (G) 2-dimensional histogram to compare FreezeFrame labeling to human observer (Pearson correlation coefficient r = 0.82, p=0, n = 2940 samples). (F-G) Color intensity denotes proportion of samples in each histogram bin.
Figure 1—figure supplement 1

CNN performance across different contexts.
(A) Examples of ‘freeze’ or ‘no freeze’ difference images from the fiber photometry extinction context used for input into the CNN. (B-E) CNN performance for different experimental backgrounds and neural headgear. (B) CNN performance for the fiber photometry fear conditioning context. 36,000 difference images used for training and testing. Top plot: Classifier loss during training for epochs 0 to 50 for train (blue) and held out test (red) data. Middle plot: test accuracy for epochs 0 to 50. Lower plot: Classifier false positive rate (FPR) and false negative rate (FNR) for epochs 0 to 50. In all plots, error bars denote SEM. (C) Same as B, for the fiber photometry fear extinction context. (D-E) Same as B-C, for the optogenetics fear conditioning and extinction context. (F) Two human observers’ scoring of 33,000 pairs of consecutive frames for fiber photometry extinction context. Left: Accuracy, true positive, false positive, true negative, false negative, false position rate and false negative rate of human observer 2, given human observer 1’s result is held as ground truth. Analogous to Figure 1D. Right: 2-dimensional histogram to compare human observer one to human observer 2 (Pearson correlation coefficient r = 0.98, p=0, n = 2940 samples). Analogous to Figure 1F,G.
Figure 2
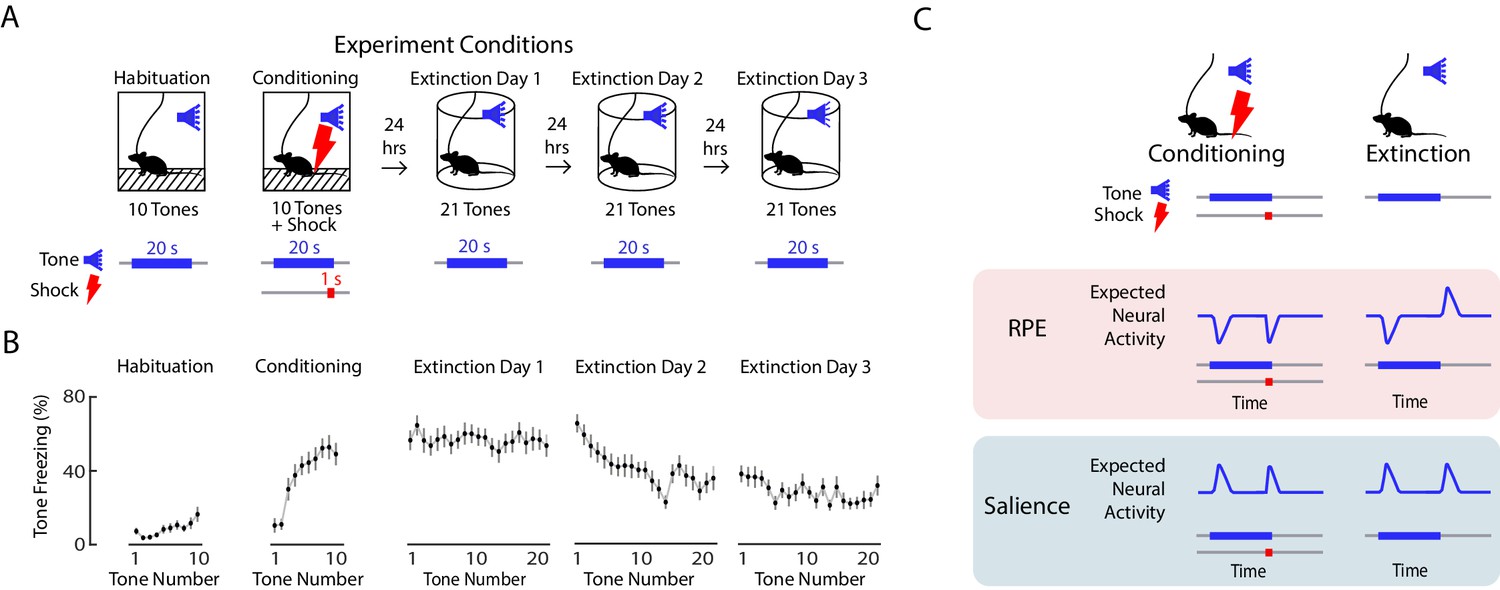
Expected neural activity reflecting reward prediction error (RPE) and salience during auditory fear conditioning and extinction.
(A) Auditory fear conditioning and extinction across 4 days: habituation and fear conditioning occur on the 1 st day, followed by 3 days of extinction. Habituation and conditioning occur in the same experimental chamber, and extinction occurs in a different experimental chamber. During habituation, mice received 10 tones lasting 20 s each. During fear conditioning, mice received 10 tones that coterminated with a 1 s foot shock. During each extinction day, mice received 21 tones. In all conditions, the inter-trial interval was jittered with a mean of 80 s. (B) Mean freezing during each tone throughout auditory fear conditioning and extinction (n = 21 mice). Error bars denote SEM. (C) Schematic of expected neural activity representing reward prediction error (RPE) and salience during fear conditioning and extinction. During extinction, a neural correlate of RPE would have suppressed activity during a tone that has been paired with a footshock to signal worse than expected outcome, and elevated activity during the tone offset to signal better than expected outcome because the footshock was omitted. A neural correlate of salience can be considered an unsigned prediction error, or the absolute value of RPE.
Figure 3 with 5 supplements

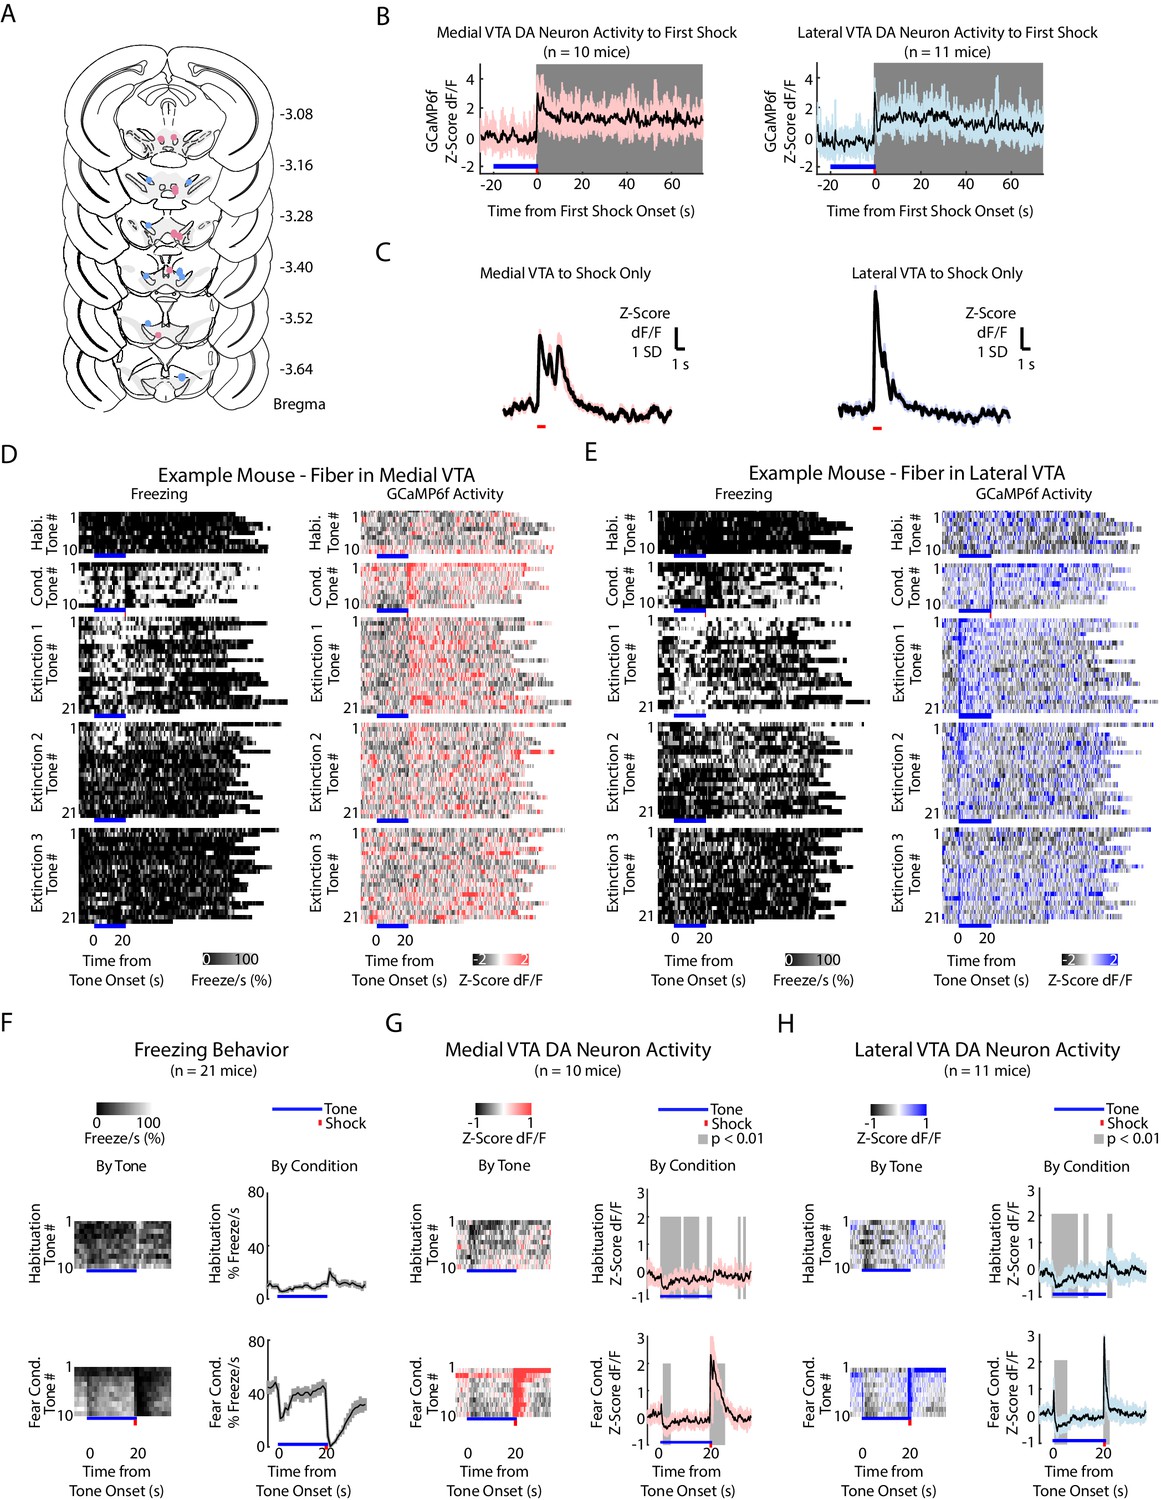
During auditory fear extinction, DA neuron activity in medial and lateral VTA resembles RPE and salience, respectively.
(A) Fiber photometry recordings in medial and lateral VTA. Left: Midbrain sagittal slice of fiber implant in VTA. Right: Medial and lateral fiber placements across the VTA, visualized at bregma = −3.28 AP. Circles indicate fiber tips, shading indicate approximate boundary of the two regions. (B) Example brain slices from different mice showing fiber placement in medial or lateral VTA, at bregma = −3.28 AP. Green denotes GCaMP6f. (C) Histology from lateral VTA, staining for cell nuclei (DAPI), tyrosine hydroxylase (TH), and GCaMP6f. (D-F) Behavior and VTA DA neuron activity during auditory fear extinction. At the bottom of each subplot, bright blue lines denote tone duration. (D) Left column: Time course of mean percent freezing for each tone during each day of fear extinction (n = 21 mice). For each extinction day subplot, color intensity corresponds to freezing percentage. Right column: Time course of mean percent freezing over all tones for each extinction day (n = 21 mice). Gray shading denotes one standard deviation. (E) Left column: Time course of mean medial VTA DA neuron activity (GCaMP6f fluorescence) for each tone during each day of fear extinction (n = 10 mice). For each extinction day subplot, color intensity denotes GCaMP6f z-score dF/F. Right column: Time course of mean medial VTA DA neuron activity (GCaMP6f fluorescence) over all tones for each extinction day (n = 10 mice). Pink shaded region denotes one standard deviation. Gray shaded region represents 1 s time points where GCaMP6f significantly deviates from shuffled data (percentile rank, p<0.01 after Bonferroni correction for multiple time point comparisons). (F) Same as E but for lateral VTA DA neuron activity (n = 11 mice), using blue instead of pink shading.
Figure 3—figure supplement 1
Fiber photometry recordings in medial and lateral VTA dopamine neurons during auditory fear conditioning and extinction.
(A) Histology of unilateral fiber placement for medial VTA (rose dots) and lateral VTA (blue dots) fiber photometry recordings. (Expanded across the anterior-posterior coordinates of Bregma from Figure 2A) (B) GCaMP6f fluorescence during the first shock. Gray shading denotes time points when GCaMP6f fluorescence is significantly different from baseline (percentile rank, p<0.01 after Bonferroni correction for multiple time points comparison). Left: Medial VTA GCaMP6f fluorescence during first shock. Right: Lateral VTA GCaMP6f fluorescence during the first shock. (C) GCaMP6f fluorescence of shock only without the preceding tone. Left: Medial VTA (n = 10 mice, five shocks per mouse). Right: Lateral VTA (n = 11, five shocks per mouse). (D-E) Behavior and VTA DA neuron activity from example mice during auditory fear conditioning and extinction, for all experiment conditions and all tone trials, including the inter-trial interval. At the bottom of each subplot, bright blue lines denote tone duration, red tick denotes shock duration. (D) Example mouse with GCaMP6f fluorescence from medial VTA DA neurons. Left column: Time course of freezing for each tone, for each experiment condition. Right column: Time course of Medial VTA DA neuron activity (GcaMP6f fluorescence) for each tone, for each experiment condition. (E) Same as D, for an example mouse with GCaMP6f fluorescence from lateral VTA DA neurons. (F-H) Behavior and VTA DA neuron activity (GcaMP6f fluorescence) from a population of mice during habituation and auditory fear conditioning. At the bottom of each subplot, bright blue lines denote tone duration, red tick denotes shock duration. (F) Left column: Time course of mean percent freezing for each tone during habituation or fear conditioning (n = 21 mice). For each condition subplot, color intensity corresponds to freezing percentage. Right column: Time course of mean percent freezing over all tones for habituation or fear conditioning (n = 21 mice). Gray shading denotes one standard deviation. (G) Left column: Time course of mean medial VTA DA neuron activity (GCaMP6f fluorescence) for each tone during habituation or fear conditioning (n = 10 mice). For each subplot, color intensity denotes GCaMP6f z-score dF/F. Right column: Time course of mean medial VTA DA neuron activity (GCaMP6f fluorescence) over all tones for habituation or fear conditioning (n = 10 mice). Pink shaded region denotes one standard deviation. Gray shaded region represents 1 s time points where GCaMP6f significantly deviates from shuffled data (percentile rank, p<0.01 after Bonferroni correction for multiple time point comparisons). (H) Same as F but for lateral VTA DA neuron activity (n = 11 mice), using blue instead of pink shading.
Figure 3—figure supplement 2

Medial and lateral VTA DA neurons increase activity to both reward (sweetened condensed milk) and foot shock.
(A) Experiment schematic of fiber photometry recordings from VTA DA neurons, and fiber placement in medial VTA (pink circle) and lateral VTA (blue circles). (B) Recordings from medial (left) and lateral (right) VTA DA neurons of an example mouse during uncued reward delivery and consumption, aligned to first lick after reward delivery. Color intensity denotes GCaMP6f fluorescence (Z-score dF/F). (C) Mean GCaMP6f fluorescence (Z-score dF/F) across all reward consumption trials averaged across mice, aligned to first lick onset after reward delivery. Left: Medial VTA (n = 1 mouse). Right: Lateral VTA (n = 3 mice). In both plots, gray shading denotes GCaMP6f fluorescence at 1 s time bins that significantly differ from shuffled data (percentile rank p<0.01 accounting for multiple corrections, n = 500 shuffles).
Figure 3—figure supplement 3

SNc DA Neurons during fear conditioning and extinction.
(A) Fiber photometry recordings in SNc. Left: Midbrain sagittal slice of fiber implant in SNc. Center: SNc fiber placements, visualized at bregma = −3.28 AP. Circles indicate fiber tips, shading indicates approximate boundaries of the SNc. (B-C) Mean freezing and SNc DA neuron activity for five experiment conditions: habituation, fear conditioning, extinction day 1, 2 and 3. At the bottom of each condition subplot, blue line denotes tone duration, red tick denotes shock. (B) Left column: Time course of mean percent freezing for each tone in each condition (n = 2 mice). Color intensity corresponds to freezing percentage. Right column: Time course of mean percent freezing over all tones for each condition (n = 2 mice). Gray shading denotes one standard deviation. (E) Left column: Time course of mean SNc DA neuron activity (GCaMP6f fluorescence) for each tone in each condition (n = 2 mice). Color intensity denotes GCaMP6f z-score dF/F. Right column: Time course of mean SNc DA neuron activity (GCaMP6f fluorescence) over all tones for each condition (n = 2 mice). Green shading denotes one standard deviation. Gray shading represents 1 s time bins where GCaMP6f significantly deviates from shuffled data (percentile rank, p<0.01 after Bonferroni correction for multiple time point comparisons).
Figure 3—figure supplement 4
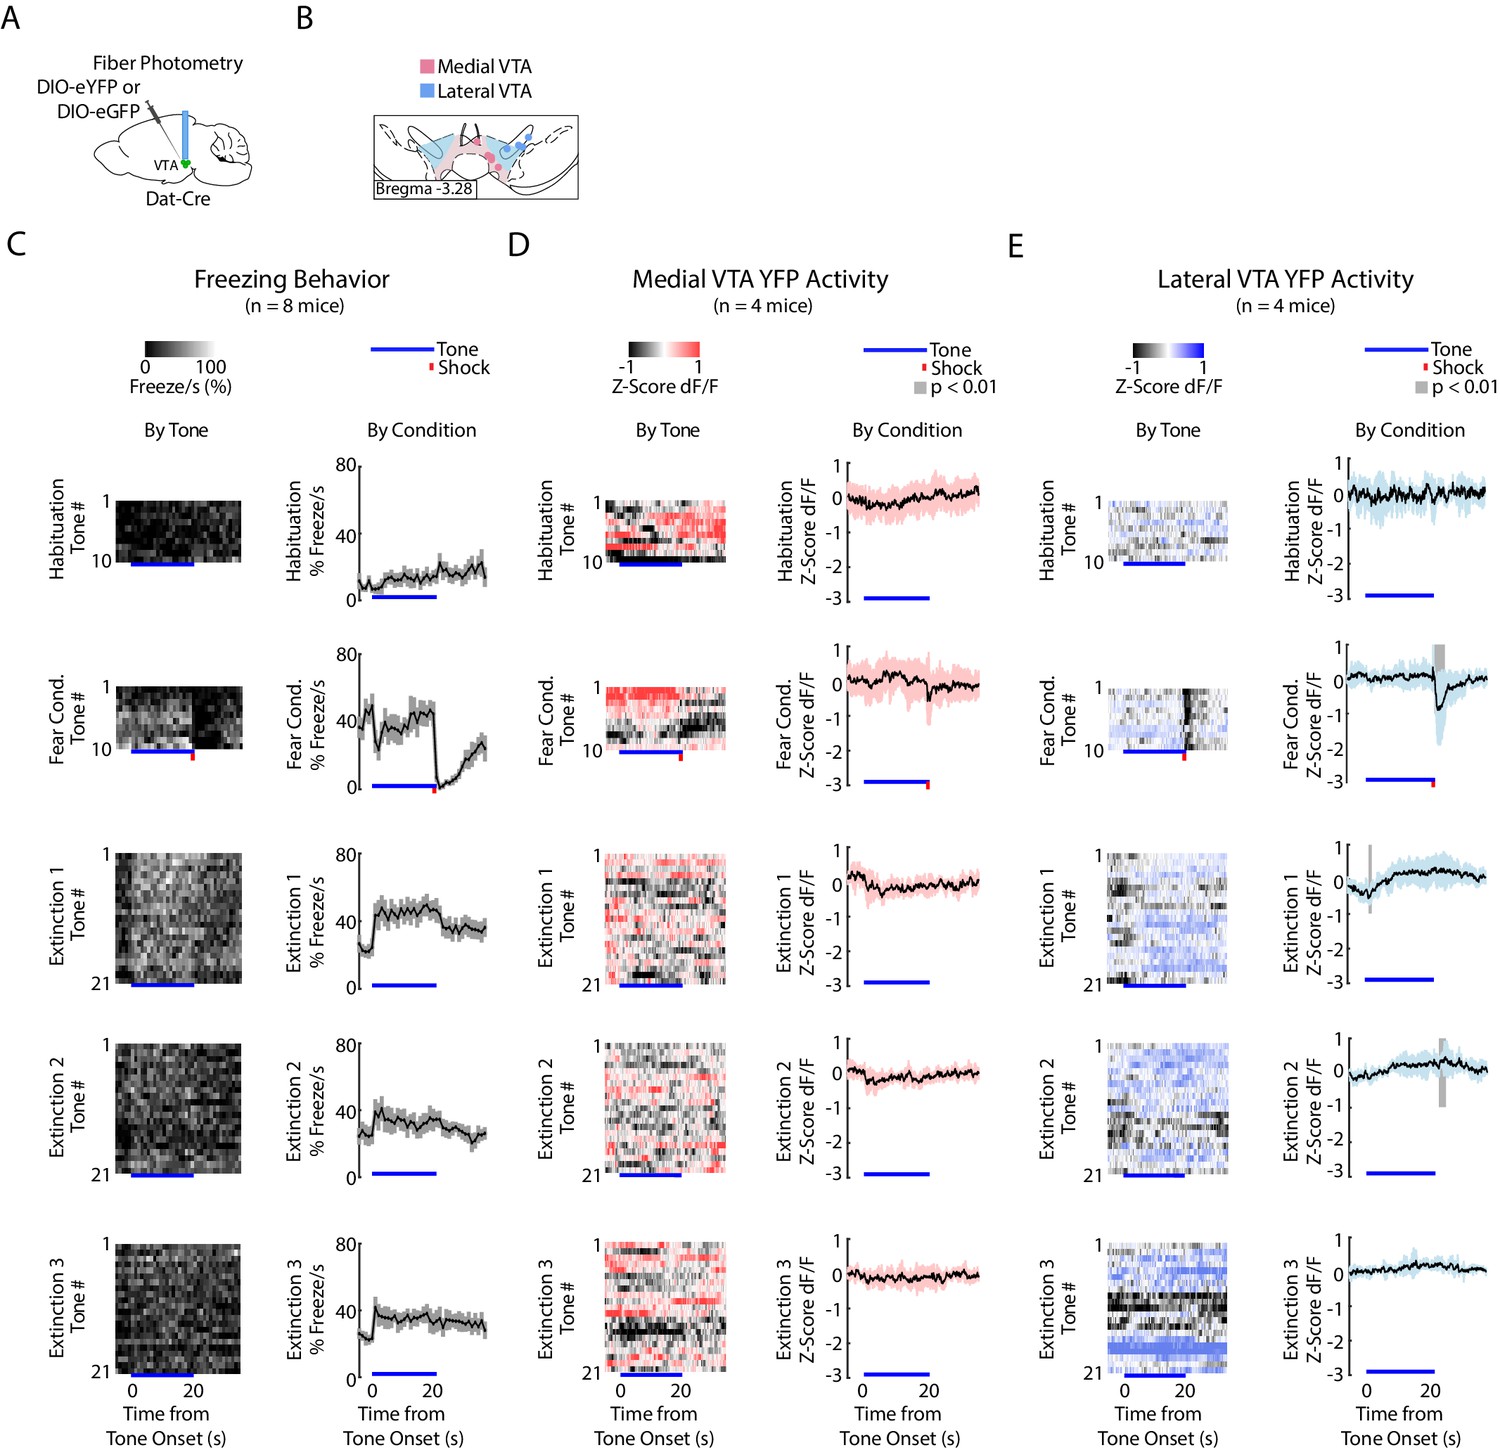
Medial and lateral VTA DIO-eYFP or DIO-eGFP motion artifacts during auditory fear conditioning and extinction.
(A.) Virus injection and fiber placement for fiber photometry. (B) Medial and lateral VTA fiber placements visualized at Bregma = −3.28 AP. (C-E) Behavior and eYFP or eGFP fluorescence during auditory fear conditioning and extinction. At the bottom of each subplot, bright blue lines denote tone duration, red tick denotes shock duration. (C) Left column: Time course of mean percent freezing for each tone during each experiment condition (n = 8 mice). For each subplot, color intensity corresponds to freezing percentage. Right column: Time course of mean percent freezing over all tones for each condition (n = 8 mice). Gray shading denotes one standard deviation. (D) Left column: Time course of eYFP or eGFP fluorescence in medial VTA for each tone during each experiment condition (n = 4 mice). For each subplot, color intensity denotes GCaMP6f z-score dF/F. Right column: Time course of mean eYFP or eGFP fluorescence over all tones for each condition (n = 4 mice). Pink shaded region denotes one standard deviation. Gray shaded region represents 1 s time points where fluorescence significantly deviates from shuffled data (percentile rank, p<0.01 after Bonferroni correction for multiple time point comparisons). (E) Same as D but for lateral VTA eYFP or eGFP fluorescence (n = 4 mice), using blue instead of pink shading.
Figure 3—figure supplement 5
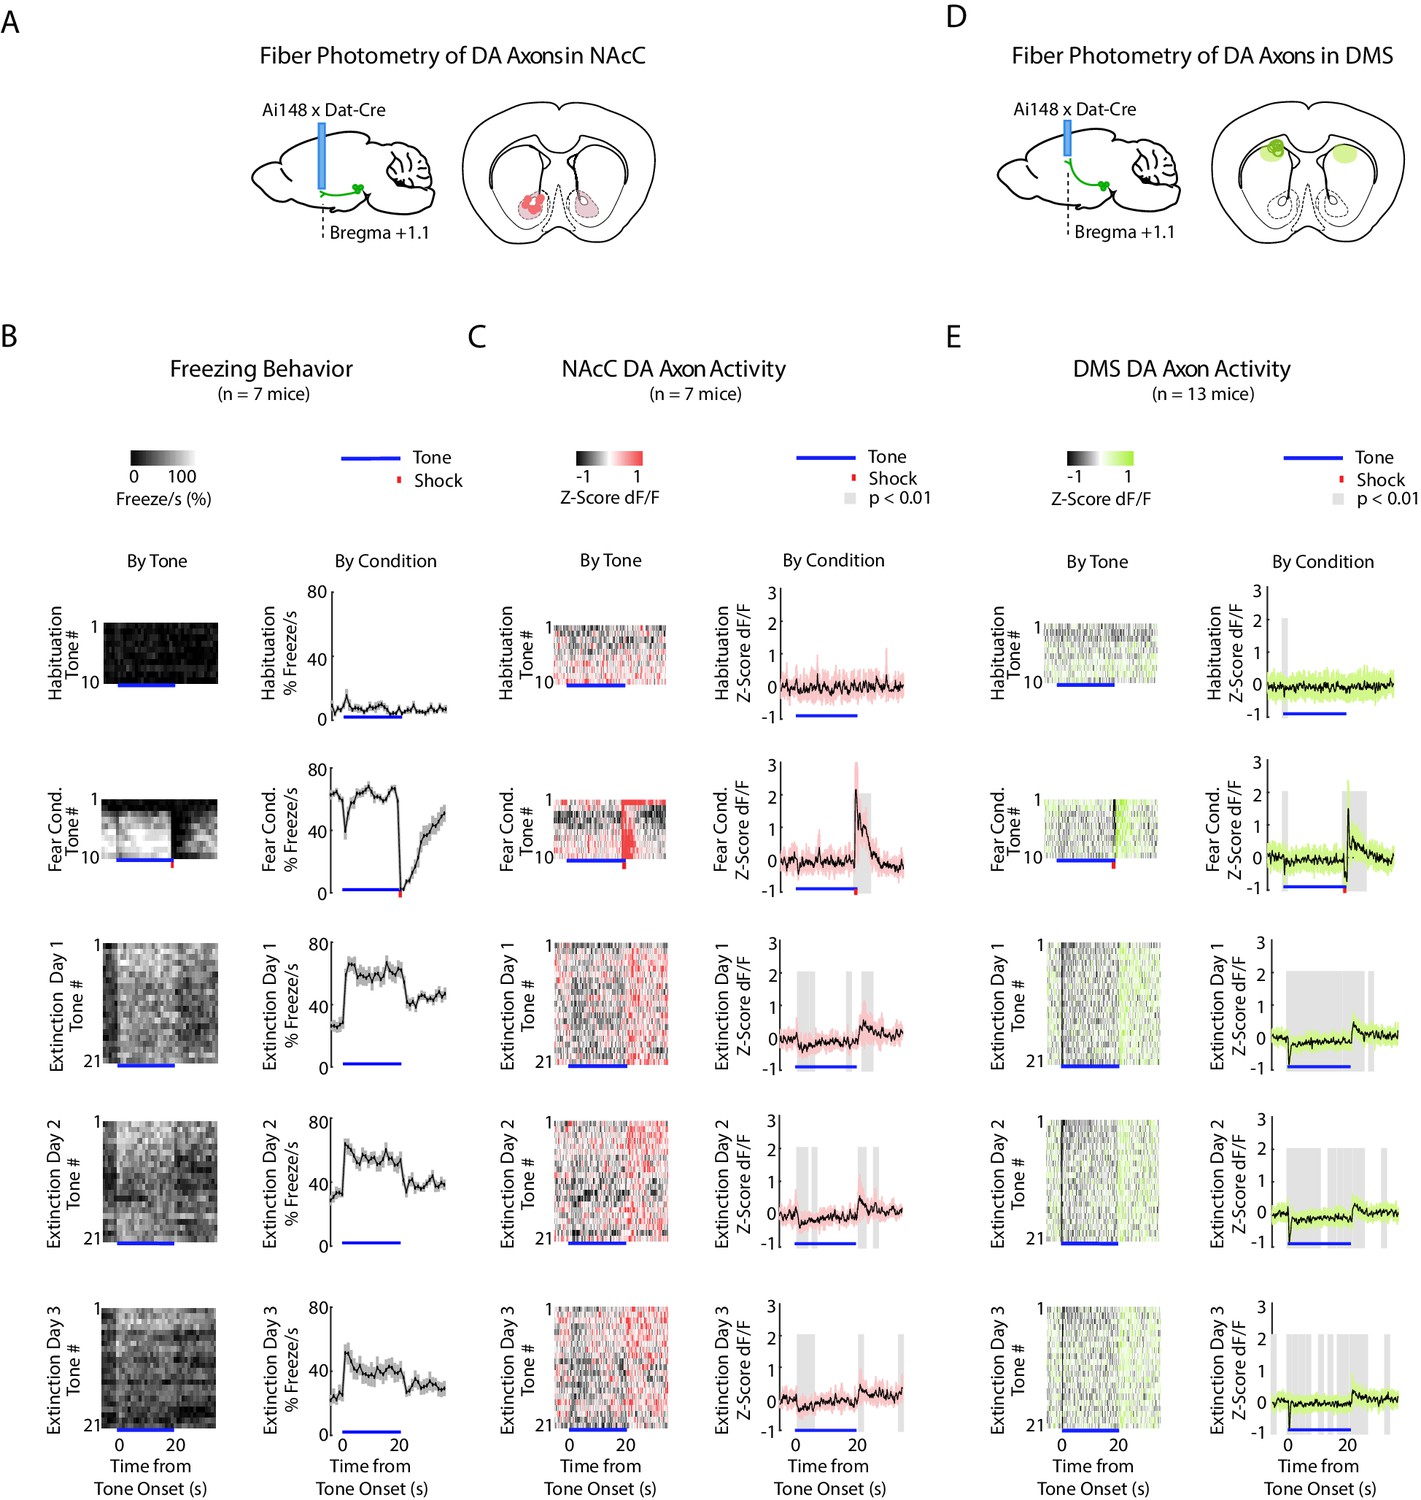
DA axons in NAcC and DMS during fear conditioning and extinction.
(A) Fiber photometry recordings of DA axons in NAcC. Left: Midbrain sagittal slice of fiber implant in NAcC of Ai148 x Dat-Cre mice. Right: NAcC fiber placements, visualized at bregma = +1.1 AP. Circles indicate fiber tips, shading indicates approximate boundaries of the NAcC. (B-C) Mean freezing and NAcC DA axon activity for 5 experiment conditions: habituation, fear conditioning, extinction day 1, 2 and 3. At the bottom of each condition subplot, blue line denotes tone duration, red tick denotes shock. (B) Left column: Time course of mean percent freezing for each tone in each condition (n = 7 mice). Color intensity corresponds to freezing percentage. Right column: Time course of mean percent freezing over all tones for each condition (n = 7 mice). Gray shading denotes 1 standard deviation. (C) Left column: Time course of mean NAcC DA axon activity (GCaMP6f fluorescence) for each tone in each condition (n = 7 mice). Color intensity denotes GCaMP6f z-score dF/F. Right column: Time course of mean NAcC DA axon activity (GCaMP6f fluorescence) over all tones for each condition (n = 7 mice). Pink shading denotes one standard deviation. Gray shading represents 1 s time bins where GCaMP6f significantly deviates from shuffled data (percentile rank, p < 0.01 after Bonferroni correction for multiple time point comparisons). (D) Same as A, except for fiber photometry recordings of DA axons in DMS. (E) Same as C except for DMS DA axon activity using green shading instead of pink (n = 13 mice).
Figure 4 with 1 supplement
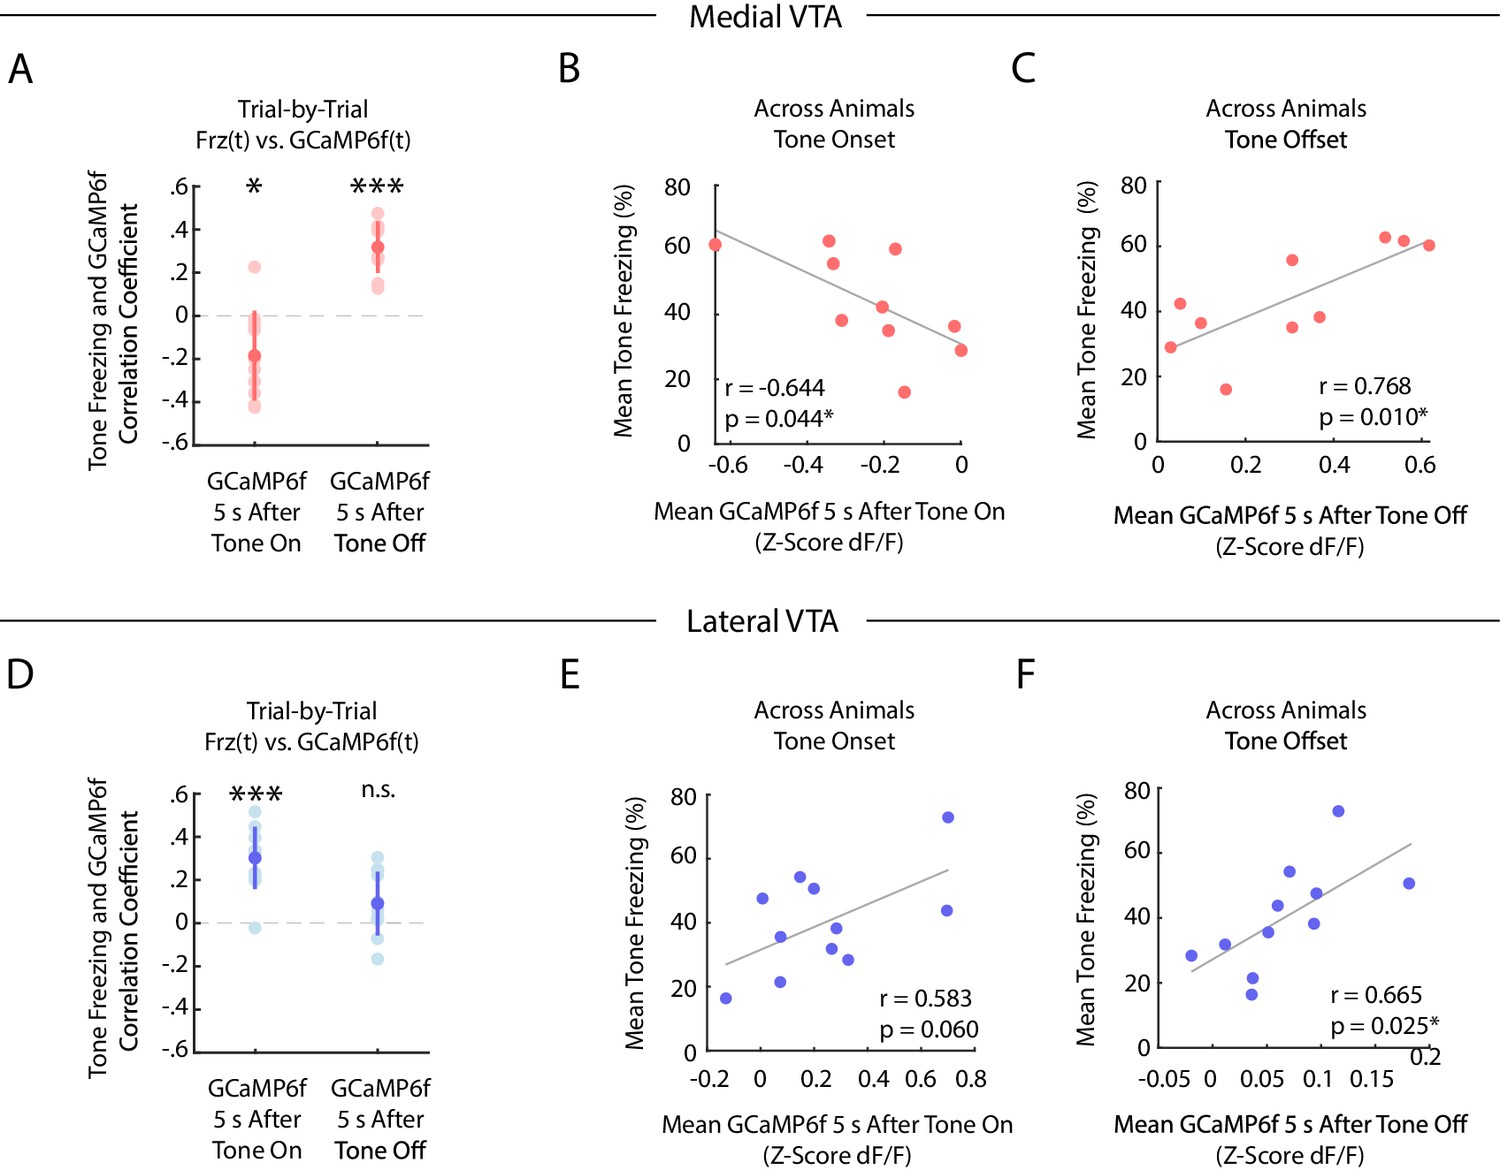
During auditory fear extinction, distinct correlations between tone freezing and DA neuron activity in medial and lateral VTA.
(A-C) Medial VTA trial-by-trial and across animal correlations between freezing and GCaMP6f during fear extinction. In each plot, each dot represents one mouse (n = 10 mice). (A) Trial-by-trial correlations: Pearson’s correlation coefficient per mouse between mean freezing during each extinction tone and mean GCaMP6f fluorescence 5 s at tone onset (left) or tone offset (right) of the same tone. Error bars denote one standard deviation. Stars denote correlation coefficients that significantly differ from a mean of 0 using one sample t-test (*p<0.05, ***p<0.001). (B) Across animal correlations: Correlation across mice between mean freezing during all extinction tones and mean GCaMP6f fluorescence during extinction 5 s at tone onset. Correlation coefficient (r) and p-values on the bottom left of plot; star denotes p<0.05. (C) Same as B, but for mean GCaMP6f fluorescence 5 s after tone offset. (D-F) Same as (A-C), but for lateral VTA trial-by-trial and across animal analysis (n = 11 mice).
Figure 4—figure supplement 1
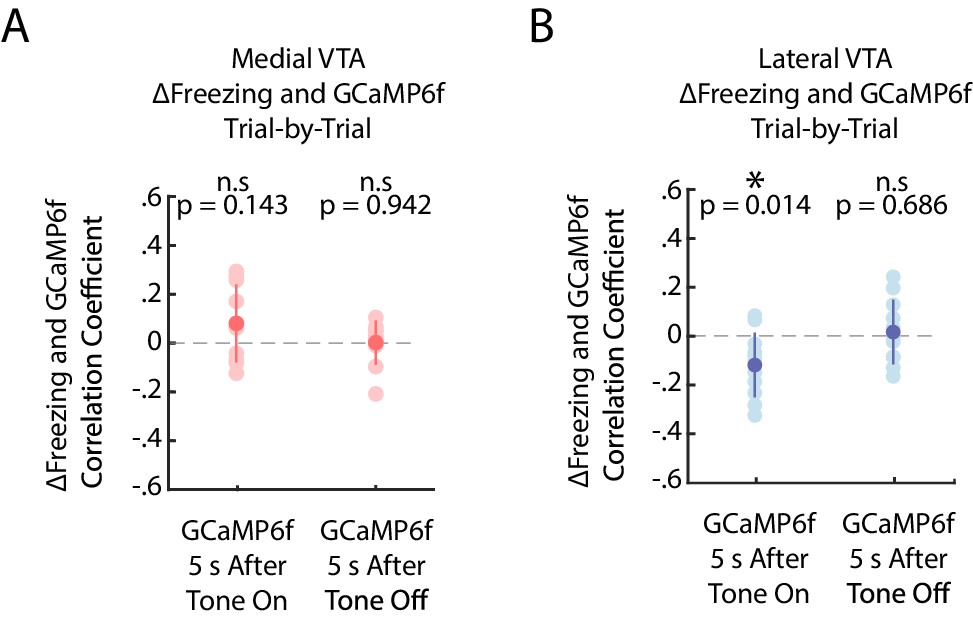
Lateral VTA DA neuron activity at cue onset correlates with change in freezing, while medial VTA activity does not.
(A) Trial-by-trial correlations between change in freezing and GCaMP6f in medial VTA DA neurons during fear extinction. Each pink dot represents one mouse’s Pearson’s correlation coefficient between change in freezing between next and current extinction tone and mean GCaMP6f fluorescence at tone onset (left) or tone offset (right) of the current tone (n = 10 mice). Dark pink dot represents the mean across mice, error bars denote one standard deviation. Stars denote correlation coefficients that significantly differ from a mean of 0 using one sample t-test (*p<0.05, **p<0.01, ***p<0.001). (B) Same as A but for GCaMP6f in lateral VTA DA neurons, in blue instead of pink.
Figure 5 with 3 supplements
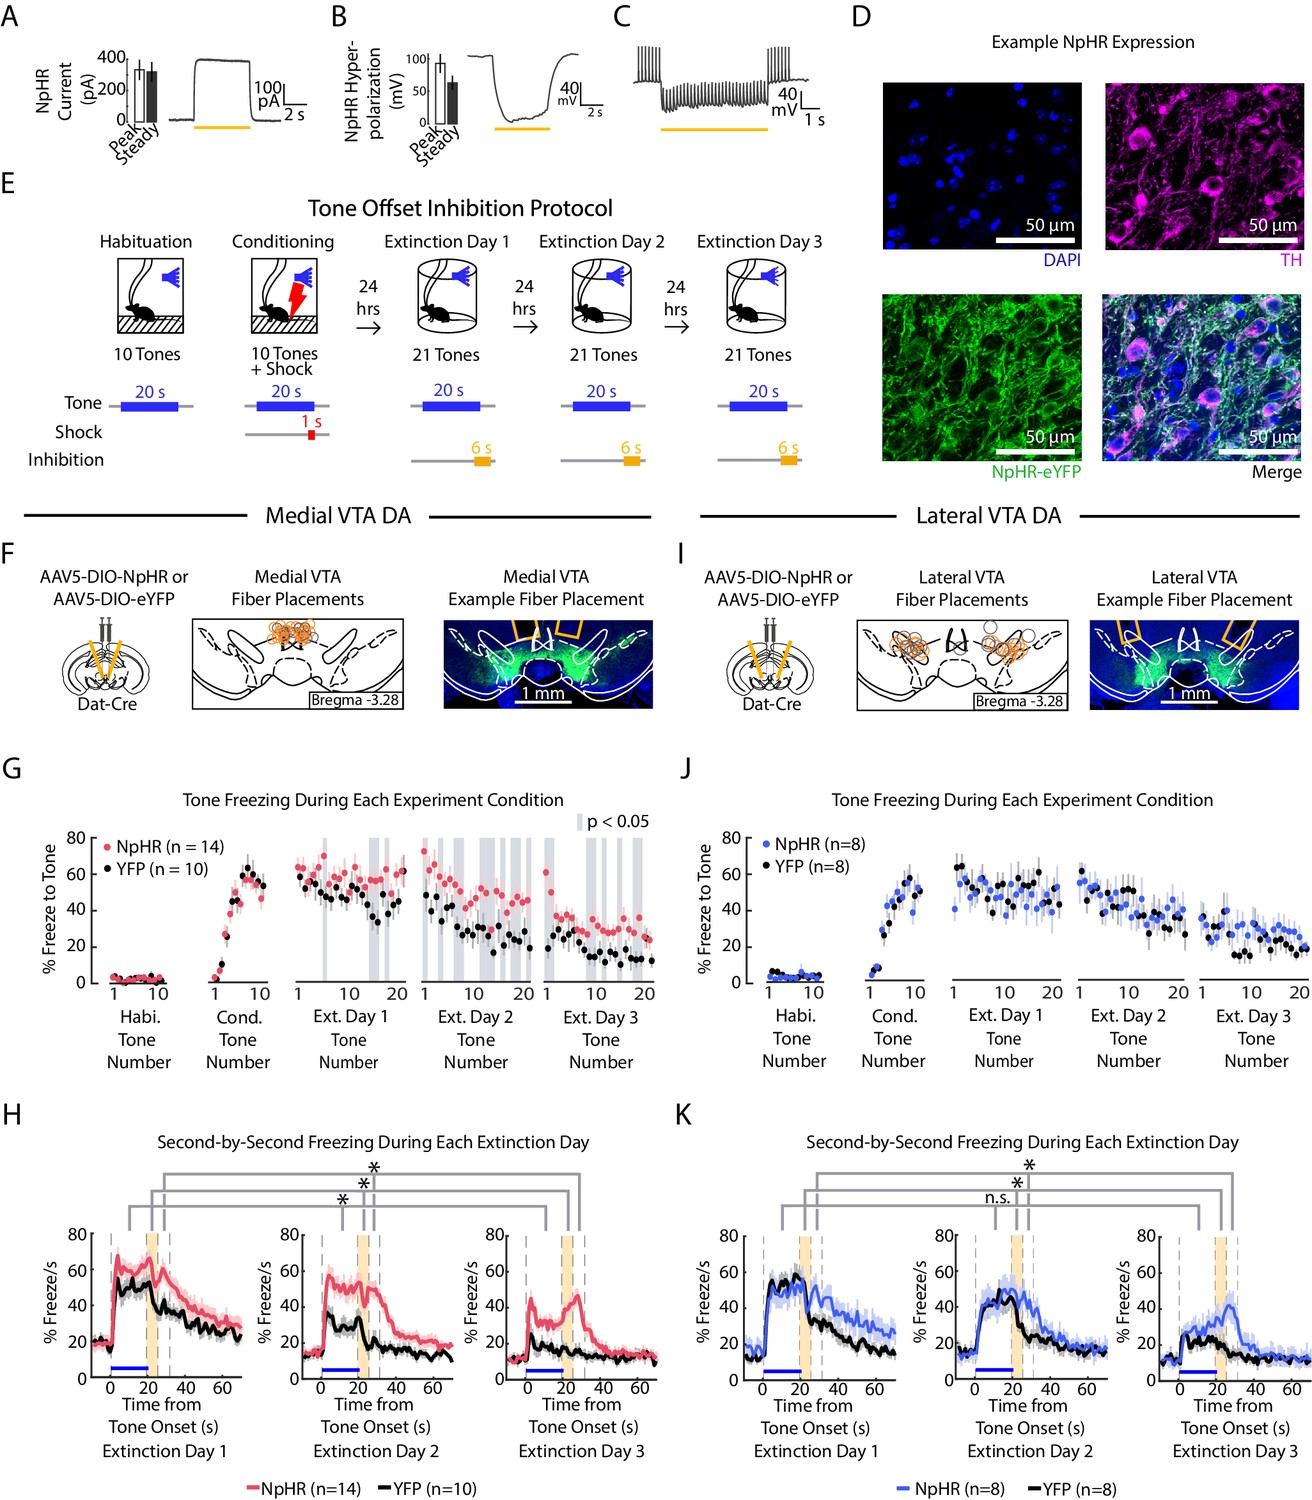
Optogenetic inhibition of medial but not lateral VTA DA neurons at tone offset slows auditory fear extinction.
(A-C) Photoinhibition of NpHR-expressing VTA DA neurons during ex vivo whole-cell recordings. (A) Left: Mean and SEM of photocurrents evoked during voltage clamp (n = 7 neurons; peak current: 332.15 ± 64.79 pA; steady state current: 318.84 ± 63.64 pA). Right: Example trace of photocurrent. (B) Mean and SEM of NpHR-mediated hyperpolarization during current clamp (n = 7 neurons; peak hyperpolarization from baseline: 92.76 ± 14.58 mV; steady state hyperpolarization from baseline: 62.93 ± 10.92 mV). Baseline resting potentials ranged from -50 to -60 mV. Right: Example trace of NpHR-mediated hyperpolarization. Baseline potential is -60 mV. (C) Example trace of photoinhibition of spikes generated by current injections (200 pA injections) during current clamp recording. Baseline potential is -57 mV. Yellow bar denotes photostimulation period. (D) Histology of example lateral VTA neurons showing cell nuclei (DAPI), tyrosine hydroxylase (TH), NpHR-eYFP. (E) Optogenetic inhibition protocol. Laser inhibition (594 nm) occurs for 6 s for every extinction tone, starting 1 s prior to tone offset and ending 5 s after tone offset. (F-H) Medial VTA DA neuron tone offset inhibition during fear extinction (n = 14 NpHR mice, n = 10 YFP mice). (F) Left: Schematic of injection of an AAV2/5 virus expressing Cre-dependent eNpHR3.0-YFP (or YFP-only virus) into the VTA of Dat-Cre mice, with fiber implant into medial VTA. Middle: medial VTA fiber placements, visualized at bregma = -3.28 AP. Circles indicate fiber tips, yellow circles indicate NpHR mice, grey circles indicate YFP mice. For full AP coordinates of fiber placements, see Figure 5—figure supplement 2A. Right: Example brain slice showing fiber placements in medial VTA. Green denotes NpHR3.0-eYFP. (G) Freezing during the tone for each tone number, by experiment condition: habituation, conditioning, extinction day 1, extinction day 2 and extinction day 3. Pink dots denote NpHR group, and black dots denote YFP control group. Error bars denote SEM. Gray shading denotes tone trials that significantly differ between NpHR and YFP group (post hoc student’s unpaired t-test, p < 0.05). (H) Percent freezing per second averaged across all tones for each extinction day during medial VTA tone offset inhibition (pink line denotes NpHR group, black line denotes YFP control group). Yellow shaded region denotes the inhibition period. Error bars denote SEM. Stars denote a significant group or interaction effect using a 2-factor ANOVA with group and tone number as factors, tone number being a repeated measure. This analysis was applied to predict freezing during the tone (group effect: F(1,62) = 7.528, p = 0.012; group × tone number interaction: F(1,62) = 1.056 p = 0.361), freezing during the 6 s inhibition period (group effect: F(1,62) = 17.668, p = 10−3; group × tone number interaction: F(1,62) = 1.371 p = 0.032), and freezing 6 s following the inhibition period (group effect: F(1,62) = 28.082, p < 10−4; group × tone number interaction: F(1,62) = 0.854 p = 0.782). (I) Same as F except for lateral VTA (n = 8 NpHR mice, n = 8 YFP mice). For full AP coordinates of fiber placements, see Figure 5—figure supplement 2B. (J-K) Same as (G-H), but for lateral VTA DA neuron tone offset inhibition during fear extinction, with blue representing the NpHR group and black representing YFP group. (J) Post hoc analysis was not conducted because the 2-factor ANOVA in K did not yield a significant group effect on tone freezing. (K) Stars denote a significant group or interaction effect using a 2-factor ANOVA with group and tone number as factors, tone number being a repeated measure. This analysis was applied to predict freezing during the tone (group effect: F(1,62) = 0.002, p = 0.964; group × tone number interaction: F(1,62) = 1.121 p = 0.249), freezing during the 6 s inhibition period (group effect: F(1,62) = 1.150, p = 0.302; group × tone number interaction: F(1,62) = 1.387 p = 0.029), and freezing 6 s following the inhibition period (group effect: F(1,62) = 6.981, p = 0.019; group × tone number interaction: F(1,62) = 1.480 p = 0.011).
Figure 5—figure supplement 1

Medial or lateral VTA DA neuron inhibition causes real time place aversion and decreased velocity.
(A) Experiment schematic: 5 min baseline two-chamber exploration followed by 15 min real time place aversion assay (RTPA). Bottom: Legend for plots (B-E). (B) Difference between the percent of time mice spent in right minus left chamber during 5 min baseline. (C) Difference between the velocity in right minus left each chamber during the 5 min baseline. (D) Difference between the percent of time mice spent in laser minus no laser chamber during 15 min RTPA with laser inhibition. (E) Difference between the mouse velocity in laser minus no laser chamber during 15 min RTPA with laser inhibition. (B-E) In each plot, each light shade dot corresponds to one mouse. Darker shade dot represents mean, and error bars denote 1 standard deviation. A 2-factor ANOVA was used to determine significane between group (NpHR or YFP) or region of interest (medial or lateral VTA). n.s. denotes not significant and *, **, *** denotes p<0.01, p<10−4 or p<10−5 for the group factor. Region of interest and interaction between group x region of interest yielded no significance in all cases.
Figure 5—figure supplement 2
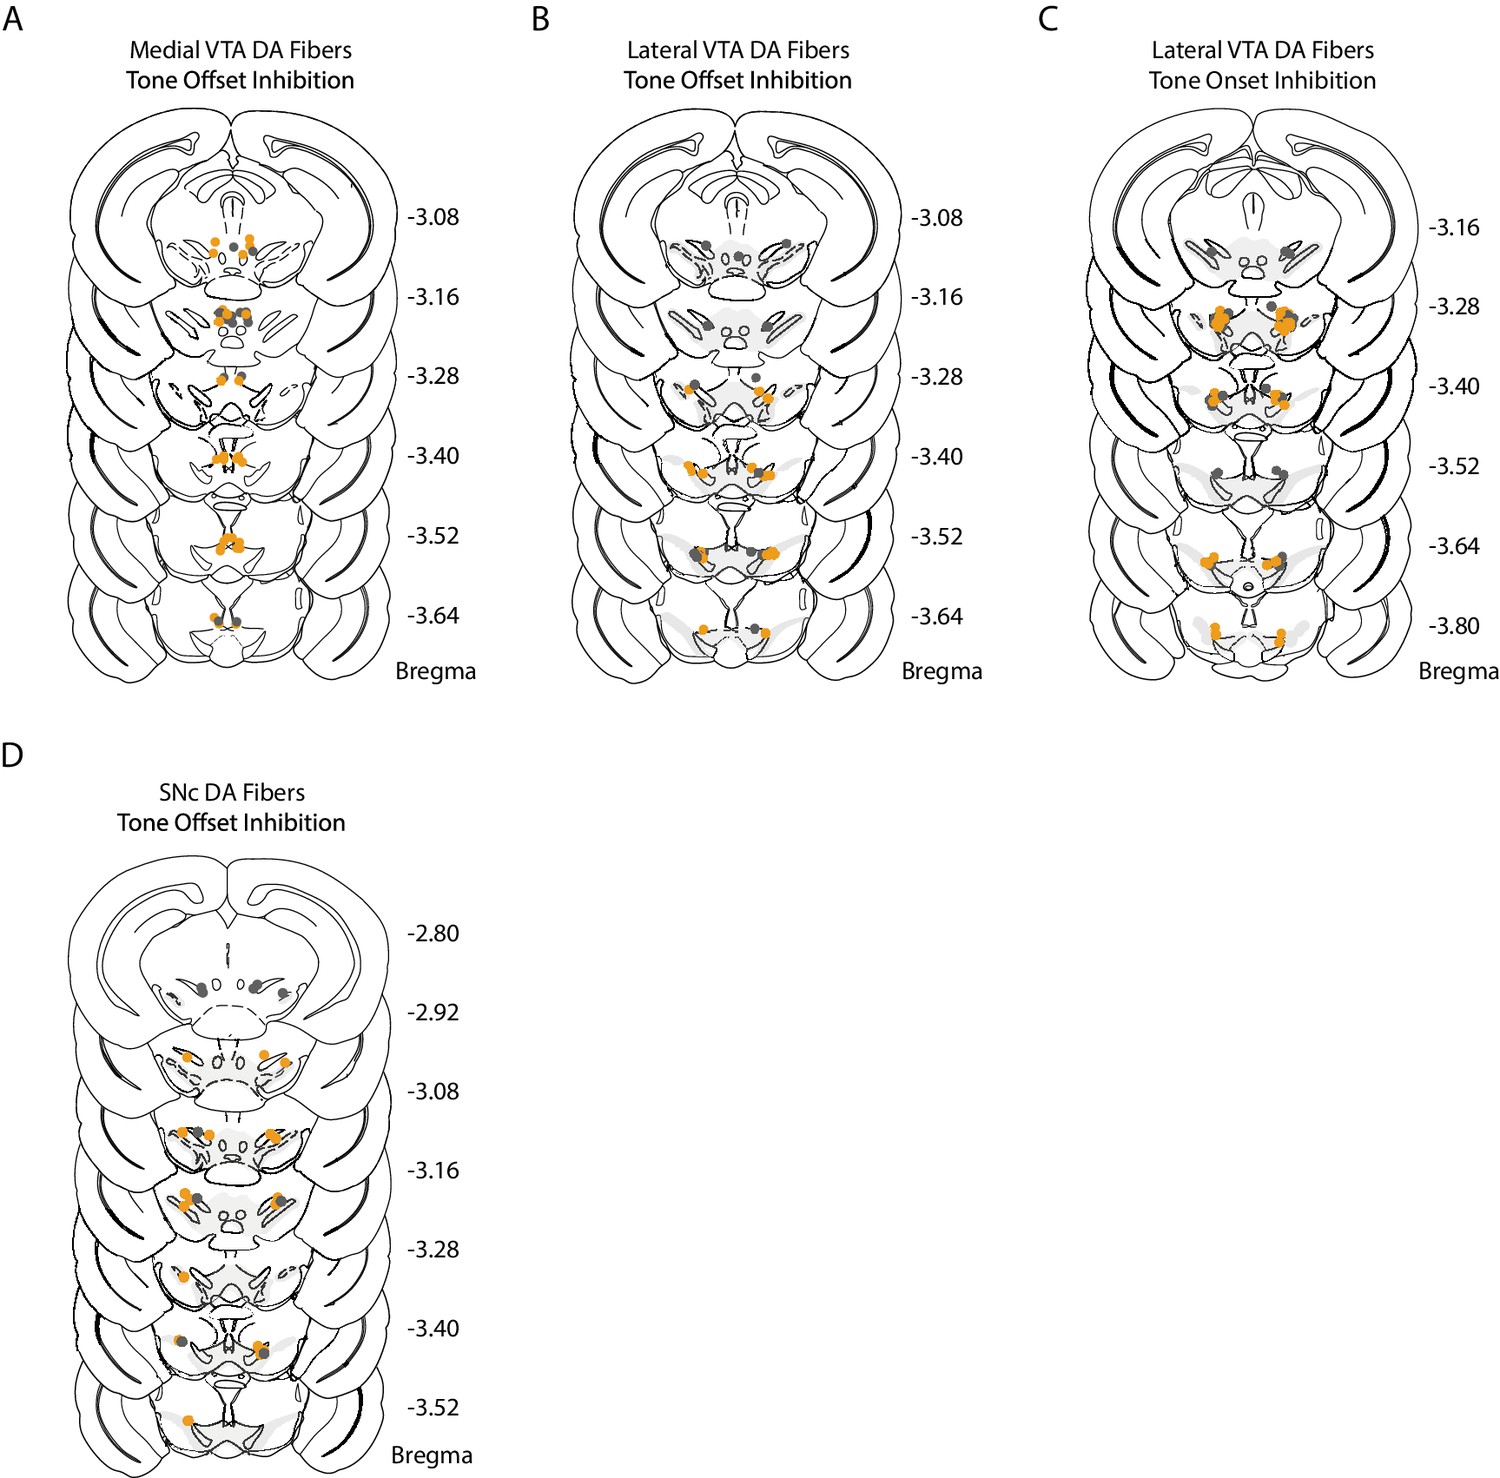
Medial VTA, lateral VTA, and SNc fiber placements for optogenetic inhibition.
Histology for optogenetic experiments (expanded across the anterior-posterior coordinates of Bregma from Figures 5F, I and 6B). Dots represent individual optic fiber placement: orange dots for mice injected with AAV2/5-DIO-NpHR-eYFP, grey dots for control mice injected with AAV2/5-DIO-eYFP. (A) Bilateral fiber placement for medial VTA inhibition during tone offset (NpHR = 14, YFP = 10 mice). (B) Bilateral fiber placement for lateral VTA inhibition during tone offset (NpHR = 8, YFP = 8 mice). (C) Bilateral fiber placement for lateral VTA inhibition during tone onset (NpHR = 12, YFP = 10 mice). (D) Bilateral fiber placement for SNc inhibition during tone offset (NpHR = 7 mice, YFP = 6 mice).
Figure 5—figure supplement 3
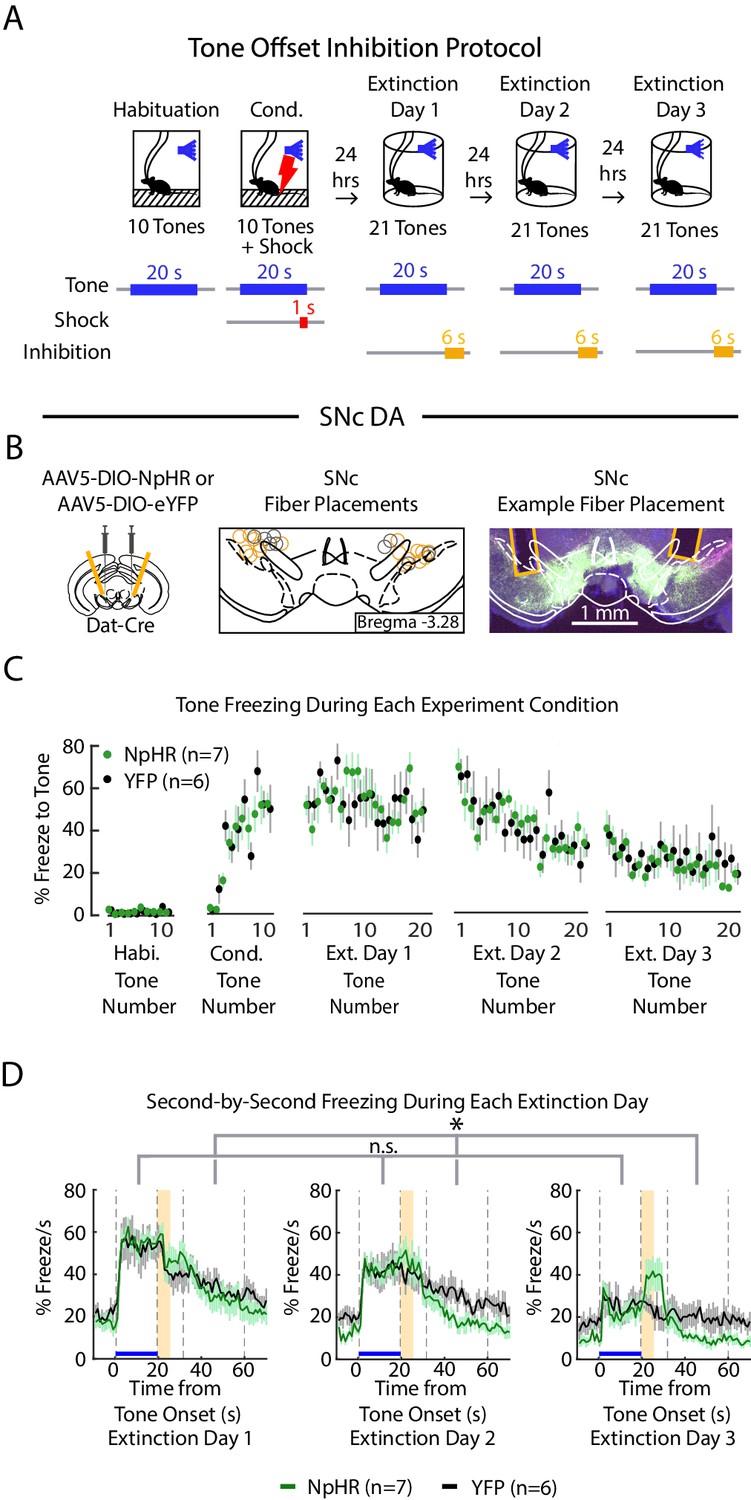
Optogenetic inhibition of SNc DA neurons at tone offset.
(A) Optogenetic inhibition protocol. Laser (594 nm) inhibition occurs 1 s prior to tone offset and lasts for 6 s. (B) SNc DA neuron tone offset inhibition during fear extinction (n = 7 NpHR mice, n = 6 YFP mice). Left: Schematic of injection of an AAV2/5 virus expressing Cre-dependent eNpHR3.0-YFP (or YFP-only virus) into the SNc of Dat-Cre mice, with fiber implant into SNc. Middle: SNc fiber placements, visualized at bregma = -3.28 AP. Circles indicate fiber tips, yellow circles indicate NpHR mice, grey circles indicate YFP mice. For full AP coordinates of fiber placements, see Figure 5—figure supplement 2D. Right: Example brain slice showing fiber placements in SNc. Green denotes NpHR3.0-eYFP. (C) Mean freezing during the tone for each tone number, by experiment condition: habituation, conditioning, extinction day 1, extinction day 2 and extinction day 3. Green dots denote NpHR group, and black dots denote YFP control group. Error bars denote SEM. (D) Percent freezing per second averaged across all tone trials for each extinction day during SNc tone offset inhibition (green line denotes NpHR group, black line denotes YFP control group). Yellow shaded region denotes inhibition period. Error bars denote SEM. Star denotes significant effect and “n.s.” denotes no significant effect using a 2-factor ANOVA with group and tone number as factors, tone number being a repeated measure. This analysis was applied to predict freezing during the tone: group effect: F(1,62) = 0.008, p = 0.930; group × tone interaction: F(1,62) = 0.962, p = 0.560, and freezing during 30 s of the inter-trial interval: group effect: F(1,62) = 4.980, p = 0.047; group × tone interaction: F(1,62) = 1.276, p 0.081.
Figure 6
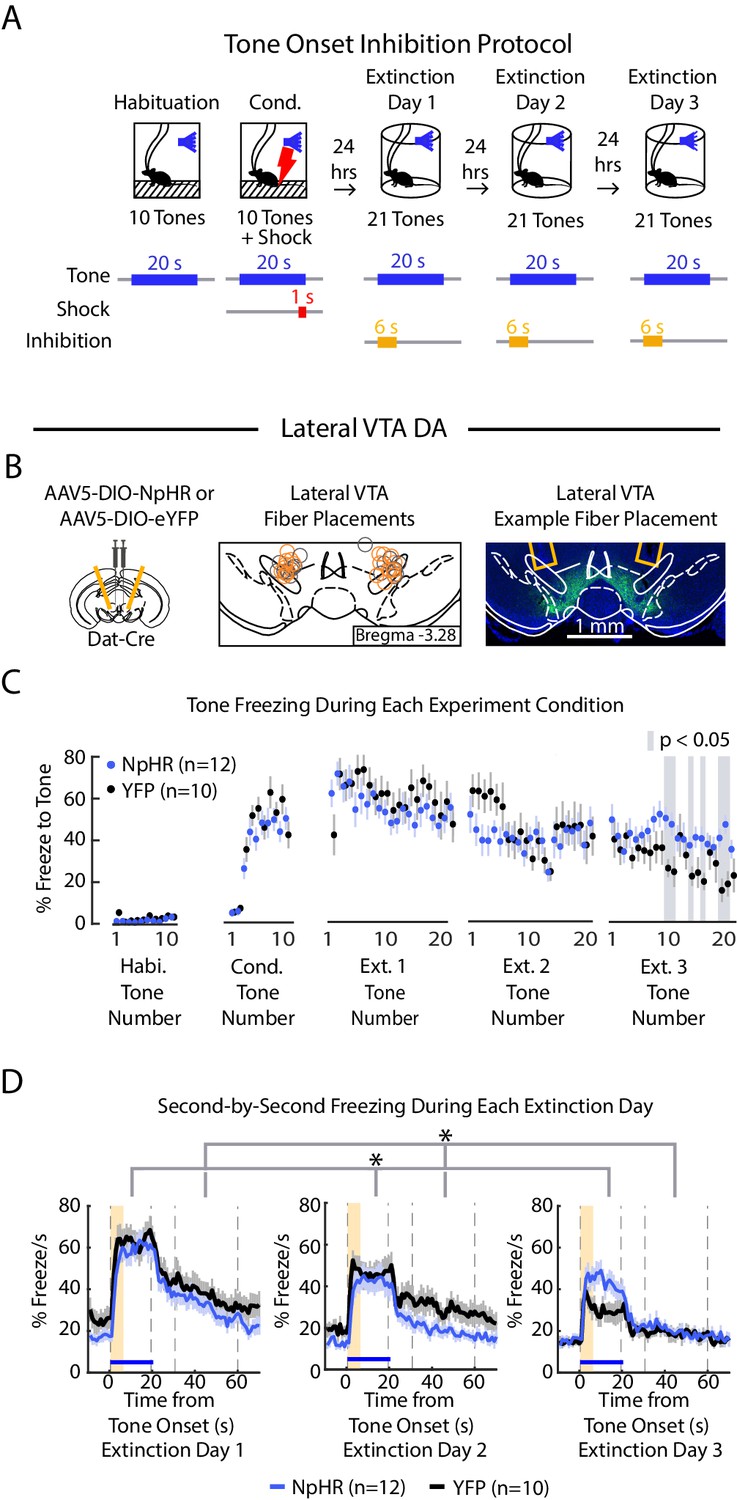
Optogenetic inhibition of lateral VTA DA neurons at tone onset slows auditory fear extinction.
(A) Optogenetic inhibition protocol. Laser (594 nm) inhibition occurs simultaneously with tone onset for 6 s. (B) Lateral VTA DA neuron tone onset inhibition during fear extinction (n = 12 NpHR mice, n = 10 YFP mice). Left: Schematic of injection of an AAV2/5 virus expressing Cre-dependent eNpHR3.0-YFP (or YFP-only virus) into the VTA of Dat-Cre mice, with fiber implant into lateral VTA. Middle: lateral VTA fiber placements, flattened at bregma = -3.28 AP. Circles indicate fiber tips, yellow circles indicate NpHR mice, grey circles indicate YFP mice. For full AP coordinates of fiber placements, see Figure 5—figure supplement 2C. Right: Example brain slice showing fiber placements in lateral VTA. Green denotes NpHR3.0-eYFP. (C) Freezing during the tone for each tone number, by experiment condition: habituation, conditioning, extinction day 1, extinction day 2 and extinction day 3. Blue dots denote NpHR group, and black dots denote YFP control group. Error bars denote SEM. Gray shading denotes tone trials that significantly differ between NpHR and YFP group (post hoc student’s unpaired t-test, p < 0.05). (D) Percent freezing per second averaged across all tone trials for each extinction day during lateral VTA tone onset inhibition (blue line denotes NpHR group, black line denotes YFP control group). Yellow shaded region denotes inhibition period. Error bars denote SEM. Stars denote a significant interaction effect using a 2-factor ANOVA with group and tone number as factors, tone number being a repeated measure. This analysis was applied to predict freezing during the tone: group effect: F(1,62) = 0.014, p = 0.908; group × tone interaction: F(1,62) = 2.217, p < 10−6, and freezing 30 s during the ITI: group effect: F(1,62) = 6.477, p = 0.019; group × tone number interaction: F(1,62) = 1.562 p = 0.004.
Author response image 1
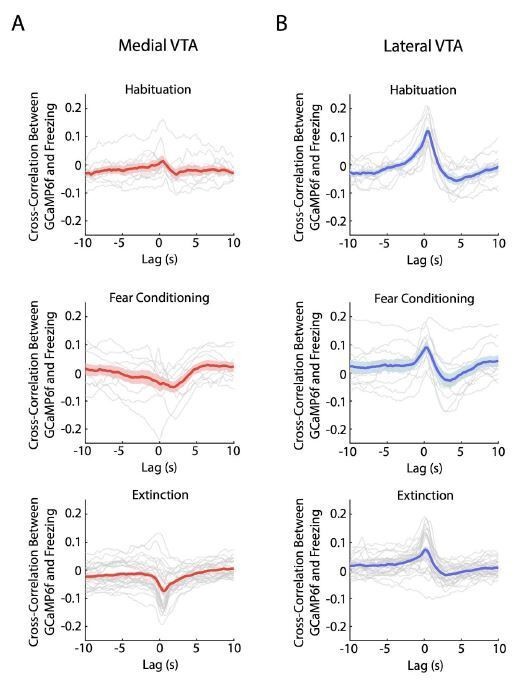
Crosscorrelation between medial and lateral VTA dopamine neuron activity and freezing behavior.
(A) Crosscorrelation between medial VTA dopamine neuron activity and freezing behavior during different experiment conditions: habituation (top plot), fear conditioning (middle plot), and fear extinction (bottom plot). For each plot, red line is the mean cross-correlation across mice, pink shading denotes SEM. Grey lines denote cross-correlation of an individual mouse for each experiment condition (n = 10 mice for habituation and fear conditioning sessions, n = 10 mice with 3 extinction days per mouse for fear extinction session). (B) Same as A, but for Lateral VTA, using blue instead of red line and shading to represent mean crosscorrelation across mice (n = 11 mice).
Additional files
Download links
A two-part list of links to download the article, or parts of the article, in various formats.
Downloads (link to download the article as PDF)
Open citations (links to open the citations from this article in various online reference manager services)
Cite this article (links to download the citations from this article in formats compatible with various reference manager tools)
Distinct signals in medial and lateral VTA dopamine neurons modulate fear extinction at different times
eLife 9:e54936.
https://doi.org/10.7554/eLife.54936


