Spatially compartmentalized phase regulation of a Ca2+-cAMP-PKA oscillatory circuit
- Department of Biophysics and Biophysical Chemistry, The Johns Hopkins University School of Medicine, United States
- Department of Pharmacology, University of California, San Diego, United States
- Chemical Engineering Graduate Program, University of California, San Diego, United States
- Department of Mechanical and Aerospace Engineering, University of California, San Diego, United States
- Department of Chemistry and Biochemistry, University of California, San Diego, United States
Figures
Figure 1 with 2 supplements
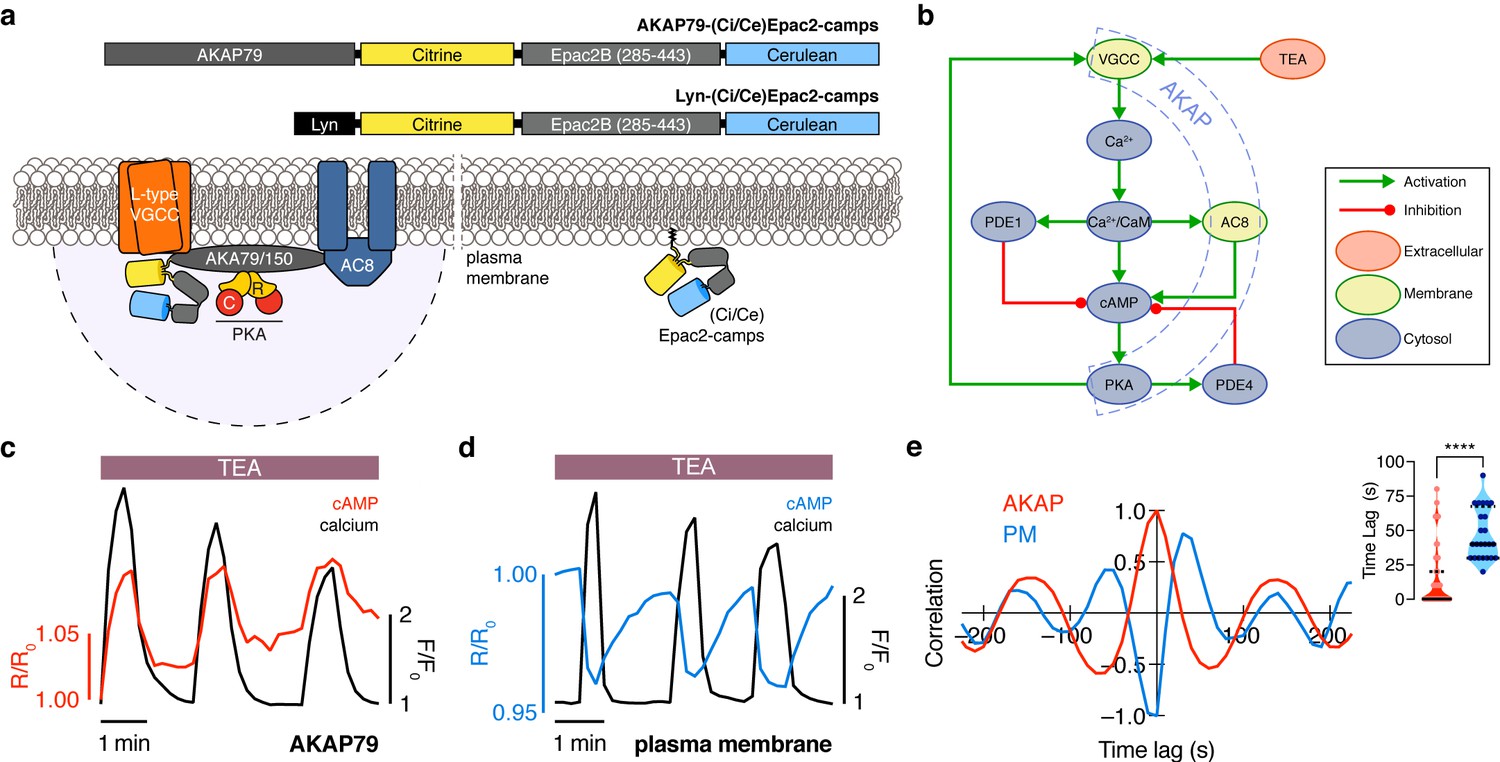
The phase of oscillating cAMP is shifted between the AKAP79/150 compartment and the general plasma membrane compartment, relative to Ca2+.
(a) Depiction of the AKAP79/150 and plasma membrane compartments, including the targeted cAMP biosensor (Ci/Ce)Epac2-camps to measure the compartment-specific cAMP signaling. Schematics of the lyn-(Ci/Ce)Epac2-camps and AKAP79-(Ci/Ce)Epac2-camps sensors are shown above. (b) Network diagram describing the key players in the β cell Ca2+-cAMP-PKA oscillatory circuit. (c) Representative single-cell trace of in-phase oscillating responses of AKAP79-(Ci/Ce)Epac2-camps and RCaMP, whole-cell fluorescence measured. Red trace is cAMP (cyan direct channel divided by CY-FRET channel) and black trace is Ca2+ (RFP). (d) Representative single-cell trace of out-of-phase oscillating responses of lyn-(Ci/Ce)Epac2-camps and RCaMP, whole-cell fluorescence measured. Blue trace is cAMP (cyan direct channel divided by CY-FRET channel) and black trace is Ca2+ (RFP). (e) Cross-correlation between the oscillatory Ca2+ and cAMP signals from the representative in-phase AKAP79 (red) and out-of-phase plasma membrane (PM, blue) responses from c, d. Time lag (sec) between the cAMP and Ca2+ signals for the two compartments (AKAP79/150, red, is 13 ± 3 sec n=60 and PM, blue, is 47 ± 4 s n=24). ****p<0.0001; unpaired two-tailed Student’s t-test.
Figure 1—figure supplement 1
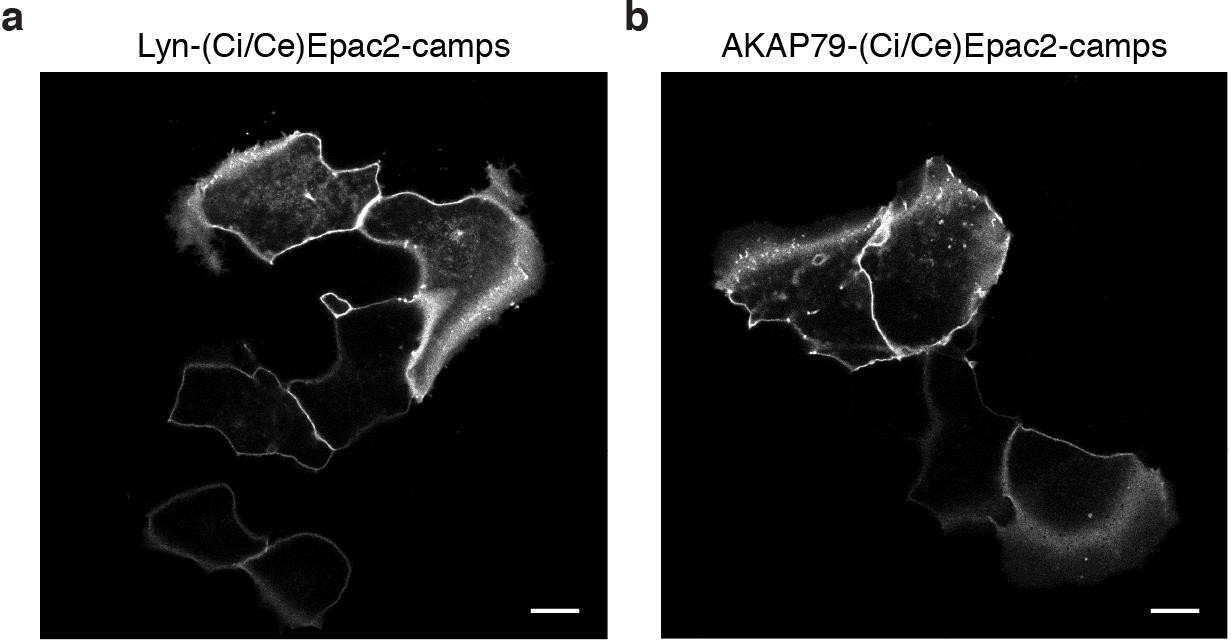
The AKAP79/150 and PM-targeted sensors are localized at the plasma membrane.
(a) Confocal image of lyn(Ci/Ce)Epac2camps showing efficient localization of the probe at the PM in MIN6 cells (YFP channel, scale 5 μm). (b) Confocal image of AKAP79-(Ci/Ce)Epac2camps also depicting localization of the scaffold-fused biosensor at the PM in MIN6 cells (YFP channel, scale 5 μm).
Figure 1—figure supplement 2
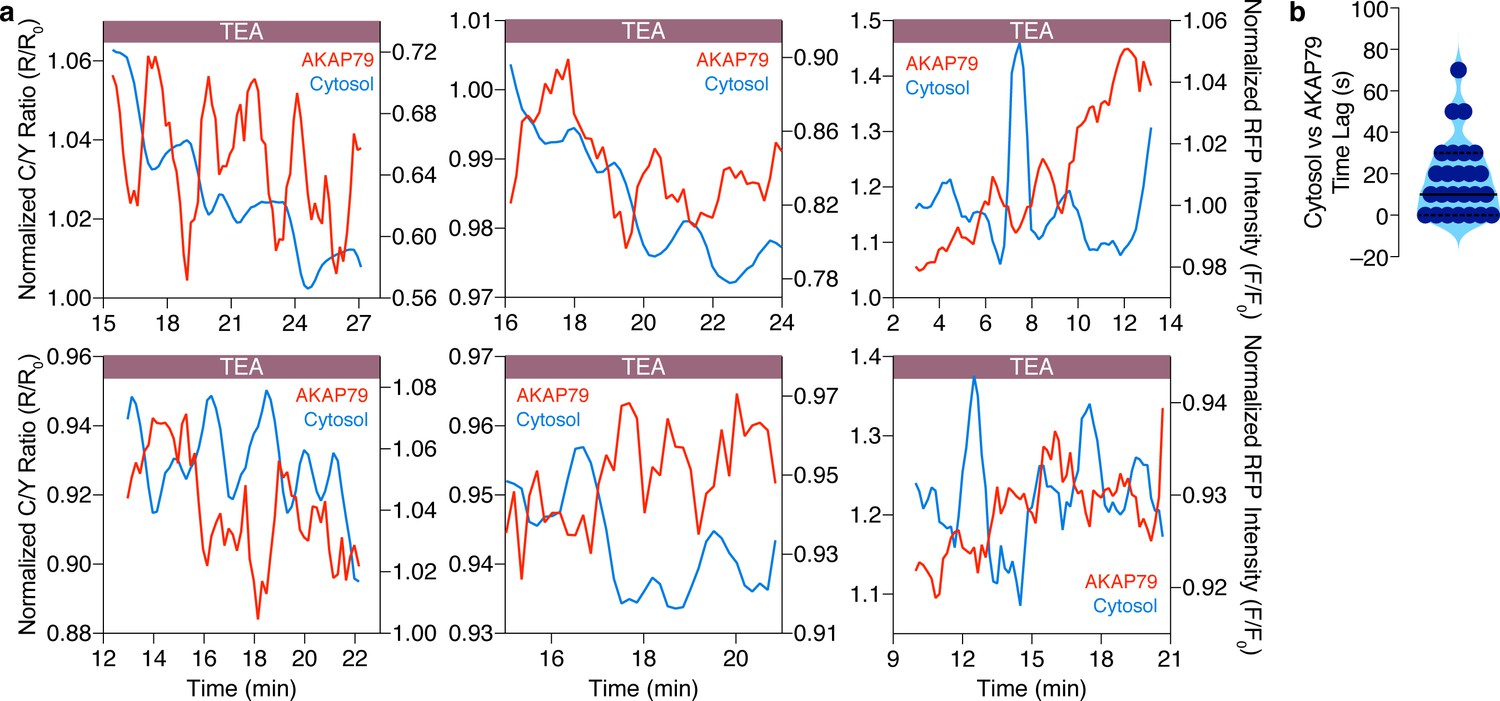
Cytosolic and AKAP79-specific cAMP oscillations are anti-correlated in the same cell.
(a) Representative single-cell traces showing that cytosolic cAMP (red, measured with R-FlincA sensor) oscillations are anti-correlated with cAMP oscillations at AKAP79 (blue, measured with AKAP79-(Ci/Ce)Epac2-camps) within individual MIN6 β cells ( n = 25 cells total). (b) Violin plot summarizing the time lag (sec) between the cytosolic and AKAP79-localized cAMP oscillations within all of the cells analyzed (n = 25).
Figure 2 with 3 supplements
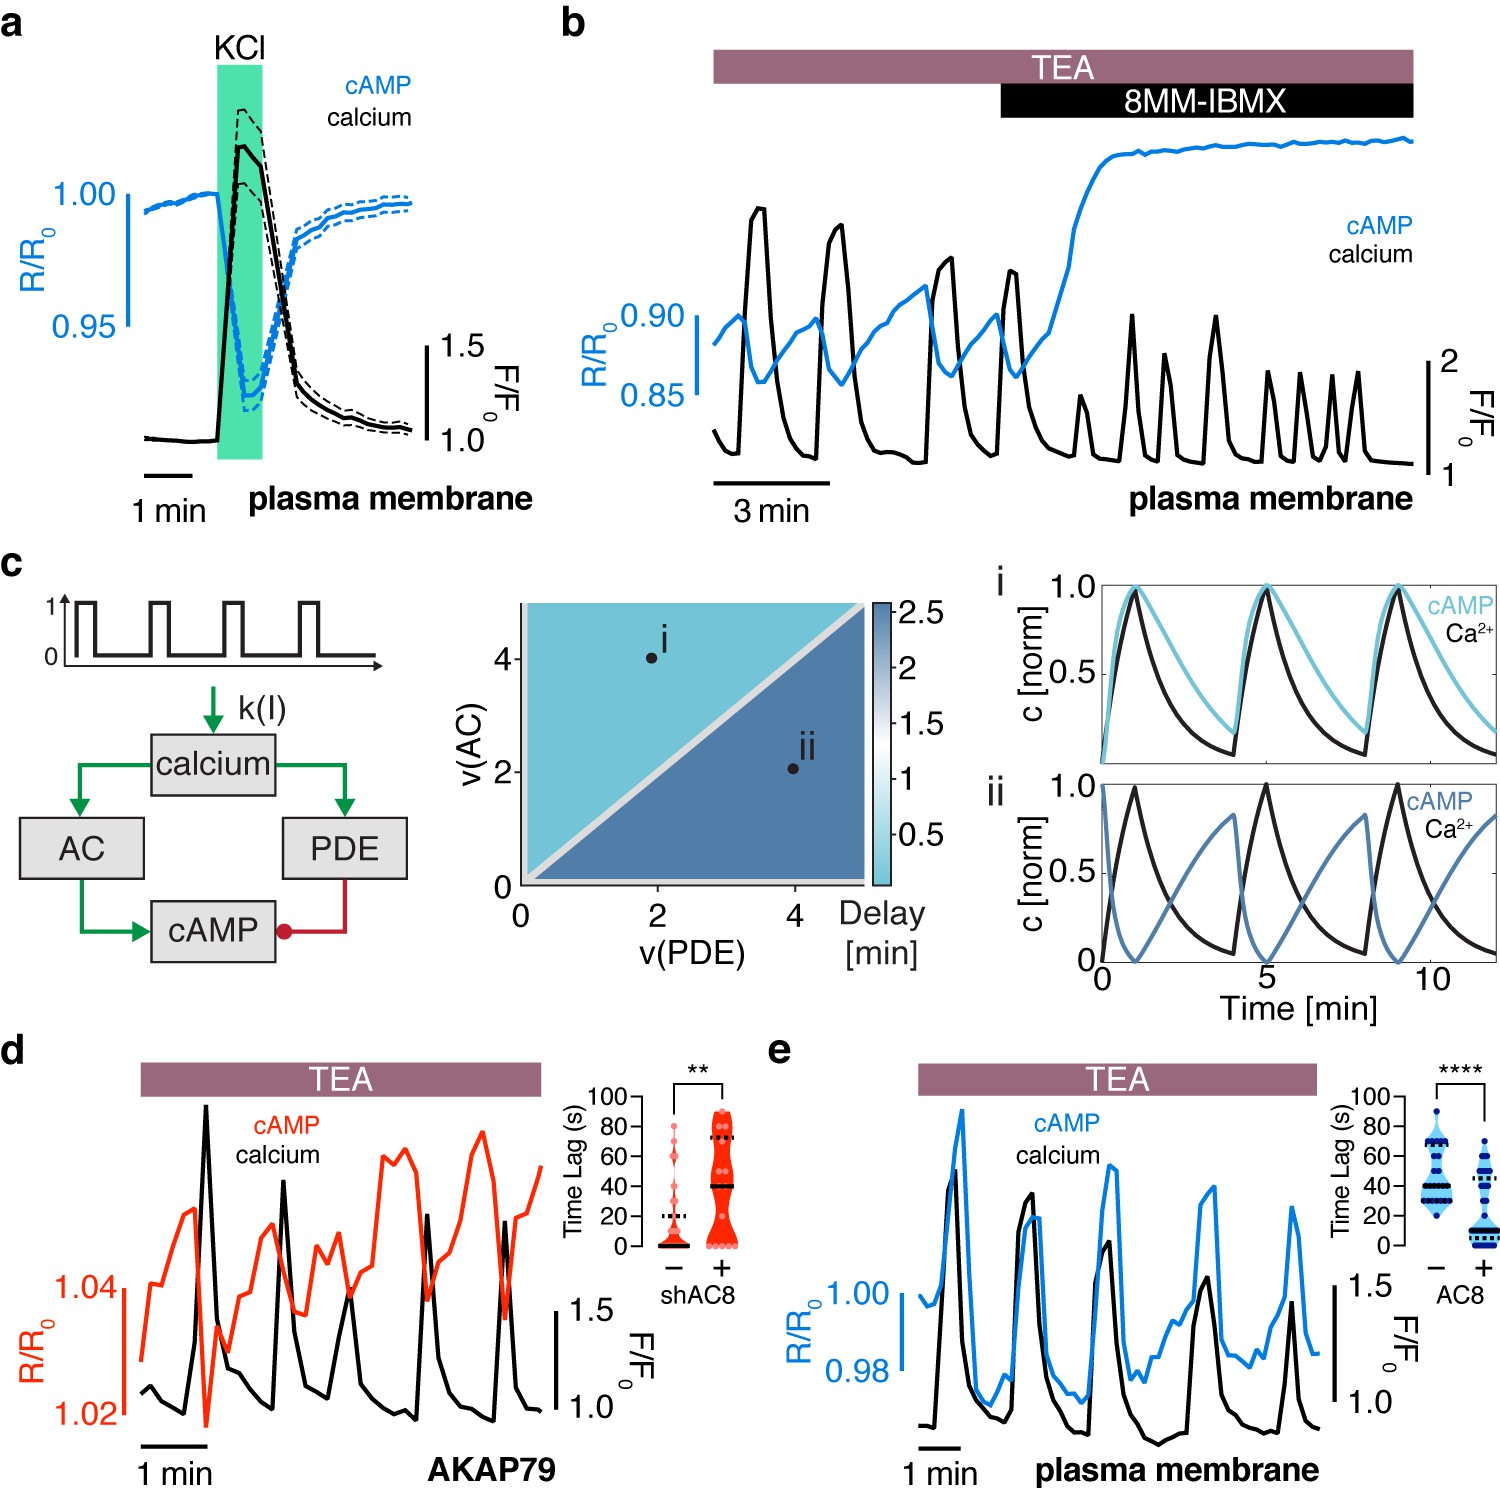
The oscillation phase is regulated by a balance between Ca2+-sensitive AC and PDE activity.
(a) Impulse response of plasma membrane cAMP (blue) to a spike in Ca2+ entry (black), triggered by KCl-mediated membrane depolarization (wash in/out). The transient decrease in PM-cAMP is coupled to the transient increase in intracellular Ca2+. (b) Acute inhibition of Ca2+-sensitive PDE1 decouples the out-of-phase PM-cAMP oscillations from Ca2+ oscillations, as observed in this representative cell trace (Ca2+ – black, PM-cAMP – blue). (c) The oscillatory phase of cAMP can be manipulated by tuning the relative activity of Ca2+-sensitive PDE and AC, as demonstrated by a simplified mathematical model. The schematic shows the network architecture. The relative activities of AC and PDE, denoted as v(AC) and v(PDE), control the delay between Ca2+ and cAMP. Point (i), with high AC activity and low PDE, shows in phase oscillations of Ca2+ and cAMP, whereas point (ii), with high PDE and low AC activity shows out of phase oscillations. These dynamics are shown in the line graphs. (d) Knocking down AC8 is correlated with an increase in the time lag for oscillatory cAMP at the AKAP79/150 microdomain (37 ± 9 s, n = 11), indicating more cells exhibiting out-of-phase cAMP oscillations (representative cell trace, Ca2+ – black, AKAP79/150-cAMP – red). (e) Over-expressing AC8 is sufficient to reverse the phase at the PM to in-phase (23 ± 2 s, n = 56) (representative cell trace, Ca2+ – black, PM cAMP – blue). **p=0.0014, ****p<0.0001; unpaired two-tailed Student’s t-test.
Figure 2—figure supplement 1
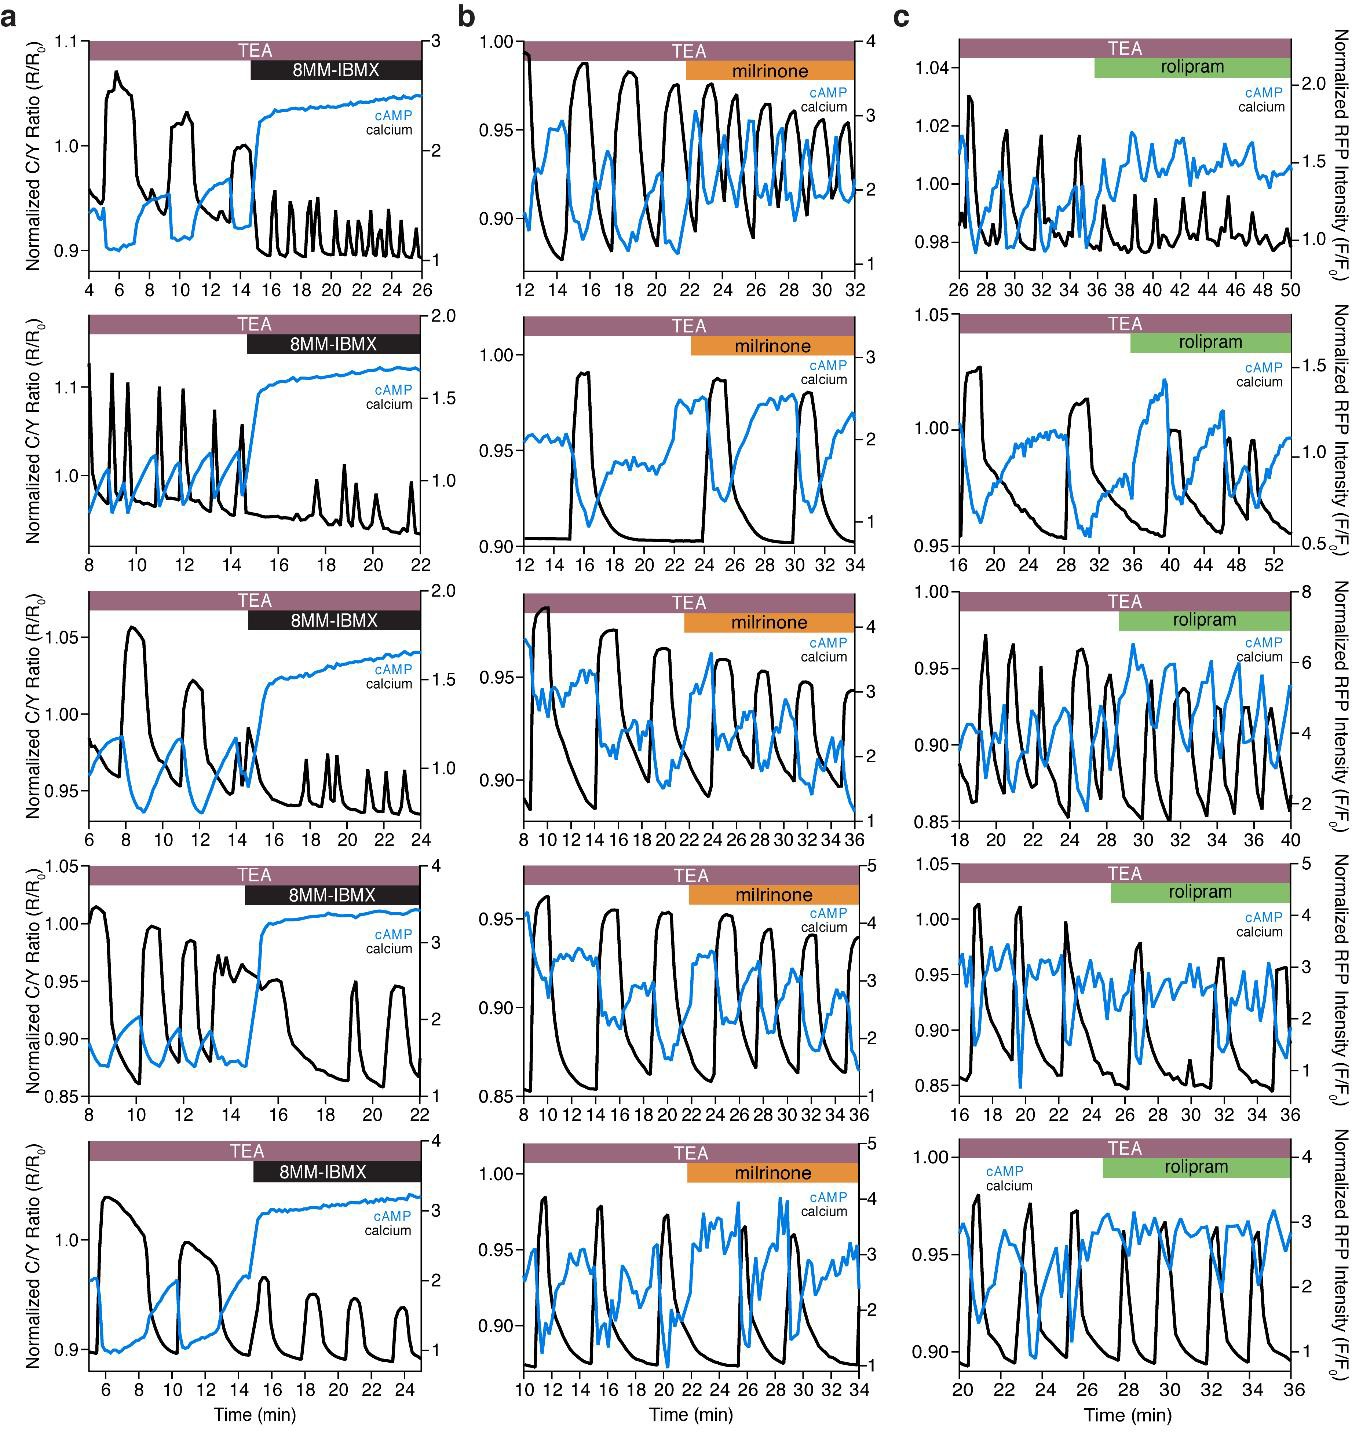
The Ca2+-dependent cAMP response is dependent on PDE1, but not PDE3 or PDE4.
(a) Representative single cell traces depicting the decoupling of oscillating cAMP at the PM (measured by lyn-(Ci/Ce)Epac2-camps, blue trace) from oscillating Ca2+ (black trace) upon inhibition of PDE1 with 8MM-IBMX. Representative single cell traces showing cAMP still oscillates at the PM (blue trace) together with Ca2+ (black trace) upon inhibition of PDE3 (milrinone) (b) and PDE4 (rolipram) (c), respectively.
Figure 2—figure supplement 2
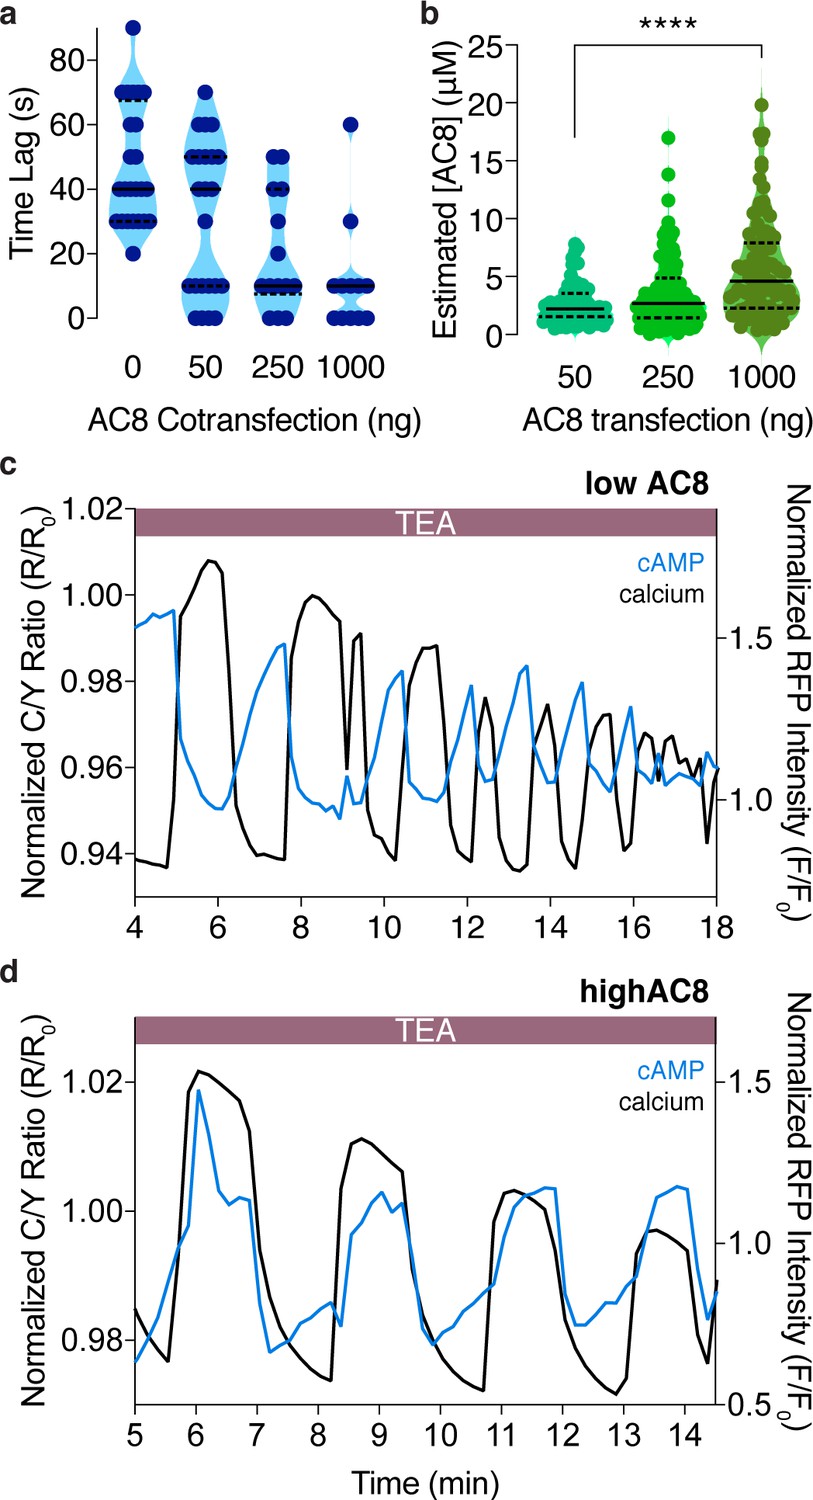
The cAMP-Ca2+ phase relationship at the PM can be tuned by expression of the Ca2+-dependent AC8.
(a) Plot depicting a dose-dependence between the time lag of cAMP at the PM and the amount of plasmid-encoded AC8 co-transfected (n = 56). (b) Violin plots depicting the relationship between estimated cellular AC8 expression levels and the amount of GFP-AC8 plasmid transfected into cells (50 ng: n = 68 cells, 250 ng: n = 116 cells, 1000 ng: n = 91 cells). p=0.00001, 50 ng vs 1000 ng; Kruskal-Wallis test followed by Dunn's multiple comparisons test. (c) Representative single cell trace of an oscillating β cell control with no AC8 co-expression, illustrating an out-of-phase cAMP-Ca2+ phase relationship. Blue trace is cAMP at PM and black trace is Ca2+. (d) Representative single cell trace of an oscillating β cell with 1 μg of an AC8 expression vector co-transfected, illustrating an in-phase cAMP-Ca2+ phase relationship. Blue trace is cAMP at PM and black trace is Ca2+.
Figure 2—figure supplement 3
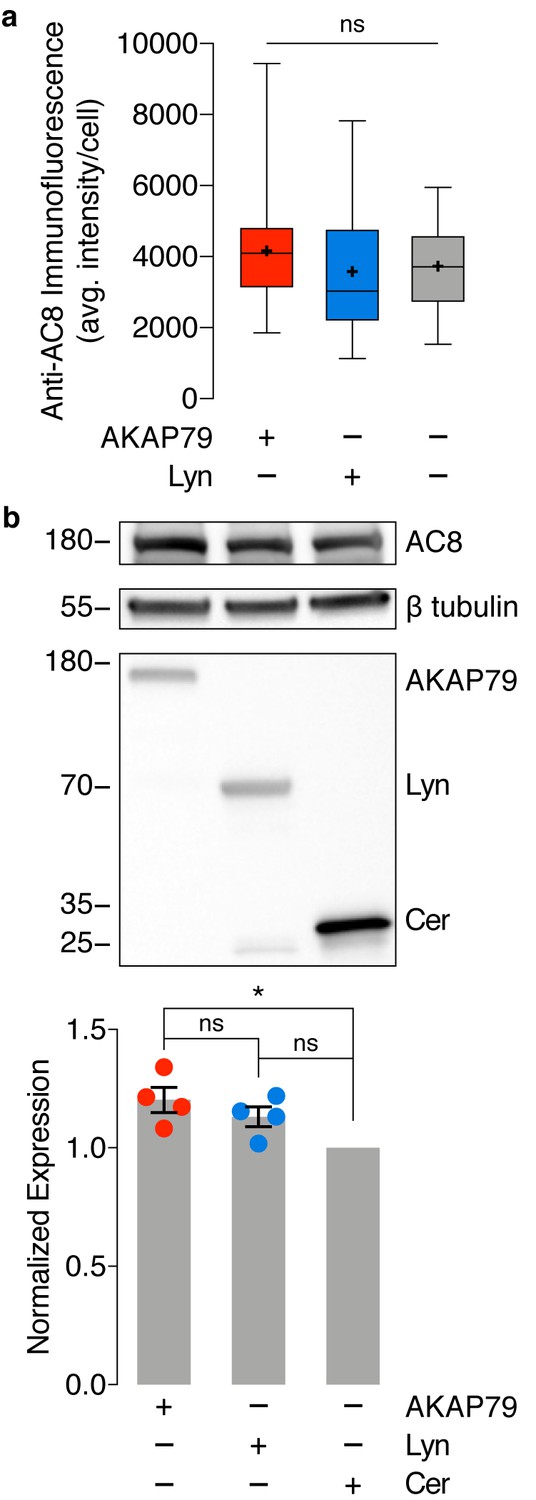
No difference in endogenous AC8 levels is observed between cells expressing AKAP79-(Ci/Ce)Epac2-camps and lyn-(Ci/Ce)Epac2-camps.
(a) Average intensity per AC8-stained MIN6 cell, expressing AKAP79-(Ci/Ce)Epac2-camps (AKAP79), lyn-(Ci/Ce)Epac2-camps (Lyn), or no sensor (control). AC8 intensity does not significantly differ between the three populations. ns, p=0.2525; ordinary one-way ANOVA. (b) Representative Western blot quantifying endogenous expression of AC8 and expression of transfected biosensor (AKAP79-(Ci/Ce)Epac2-camps (AKAP79), Lyn-(Ci/Ce)Epac2-camps (Lyn), or Cerulean (Cer) only) in MIN6 cells. A small increase in AC8 expression was observed between sensor-expressing populations compared to Cerulean alone (AKAP79 vs. Cer, *p=0.0134; Lyn vs. Cer, p=0.0979; ordinary one-way ANOVA followed by Tukey’s multiple comparisons test). However, no significant difference in AC8 expression was measured between the AKAP79- and Lyn-tagged sensor-expressing populations (AC8 band intensity normalized to β tubulin, n = 4 replicates, p=0.4373).
Figure 3 with 3 supplements
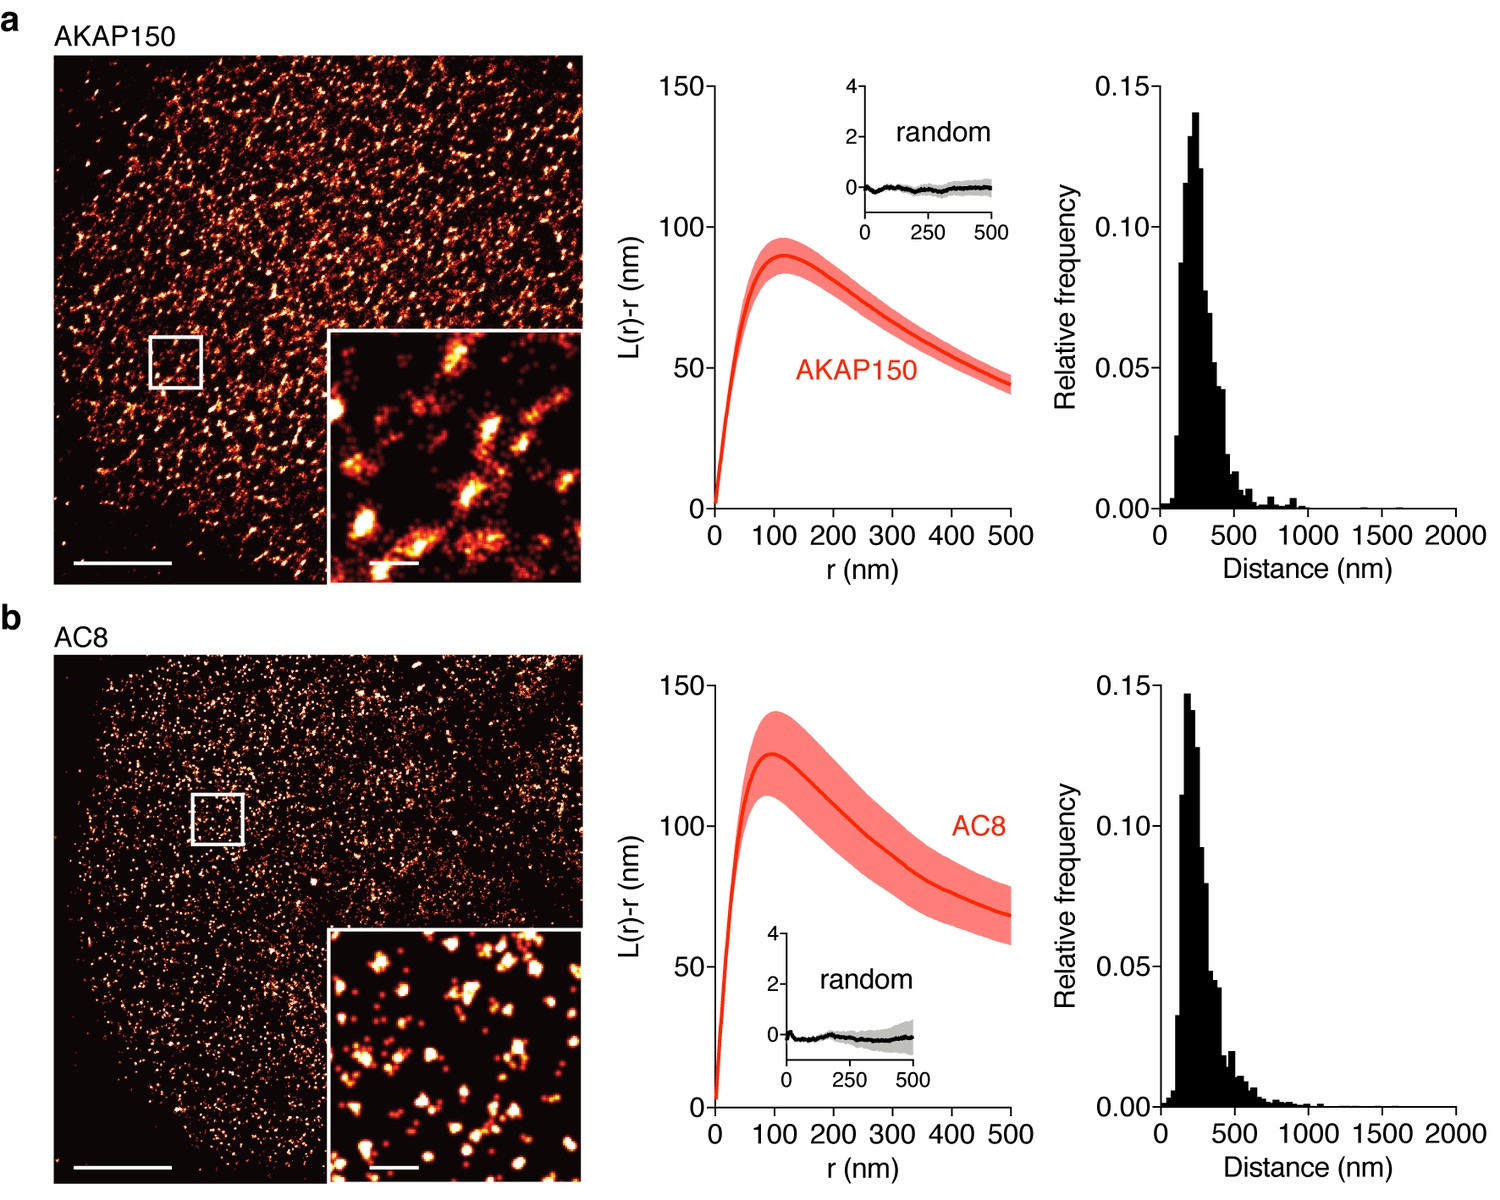
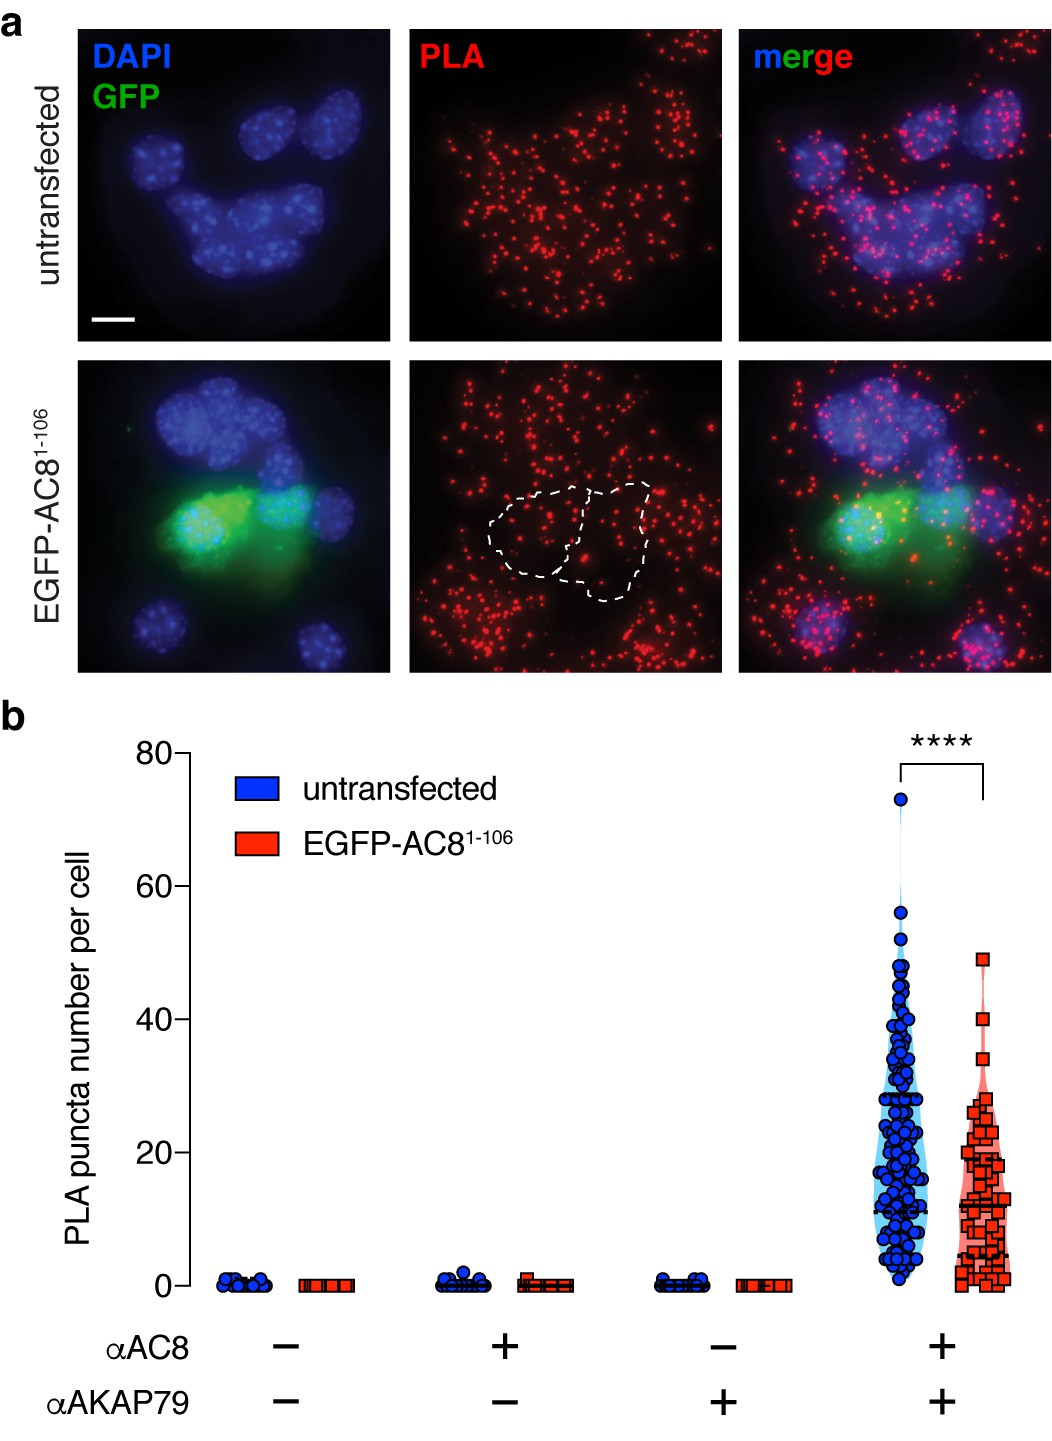
AKAP150 and AC8 both form nanoclusters at the surface of MIN6 β cells.
(a) Representative super-resolution STORM image of the AKAP150 scaffold (scale 5 μm, inset 500 nm). Ripley-K analysis measures the average radii of the nanoclusters and indicates that AKAP150 forms clusters of 127 ± 9 nm, n = 20 (uniform random distribution control in inset). The nearest-neighbor distance distribution describes the distance between nanoclusters (average distance for AKAP150 is 313 ± 20 nm). (b) Representative super-resolution STORM image of Ca2+-sensitive AC8 (scale 5 μm, inset 500 nm) depicts AC8 nanoclusters of average radius 88 ± 8 nm and average nearest-neighbor distance 292 ± 16 nm, n = 16.
Figure 3—figure supplement 1
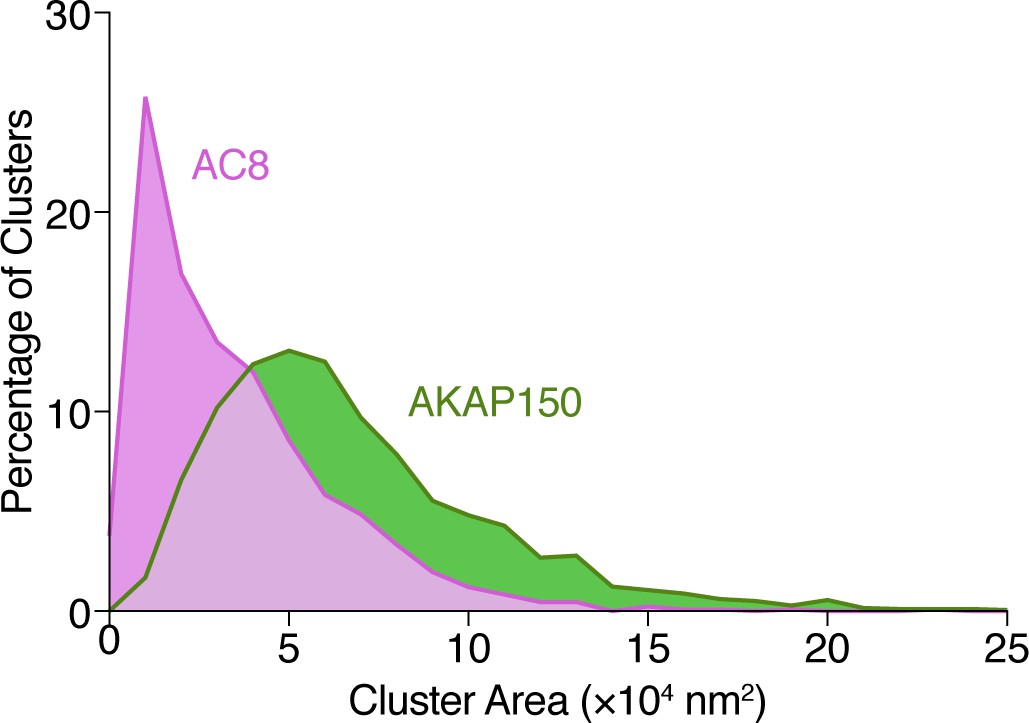
Analysis of AKAP150 and AC8 cluster area.
Histogram showing the size distribution (area, nm2) for AKAP150 (green) and AC8 (magenta) clusters derived from STORM imaging.
Figure 3—figure supplement 2
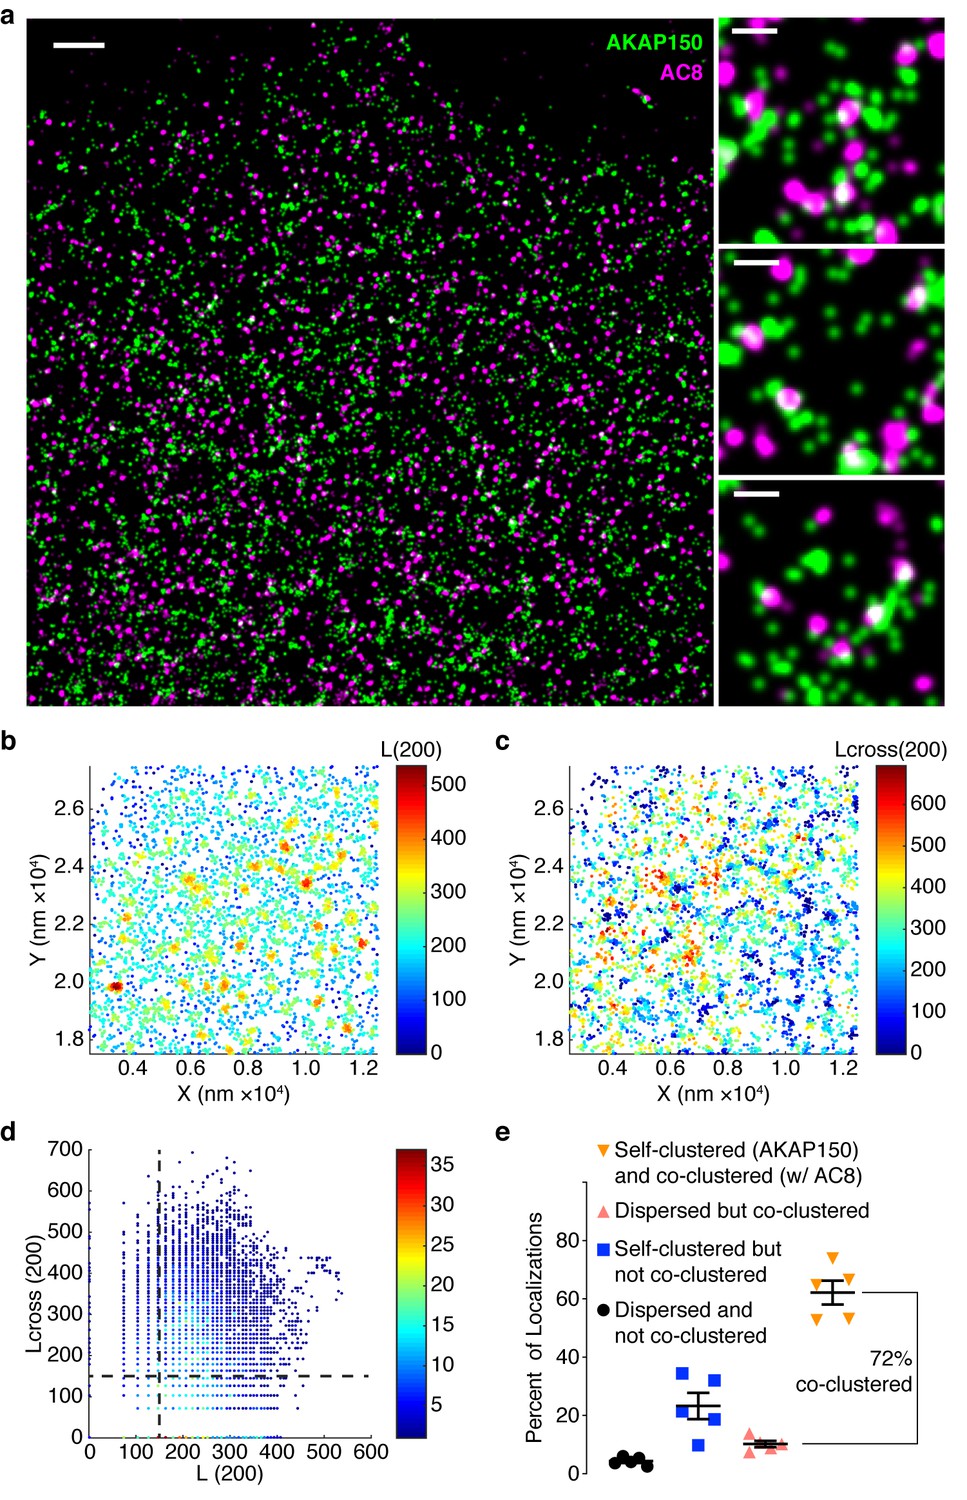
AKAP150 is co-clustered with AC8 at the plasma membrane in MIN6 cells.
(a) A representative two-color STORM image of AKAP150 (green) and AC8 (magenta) in a MIN6 cell with specific examples of AKAP150/AC8 co-clusters to the right (scale 1 μm, inset 200 nm). Representative 1 x 1 μm scatter plot showing molecular localizations for AKAP150, color-coded with the values of L(200) (b) or Lcross(200) (c), which reflect the number of localizations of its own species or of the AC8 species, respectively, within a 200 nm radius of each AKAP150 localization. (d) Scatter plot of Lcross(200) and L(200) is shown for the representative ROI. AKAP150 localizations with a Lcross(200) score above 150 were considered co-clustered with AC8. (e) Summary of Getis-Franklin co-clustering analyses of the two-color STORM images identifying populations with different AKAP150/AC8 cluster relationships. A majority of AKAP150 localizations (72%) are co-clustered with AC8 localizations (n = 5 cells).
Figure 3—figure supplement 3
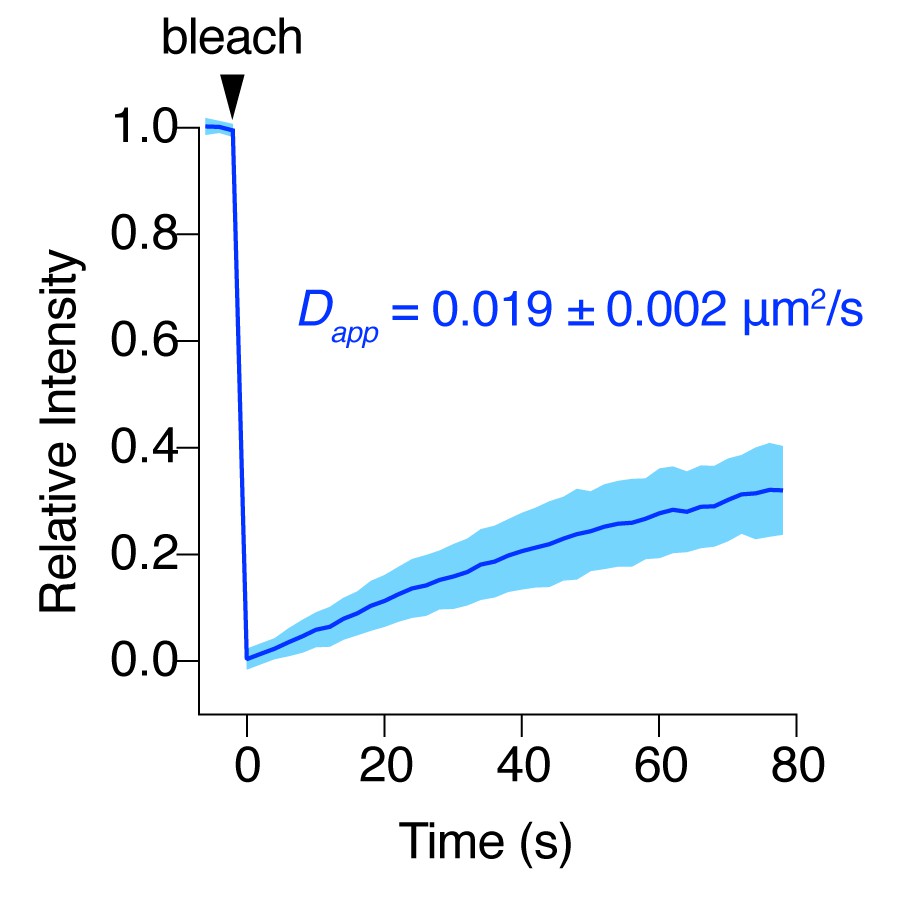
AC8 diffuses slowly at the plasma membrane.
FRAP curve for EGFP-tagged AC8 in MIN6 cells. AC8 diffuses slowly with an apparent diffusivity of 0.019 ± 0.002 μm2/s and an average immobile fraction of approx. 42.3% (n = 16, extrapolated).
Figure 4 with 1 supplement
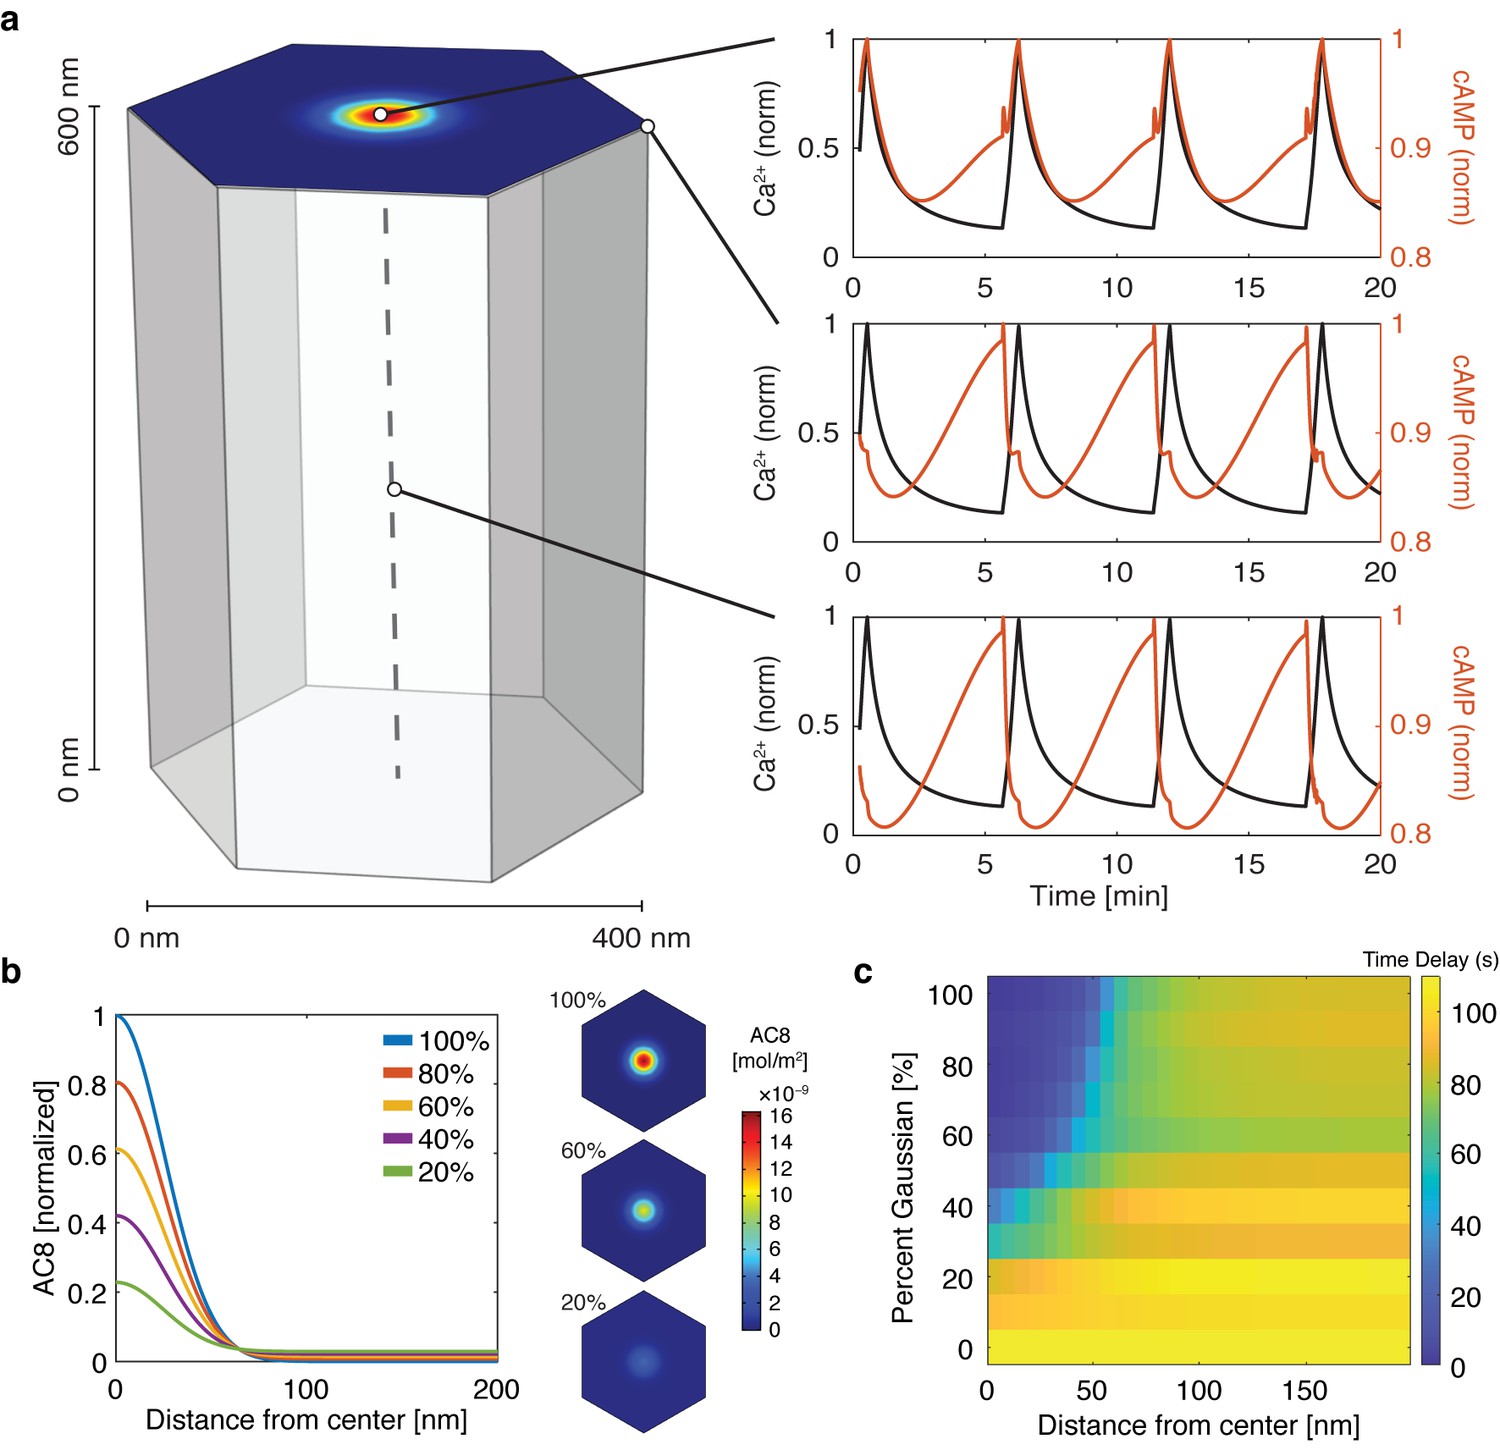
cAMP-Ca2+ phase relationship can be described by a 3D reaction-diffusion model involving clusters of AKAP79/150 and AC8.
(a) 3D reaction-diffusion model with a single AKAP79/150:AC8 co-cluster positioned at the PM in the β cell in a hexagonal prism volume. cAMP oscillates in-phase immediately within the AKAP79/150:AC8 nanocluster due to the high effective concentration of AC8, but out-of-phase at the PM or cytosol due to the presence of PDE1 (cAMP – red, Ca2+– blue). (b) Disruption of the AKAP79/150:AC8 interaction can redistribute AC8 from within the cluster to the PM, shown by the half-Gaussian cross-sections and representative AC8 concentration heatmaps at the PM. (c) Heatmap depicting the time lag (s) for AC8 distribution (% Gaussian) and spatial distance (nm) from cluster center along PM.
Figure 4—figure supplement 1
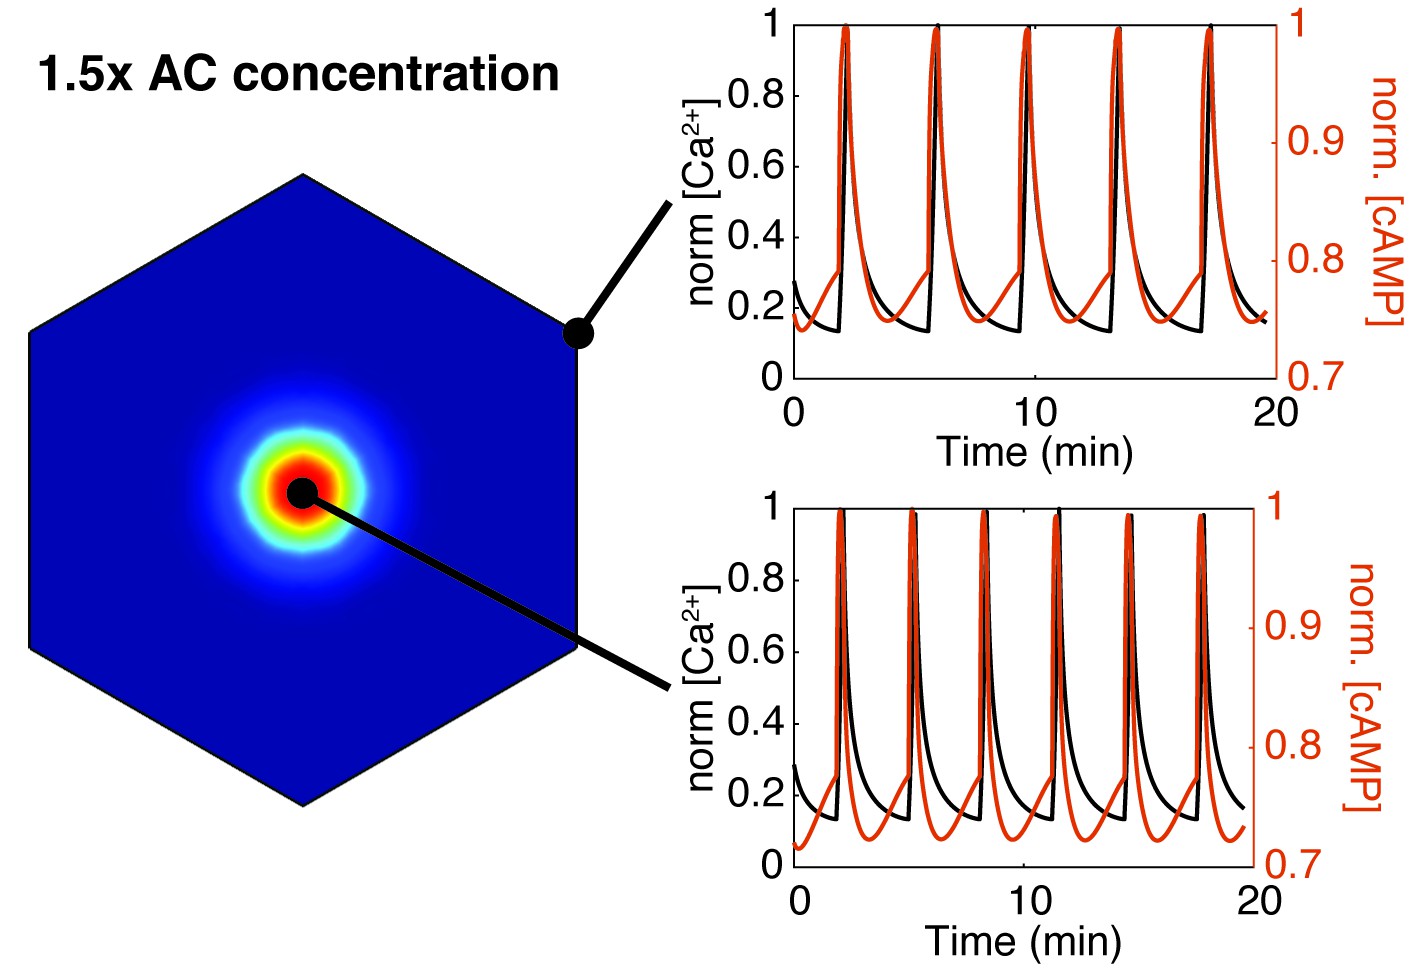
Increasing AC8 concentration within the cluster leads to loss of compartmentalized cAMP-calcium phase relationship.
Spatial simulations of cAMP (red) and calcium (black) when AC8 concentration is increased within the nanocluster. Entrainment of cAMP and calcium oscillations (in-phase) occurs globally at the plasma membrane (edge - top right, cluster center - bottom right).
Figure 5 with 1 supplement
Disruption of the AKAP79/150:AC8 interaction is associated with a redistribution of AC8 at the PM and a phase shift of cAMP at the AKAP79/150 nanodomain.
(a) Over-expression of the N-terminus of AC8, which is necessary and sufficient for mediating the AKAP79/150:AC8 interaction, redistributes AC8 from within nanoclusters to the general PM, as seen in the STORM image (scale 5 μm, inset 500 nm) and measured by the percent of localizations that fall into nanoclusters. (b) Disruption of the AKAP79/150:AC8 interaction lengthens the time lag between the cAMP (red) and Ca2+ (black) signals at the AKAP79/150 compartment (avg. time lag in absence of disruptor is 13 ± 3 s, n = 60, and in presence of disruptor 43 ± 6 s, n = 33) due to more cells displaying out-of-phase cAMP oscillations. *p=0.0341, ****p<0.0001; unpaired two-tailed Students t-test.
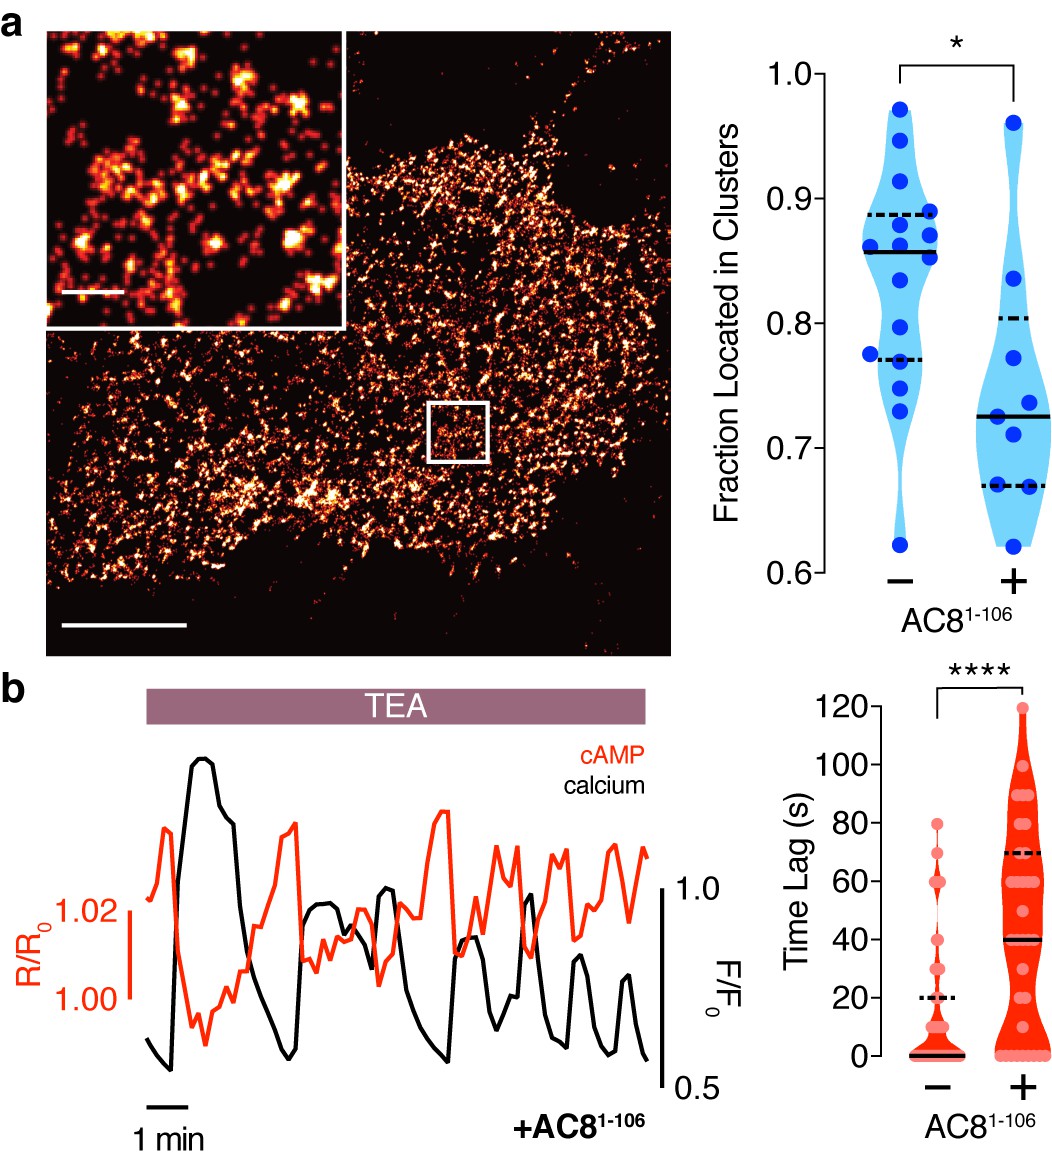
Figure 5—figure supplement 1
Expression of the N-terminus of AC8 perturbed the interaction between endogenous AKAP150 and AC8 in MIN6.
(a) Widefield maximum intensity projections of a proximity ligation assay to depict the extent of interactions between AC8 and AKAP150 in MIN6 β cells (scale 10 μm). Expression of EGFP-tagged AC81-106 results in less PLA puncta per cell. (b) Number of PLA puncta per AC81-106-expressing cell is significantly decreased compared to non-transfected control (n = 142 and 57 cells, respectively) (****p<0.0001; unpaired two-tailed Student’s t-test).
Figure 6 with 2 supplements
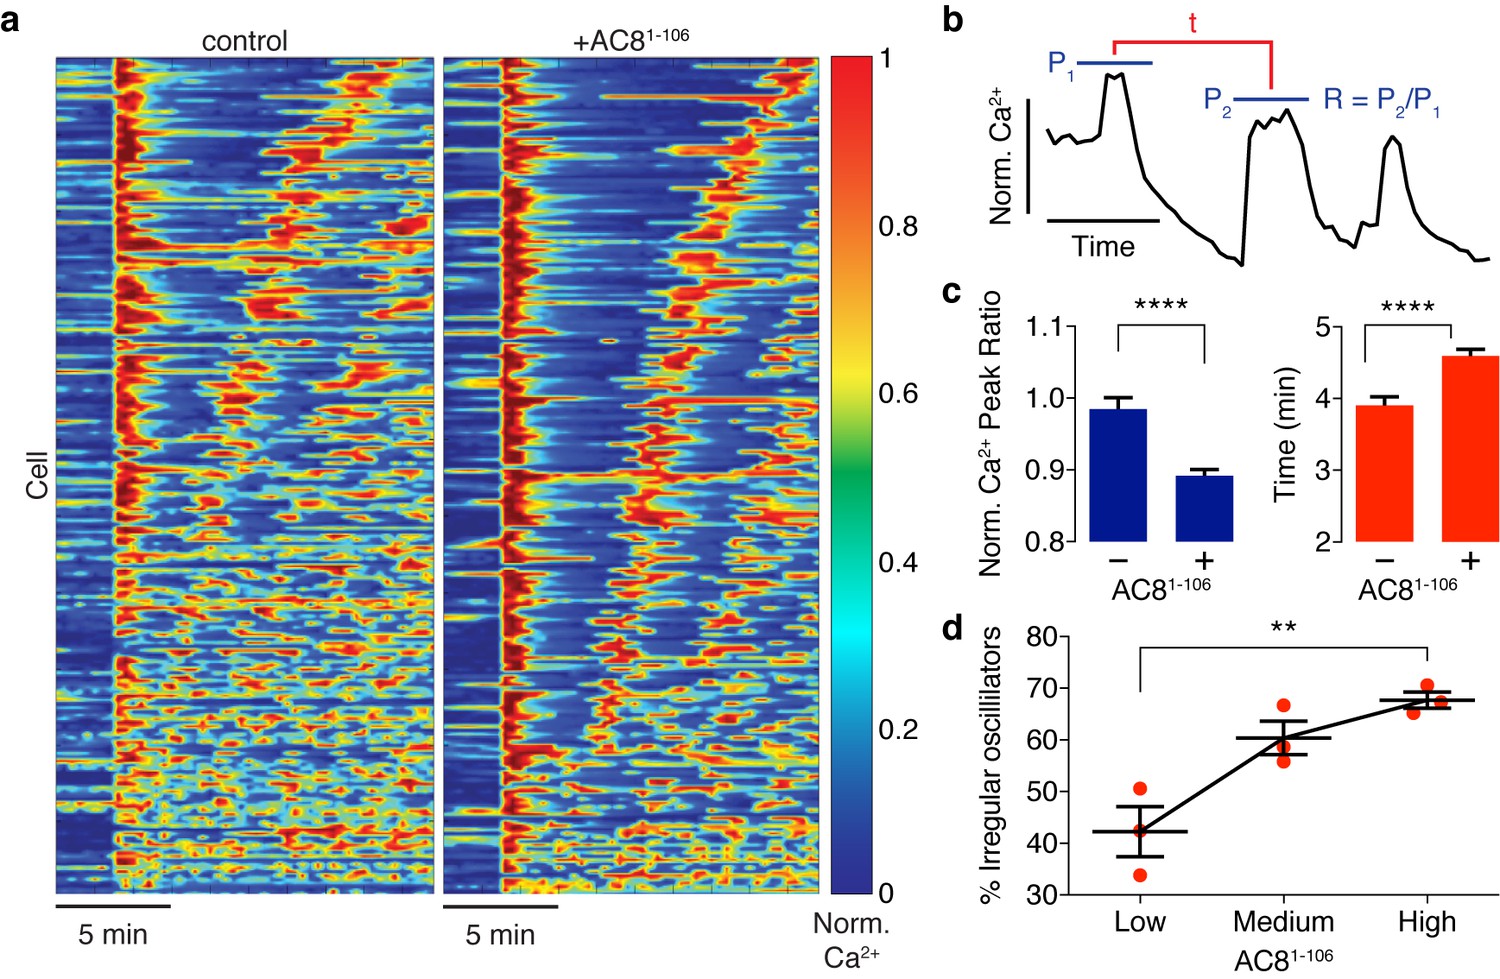
Ca2+ oscillatory dynamics are affected by expression of the disruptor peptide in β cells.
(a) Heatmaps depicting Ca2+ oscillations for 220 randomly selected cells co-expressing EGFP alone (control, left) or EGFP-tagged AC81-106 (AKAP79/150:AC8 disruptor, right), ordered by a mixed parameter describing the time lag between the first two Ca2+ peaks and the avg. timelag between all Ca2+ peaks. (b) Schematic describing two Ca2+ oscillatory parameters: the ratio between the first two Ca2+ peaks (R = P2 / P1) and the interpeak timing (t). (c) The peak ratio R is decreased in the presence of the AKAP79/150:AC8 disruptor (left), indicating less of a sustained Ca2+ oscillatory response. Over-expression of the disruptor also lengthens the timing between peaks (right). (d) The level of disruptor peptide expression is correlated with an increase in the percentage of cells exhibiting irregular oscillations (total n = 562). p=0.0054, ordinary one-way ANOVA.
Figure 6—figure supplement 1
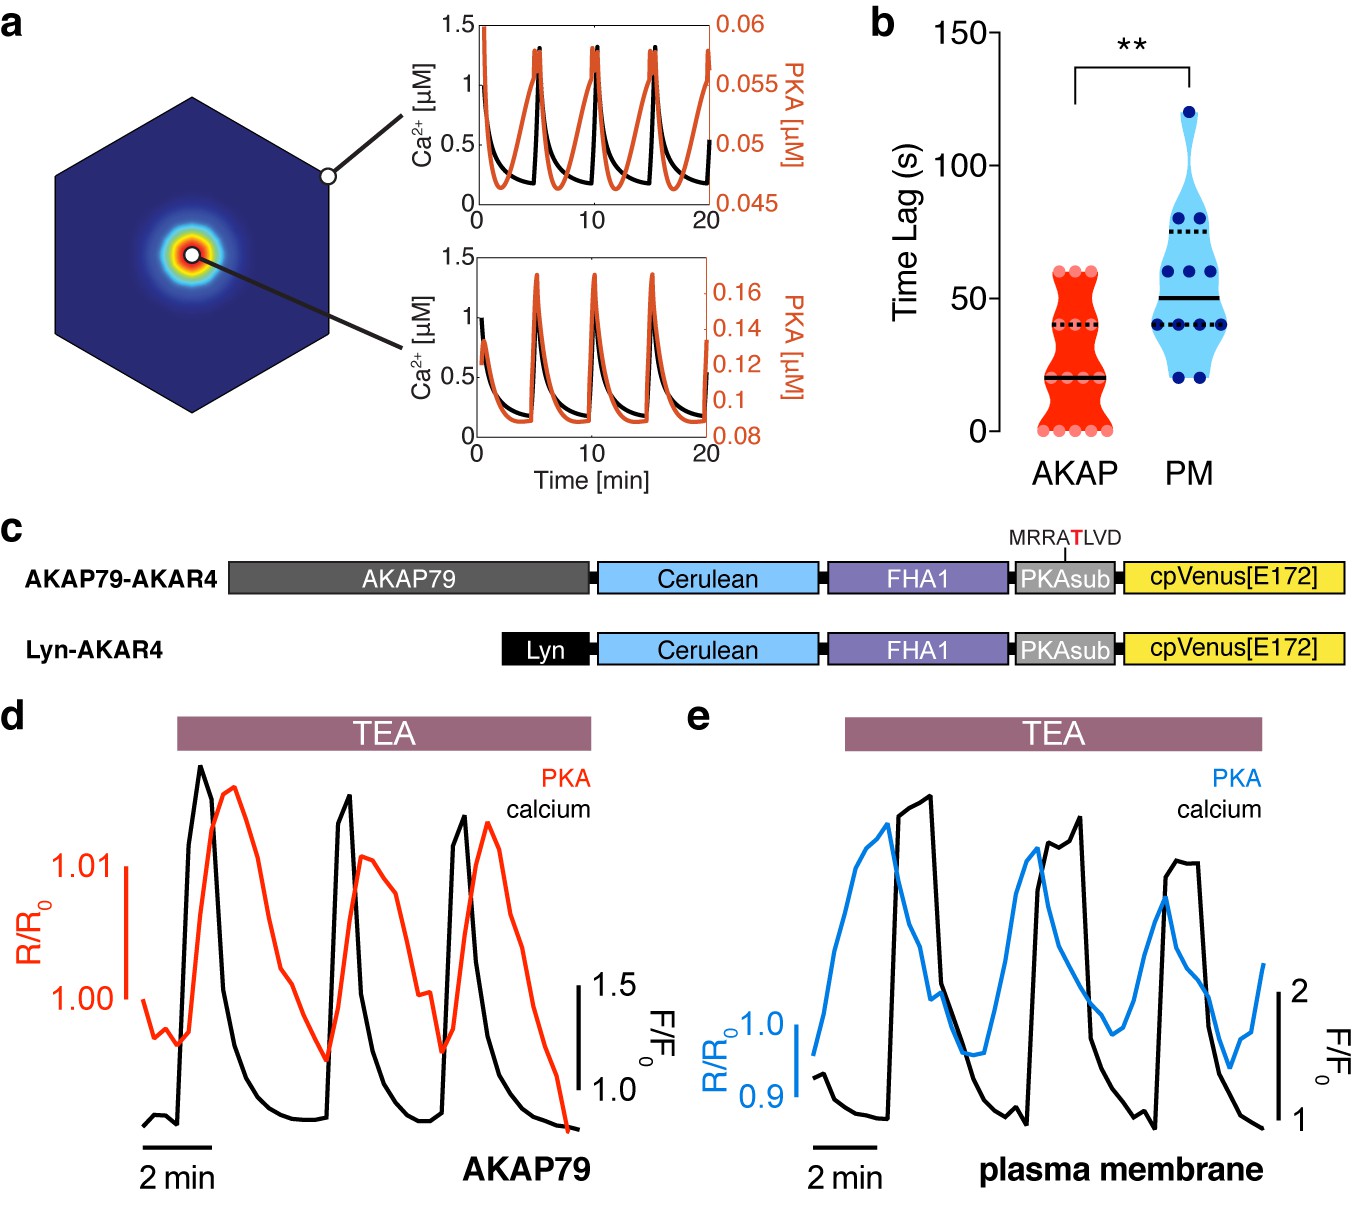
The phase of oscillating PKA activity, relative to Ca2+, is also spatially compartmentalized.
(a) PKA activity is predicted to oscillate near the center of the AKAP79/150:AC8 cluster with a short time delay and a longer delay outside of the cluster, relative to Ca2+. (b) Experimentally-measured time lag between PKA activity oscillations and Ca2+ for AKAP79 (orange) and the general PM (teal) compartments (n = 15 and 12, respectively). **p=0.0063, unpaired two-tailed Student’s t-test. (c) Representative single cell trace showing in-phase PKA activity within the AKAP79 compartment. Orange trace is PKA activity at AKAP79 (CY-FRET channel divided by cyan donor channel) and black trace is Ca2+ (RFP). (d) Representative single cell trace showing out-of-phase PKA activity within the general PM compartment. Teal trace is PKA activity at PM (CY-FRET channel divided by cyan donor channel) and black trace is Ca2+ (RFP).
Figure 6—figure supplement 2

Stochastic model results for the simplified model show the cAMP-Ca2+ phase relationship is preserved and noise is reduced in higher flux conditions.
Stochastic simulations were performed for high and low AC8 counts of 200 (a) and 10 (b). (c) Reducing the AC8 count shifts the solution from in-phase to out-of-phase with respect to Ca2+, as predicted in the previous four component model. (d) Increasing the AC8 count suppresses cAMP noise within the system, relative to the mean.
Appendix 1—figure 1
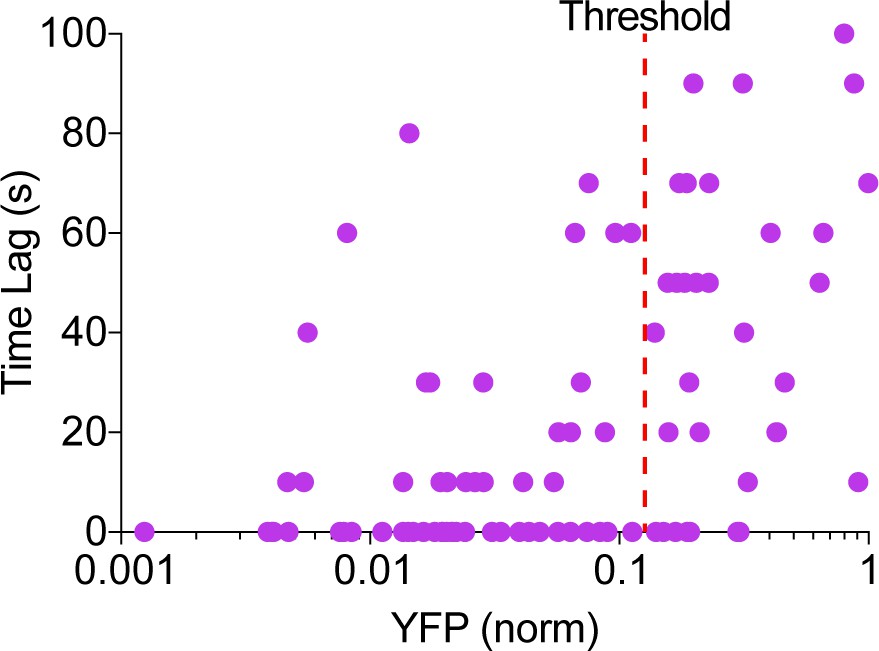
Phase of cAMP correlates with the expression level of the AKAP79-(Ci/Ce)Epac2-camps.
Scatter plot of the time lag (sec) and the YFP donor channel intensity (normalized to non-saturating maximum) for each cell expressing AKAP79-(Ci/Ce)Epac2-camps. Cells with higher expression of the probe correlated with a longer time lag, therefore a YFP intensity threshold was designated for analysis purposes.
Appendix 1—figure 2
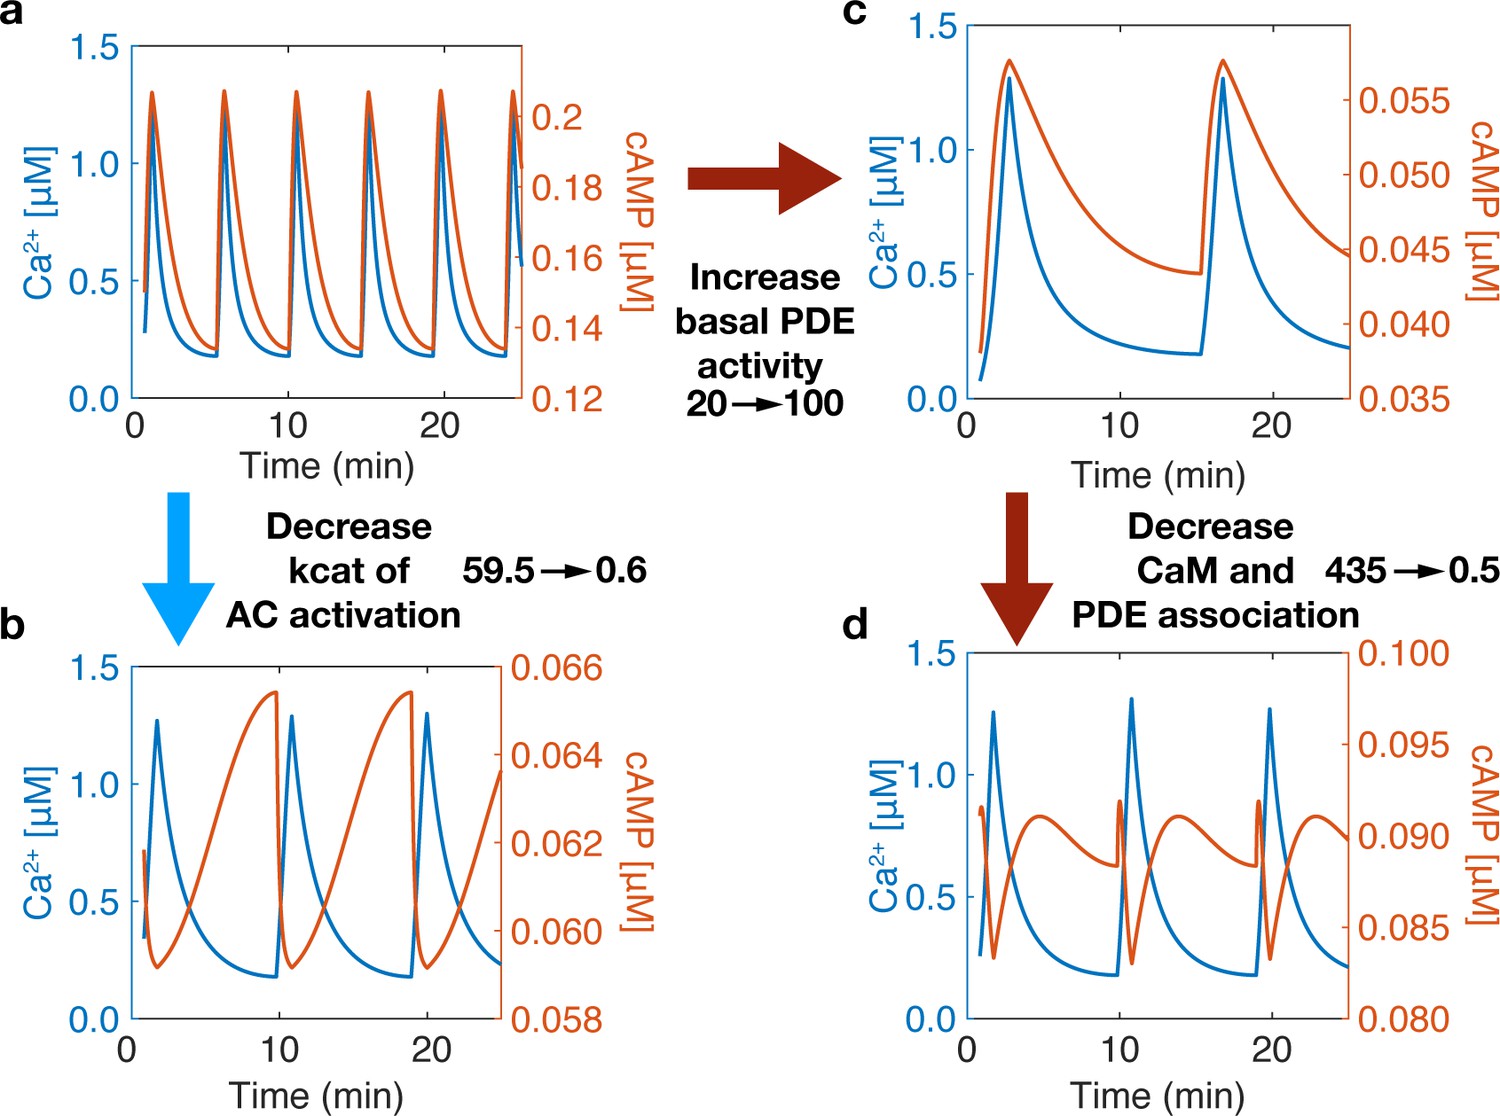
Phase is driven by activity variability within the Ca2+ oscillatory regime.
The phase of the system can be switched by tuning the association of CaM to sources (ACs) and sinks (PDEs). (a) At base system conditions, the system acts in an in-phase manner. (b) Decreasing the rate of Ca2+ association to the AC-CaM complex causes the phase to switch to out-of-phase. (c) Increasing basal PDE activity does not allow a phase switch only after decreasing PDE and CaM association rates will the system allow a phase switch (d). A phase switch is controlled by the variability in the activity of source or sink. If the sink dominates, then the system is out-of-phase. If the source dominates, the system is in-phase.
Author response image 1

of CaM+2Ca, CaMAC+2Ca, and CaMPDE+2Ca, were represented as multi step reactions with rates in the table given below.
The system still exhibits in-phase and out-of-phase qualitative responses, with an additional 3 parameters. Since additional parameters did not affect outcome, we retained the Michaelis-Menten formulation.
Tables
Key resources table
| Reagent type (species) or resource | Designation | Source or reference | Identifiers | Additional information |
|---|---|---|---|---|
| Cell line (Mus musculus) | MIN6 | Dr. Jun-Ichi Miyazaki, Osaka University | RRID:CVCL_0431 | |
| Chemical compound, drug | Tetraethylammonium chloride (TEA) | Sigma | T2265 | 20 mM |
| Chemical compound, drug | 8-Methoxymethyl-3-isobutyl- 1-methylzanthine (8MM-IBMX) | Sigma-Aldrich | M2547 | 100 μM |
| Chemical compound, drug | Milrinone | Alexis | Cat# ALX-270–083 M005 | 10 μM |
| Chemical compound, drug | Rolipram | Alexis | Cat# ALX-270–119 | 1 μM |
| Chemical compound, Drug | KCl | Sigma-Aldrich | P9541 | 15 mM |
| Commercial assay or kit | Lipofectamine-2000 | Invitrogen | 11668019 | |
| Recombinant DNA reagent | pCDNA3 AKAR4 | PMID:20838685 | ||
| Recombinant DNA reagent | (Ci/Ce)Epac2-camps | Dr. Dermot Cooper, University of Cambridge | ||
| Recombinant DNA reagent | AKAP79 (AKAP5, Homo sapiens) | Dr. John D. Scott, University of Washington | ||
| Recombinant DNA reagent | AC8 (Adcy8, Rattus norvegicus) | Dr. Dermot Cooper, University of Cambridge | ||
| Recombinant DNA reagent | ShAdcy8 Plasmid | Dr. Jochen Lang, University of Bordeaux | ShAdcy8 #2 | |
| Recombinant DNA reagent | RCaMP | Dr. Loren Looger, Janelia Farms | ||
| Recombinant DNA reagent | R-FlincA | Dr. Kazuki Horikawa, Tokushima University Graduate School | ||
| Commercial assay or kit | Duolink in situ red starter kit | Sigma | DUO92101 | |
| Commercial assay or kit | Duolink in situ Probemaker MINUS | Sigma | DUO92010 | |
| Commercial assay or kit | Duolink in situ Probemaker PLUS | Sigma | DUO92009 | |
| Antibody | Anti-AC8, rat polyclonal | Abcam | ab196686 | 1:2000 |
| Antibody | Anti-AKAP150, rat polyclonal | Millipore Sigma | 07–210 | 1:500 |
| Antibody | Anti-AKAP79, mouse monoclonal | BD | 610314 | 1:500 |
| Antibody | Goat anti-rabbit AlexaFluor647 | ThermoFisher Scientific | A21245 | 1:1000 |
| Antibody | Goat anti-mouse AlexaFluor568 | ThermoFisher Scientific | A11031 | 1:1000 |
| Software, algorithm | FIJI | https://imagej.net/Fiji | RRID:SCR_014294 | |
| Software, algorithm | MetaFluor | https://www.moleculardevices.com/ | RRID:SCR_002285 | |
| Software, algorithm | MATLAB | https://www.mathworks.com/ | RRID:SCR_001622 | |
| Software, algorithm | GraphPad Prism | https://www.graphpad.com/ scientific-software/prism/ | RRID:SCR_002798 | |
| Software, algorithm | COPASI | http://copasi.org/ Hoops et al., 2006 | RRID:SCR_014260 | |
| Software, algorithm | Virtual Cell | https://vcell.org/ Cowan et al., 2012 | RRID:SCR_007421 |
Appendix 1—table 1
Voltage gated channel reactions.
| # | Species | Expression | Parameters | Ref. |
|---|---|---|---|---|
| 1 | Membrane Voltage | = 5.3 pF | Ni et al., 2011 | |
| 2 | Ca2+ current | = 600 pS, = 100 mV | Ni et al., 2011 | |
| 3 | Fraction of open VGCC (at steady state) | = -20 mV, = 24 mV | Ni et al., 2011 | |
| 4 | K+ current | = 240 pS, = -75 mV | Ni et al., 2011 | |
| 5 | Fraction of open K+ channels (at steady state) | ϕ = 35 | Ni et al., 2011 | |
| 6 | Time constant for K+ channel open probability | = -16 mV = 11.2 mV | Ni et al., 2011 | |
| 7 | leak current | = 150 pS, = -75 mV | Zhang et al., 2005 | |
| 8 | Ca2+ gated K+ current | = 2000 pS, = -75 mV, = 5 | Ni et al., 2011 |
Appendix 1—table 2
Ca2+flux and reactions.
| # | Reaction | Reaction flux | Kinetic parameters | Ref. |
|---|---|---|---|---|
| 9 | → Ca | = 3000 s−1 · µM−1 | Ni et al., 2011 | |
| 10 | = 1 x 10−5 = 0.0045 · fA−1 · s−1 = 75 s−1 | Ni et al., 2011 | ||
| 11 | Ks = 10 µM, Castores = 1.56 µM, Vs = 0.1 µM · s−1, kIP3R = 0.05, A = 0.2869µM−1, B = 2.869µM−2, C = 0.2133 | Ni et al., 2011 | ||
| 12 | 2Ca + CaM ↔ Ca2CaM | = 3.6 ⋅ µM−1, = 8 | Lai et al., 2015 | |
| 13 | Ca + Ca2CaM ↔ Ca3CaM | =11 ⋅ µM−1, = 195 | Lai et al., 2015 | |
| 14 | Ca + Ca3CaM ↔ Ca4CaM | = 59 ⋅µM−1, = 500 | Lai et al., 2015 | |
| 15 | AC + Ca2CaMCaM ↔ CaM · AC | = 1.7 ⋅ µM−1, = 10 | Masada et al., 2009; Masada et al., 2012 | |
| 16 | CaM · AC + 2Ca ↔ AC* | = 59.5 , = 0.1 , = 10 | Masada et al., 2009; Masada et al., 2012 | |
| 17 | PDE + Ca2CaM ↔ CaM · PDE | = 435 ⋅ µM−1, = 1 | Ang and Antoni, 2002 | |
| 18 | CaM · PDE + 2Ca ↔ PDE* | = 1.81 , = 0.18 , = 1 | Ang and Antoni, 2002 | |
| 19 | PDE + Ca4CaM ↔ PDE* | = 435 ⋅ µM−1, = 1 | Ang and Antoni, 2002 |
-
*denotes the activated form
Appendix 1—table 3
cAMP reactions.
| # | Reaction | Reaction flux | Kinetic parameters | Ref. |
|---|---|---|---|---|
| 20 | → cAMP | = 0.1 , = 0.785 | Leonid E. Fridlyand & Philipson, 2016; Ni et al., 2011 | |
| 21 | cAMP→ | = 0.2 , = 0.6 = 2.5 | Ni et al., 2011; Fridlyand and Philipson, 2016 | |
| 22 | cAMP→ | = 2.5 ⋅ s−1, = 1.4 | Ni et al., 2011; Fridlyand and Philipson, 2016 | |
| 23 | cAMP + R2 → R2b | = 1 ⋅ µM−1, = 0.00033 | Boras et al., 2014 | |
| 24 | cAMP + R2b → R2ba | = 1 ⋅ µM−1, = 0.00105 | Boras et al., 2014 | |
| 25 | cAMP + R2b → R2bb | = 1 ⋅ µM−1, = 0.00132 | Boras et al., 2014 | |
| 26 | cAMP + R2ba → R2bba | = 1 ⋅ µM−1, = 0.0013 | Boras et al., 2014 | |
| 27 | cAMP + R2bb → R2bba | = 1 ⋅ µM−1, = 0.00103 | Boras et al., 2014 | |
| 28 | cAMP + R2bba → R2bbaa | = 1 ⋅ µM−1, = 0.0114 | Boras et al., 2014 | |
| 29 | PKA + R2 → R2C | = 1 ⋅ µM−1, = 1.26E-7 | Boras et al., 2014 | |
| 30 | PKA + R2b → R2bcC | = 1 ⋅ µM−1, = 2.52E-7 | Boras et al., 2014 |
Appendix 1—table 4
cAMP reactions (cont.).
| # | Reaction | Reaction flux | Kinetic parameters | Ref. |
|---|---|---|---|---|
| 31 | PKA + R2ba → R2ba C | = 1 s−1 · µM−1 = 3.4E-6 | Boras et al., 2014 | |
| 32 | PKA + R2bba → R2bba C | = 1 s−1 · µM−1, = 0.000936 | Boras et al., 2014 | |
| 33 | PKA + R2bbaa → R2bbaa C | = 1 s−1 · µM−1, = 0.645 | Boras et al., 2014 | |
| 34 | cAMP + R2C → R2b C | = 1 s−1 · µM−1 , = 0.000659 s-1 | Boras et al., 2014 | |
| 35 | cAMP + R2b C → R2ba C | = 1 s−1 · µM−1 , = 0.0142 s-1 | Boras et al., 2014 | |
| 36 | cAMP + R2ba C → R2bbc C | = 1 s−1 · µM−1, = 0.0142 s-1 | Boras et al., 2014 | |
| 37 | cAMP + R2bba C → R2bbaa C | = 1 s−1 · µM−1, = 7.84 s-1 | Boras et al., 2014 | |
| 38 | PKA + R2b C → R2b C2 | = 1 s−1 · µM−1, = 0.00324 s-1 | Boras et al., 2014 | |
| 39 | PKA + R2C → R2C2 | = 1 · µM−1, = 2.81E-6 s-1 | Boras et al., 2014 | |
| 40 | PKA + R2ba C → R2ba C2 | = 1 s−1 · µM−1, = 0.666 s-1 | Boras et al., 2014 | |
| 41 | cAMP + R2C2→ R2b C2 | = 1 s−1 · µM−1, = 0.762 s-1 | Boras et al., 2014 | |
| 42 | cAMP + R2b C2→ R2ba C2 | = 1 s−1 · µM−1, = 2.91 s-1 | Boras et al., 2014 |
Appendix 1—table 5
Initial conditions.
| # | Species | Initial value | Ref. |
|---|---|---|---|
| IC1 | AC8 | 1 µM | |
| IC2 | ACind | 1 µM | |
| IC3 | Ca2+ | 1 µM | |
| IC4 | CaM | 10 µM | |
| IC5 | cAMP | 0.1 µM | |
| IC6 | PDE1 | 1 µM | |
| IC7 | PDE4 | 0.4 µM | |
| IC8 | R2C2 | 0.4 µM | |
| IC9 | V | −60 mV |
Appendix 1—table 6
Initial conditions for the stochastic model.
| Species | Number of molecules in the system |
|---|---|
| Ca2+ | 10 |
| PDE | 45 |
| PDE* | 5 |
| AC | 10–200 (log scale) |
| s0 | 10000 |
| s4 | 1000 |
Appendix 1—table 7
Compartment volumes for the stochastic model.
| Compartment | Compartment size |
|---|---|
| Cytosol | 0.083 μm3 |
| Membrane | 0.28 μm2 |
| Oscillator | 6563.0 μm2 |
Appendix 1—table 8
Lotka-Volterra model to initiate the membrane depolarization events.
| # | Reaction | Parameters |
|---|---|---|
| 1 | s0 → 2s0 | Kf = 1.7 s−1 |
| 2 | s0 + s4 → 2s4 | Kf = 1 μm2 ⋅ molecule-1 ⋅ s-1 |
| 3 | s4 → | Kf = 1.7 s-1 |
Appendix 1—table 9
simplified model reactions for the stochastic model.
| # | Reaction | Parameters |
|---|---|---|
| 4 | s4 → > s4 + Ca2+ | Kf = 150 s−1 |
| 5 | Ca2+→ | Kf = 500 μm−2 ⋅ molecule ⋅ s−1 ⋅ μM−1 |
| 6 | AC + Ca2+ → AC* | Kf = 200 s−1 ⋅ μM−1 Kr = 300 s−1 |
| 7 | AC* → > cAMP + AC* | Kf = 300 s−1 |
| 8 | AC → cAMP + AC | Kf = 5 s−1 |
| 9 | PDE + Ca2+ → PDE* | Kf = 150 s−1 ⋅ μM−1 Kf = 100 s−1 |
| 10 | PDE + cAMP → PDE | Kf = 50 s−1 ⋅ μM−1 |
| 11 | PDE* + cAMP → PDE* | Kf = 1000 s−1 ⋅ μM−1 |
| 12 | → cAMP | J = 9000 μm−2 ⋅ molecule ⋅ s−1 |
| 13 | cAMP → | Kf = 50 s−1 |
Appendix 1—table 10
Ca2+ Flux and reactions modified from Appendix 1—table 2.
| # | Reaction | Reaction flux | Kinetic parameters | Ref. |
|---|---|---|---|---|
| S1 | → Ca2+ | = 100 | FRET constraint | |
| S2 | = 1 x 10⁻⁶, = 4.15 x 10⁵mol · m−2 · A−2 · s−1,, = 7.5 x 10⁻⁴m · s−1 | Ni et al., 2011 | ||
| S3 | = 10 , = 1.56 , = 0.1 µM · s−1, = 0.05 , A = 0.2869 , B = 2.869 , C = 0.2133 | Ni et al., 2011 | ||
| S4 | AC + Ca2CaM ↔ CaM · AC | = 10.8 · µM−1, = 10 | FRET constraint | |
| S5 | CaM · AC + 2Ca2+ ↔ AC* | = 90 , = 1 , = 10 | FRET constraint | |
| S6 | PDE + Ca2CaM ↔ CaM · PDE | = 0.25 · µM−1, = 1 | FRET constraint | |
| S7 | CaM · PDE + 2Ca2+ ↔ PDE* | = 60 , = 1 , = 1 | FRET constraint | |
| S8 | PDE + Ca4CaM ↔ PDE* | = 0.25 · µM−1, = 1 | FRET constraint |
Appendix 1—table 11
cAMP reactions modified from Appendix 1—table 3.
| # | Reaction | Reaction flux | Kinetic parameters | Ref. |
|---|---|---|---|---|
| S9 | → cAMP | = 0.2 , = 23.55 , ACind = 3 x 10⁻⁸ | FRET constraint | |
| S10 | cAMP → | = 0.6 , = 0.6 µM = 720 | FRET constraint | |
| S11 | cAMP → | = 0.25 µM · s−1, = 1.4 µM | FRET constraint | |
| S12 | 2cAMP + R2C2 → R2C + PKA | = 20 min−1 · µM−2, = 12 min−1 · µM−1 | ||
| S13 | 2cAMP + R2C → R2 + PKA | = 20 min−1 · µM−2, = 12 min−1 · µM−1 |
Appendix 1—table 12
Additional AKAP interactions for the spatial model.
| # | Reaction | Reaction flux | Kinetic parameters | Ref |
|---|---|---|---|---|
| S14 | AKAP + R2 → AKAP-R2 | = 1 s−1 · µM−1 = 0.1 | Est. | |
| S15 | AKAP + R2C → AKAP-R2C | = 1 s−1 · µM−1 = 0.1 | Est. | |
| S16 | AKAP + R2C2 → AKAP-R2C2 | = 1 s−1 · µM−1 = 0.1 | Est. | |
| S17 | 2cAMP + AKAP-R2C2 → AKAP-R2C + PKA | = 20 min−1 · µM−2, = 12 min−1 · µM−2 | ||
| S18 | 2cAMP + AKAP-R2C → AKAP-R2 + PKA | = 20 min−1 · µM−2, = 12 min−1 · µM−2 |
Appendix 1—table 13
Initial conditions and diffusion coefficients used in the model.
| # | Species | Initial value | Diffusion | Ref. |
|---|---|---|---|---|
| SIC1 | Ca2+ | 0.001 µM | 100 | (Donahue and Abercrombie, 1987), Est. from steady state |
| SIC2 | CaM | 2.9 µM | 10 | Est. from steady state* |
| SIC3 | Ca2CaM | 0.1 µM | 10 | Est. from steady state* |
| SIC4 | Ca3CaM | 4 x 10⁻³ µM | 10 | Est. from steady state* |
| SIC5 | Ca4CaM | 1 x 10⁻² µM | 10 | Est. from steady state* |
| SIC6 | R2 | 0.04 µM | 10 | Est. from steady state* |
| SIC7 | R2C2 | 0.2 µM | 10 | Est. from steady state* |
| SIC8 | PKA | 0.05 µM | 0.01 | Est. from steady state, diffusion fitted |
| SIC9 | PDE1 | 0.9 µM | 10 | Est. from steady state* |
| SIC10 | PDE1act | 1 x 10⁻³ µM | 10 | Est. from steady state* |
| SIC11 | CaMPDE1 | 1 x 10⁻³ µM | 10 | Est. from steady state* |
| SIC12 | AC | 4 x 10⁻¹⁰ | 0 | Est. |
| SIC13 | CaMAC | 0 | 0 | Est. |
| SIC14 | ACact | 0 | 0 | Est. |
| SIC15 | ACind | 4 x 10⁻¹⁰ | 1 | Est.† |
| SIC16 | V | −60 mV | 1 | Fridlyand et al., 2003; Ni et al., 2011† |
| SIC17 | cAMP | 4 x 10⁻⁶ µM | 60 | Agarwal et al., 2016, Est. from steady state |
-
*For all cytosolic species without well-constrained diffusions, we used 10
†For all membrane species without well-constrained diffusions we used 1
Additional files
Download links
A two-part list of links to download the article, or parts of the article, in various formats.
Downloads (link to download the article as PDF)
Open citations (links to open the citations from this article in various online reference manager services)
Cite this article (links to download the citations from this article in formats compatible with various reference manager tools)
Spatially compartmentalized phase regulation of a Ca2+-cAMP-PKA oscillatory circuit
eLife 9:e55013.
https://doi.org/10.7554/eLife.55013


