Lipid accumulation controls the balance between surface connection and scission of caveolae
- Department of Integrative Medical Biology, Umeå University, Sweden
- Swedish Metabolomics Centre, Department of Forest Genetics and Plant Physiology, Swedish University of Agricultural Sciences, Sweden
- Swedish Metabolomics Centre, Department of Molecular Biology, Umeå University, Sweden
- Department of Chemistry, Umeå University, Sweden
Figures
Figure 1 with 4 supplements
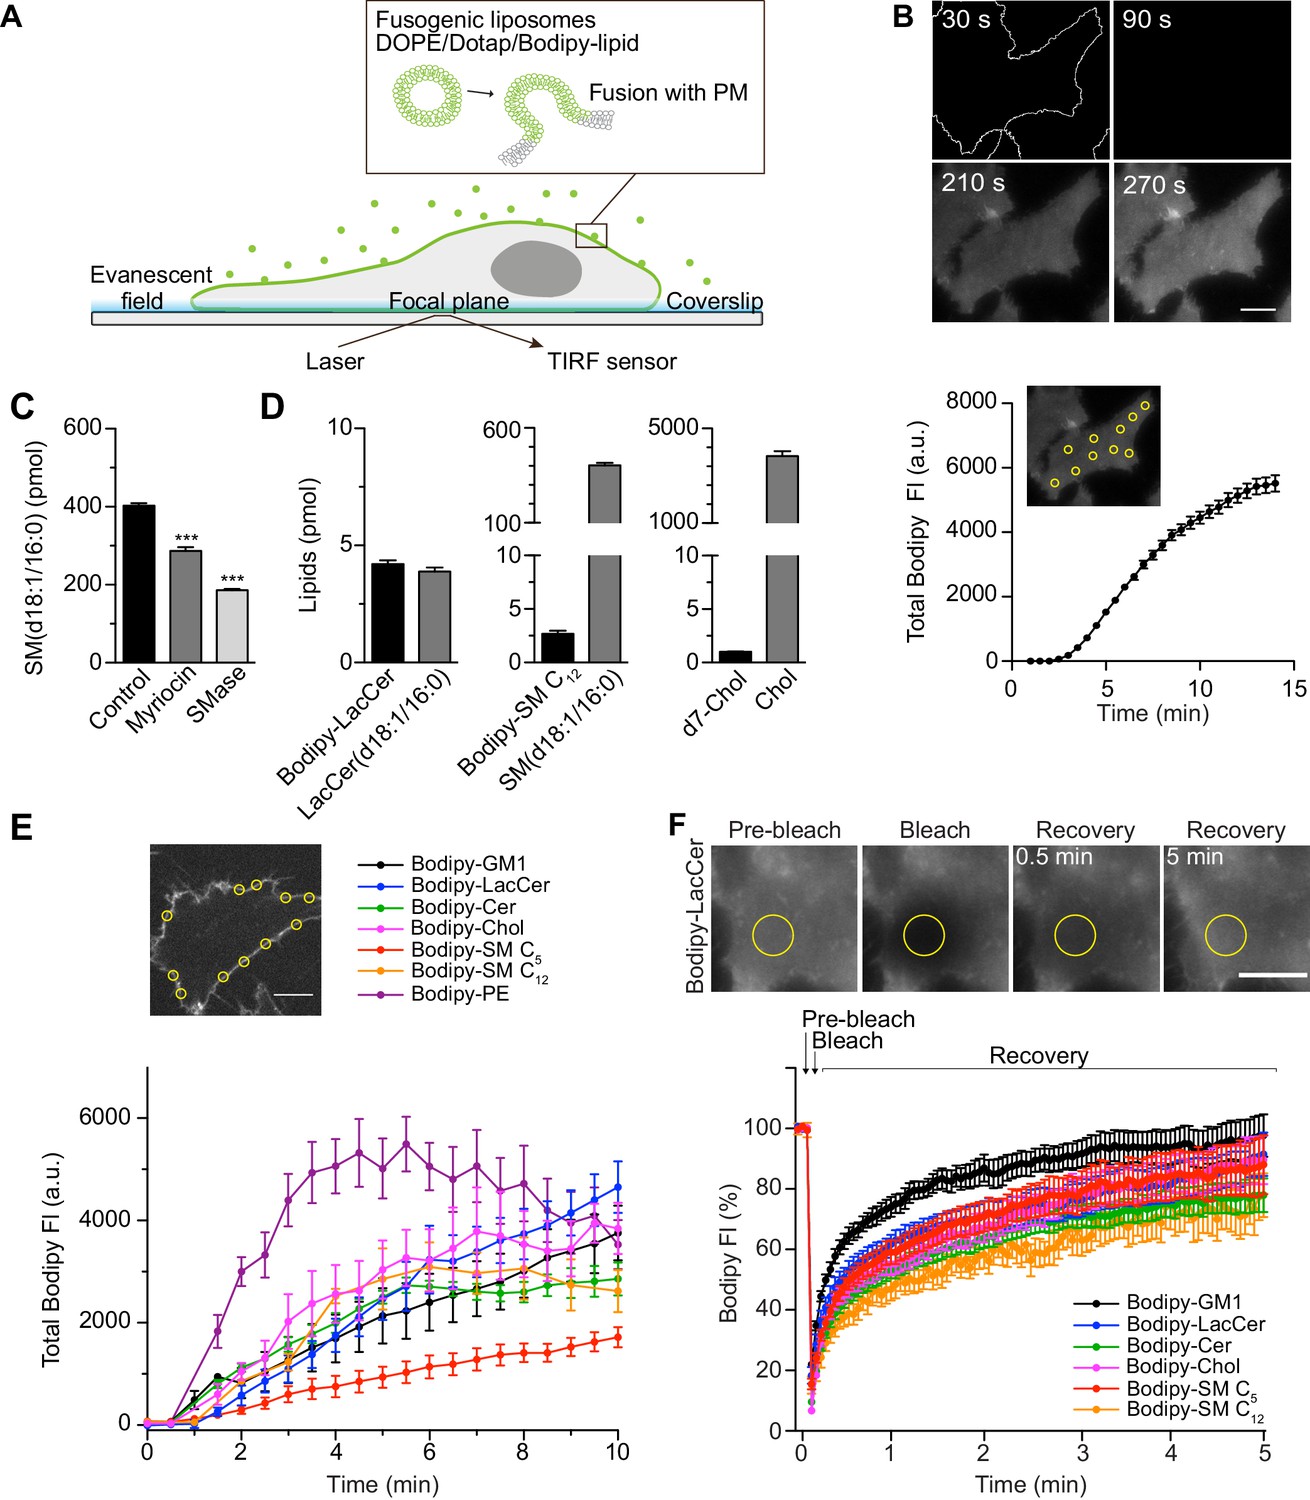
Rapid insertion of Bodipy-labeled lipids into the PM of living cells using fusogenic liposomes.
(A) Fusogenic liposomes are used to insert Bodipy-labeled lipids into the PM. Their rapid distribution is followed in real time using TIRF microscopy. (B) Image sequence of Bodipy-LacCer distribution throughout basal membrane of HeLa cells. Total Bodipy fluorescence intensity (FI) was measured within ROIs (yellow insert) using Zeiss Zen interface. n = 10, three independent experiments, mean ± SEM. (C) Quantification of endogenous SM(d18:1/16:0) using LC-ESI-MS/MS in control cells or cells treated with SMase or myriocin for 2 hr or 24 hr, respectively. Data are shown as mean ± SD. ***, p≤0.001 vs. control. (D) Quantification of Bodipy- or d7-labeled lipids (black bars) and endogenous lipids (grey bars) in cells following incubation of cells with fusogenic liposomes. Analysis was performed using mass spectrometry. Data are shown as mean + SD. (E) Incorporation rate of Bodipy-lipids into PM of live cells. HeLa cells were treated with fusogenic liposomes (final total lipid concentration 7 nmol/ml). Total Bodipy fluorescence intensity (FI) was measured within circular ROIs (see insert) in a confocal section using spinning disk microscopy. Ten ROIs were analyzed using the Zeiss Zen system software. n ≥ 2, two independent experiments, mean ± SEM. Scale bars, 10 μm. (F) TIRF FRAP of Bodipy-lipids after incorporation into PM of HeLa cells. A circular ROI was photobleached and recovery of Bodipy FI was monitored over 5 min. Bodipy FI was normalized to background and reference. n ≥ 10, mean ± SEM.
-
Figure 1—source data 1
Excel file containing source data pertaining to Figure 1B–F.
- https://cdn.elifesciences.org/articles/55038/elife-55038-fig1-data1-v2.xlsx
Figure 1—figure supplement 1
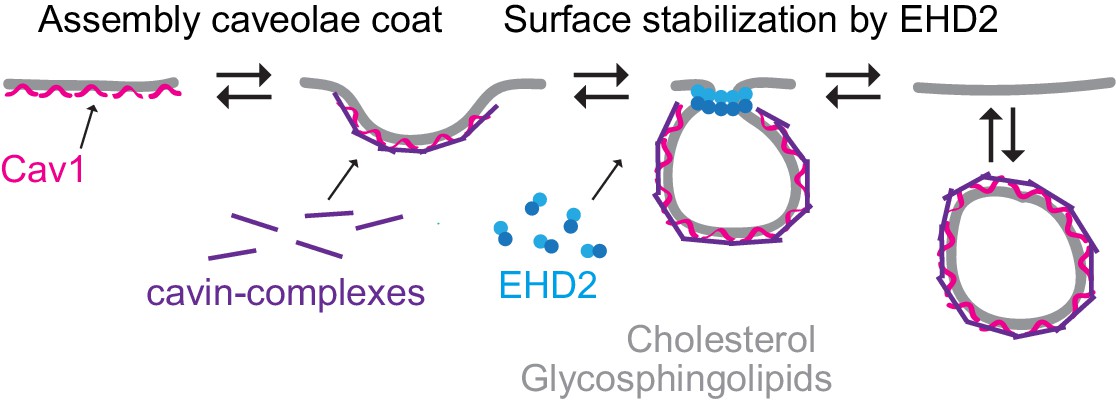
Caveolae dynamics at the cell surface.
Scheme illustrating caveolae dynamics at PM. Caveolae formation and coat assembly are primarily driven by the integral membrane protein Cav1 and cavin proteins. EHD2 controls surface association of caveolae.
Figure 1—figure supplement 2
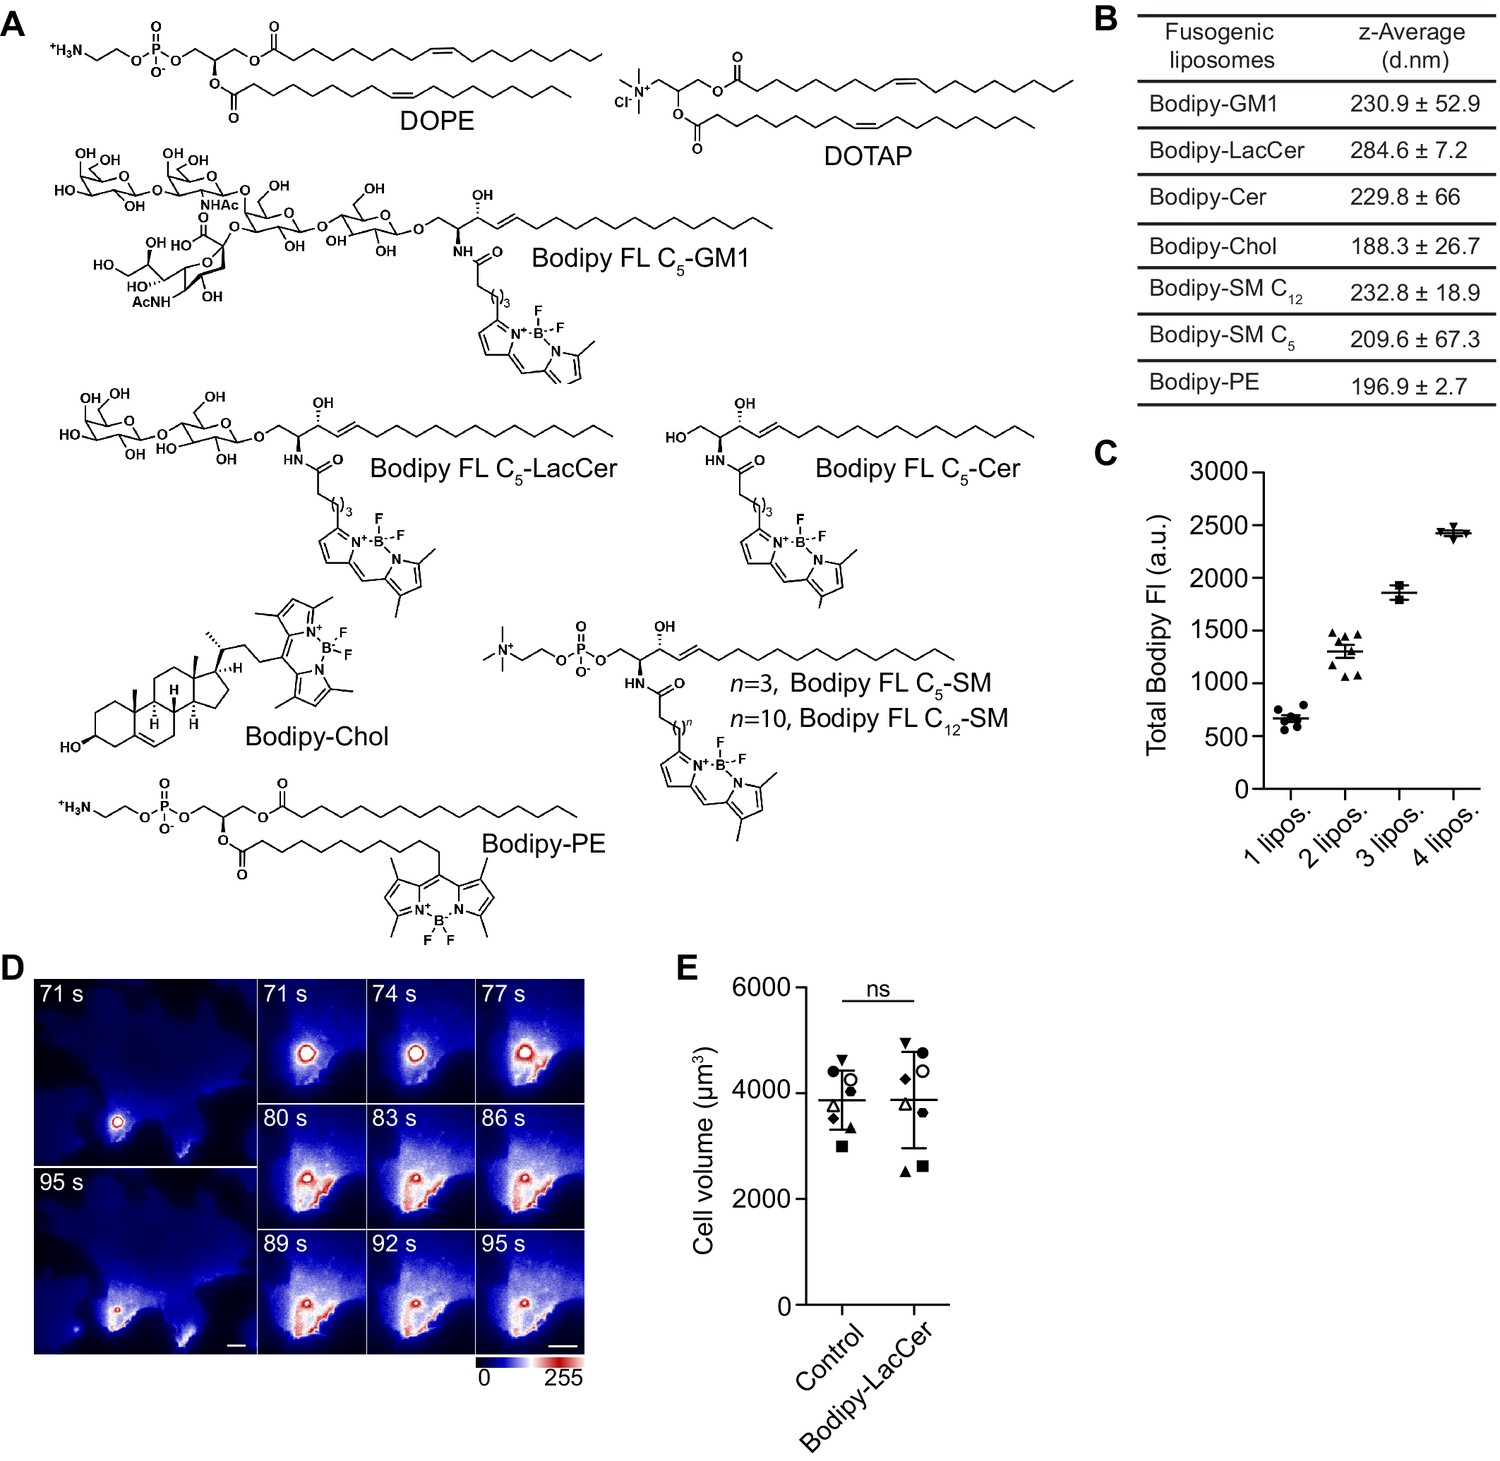
Liposome characterization and vesicle fusion with the PM.
(A) Chemical structures of lipids used in this study. (B) Hydrodynamic diameter as z-average of DOPE:DOTAP:Bodipy-lipid liposomes. n = 3, three independent experiments, mean ± SD. (C) Total Bodipy FI of liposomes containing Bodipy-LacCer was determined in a single confocal section (0.5 μm) using spinning disk microscopy. Bodipy FI corresponds to the number of liposomes measured in each ROI. n = 22, mean ± SEM. (D) Time-lapse imaging of a vesicle fusing with the PM. A single fusion event highlights the rapid distribution of the fluorophore from the liposome-membrane contact site and subsequent fusion. Distribution of Bodipy fluorescence is intensity‐coded using lookup table (LUT). Scale bars, 10 μm. (E) Analysis of the cell volume before and after addition of Bodipy-LacCer liposomes. Cell surface was segmented with Imaris using mCh fluorescence. Identical symbols in control and Bodipy-LacCer represent the same cell. n = 8, mean ± SD.
-
Figure 1—figure supplement 2—source data 1
Excel file containing source data pertaining to Figure 1—figure supplement 2A–C and E.
- https://cdn.elifesciences.org/articles/55038/elife-55038-fig1-figsupp2-data1-v2.xlsx
Figure 1—figure supplement 3
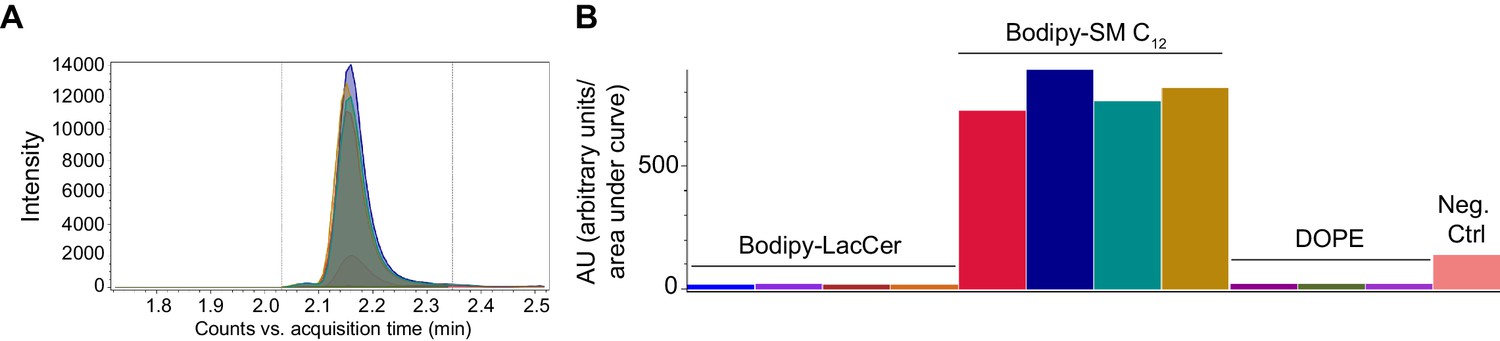
Quantification of Bodipy-lipid incorporation using mass spectrometry.
(A, B) Visualization of chromatography of Bodipy-SM C12. Samples visualized: Bodipy-LacCer treated samples, Bodipy-SM C12 treated samples, DOPE control samples and a negative control of Bodipy-SM C12 (liposomes added to wells without cells). (A) Chromatography of the samples. (B) Integrated area of each individual sample.
-
Figure 1—figure supplement 3—source data 1
Excel file containing source data pertaining to Figure 1—figure supplement 3A and B.
- https://cdn.elifesciences.org/articles/55038/elife-55038-fig1-figsupp3-data1-v2.xlsx
Figure 1—figure supplement 4
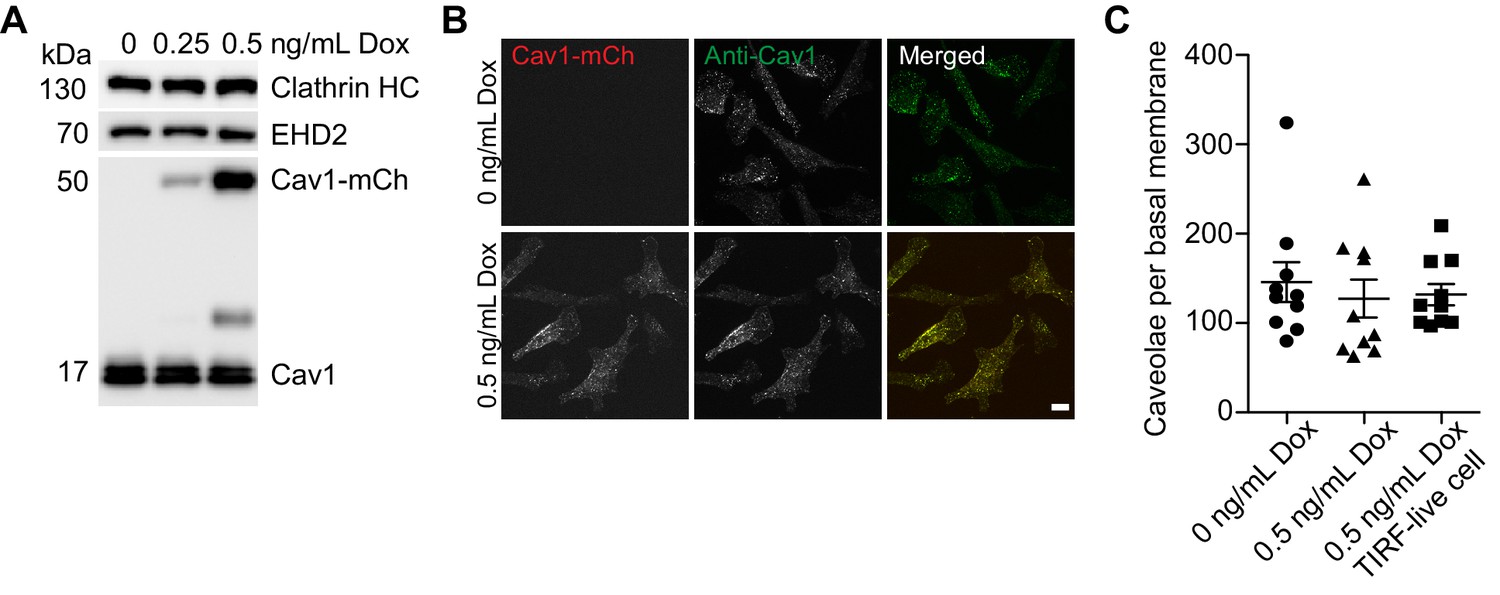
Characterization of Cav1-mCh HeLa cells.
(A) Representative immunoblots showing protein expression of EHD2, Cav1-mCh, and Cav1 after induction of Cav1-mCh HeLa cells with different concentrations of Dox. Clathrin HC served as loading control. (B) Representative confocal micrographs of fixed Cav1-mCh HeLa cells stained against Cav1. Top, non-induced cells; bottom, 0.5 ng/ml Dox induced cells. Scale bar, 10 μm. (C) Scatter plot showing number of caveolae per basal membrane from confocal micrographs of cells treated as in (B) or 0.5 ng/ml Dox induced Cav1-mCh cells acquired by live cell TIRF microscopy. Caveolae from at least 10 cells per condition were counted using the Imaris software. mean ± SEM
-
Figure 1—figure supplement 4—source data 1
Excel file containing source data pertaining to Figure 1—figure supplement 4C.
- https://cdn.elifesciences.org/articles/55038/elife-55038-fig1-figsupp4-data1-v2.xlsx
Figure 2 with 7 supplements
GSLs and Chol decrease the surface stability of caveolae.
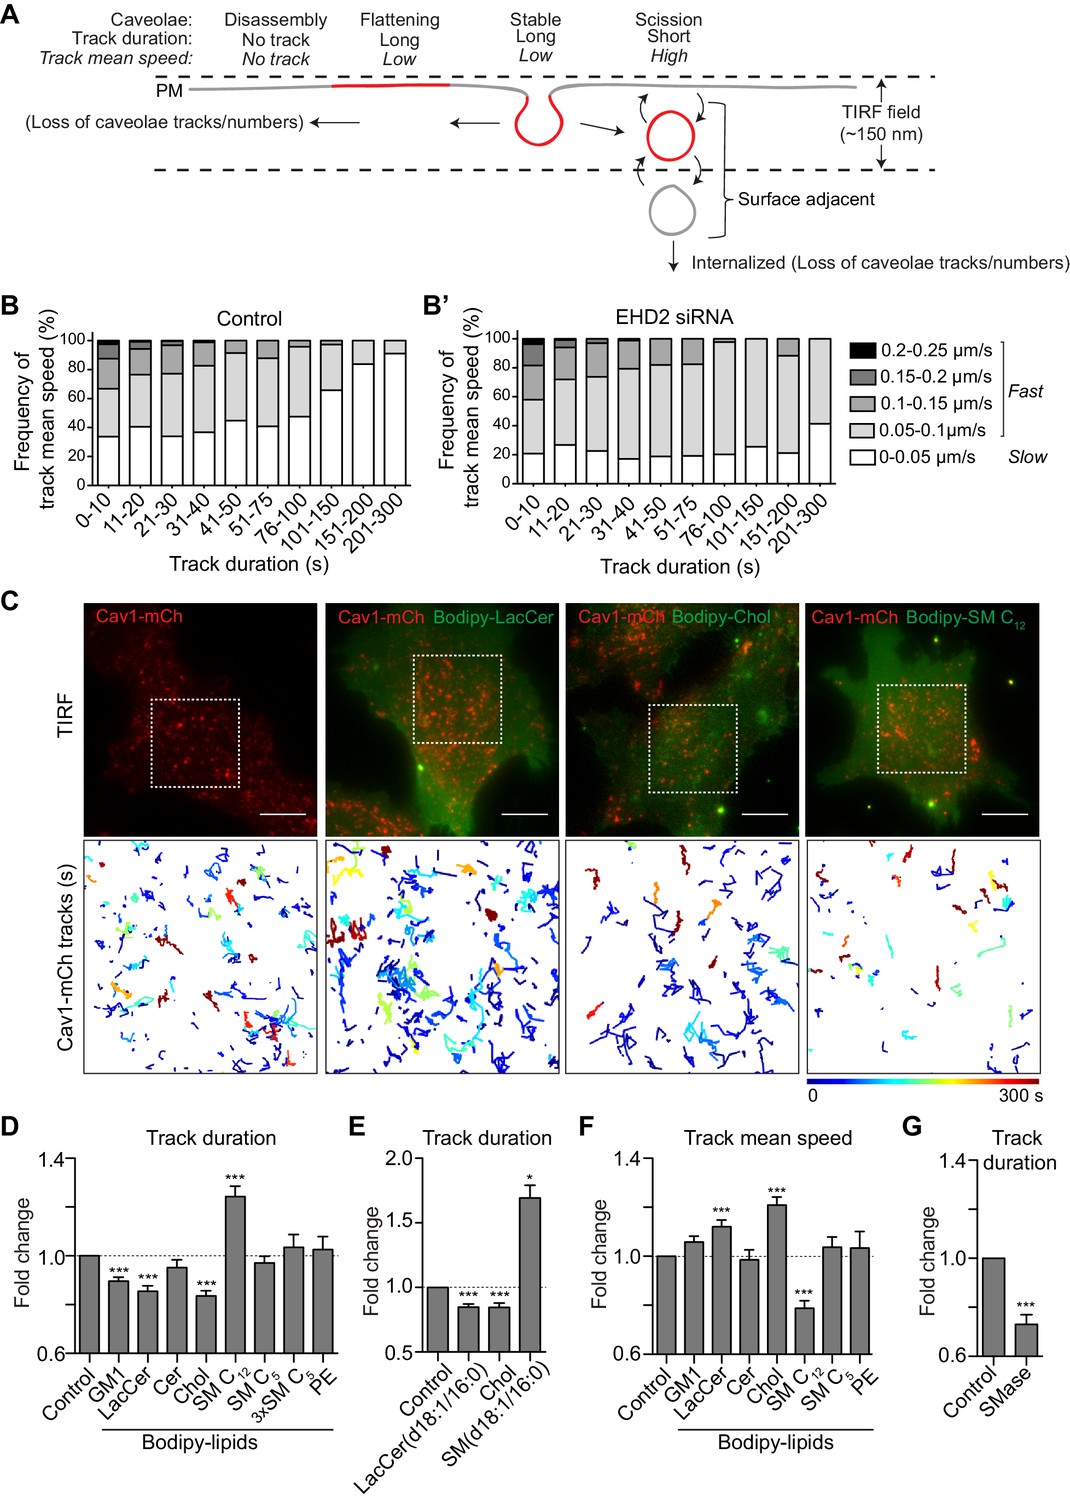
(A) Scheme showing different dynamic behaviors of caveolae. (B, B’) Distribution of track mean speed among subpopulations of track duration of Cav1-mCh structures (B) and after EHD2 depletion (B’). Five datasets for each condition were analyzed from TIRF live cell movies. (C) Representative images from TIRF movies of Cav1-mCh HeLa cells and after 15 min incubation with liposomes containing Bodipy-lipids. Color-coded trajectories illustrate time that structures can be tracked at PM over 5 min (dotted square). Scale bars, 10 μm. See Figure 2—videos 1, 2, 3, 4. (D,E) Quantification of track duration of Cav1-mCh structures from TIRF movies after incubation with liposomes containing labeled (D) or unlabeled lipids (E). Fold changes are relative to control (Cav1-mCh). (D) n ≥ 8, at least two independent experiments; (E) n ≥ 8, two independent experiments, ***, p≤0.001 vs. control. (F) Quantification of track mean speed of Cav1-mCh structures from TIRF movies (same cells as in (D)). (G) Quantification of track duration of Cav1-mCh structures from TIRF movies following incubation with SMase for 2 h. Fold changes are relative to control (Cav1-mCh). n ≥ 5. All analyses were performed using Imaris software and data are shown as mean ± SEM.
-
Figure 2—source data 1
Excel file containing source data pertaining to Figure 2B and D–G.
- https://cdn.elifesciences.org/articles/55038/elife-55038-fig2-data1-v2.xlsx
Figure 2—figure supplement 1
Correlation between track duration and track mean speed after different treatments.
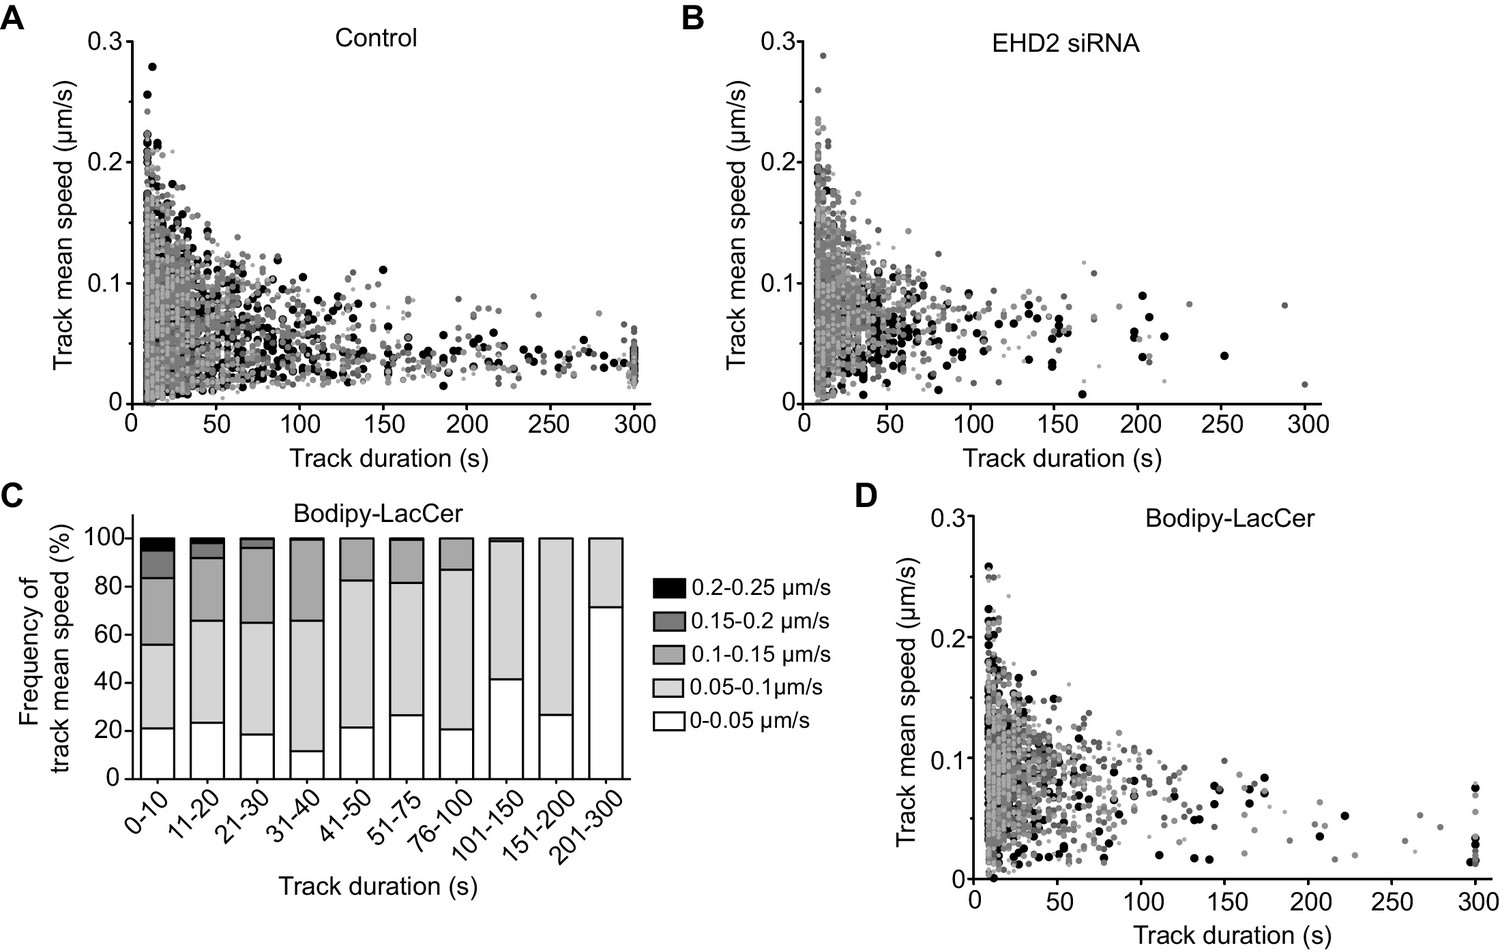
(A, B) Correlation between track duration and track mean speed. TIRF live cell movies of Cav1-mCh structures (A) and cells lacking EHD2 (B) were analyzed. Identical symbols represent tracks from the same cell. (C) Distribution of track mean speed in subpopulations of track duration of Cav1-mCh structures treated with Bodipy-LacCer liposomes. (D) Correlation between track duration and track mean speed of Cav1-mCh structures treated with Bodipy-LacCer liposomes. In (A–D) five datasets were analyzed for each condition using Imaris software.
-
Figure 2—figure supplement 1—source data 1
Excel file containing source data pertaining to Figure 2—figure supplement 1A–D.
- https://cdn.elifesciences.org/articles/55038/elife-55038-fig2-figsupp1-data1-v2.xlsx
Figure 2—figure supplement 2
Effect of Bodipy-lipid addition on Cav1-mCh tracks and quantification of Cav1-mCh positive structures.
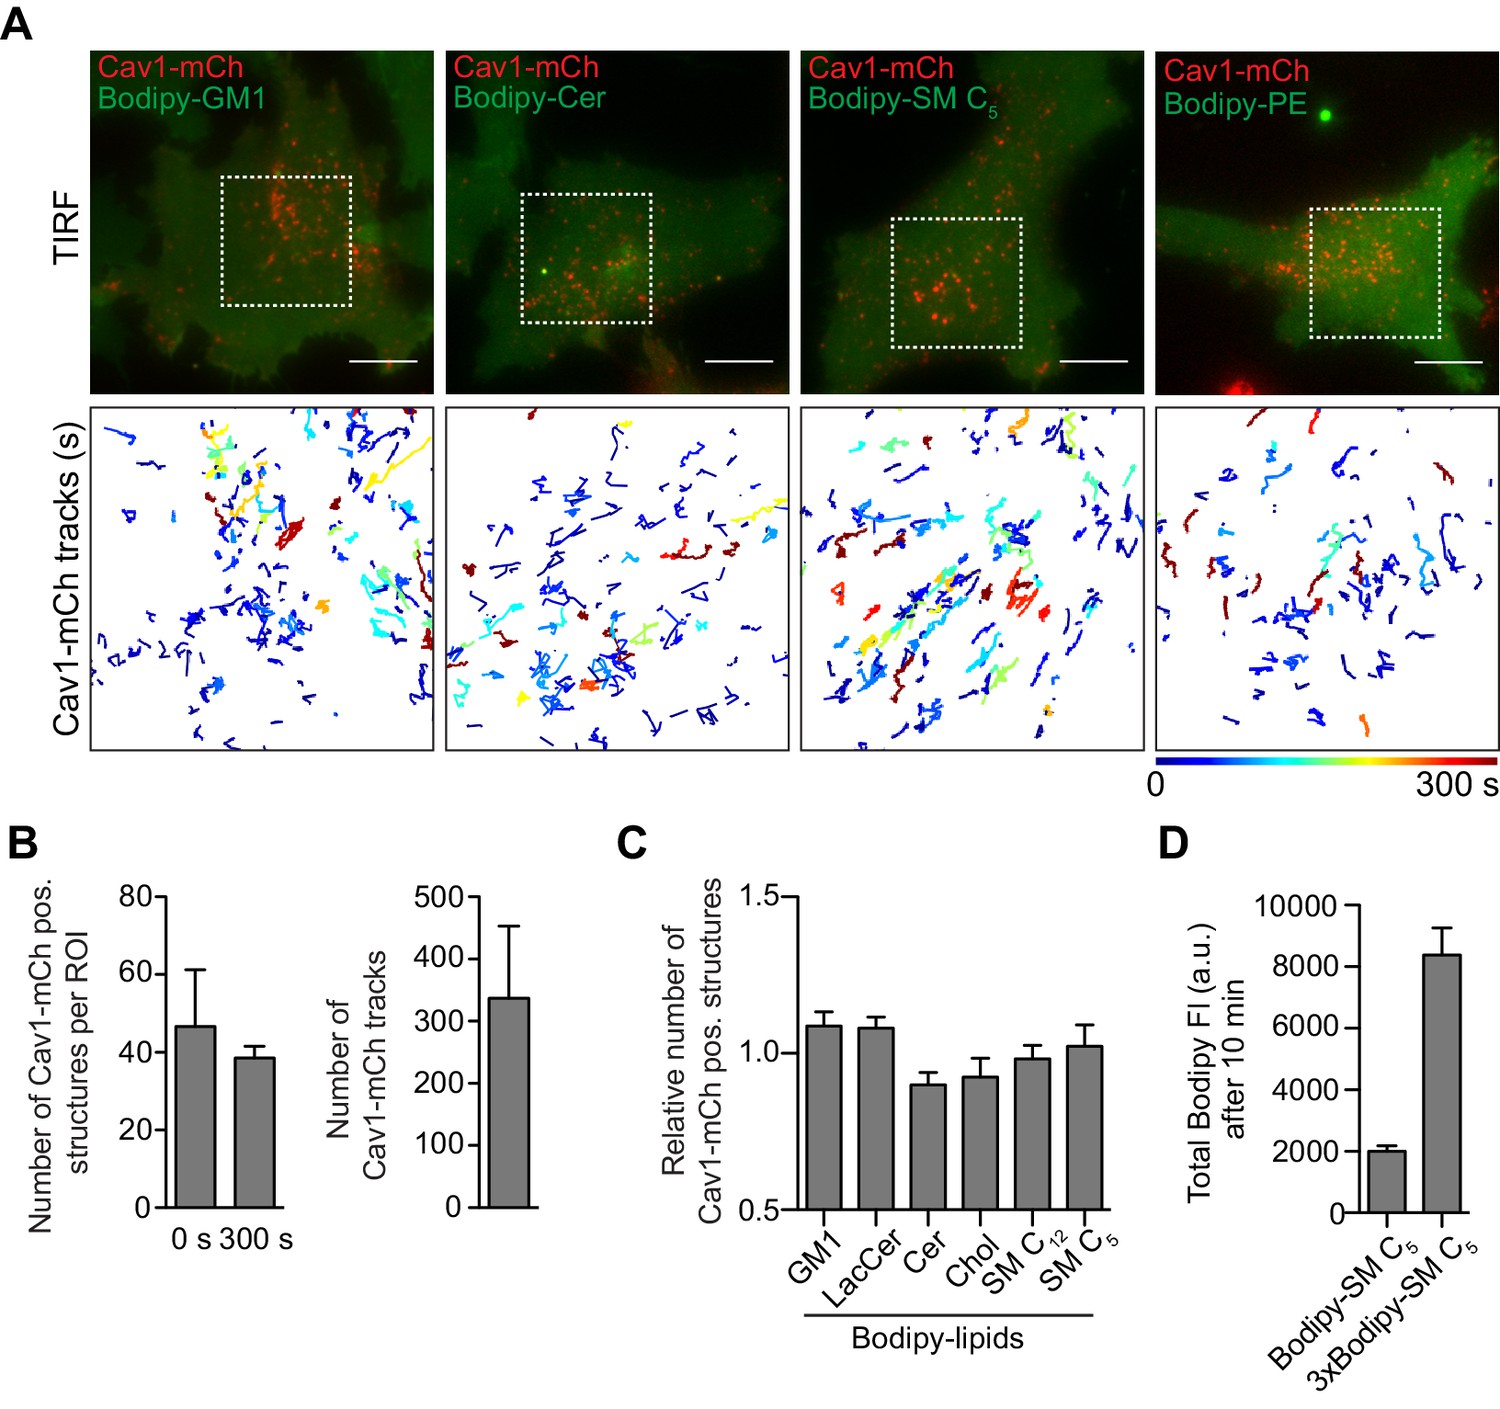
(A) Representative images from TIRF live cell movies of Dox-induced Cav1-mCh HeLa cells after incubation with different fusogenic liposomes containing Bodipy-lipids (final total lipid concentration of 7 nmol/ml) for 15 min. Cav1-mCh structures were tracked using Imaris software. Color-coded trajectories illustrate time that structures were tracked at the PM over 5 min (dotted square). Scale bars, 10 μm. (B) Number of Cav1-mCh positive structures at the beginning and at the end of 5 min TIRF movies and the corresponding number of tracks detected. n ≥ 8, three independent experiments, mean ± SEM. (C) Relative number of caveolae at the PM of Cav1-mCh HeLa cells before and after addition of fusogenic liposomes. TIRF live cell movies from Figure 2C and (A) were analyzed. Number of caveolae after lipid treatment was normalized to the number of caveolae in control cells. n ≥ 8, three independent experiments, mean ± SEM.
-
Figure 2—figure supplement 2—source data 1
Excel file containing source data pertaining to Figure 2—figure supplement 2B–D.
- https://cdn.elifesciences.org/articles/55038/elife-55038-fig2-figsupp2-data1-v2.xlsx
Figure 2—figure supplement 3
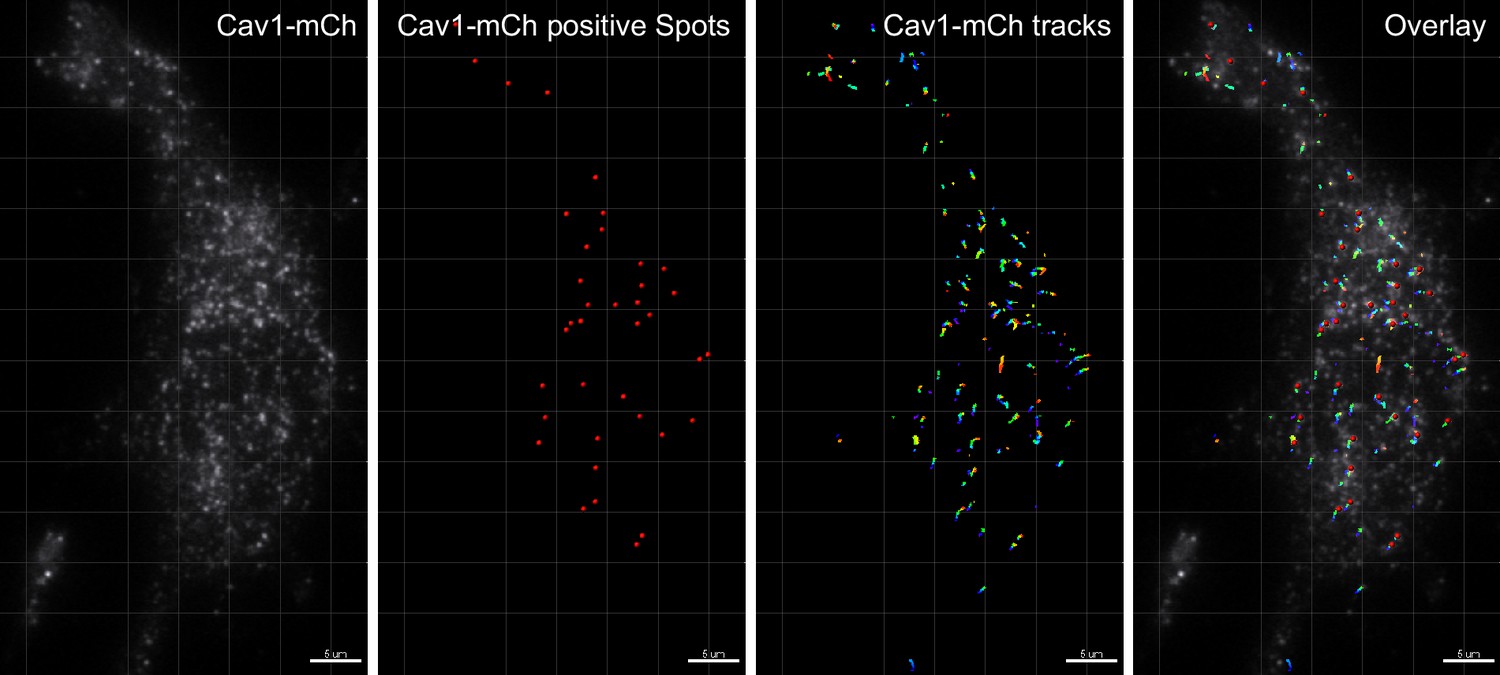
Caveolae tracking with Imaris software.
To track caveolae dynamics, 5 min TIRF movies of induced Cav1-mCh HeLa cells were recorded with an acquisition time of 3 s. One frame from the movie is depicted (Cav1-mCh). Spot analysis of Cav1-mCh positive structures was performed, and structures were segmented and those with a diameter of 0.4 μm were selected based on a quality of intensity set to 2% as previously described (Mohan et al., 2015) (Cav1-mCh positive spots). The spot tracking algorithm was based on Brownian motion with max distance travelled of 0.8 μm and a max gap size of (Cav1-mch tracks). Track duration time and mean speed data were extracted from the analysis. No data that could distinguish between single caveolae and rosettas could be obtained. Scale bars, 10 μm.
Figure 2—video 1
Cell surface dynamics of Cav1-mCh.
A representative TIRF live cell movie of Dox-induced Cav1-mCh HeLa cells. The image in Fig. 2C (Cav1-mCh) is taken from this movie. Movie in real time spans 5 min and was recorded at 3 s intervals. Scale bar, 10 μm.
Figure 2—video 2
Cell surface dynamics of Cav1-mCh after treatment with Bodipy-LacCer.
A representative TIRF live cell movie of Dox-induced Cav1-mCh HeLa cells after 15 min incubation with liposomes containing Bodipy-LacCer. The image in Fig. 2C is taken from this movie. Movie in real time spans 5 min and was recorded at 3 s intervals. Scale bar, 10 μm.
Figure 2—video 3
Cell surface dynamics of Cav1-mCh after treatment with Bodipy-Chol.
A representative TIRF live cell movie of Dox-induced Cav1-mCh HeLa cells after 15 min incubation with liposomes containing Bodipy-Chol. The image in Fig. 2C is taken from this movie. Movie in real time spans 5 min and was recorded at 3 s intervals. Scale bar, 10 μm.
Figure 2—video 4
Cell surface dynamics of Cav1-mCh after treatment with Bodipy-SM C12.
A representative TIRF live cell movie of Dox-induced Cav1-mCh HeLa cells after 15 min incubation with liposomes containing Bodipy-SM C12. The image in Fig. 2C is taken from this movie. Movie in real time spans 5 min and was recorded at 3 s intervals. Scale bar, 10 μm.
Figure 3 with 4 supplements
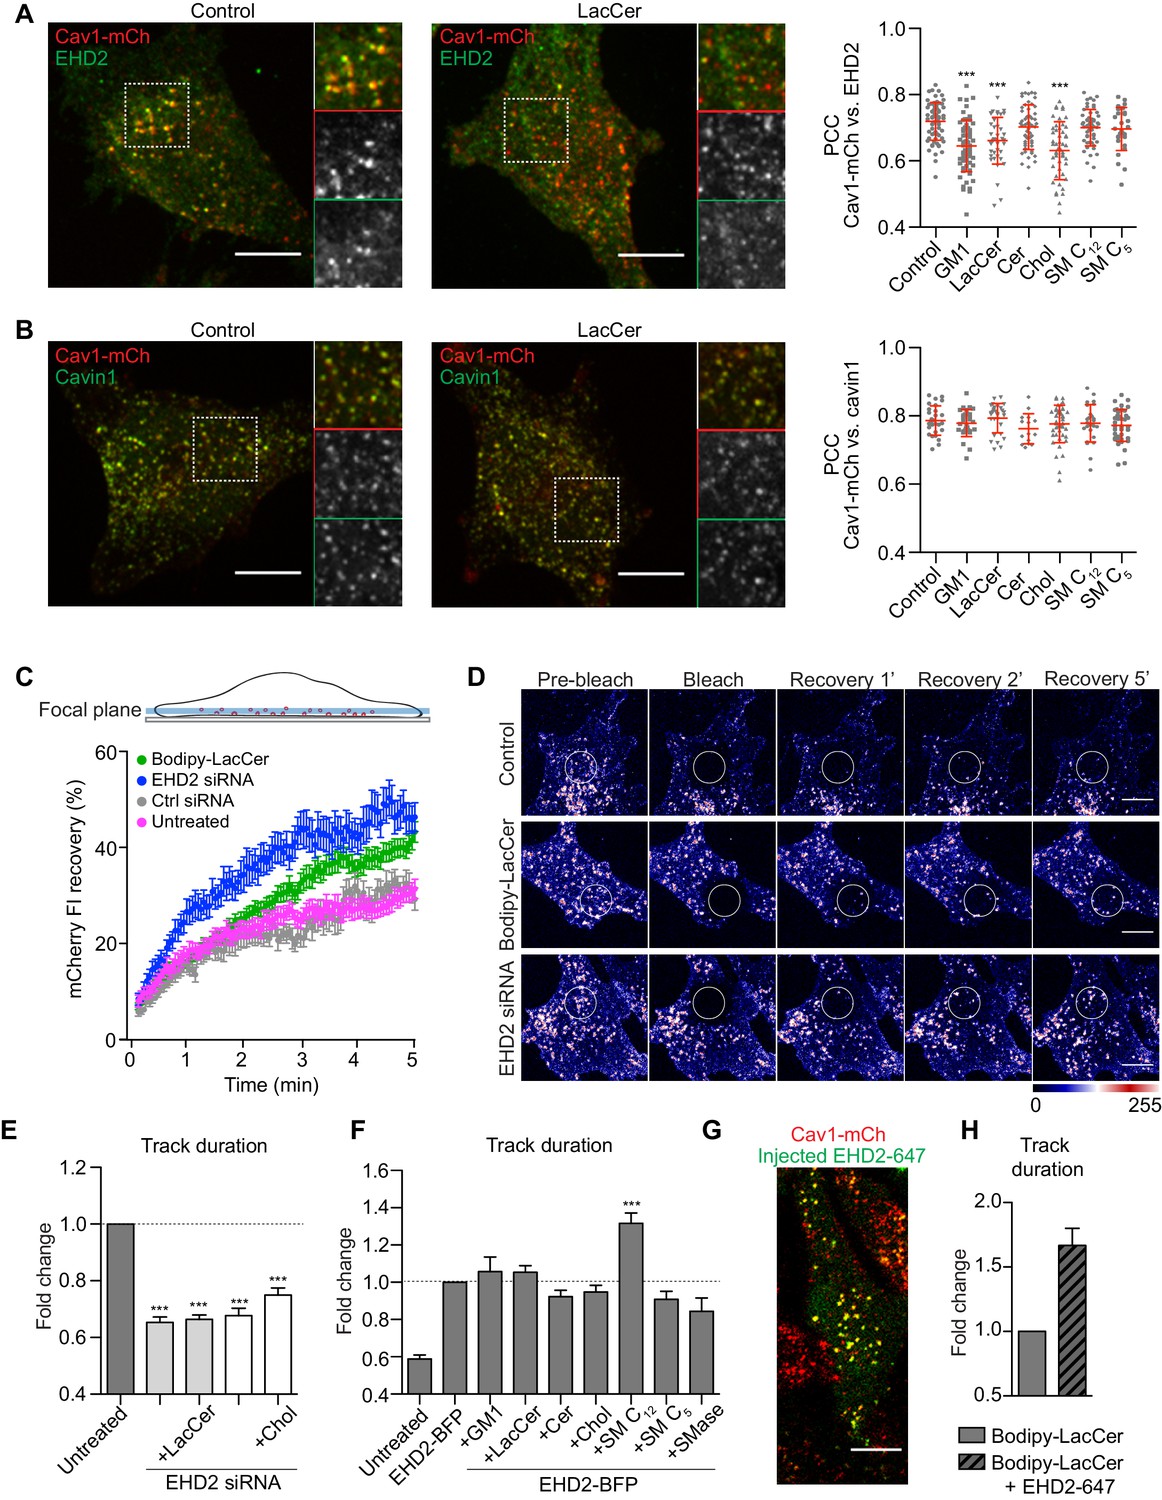
Chol and GSLs induce surface release of caveolae via an EHD2-dependent mechanism.
(A) Representative images of maximum projected confocal z-stacks of Cav1-mCh HeLa cells. Untreated cells or cells treated with LacCer-Bodipy liposomes for 1 h, fixed and immunostained for endogenous EHD2. High-magnification images (dotted square) show localization of EHD2 to Cav1-mCh (see scatterplot for quantification). n ≥ 60, two independent experiments, mean ± SEM. ***, p≤0.001 vs. control. (B) Experimental protocols analogous to (A), with exception of endogenous cavin1 immunostaining. n ≥ 60, mean ± SEM. (C) Confocal FRAP of Cav1-mCh HeLa cells treated with either EHD2 siRNA or Bodipy-LacCer liposomes. A ROI was photobleached and recovery of mCherry FI monitored over 5 min. mCherry FI was normalized to background and reference. n ≥ 10, mean ± SEM. (D) Representative time-lapse series showing control Cav1-mCh HeLa cells and cells treated with either EHD2 siRNA or Bodipy-LacCer liposomes. The photobleached area is outlined with white circles. mCherry FI is intensity‐coded using LUT. (E) Effects of lipids on track duration of Cav1-mCh structures were analyzed following siRNA-mediated depletion of EHD2. n ≥ 8, two independent experiments, mean ± SEM. (F) Quantification of track duration of untreated Cav1-mCh HeLa cells or cells transiently expressing EHD2-BFP with or without incubation with liposomes. Changes in track duration are relative to EHD2-BFP control (indicated by dotted line). n ≥ 8, two independent experiments, mean + SEM. ***, p≤0.001 vs. control cells. (G) Representative live cell confocal image of EHD2-647 microinjected into Cav1-mCh HeLa cells. (H) Quantification of track duration of Cav1-mCh cells treated with Bodipy-LacCer and following microinjection of EHD2-647. n = 8, mean + SEM. All scale bars, 10 μm.
-
Figure 3—source data 1
Excel file containing source data pertaining to Figure 3A–C,E,F and H.
- https://cdn.elifesciences.org/articles/55038/elife-55038-fig3-data1-v2.xlsx
Figure 3—figure supplement 1
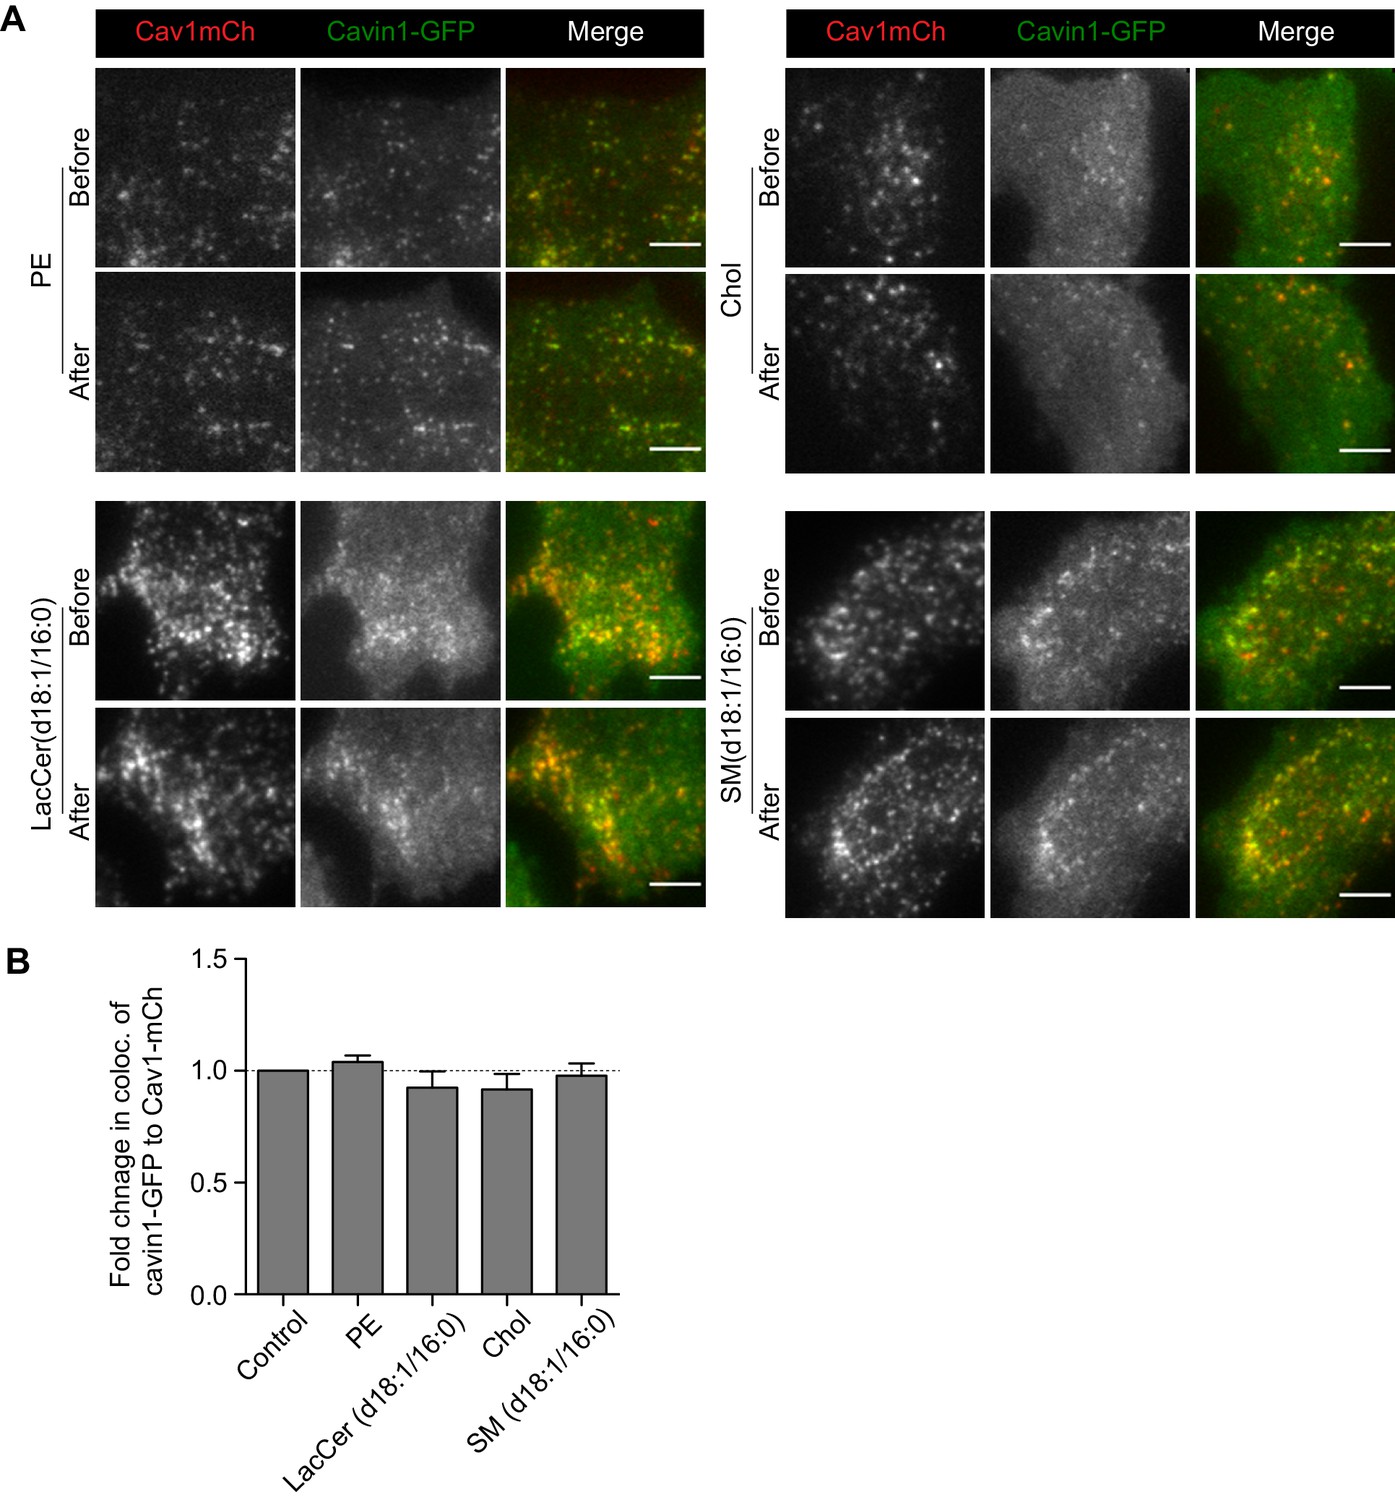
Cavin1 localization to Cav1-mCh before and after liposome treatment.
(A) Representative TIRF micrographs of cavin1-GFP transfected Dox-induced Cav1-mCh HeLa cells. The same cells were imaged before and after incubation with fusogenic liposomes as depicted (final total lipid concentration 7 nmol/ml). Scale bar, 10 μm. (B) Bar graph shows fold change of the percentage of colocalizing spots before and after liposome treatment relative to untreated cells. n ≥ 10, at least two independent experiments, mean ± SEM.
-
Figure 3—figure supplement 1—source data 1
Excel file containing source data pertaining to Figure 3—figure supplement 1B.
- https://cdn.elifesciences.org/articles/55038/elife-55038-fig3-figsupp1-data1-v2.xlsx
Figure 3—figure supplement 2
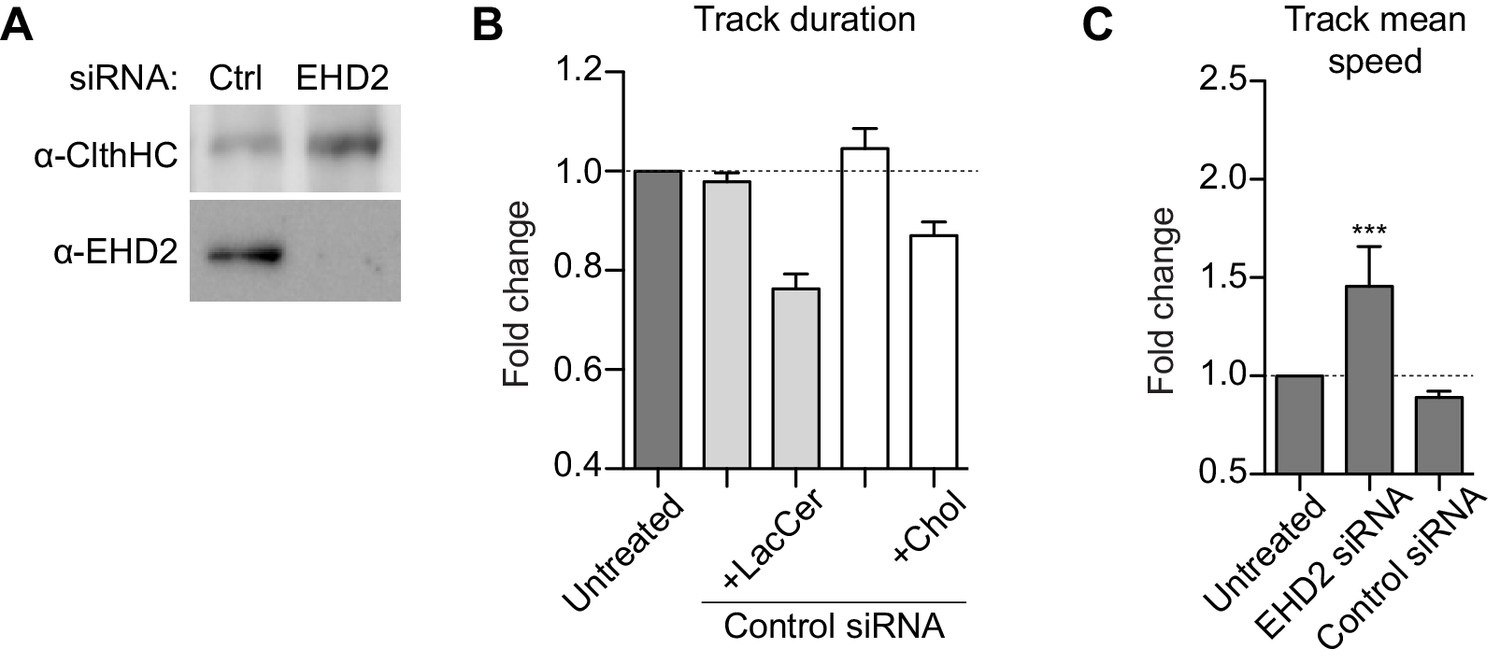
EHD2 depletion in Cav1-mCh HeLa cells.
(A) Representative immunoblots of Cav1-mCh HeLa cells treated with Ctrl siRNA or siRNA against EHD2. Clathrin HC served as loading control. (B) Effect of lipids on track duration of Cav1-mCh structures analyzed following control siRNA-treatment. n ≥ 8, two independent experiments, mean ± SEM. (C) Quantification of track mean speed of Cav1-mCh structures from TIRF movies treated with control siRNA or siRNA against EHD2. Fold changes are relative to untreated cells (Cav1-mCh). n ≥ 8, two independent experiments, ***, p≤0.001 vs. untreated.
-
Figure 3—figure supplement 2—source data 1
Excel file containing source data pertaining to Figure 3—figure supplement 2B and C.
- https://cdn.elifesciences.org/articles/55038/elife-55038-fig3-figsupp2-data1-v2.xlsx
Figure 3—figure supplement 3
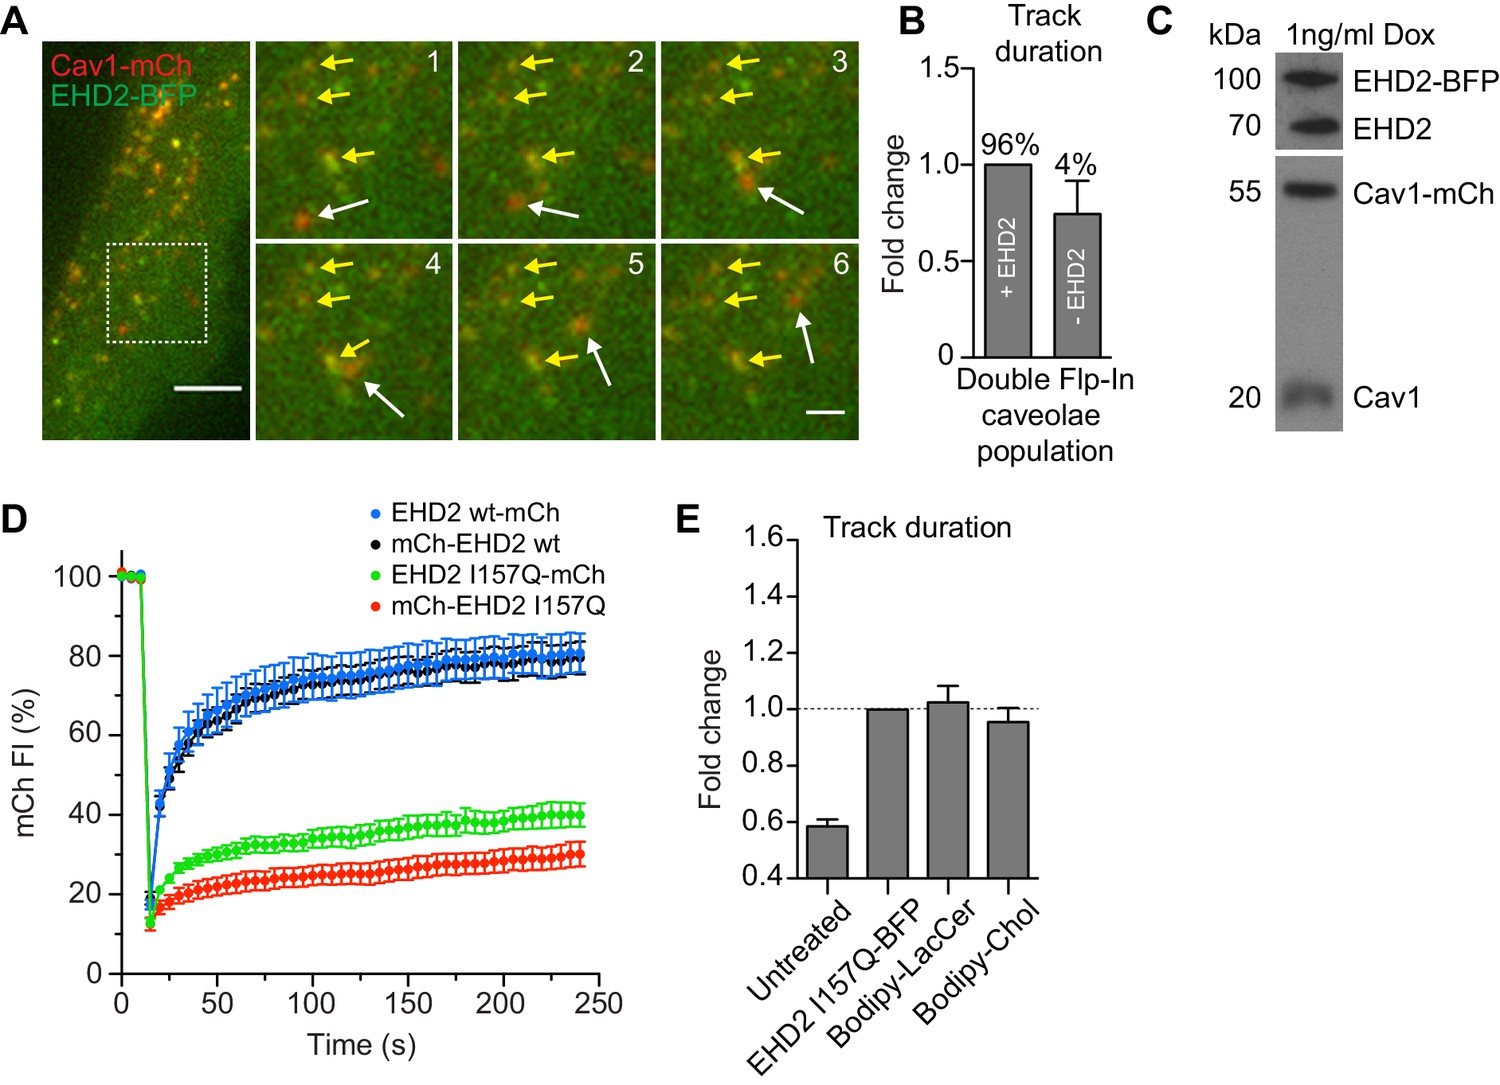
Stabilization of caveolae to the PM by EHD2-I157Q cannot be reversed by addition of Bodipy-labeled LacCer or Chol.
(A) Representative time-lapse images of Cav1-mCh positive for EHD2-BFP (yellow arrows) or lacking EHD2-BFP (white arrows) in double Flp-In EHD2-BFP Cav1-mCh HeLa cells. Dotted box shows higher magnification region. Numbering corresponds to number of frames. Scale bar, 10 μm; inset scale bars, 2 μm. (B) Differences in track duration of Cav1-mCh structures positive for EHD2-BFP or lacking EHD2-BFP in double Flp-In EHD2-BFP Cav1-mCh HeLa cells. Percentage of Cav1-mCh structures positive or lacking EHD2-BFP are indicated. n = 8, mean ± SEM. (C) Representative immunoblots of double Flp-In EHD2-BFP Cav1-mCh HeLa cells induced with 1 ng/ml Dox. (D) FRAP curves of mCh-tagged EHD2 wt or EHD2 I157Q expressing HeLa cells. A ROI was photobleached and recovery of mCherry fluorescence intensity (mCherry FI) was monitored. Intensities were normalized to background and reference. n = 8, mean ± SEM. (E) Cav1-mCh HeLa cells transiently expressing EHD2-I157Q-BFP were incubated with Bodipy-LacCer or Bodipy-Chol liposomes and track duration was analyzed. n ≥ 8, two independent experiments, mean + SEM. Imaris software was used to analyze data. Changes in track duration are relative to EHD2-I157Q-BFP control (indicated by dotted line).
-
Figure 3—figure supplement 3—source data 1
Excel file containing source data pertaining to Figure 3—figure supplement 3B,D and E.
- https://cdn.elifesciences.org/articles/55038/elife-55038-fig3-figsupp3-data1-v2.xlsx
Figure 3—figure supplement 4
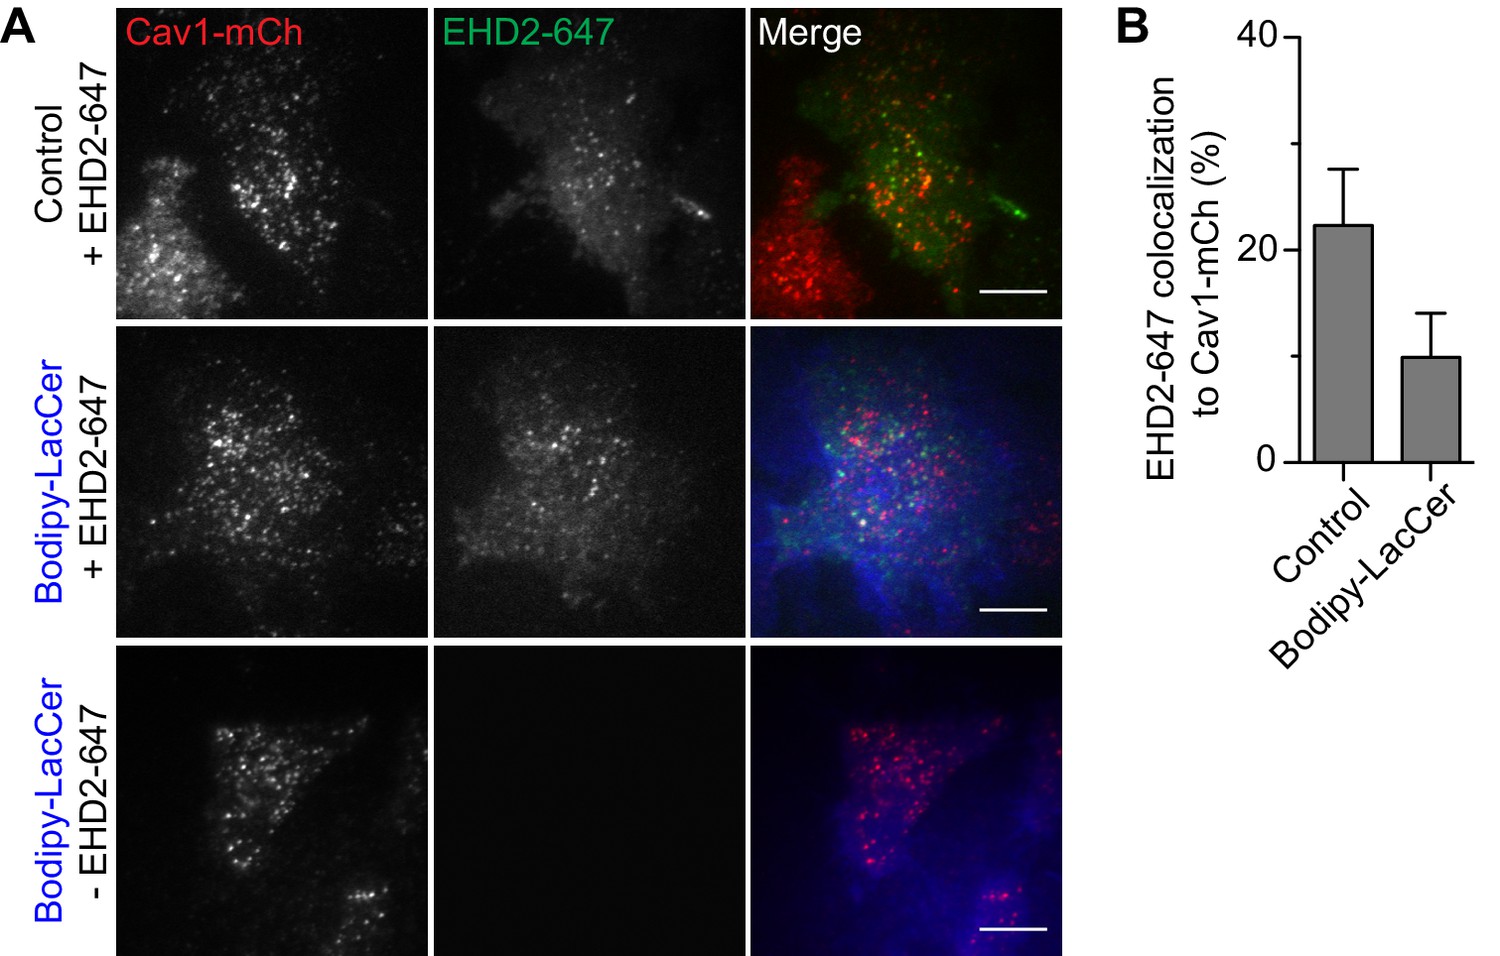
Microinjection of EHD2-647 into Cav1-mCh HeLa cells.
(A) Representative live cell TIRF images of Cav1-mCh HeLa cells untreated or treated with Bodipy-LacCer and with or without microinjection of EHD2-647. (B) Quantification of the colocalization of microinjected EHD2-647 to Cav1-mCh in control cells and cells treated with Bodipy-LacCer liposomes prior to injection. n ≥ 5, mean ± SEM . Scale bar, 10 μm. Imaris software was used to analyze data.
-
Figure 3—figure supplement 4—source data 1
Excel file containing source data pertaining to Figure 3—figure supplement 4B.
- https://cdn.elifesciences.org/articles/55038/elife-55038-fig3-figsupp4-data1-v2.xlsx
Figure 4 with 7 supplements

LacCer, Chol, and SM accumulate in caveolae and Chol is sequestered within these domains.
(A–D) Cav1-mCh HeLa cells transiently expressing EHD2-BFP were incubated with Bodipy-lipids. White lines indicate location of kymograph. TIRF movies were recorded at 3 s intervals for 5 min. Scale bars, 10 μm; kymograph scale bars, 5 μm. See Figure 4—videos 3 and 4. (E) Cav1-mCh HeLa cells transiently expressing EHD2-BFP were incubated with Bodipy-LacCer for 10 min. Following photobleaching (yellow ROI), recovery of Bodipy signal within caveolae (red ROI) and bulk PM (cyan ROI) was monitored over time. White arrows highlight surface connected caveolae with accumulated Bodipy-LacCer. Scale bar, 10 μm. (F) Recovery curves of Bodipy intensities within caveolae ROI (red) and bulk PM ROI (cyan). Bodipy FI was normalized to background and reference.
-
Figure 4—source data 1
Excel file containing source data pertaining to Figure 4F.
- https://cdn.elifesciences.org/articles/55038/elife-55038-fig4-data1-v2.xlsx
Figure 4—figure supplement 1
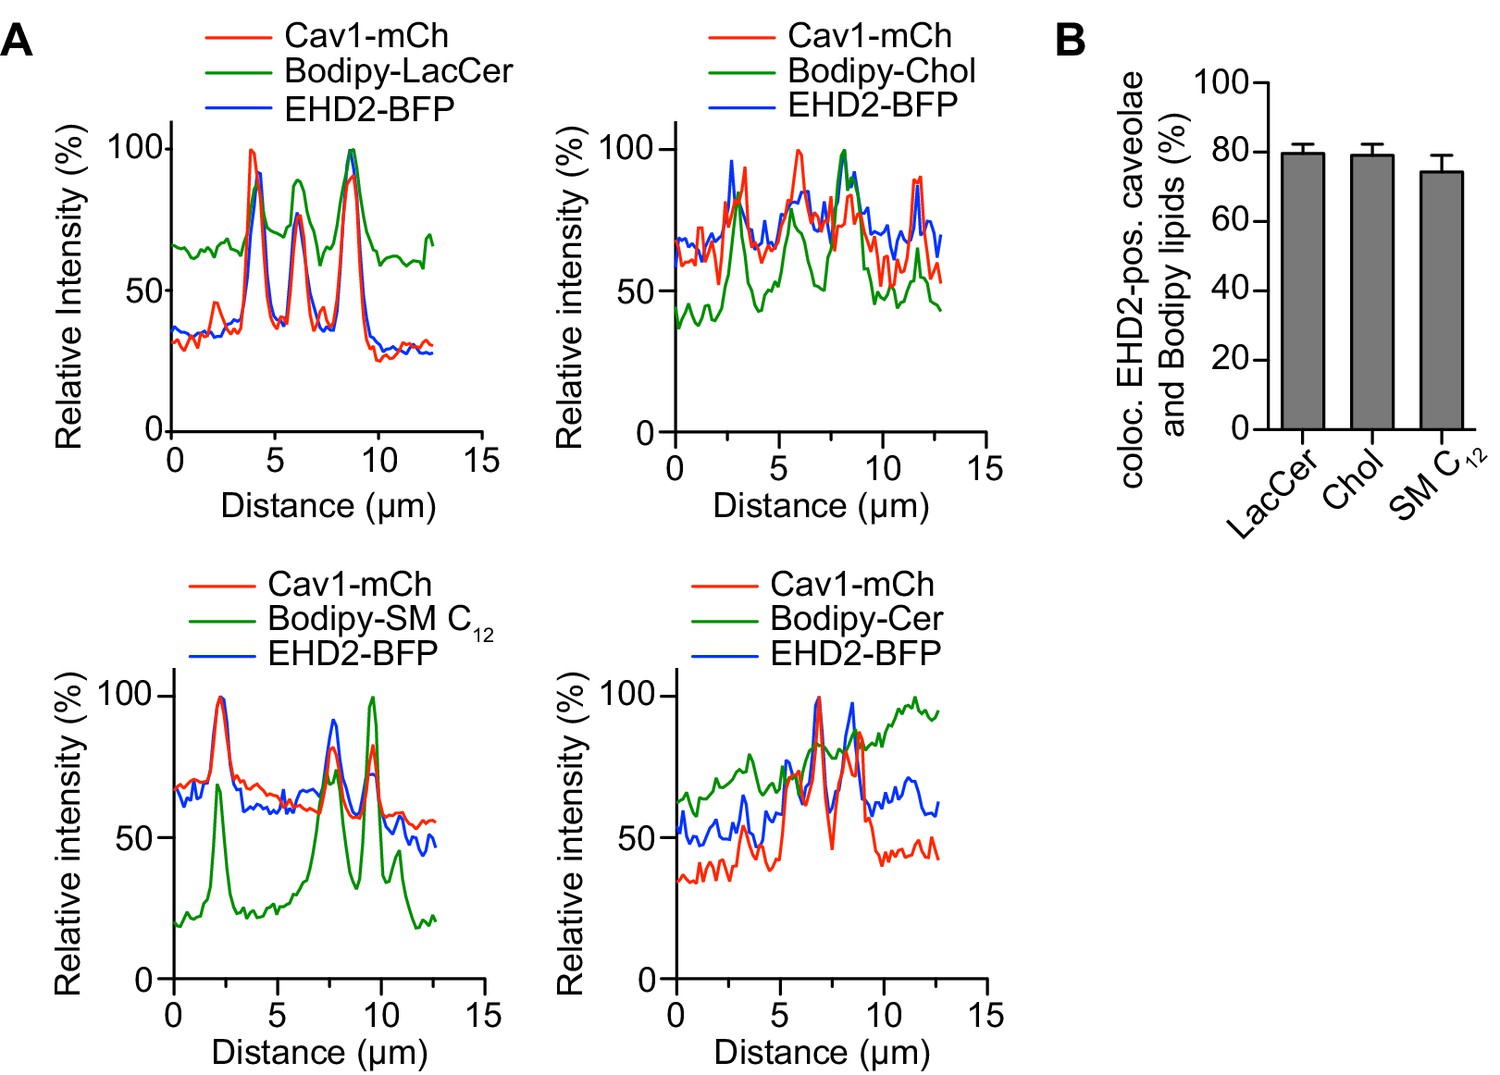
Localization of Bodipy-lipids to Cav1-mCh positive for EHD2-BFP.
(A) Cav1-mCh HeLa cells transiently expressing EHD2-BFP were incubated with Bodipy-lipid liposomes. White lines shown in Figure 4A–D indicate the location of the kymograph and the corresponding intensity profiles illustrate the colocalization of Bodipy-lipids with Cav1-mCh in the presence of EHD2-BFP. Intensity profiles are relative to the maximum value for each sample. (B) Quantification of EHD2-positive caveolae colocalizing with Bodipy-lipids. n ≥ 8, at least two independent experiments, mean ± SEM.
-
Figure 4—figure supplement 1—source data 1
Excel file containing source data pertaining to Figure 4—figure supplement 1A and B.
- https://cdn.elifesciences.org/articles/55038/elife-55038-fig4-figsupp1-data1-v2.xlsx
Figure 4—figure supplement 2
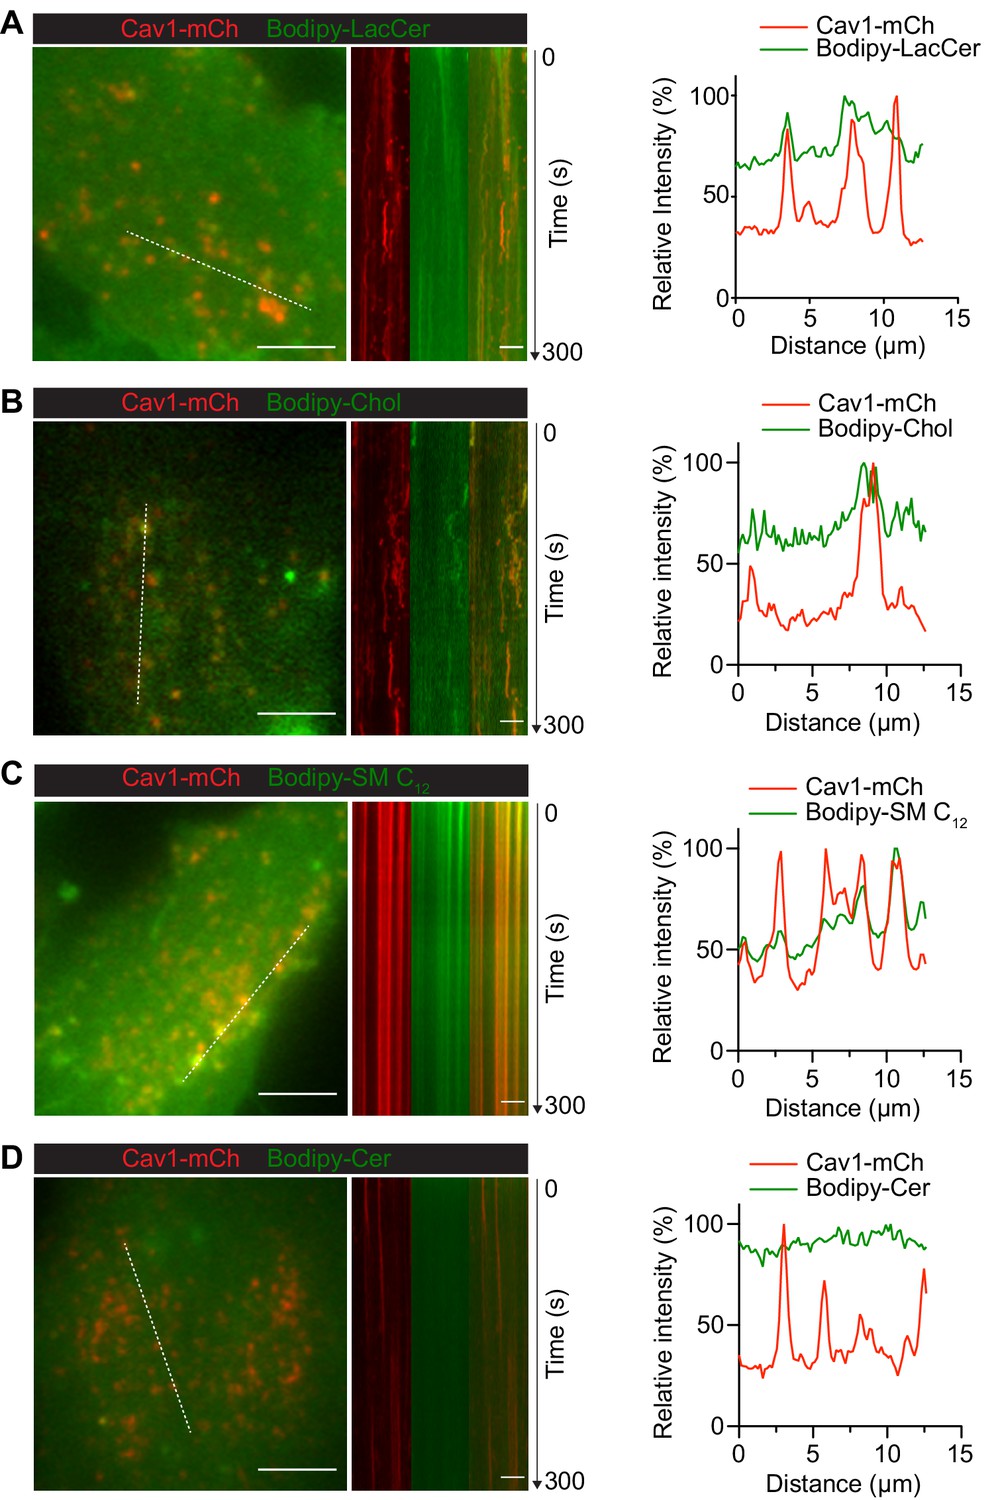
Kymographs of Cav1-mCh HeLa cells incubated with Bodipy-lipid liposomes.
(A–D) Cav1-mCh HeLa cells were incubated with Bodipy-lipid liposomes as indicated. White lines indicate the location of the kymograph and the corresponding intensity profiles illustrate the colocalization of Bodipy-lipids with Cav1-mCh. Intensity profiles are relative to the maximum value for each sample. Scale bars, 10 μm; kymograph scale bars, 5 μm.
-
Figure 4—figure supplement 2—source data 1
Excel file containing source data pertaining to Figure 4—figure supplement 2A–D.
- https://cdn.elifesciences.org/articles/55038/elife-55038-fig4-figsupp2-data1-v2.xlsx
Figure 4—figure supplement 3
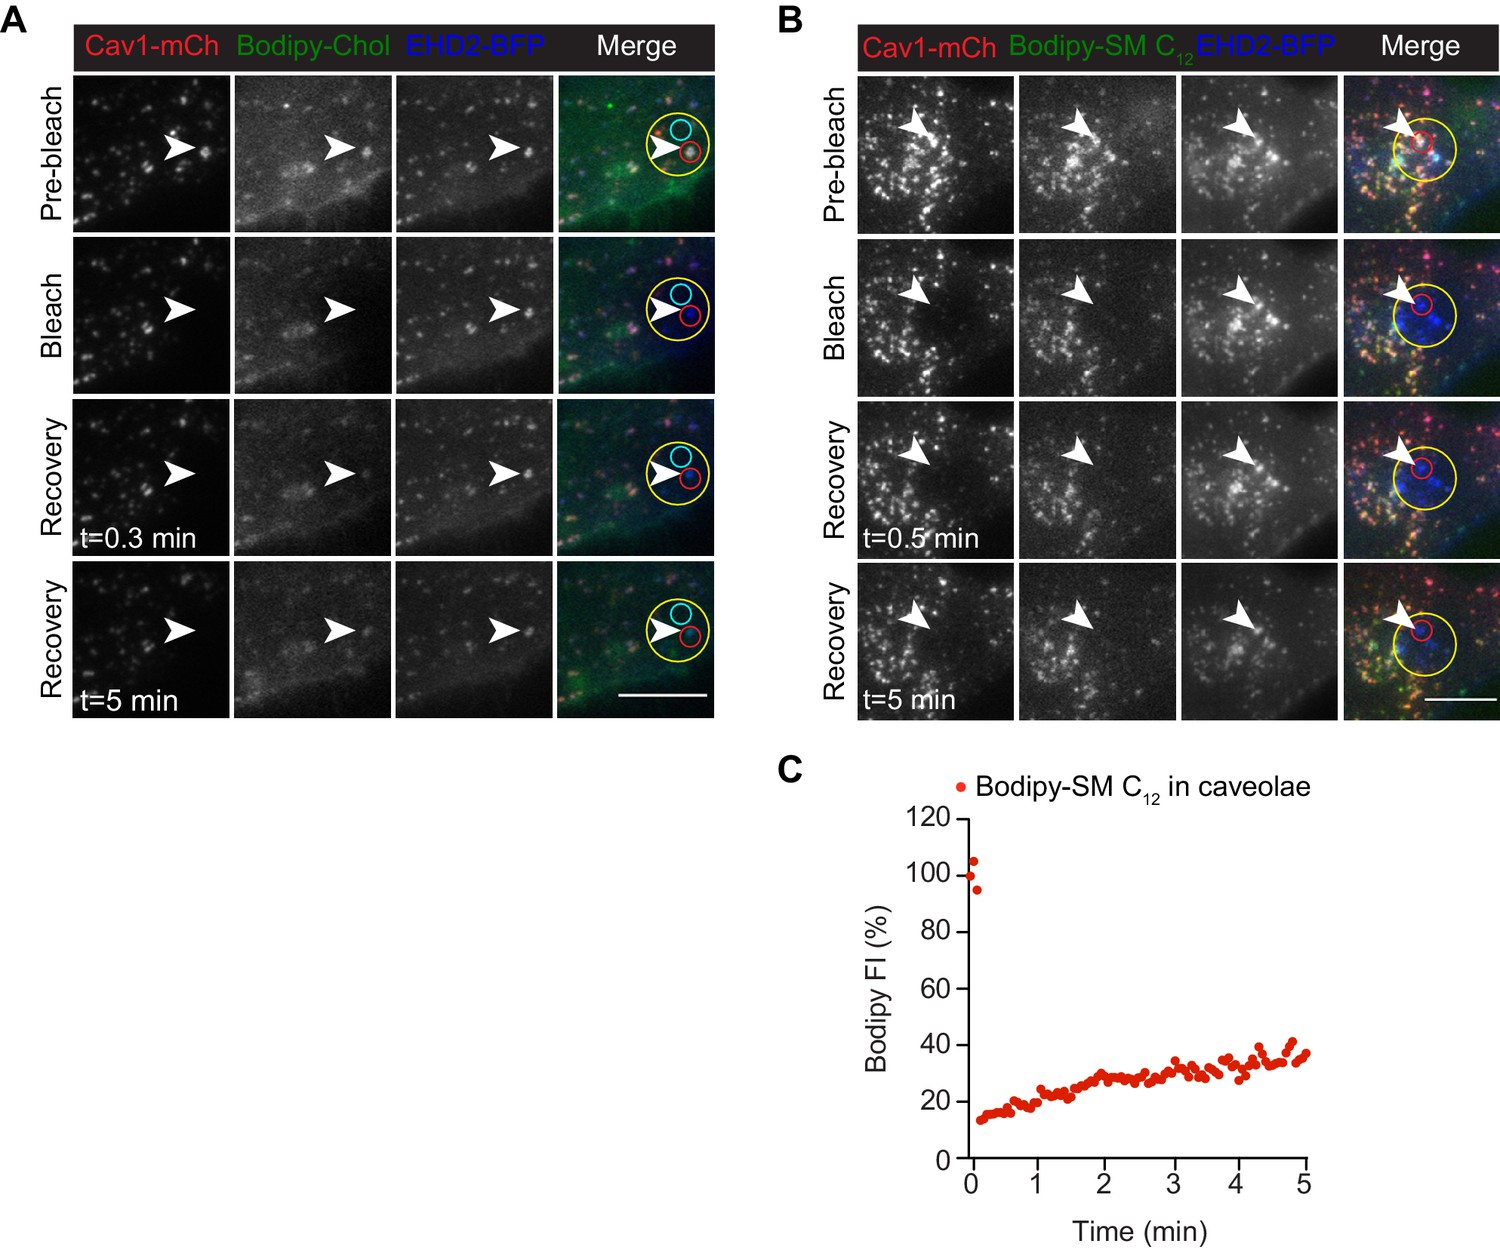
Bodipy-Chol and Bodipy-SM C12 are sequestered within caveolae.
(A, B) Bodipy fluorescence recovery experiments to study the accumulation of lipids in caveolae. Cav1-mCh HeLa cells transiently expressing EHD2-BFP were incubated with liposomes containing either (A) Bodipy-Chol or (B) Bodipy-SM C12 for 10 min. Following photobleaching (yellow ROI), the fluorescence recovery of the Bodipy signal within caveolae (red ROI) and the bulk PM (cyan ROI) was monitored over time. White arrow highlights surface connected caveolae with accumulated Bodipy-lipid. Scale bars, 10 μm. (C) Bodipy signal recovery within caveolae. Cav1-mCh HeLa cells transiently expressing EHD2-BFP were incubated with Bodipy-SM C12 liposomes for 10 min. Representative recovery curve of Bodipy intensities within caveolae ROI is shown following photobleaching. Bodipy FI was normalized to background and reference.
-
Figure 4—figure supplement 3—source data 1
Excel file containing source data pertaining to Figure 4—figure supplement 3C.
- https://cdn.elifesciences.org/articles/55038/elife-55038-fig4-figsupp3-data1-v2.xlsx
Figure 4—video 1
Bodipy-LacCer colocalizes with Cav1-mCh positive structures.
A representative TIRF live cell movie of Dox-induced Cav1-mCh HeLa cells after incubation with liposomes containing Bodipy-LacCer. The image in Fig. 4A is taken from this movie and corresponds to the ROI highlighted by the white square. Movie in real time spans 5 min and was recorded at 3 s intervals. Scale bar, 10 μm.
Figure 4—video 2
Bodipy-Chol colocalizes with Cav1-mCh positive structures.
A representative TIRF live cell movie of Dox-induced Cav1-mCh HeLa cells after incubation with liposomes containing Bodipy-Chol. The image in Fig. S4A is taken from this movie and corresponds to the ROI highlighted by the white square. Movie in real time spans 5 min and was recorded at 3 s intervals. Scale bar, 10 μm.
Figure 4—video 3
Bodipy-LacCer accumulates in caveolae.
A representative TIRF live cell movie of Dox-induced Cav1-mCh HeLa cells transiently expressing EHD2-BFP after incubation with liposomes containing Bodipy-LacCer. The image in Fig. 4B is taken from this movie and corresponds to the ROI highlighted by the white square. Movie in real time spans 5 min and was recorded at 3 s intervals. Scale bar, 10 μm.
Figure 4—video 4
Bodipy-Chol accumulates in caveolae.
A representative TIRF live cell movie of Dox-induced Cav1-mCh HeLa cells transiently expressing EHD2-BFP after incubation with liposomes containing Bodipy-Chol. The image in Fig. S4B is taken from this movie and corresponds to the ROI highlighted by the white square. Movie in real time spans 5 min and was recorded at 3 s intervals. Scale bar, 10 μm.
Figure 5 with 2 supplements
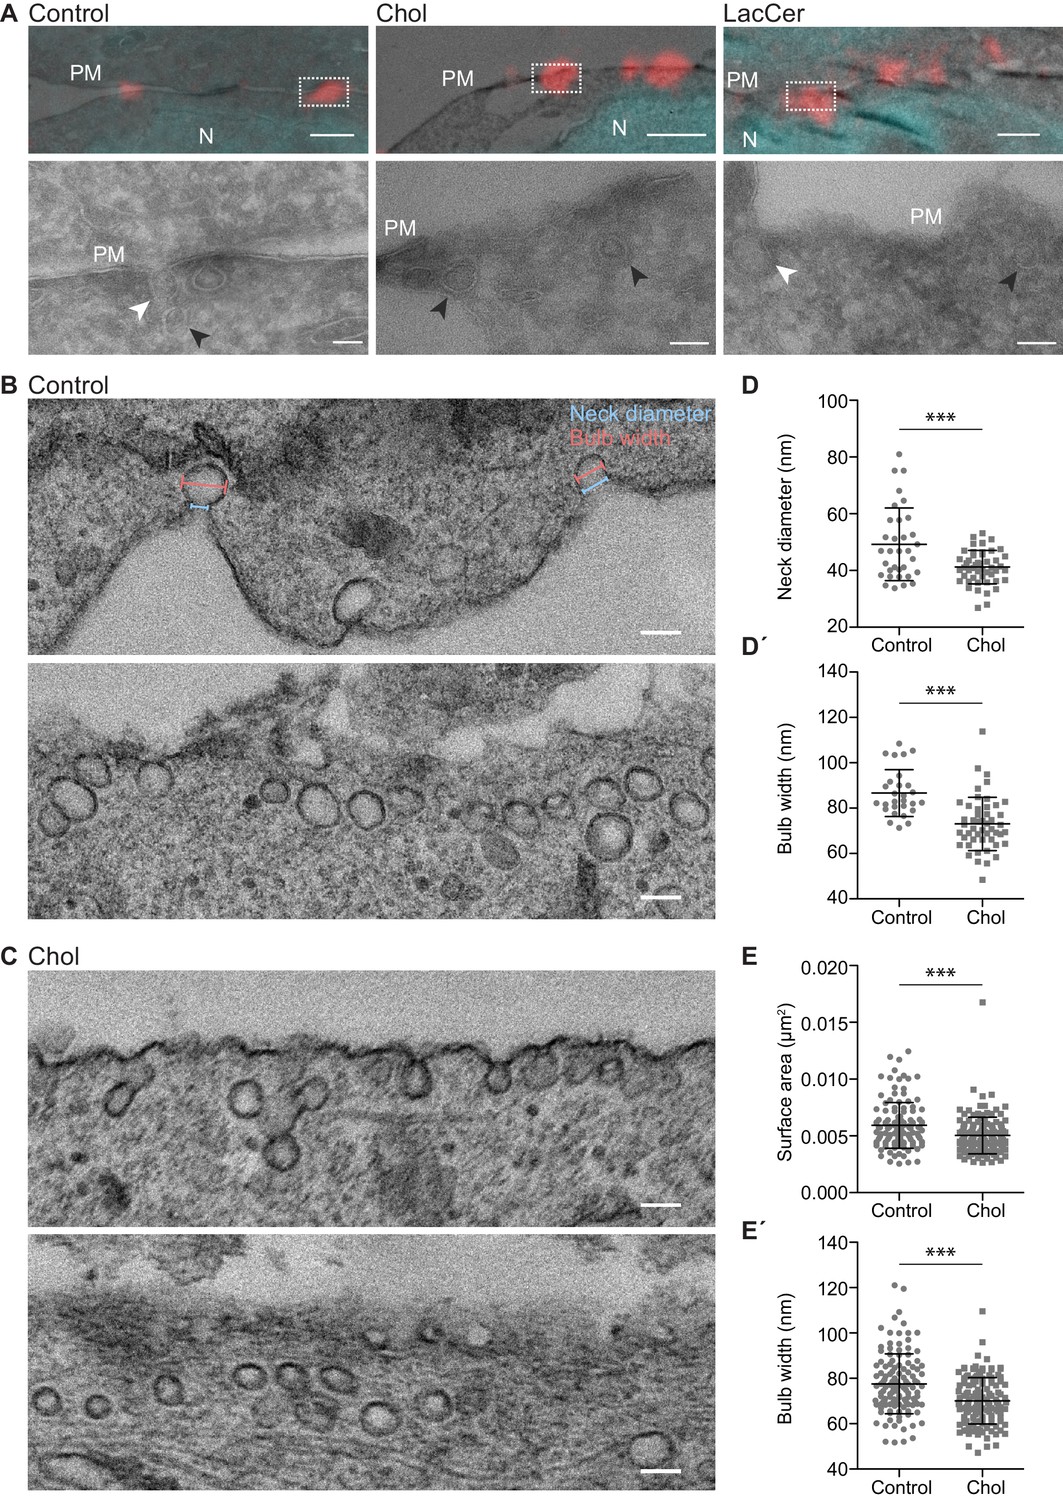
Chol accumulation reduces the caveolae diameter in 3T3 adipocytes.
(A) Representative overlays of light microscopy images with corresponding electron micrographs showing localization of caveolae (Cav1-mCh in red) and nuclei (DAPI in cyan) for untreated Cav1-mCh HeLa cells (control) or cells treated with Bodipy-labeled Chol or LacCer. Dotted boxes show regions of higher magnification in corresponding panels below. N, nucleus; PM, plasma membrane. White arrows denote surface connected caveolae and black arrows indicate surface adjacent caveolae. Scale bars, 1 μm; inset scale bars, 100 nm. (B, C) Electron micrographs of control 3T3-L1 adipocytes (B) and 3T3-L1 adipocytes treated with Bodipy-Chol (C). Top and bottom panels show two representative images per sample: one with clear surface connected necks and one without. Cells were chemically fixed, embedded in resin, and processed for electron microscopy. Scale bars, 100 nm. (D, D’) Scatter plots showing the quantification of neck diameter (D) and bulb width (D’) of surface connected caveolae in 3T3-L1 adipocytes. Bulb width and neck diameter are highlighted in (B), upper panel. n ≥ 30, mean ± SEM. (E, E’) Scatter plots showing the quantification of surface area (E) and bulb width (E’) of surface adjacent caveolae in 3T3-L1 adipocytes. n ≥ 120, mean ± SEM. ***, p≤0.001.
-
Figure 5—source data 1
Excel file containing source data pertaining to Figure 5D and E.
- https://cdn.elifesciences.org/articles/55038/elife-55038-fig5-data1-v2.xlsx
Figure 5—figure supplement 1

Correlative electron microscopy of caveolae.
(A) Cav1-mCh HeLa cells were induced with Dox and transiently expressed EHD2-GFP. Light microscopy image showing localization of caveolae (Cav1-mCh) and nuclei (DAPI) within cells (LM, left panel). Middle panel depicts corresponding EM images. Overlay of LM and EM images shows correlation of fluorescently labeled structures to ultrastructure in same cells (right panel). Scale bar, 2 μm. (B) Representative overlays of light microscopy images with corresponding electron micrographs showing localization of caveolae (Cav1-mCh in red) and nuclei (DAPI in cyan) for Cav1-mCh HeLa cells treated with Bodipy-labeled SM C12. Dotted boxes show regions of higher magnification in corresponding panels below. N, nucleus; PM, plasma membrane. White arrows denote surface connected caveolae and black arrows indicate surface adjacent caveolae. Scale bars, 1 μm; inset scale bars, 100 nm.
Figure 5—figure supplement 2
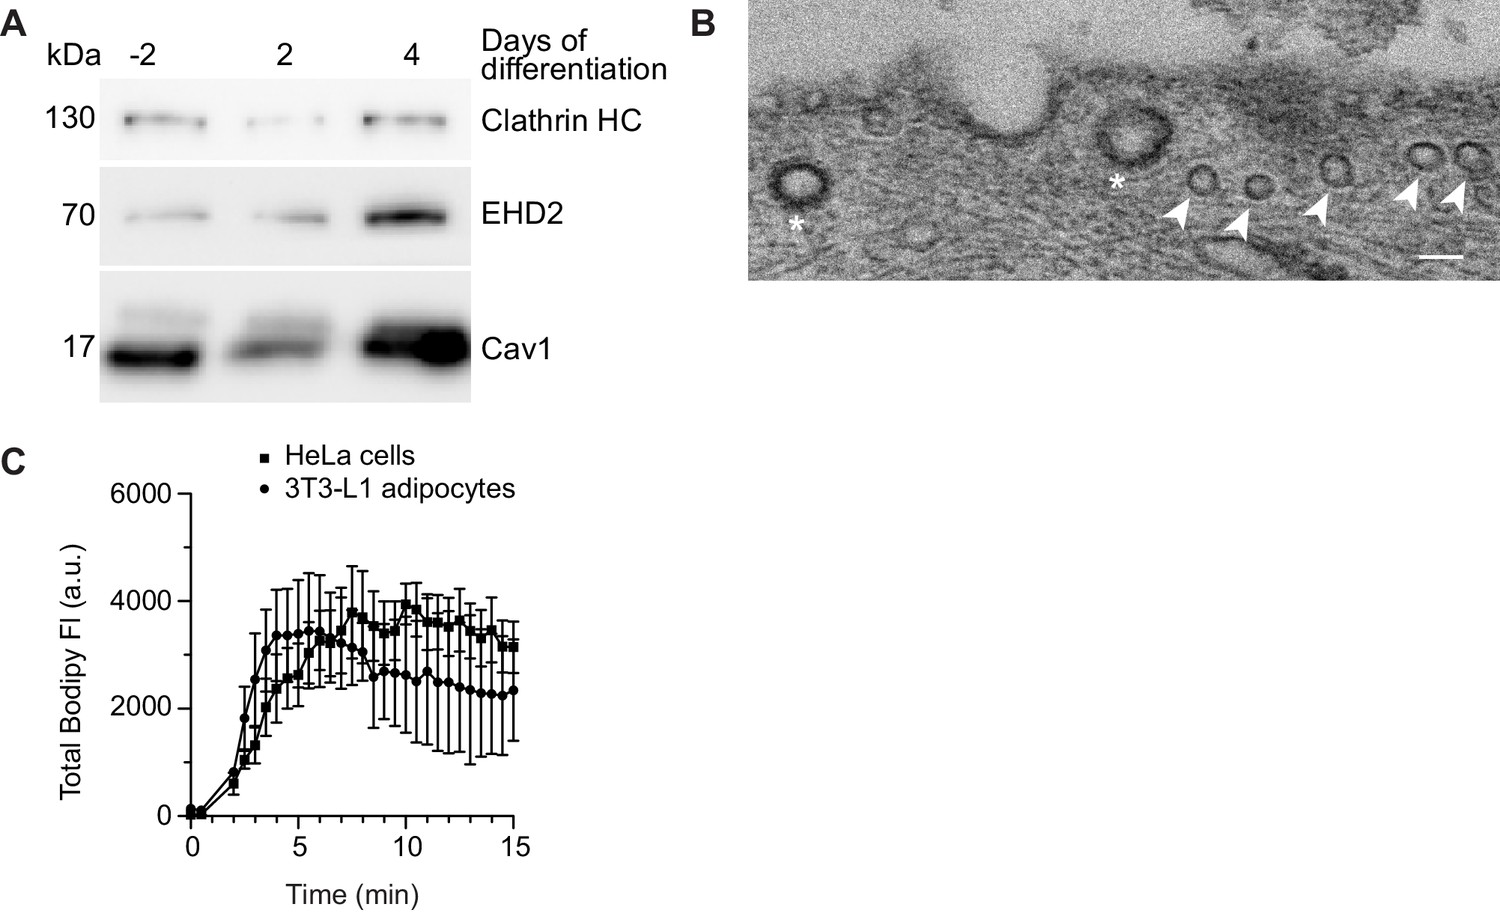
Expression of EHD2 and Cav1 is upregulated in 3T3-L1 adipocytes.
(A) Representative immunoblots showing protein expression of EHD2 and Cav1 during 3T3-L1 differentiation. Clathrin HC served as loading control. (B) Representative electron micrographs of 3T3-L1 adipocytes. Caveolae (indicated by arrow) can be clearly distinguished from clathrin-coated pits (indicated by asterisk). Scale bar, 100 nm. (C) Incorporation rate of Bodipy-Chol into the PM of live 3T3-L1 adipocytes. Cells were treated with fusogenic liposomes (final total lipid concentration 7 nmol/ml). Total fluorescence intensity (FI) of the Bodipy signal was measured within circular ROIs in a confocal section using spinning disk microscopy. Ten ROIs were analyzed using the Zeiss Zen system software. n = 2, mean ± SEM.
-
Figure 5—figure supplement 2—source data 1
Excel file containing source data pertaining to Figure 5—figure supplement 2C.
- https://cdn.elifesciences.org/articles/55038/elife-55038-fig5-figsupp2-data1-v2.xlsx
Figure 6
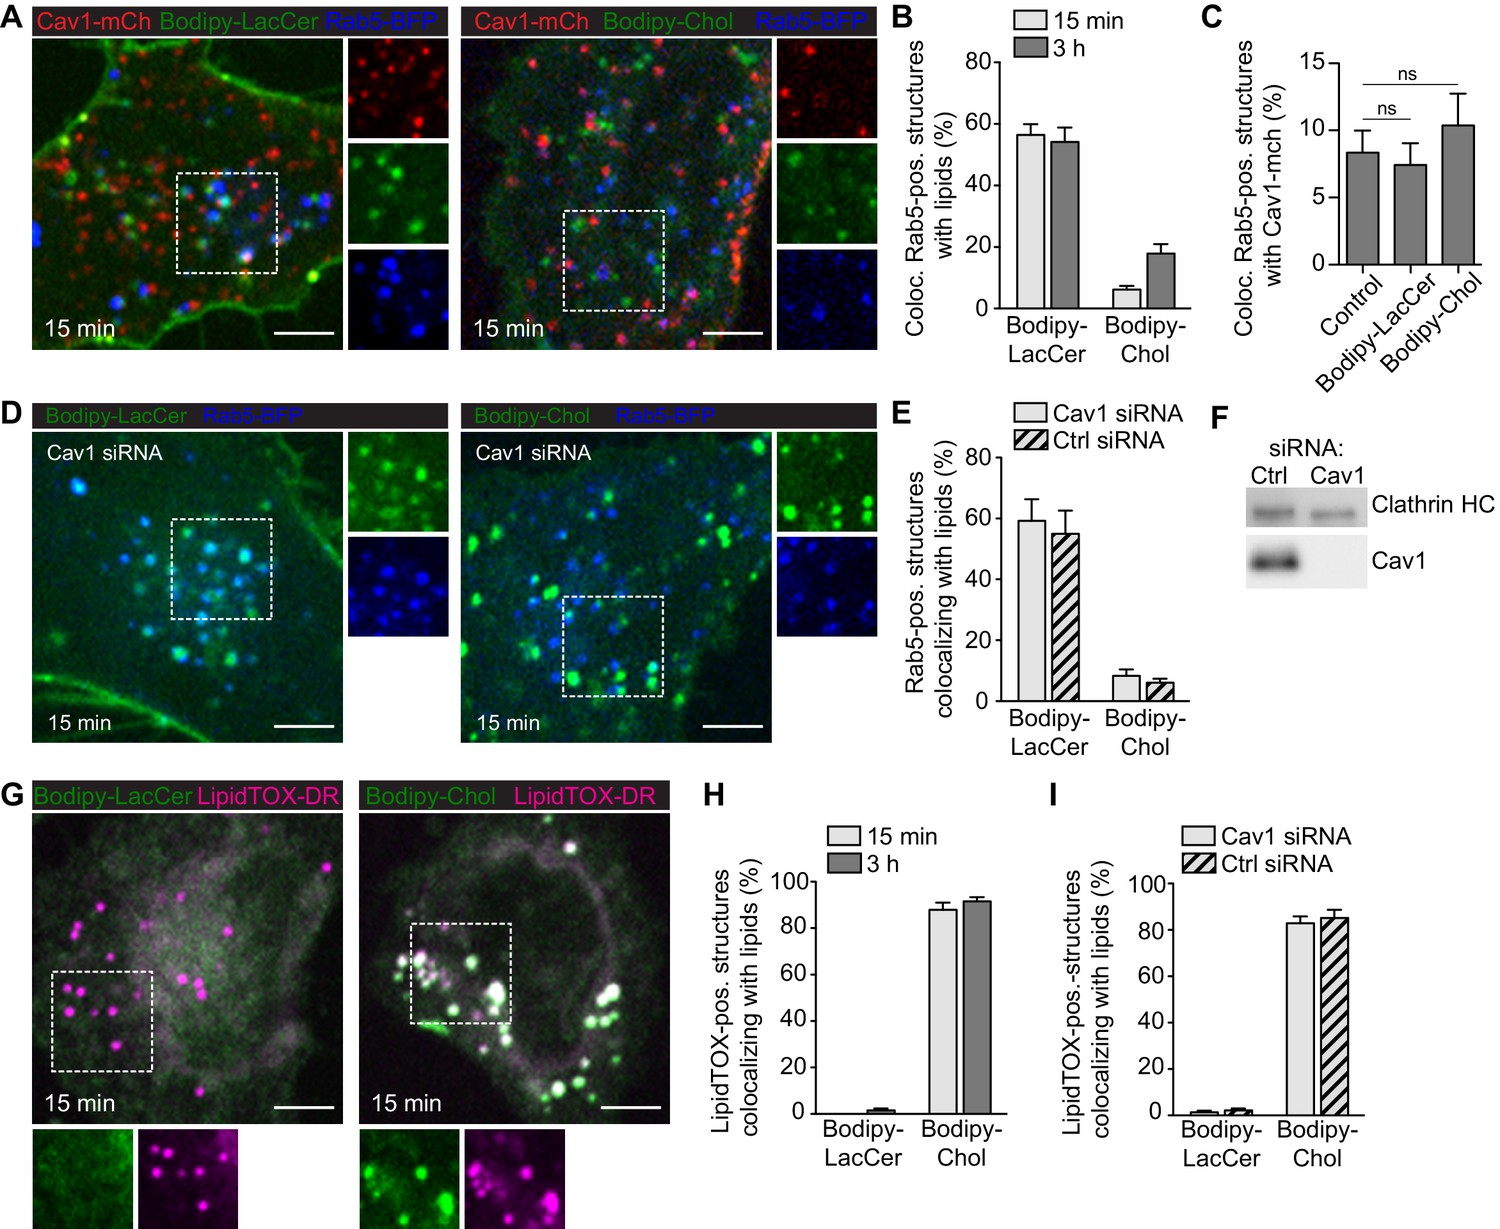
GSLs are internalized to the endosomal system independent of Cav1, while Chol is predominantly trafficked to lipid droplets.
(A) Cav1-mCh HeLa cells expressing Rab5-BFP were incubated with Bodipy-labeled LacCer or Chol for 15 min. Individual channels are shown for selected areas (dotted box). (B) Colocalization of lipids with Rab5-positive structures after indicated time-points. (C) Quantification of Cav1-mCh localization to Rab5-BFP positive structures before (control) and after lipid addition. Statistical analysis: ns - non significant. (D) Cav1 siRNA-treated Cav1-mCh HeLa cells expressing Rab5-BFP after incubation with Bodipy-labeled LacCer or Chol for 15 min. High-magnification images of selected areas (dotted box) for each channel are shown. (E) Quantification of EE positive for lipids in cells treated with siRNA control or against Cav1. Cells were incubated with Bodipy-lipids for 15 min. (F) Representative immunoblots of Cav1-mCh HeLa cells treated with control siRNA or siRNA against Cav1. Clathrin HC served as loading control. (G) Cav1-mCh HeLa cells were incubated with Bodipy-lipids for 15 min, fixed and LDs were stained using LipidTOX-DR. (H) Colocalization of lipids to LDs. (I) Colocalization of lipids with LDs in cells depleted of Cav1 after 15 min. (B, C, E, H, I) n = 10, mean ± SEM. All scale bars, 5 μm.
-
Figure 6—source data 1
Excel file containing source data pertaining to Figure 6B,C,E,H and I.
- https://cdn.elifesciences.org/articles/55038/elife-55038-fig6-data1-v2.xlsx
Tables
Key resources table
| Reagent type (species) or resource | Designation | Source or reference | Identifiers | Additional information |
|---|---|---|---|---|
| Antibody | anti-PTRF (Rabbit polyclonal) | Abcam | Cat # ab48824 RRID:AB_88224 | IF(1:100) |
| Antibody | anti-EHD2 (Rabbit polyclonal) | (Morén et al., 2012) | RRID:AB_2833022 | IF (1:500), WB(1:2000) |
| Antibody | anti-clathrin heavy chain (clone 23; mouse monoclonal) | BD Transduction Laboratories | Cat # 610499 RRID:AB_397865 | WB (1:1000) |
| Antibody | anti-caveolin-1 (Rabbit, polyclonal) | Abcam | Cat # ab2910 RRID:AB_303405 | IF (1:500) WB (1:10 000) |
| Antibody | anti-rabbit IgG secondary antibody coupled to Alexa Fluor 647 (Goat polyclonal) | Thermo Fisher Scientific | Cat # A21246 RRID:AB_2535814 | IF (1:300) |
| Chemical compound, drug | 1,2-dioleoyl-sn -glycero-3-phosphoethanolamine (DOPE) | Avanti Polar Lipids | Cat # 850725 | |
| Chemical compound, drug | 1,2-dioleoyl-3-trimethylammonium-propane (chloride salt) (DOTAP) | Avanti Polar Lipids | Cat # 890890 | |
| Chemical compound, drug | Bodipy FL C5- Ganglioside GM1 | Thermo Fisher Scientific | Cat # B13950 | |
| Chemical compound, drug | Bodipy FL C5-LacCer | This study (Gretskaya and Bezuglov, 2013) | ||
| Chemical compound, drug | Bodipy FL C5-ceramide | Thermo Fisher Scientific | Cat # D3521 | |
| Chemical compound, drug | Bodipy-Cholesterol | Avanti Polar Lipids | Cat # 810255 | |
| Chemical compound, drug | Bodipy FL C12-spinghomyelin | Thermo Fisher Scientific | Cat # D7711 | |
| Chemical compound, drug | Bodipy FL C5-spinghomyelin | Thermo Fisher Scientific | Cat # D3522 | |
| Chemical compound, drug | Bodipy FL succinimidyl ester (EverFluor FL) | Setareh Biotech | Cat # 7150 | |
| Chemical compound, drug | D-lactosyl-ß1–1'-D-erythro-sphingosine | Avanti Polar Lipids | Cat # 860542 | |
| Chemical compound, drug | D-lactosyl-ß−1,1' N-palmitoyl-D-erythro-sphingosine | Avanti Polar Lipids | Cat # 860576 | |
| Chemical compound, drug | Cholesterol | Sigma Aldrich | Cat # C3045 | |
| Chemical compound, drug | N-Palmitoyl-D-sphingomyelin | Sigma Aldrich | Cat# 91553 | |
| Chemical compound, drug | Sphingomyelinase (SMase) (from Bacillus cereus) | Sigma Aldrich | Cat# S7651 | |
| Chemical compound, drug | Myriocin (from Mycelia sterilia) | Sigma Aldrich | Cat# M1177 | |
| Chemical compound, drug | Paraformaldehyde 16% | Electron Microscopy Sciences | Cat # 15710 | |
| Chemical compound, drug | Paraformaldehyde | Thermo Fisher Scientific | Cat # PA0095 | |
| Chemical compound, drug | Glutaraldehyde 25% | Taab Laboratory Equipment Ltd | Cat # G011/2 | |
| Chemical compound, drug | 3-isobutyl-1-methylxanthine (IBMX) | Sigma Aldrich | Cat # I5879 | |
| Chemical compound, drug | Dexamethasone (Dex) | Sigma Aldrich | Cat # D4902 | |
| Chemical compound, drug | Insulin | Sigma Aldrich | Cat # I0516 | |
| Chemical compound, drug | rosiglitazone | Cayman Chemicals | 71740 | |
| Chemical compound, drug | Lipofectamine2000 | Thermo Fisher Scientific | Cat # 11668019 | |
| Chemical compound, drug | N,N-Diisopropylethylamine | Sigma Aldrich | Cat # D125806 | |
| Chemical compound, drug | N,N-Dimethylformamide, anhydrous | Sigma Aldrich | Cat # 227056 | |
| Chemical compound, drug | Chloroform | VWR | Cat # VWRC22711.324 | |
| Chemical compound, drug | Methanol | Thermo Fisher Scientific | Cat # 15394528 | |
| Chemical compound, drug | Doxycycline hyclate | Sigma Aldrich | Cat # D9891 | |
| Chemical compound, drug | Hygromycin B | Thermo Fisher Scientific | Cat # 10687010 | |
| Chemical compound, drug | Blasticidin S HCl | Thermo Fisher Scientific | Cat # R210-01 | |
| Cell line (Homo-sapiens) | HeLa (cervix) | ATCC | Cat # CRM-CCL-2 RRID:CVCL_0030 | |
| Cell line (M. musculus) | 3T3-L1 (Pre-adipocytes) | ATCC | Cat # ATC-CL-173 RRID:CVCL_0123 | |
| Cell line (Homo-sapiens) | HeLa FlpIn T-Rex Caveolin1-mCherry | This study | ||
| Cell line (Homo-sapiens) | HeLa FlpIn T-Rex EHD2pTagBFP-P2A-Caveolin1-mCherry | This study | ||
| Transfected construct (human) | siRNA to EHD2 (Stealth) | Thermo Fisher Scientific | Cat#1299001 Assay ID HSS121265 | |
| Transfected construct (human) | Scrambled 353 siRNA (Stealth) | Thermo Fisher Scientific | Cat# 12935300 | |
| Transfected construct (human) | siRNA to Caveolin1 (Stealth) | Thermo Fisher Scientific | Cat #1299001 Assay ID HSS141467 | |
| Recombinant DNA reagent | Rab5-TagBFP | (Francis et al., 2015) | under control of PCMV IEpromotor in pTagBFP-N vector | |
| Recombinant DNA reagent | EHD2-TagBFP | This study | under control of PCMV IEpromotor in pTagBFP-N vector | |
| Recombinant DNA reagent | EHD2 I157Q-TagBFP | This study | under control of PCMV IEpromotor in pTagBFP-N vector | |
| Recombinant DNA reagent | EHD2-mCherry | (Hoernke et al., 2017) | under control of PCMV IEpromotor in pmCherry-N1 vector | |
| Recombinant DNA reagent | mCherry-EHD2 | This study | under control of PCMV IEpromotor in pmCherry-C1 vector | |
| Recombinant DNA reagent | EHD2 I157Q-mCherry | This study | under control of PCMV IEpromotor in pmCherry-N1 vector | |
| Recombinant DNA reagent | mCherry-EHD2 I157Q | This study | under control of PCMV IEpromotor in pmCherry-C1 vector | |
| Recombinant DNA reagent | pCDNA/FRT/TO caveolin1-mCherry | This study | under control of PCMV IE promotor | |
| Recombinant DNA reagent | pCDNA/FRT/TO EHD2-pTagBFP-P2A-caveolin1-mCherry | This study | under control of PCMV IE promotor | |
| Software, algorithm | ImageJ/Fiji | Fiji (Schindelin et al., 2012) | RRID:SCR_002285 | http://fiji.sc/ |
| Software, algorithm | Imaris x64 9.1.2 | Bitplane | RRID:SCR_007370 | http://www.bitplane.com/imaris |
| Software, algorithm | Prism 5.0 | GraphPad | RRID:SCR_002798 | https://www.graphpad.com/scientific-software/prism/ |
| Software, algorithm | Photoshop CS6 | Adobe | RRID:SCR_014199 | https://www.adobe.com/se/products/photoshop.html |
| Software, algorithm | Illustrator CS6 | Adobe | RRID:SCR_010279 | https://www.adobe.com/se/products/photoshop.html |
| Software, algorithm | Maps 3.3 | FEI | https://www.fei.com/software/maps/ | |
| Software, algorithm | Zen interface 2.3 | Zeiss | RRID:SCR_013672 | https://www.zeiss.com/microscopy/int/products/microscope-software/zen.html |
| Software, algorithm | Nis Elements 4.3 | Nikon | RRID:SCR_014329 | https://www.nikoninstruments.com/en_EU/Products/Software |
| Other | Aluminum backed silica gel plates (median pore size 60 Å, fluorescent indicator 254 nm) | Fisher Scientific | Cat # 10517771 | |
| Other | Chromatography grade silica gel (0.035–0.070 mm, 60 Å) | Acros Organic | Cat # 240360050 | |
| Other | Formvar TEM grids | Taab Laboratory Equipment Ltd | Cat # F005 | |
| Other | CS-25R17 coverlips (TIRF) | Warner Instruments | Cat # 64–0735 | |
| Other | CS-25R15 coverlips | Warner Instruments | Cat # 64–0715 | |
| Other | Precision cover glasses thickness No. 1.5H | Paul Marienfeld GmbH and Co. KG | Cat # 0117520 | |
| Other | PD-10 columns | GE Healthcare | Cat # 17-0851-0 | |
| Other | MatTek dishes (35 mm dish, high tolerance 1.5) | MatTek Corporation | Cat # P35G-0.170–14 C | |
| Other | HCS LipidTOX Deep Red Neutral Lipid Stain | Thermo Fisher Scientific | Cat # H34477 | |
| Other | Dulbecco's Modified Eagle Medium (DMEM) | Thermo Fisher Scientific | Cat # 41966052 | |
| Other | Opti-MEM I Reduced Serum Medium | Thermo Fisher Scientific | Cat # 31985070 | |
| Other | Dulbecco's Modified Eagle Medium (DMEM), no phenol red | Thermo Fisher Scientific | Cat # 21063029 | |
| Other | Sodium pyruvate | Thermo Fisher Scientific | Cat # 11360039 | |
| Other | Dako Fluorescent Medium | Dako | Cat # S3023 | |
| Other | Alexa Fluor 647 C2 Maleimide | Thermo Fisher Scientific | Cat # A20347 | |
| Other | DAPI (4',6-Diamidino-2-Phenylindole, Dilactate) | Thermo Fisher Scientific | Cat # D3571 | |
| Other | Fetal bovine serum | Thermo Fisher Scientific | Cat # 16000044 |
Table 1
Retention times (RT), MRM-transition stages monitored (precursor ion and product ions) and collision energies of analyzed compounds.
| Compounds | MRM transition | RT (min) | Collision energy (V) | |
|---|---|---|---|---|
| Precursor ion | Product ion | |||
| Bodipy-LacCer | 926.5 | 562.4 | 1.48 | 30 |
| LacCer(d18:1/16:0) | 862.6 | 520.5 | 2.84 | 20 |
| LacCer(d18:1/14:0) | 834.6 | 264.3 | 2.8 | 40 |
| SM(d18:1/16:0) | 703.6 | 184.1 | 2.9 | 30 |
| Bodipy-SM C12 | 865.6 | 184.1 | 2.12 | 30 |
Table 2
MRM transitions for labeled and endogenous Chol.
| Compound | Comment | Precursor ion | MS1 resolution | Product ion | MS2 resolution | RT | RT delta min (total) |
|---|---|---|---|---|---|---|---|
| Methyl stearate | IS-std | 298 | Unit | 101.1 | Unit | 5.6 | 2 |
| Chol | Quant | 329 | Unit | 95 | Unit | 7.8 | 2 |
| Chol | Qual | 368 | Unit | 213 | Unit | 7.8 | 2 |
| d7-Chol | Quant | 336 | Unit | 95 | Unit | 7.8 | 2 |
| d7- Chol | Qual | 375 | Unit | 213 | Unit | 7.8 | 2 |
Additional files
Download links
A two-part list of links to download the article, or parts of the article, in various formats.
Downloads (link to download the article as PDF)
Open citations (links to open the citations from this article in various online reference manager services)
Cite this article (links to download the citations from this article in formats compatible with various reference manager tools)
Lipid accumulation controls the balance between surface connection and scission of caveolae
eLife 9:e55038.
https://doi.org/10.7554/eLife.55038


