Zebrafish embryonic explants undergo genetically encoded self-assembly
- IST Austria, Austria
Figures
Figure 1 with 4 supplements
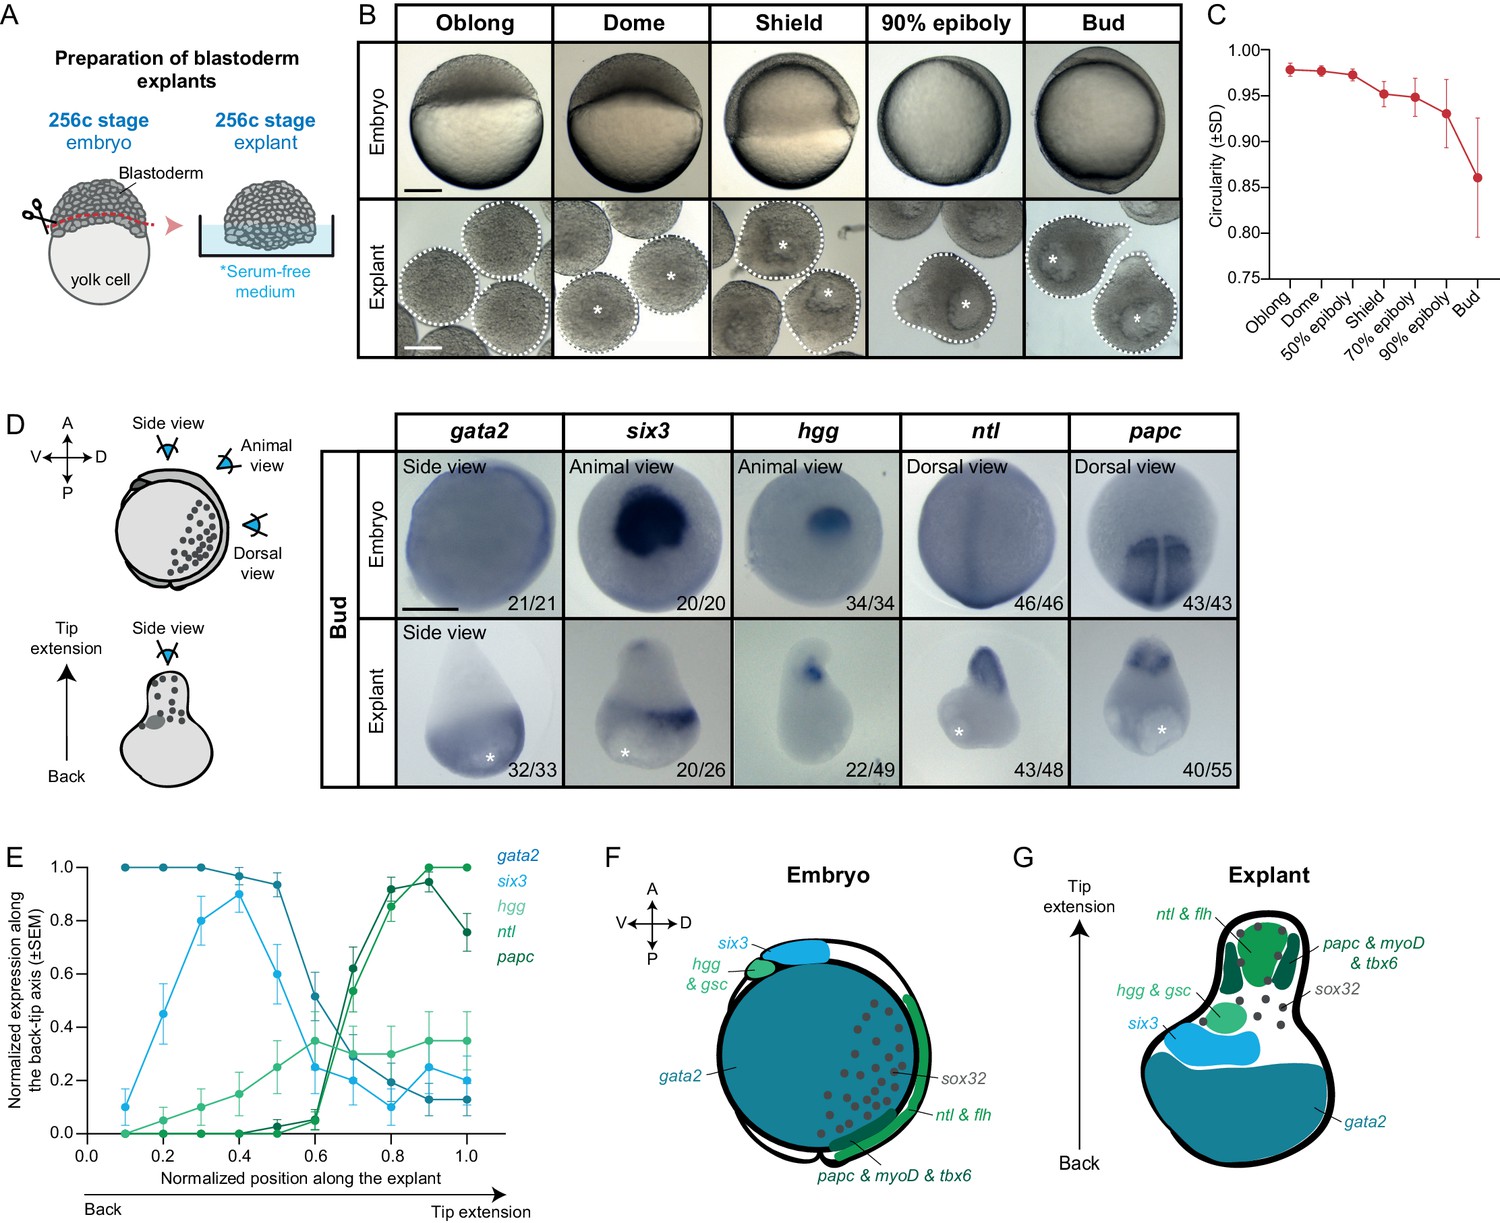
Mesendoderm specification and morphogenesis in the absence of the yolk cell and its associated YSL.
(A) Schematic representation of the preparation method of blastoderm explants from 256 cell stage (256 c) stage embryos. (B) Bright-field single-plane images of stage-matched embryo and blastoderm explants from oblong to bud stage. The white dashed lines outline the shape of the explant. (C) Circularity of blastoderm explants from oblong to bud stage (oblong: n = 42, dome: n = 34, 50% epiboly: n = 35, shield: n = 40, 70% epiboly: n = 35, 90% epiboly: n = 36, bud: n = 38; N = 2). (D) Expression of ectoderm (gata2), neuroectoderm (six3) and mesendoderm (hgg, ntl and papc) marker genes as determined by whole mount in situ hybridization of bud stage embryos and blastoderm explants. Schematic representation of the different views for embryos and blastoderm explants is shown on the left. The proportion of embryos or blastoderm explants with a phenotype similar to the images shown is indicated in the lower right corner (gata2: embryos, n = 21, N = 4, explants, n = 33, N = 6; six3: embryos, n = 20, N = 3, explants, n = 26, N = 4; hgg: embryos, n = 34, N = 5, explants, n = 49, N = 5; ntl: embryos, n = 46, N = 4, explants, n = 48, N = 4; papc: embryos, n = 43, N = 4, explants, n = 55, N = 5). (E) Normalized expression domain of ectoderm (gata2: n = 31, N = 6), neuroectoderm (six3: n = 20, N = 4) and mesendoderm (hgg: n = 20, N = 5; ntl: n = 41, N = 4; papc: n = 37, N = 5) marker genes along the back-tip axis of bud stage blastoderm explants. (F-G) Schematic representation of ectoderm, neuroectoderm, mesendoderm and endoderm marker gene expression domains in intact embryos (F) and blastoderm explants (G). White asterisks denote the main luminal cavity in explants. Scale bars: 200 µm (B, D).
-
Figure 1—source data 1
Mesendoderm specification and morphogenesis in the absence of the yolk cell and its associated YSL.
- https://cdn.elifesciences.org/articles/55190/elife-55190-fig1-data1-v2.xlsx
Figure 1—figure supplement 1
Phenotypic characterization of blastoderm explants.
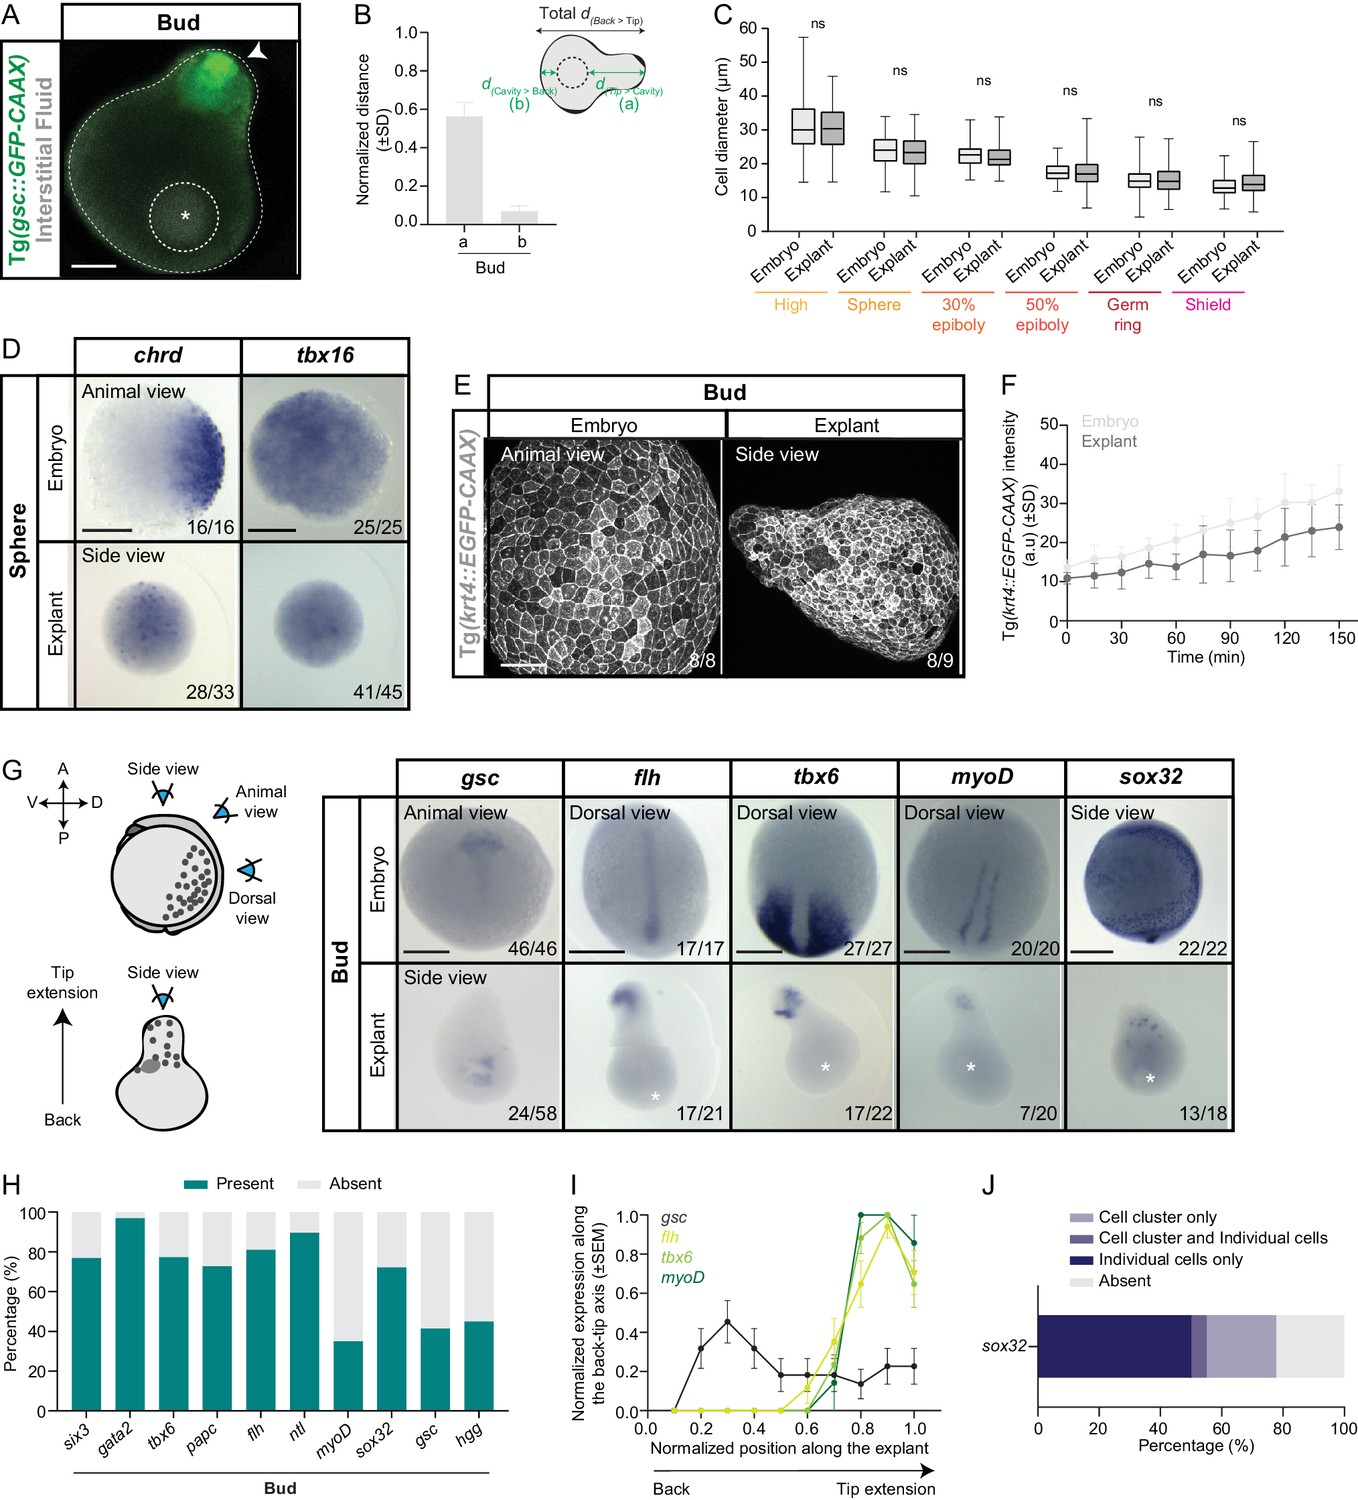
(A) Exemplary high-resolution fluorescence image of a blastoderm explant cross-section at bud stage. Interstitial fluid (grey) is marked by dextran cascade blue and mesendoderm tissue (green) by expression of gsc::GFP-CAAX. (B) Normalized distance of the main luminal cavity from the extension tip (a) or the explant back (b) (n = 90, N = 3). Schematic representation of the quantification method is shown at the top. (C) Cell diameter in stage-matched embryos and blastoderm explants from high to shield stage (high: embryo, number of cells = 270, n = 9, N = 3, explants, number of cells = 270, n = 9, N = 3; sphere: embryo, number of cells = 270, n = 9, N = 3, explants, number of cells = 270, n = 9, N = 3; 30% epiboly: embryo, number of cells = 240, n = 8, N = 3, explant, number of cells = 280, n = 9, N = 3; 50% epiboly: embryo, number of cells = 270, n = 9, N = 3, explant, number of cells = 270, n = 9, N = 3; germ ring: embryo, number of cells = 280, n = 9, N = 3, explant, number of cells = 270, n = 9, N = 3; shield: embryo, number of cells = 180, n = 6, N = 3, explant, number of cells = 240, n = 9, N = 3). ns, not significant (Kruskal-Wallis test). (D) Expression of two ZGA marker genes (chrd and tbx16) in stage-matched embryos (animal view) and blastoderm explants (side view) at sphere stage as determined by whole mount in situ hybridization. The proportion of embryos or blastoderm explants with a phenotype similar to the images shown is indicated in the lower right corner (chrd: embryos, n = 16, N = 3, explants, n = 33, N = 3; tbx16: embryos, n = 25, N = 3, explants, n = 45, N = 3). (E) High-resolution fluorescence images of krt4::EGFP-CAAX-expressing embryos (animal view) and blastoderm explants (side view) at bud stage. The proportion of embryos or blastoderm explants with a phenotype similar to the images shown is indicated in the lower right corner (embryos: n = 8, N = 2; explants: n = 9, N = 2). (F) Intensity of krt4::EGFP-CAAX in stage-matched embryos and blastoderm explants from late sphere stage onwards (embryos: n = 7, N = 3; explants: n = 8, N = 3). Time in min. (G) Expression of additional mesendoderm (gsc, flh, tbx6 and myoD) and endoderm (sox32) marker genes as determined by whole mount in situ hybridization of bud stage embryos and blastoderm explants. Schematic representation of the different views for embryos and blastoderm explants is shown on the left. The proportion of embryos or blastoderm explants with a phenotype similar to the images shown is indicated in the lower right corner (gsc: embryos, n = 46, N = 4, explants, n = 58, N = 6; flh: embryos, n = 17, N = 2, explants, n = 21, N = 2; tbx6: embryos, n = 27, N = 3, explants, n = 22, N = 3; myoD: embryos, n = 20, N = 3, explants, n = 20, N = 3; sox32: embryos, n = 22, N = 3, explants, n = 18, N = 3). (H) Percentage of bud stage blastoderm explants expressing or not neuroectoderm (six3: n = 26, N = 4), ectoderm (gata2: n = 33, N = 6), mesendoderm (hgg: n = 49, N = 5; gsc: n = 58, N = 6; myoD: n = 20, N = 3; ntl: n = 48, N = 4; flh: n = 21, N = 2; papc: n = 55, N = 5; tbx6: n = 22, N = 3) and endoderm (sox32: n = 18, N = 3) marker genes as determined by whole mount in situ hybridization. (I) Normalized expression domain of additional mesendoderm marker genes (gsc: n = 22, N = 6; flh: n = 17, N = 2; tbx6: n = 17, N = 3; myoD: n = 7, N = 3) along the back-tip axis of bud stage blastoderm explants. (J) Percentage of blastoderm explants showing expression of sox32 in a single cell cluster, a cluster and some more individual cells, only individual cells or no expression at bud stage as determined by whole mount in situ hybridization (n = 18, N = 3). White asterisks denote the main luminal cavity in explants. Scale bars: 100 µm (A, E), 200 µm (D, G).
-
Figure 1—figure supplement 1—source data 1
Phenotypic characterization of blastoderm explants.
- https://cdn.elifesciences.org/articles/55190/elife-55190-fig1-figsupp1-data1-v2.xlsx
Figure 1—figure supplement 2
Morphogenesis of blastoderm explants prepared at 64 c, 128 c, 256 c or high stage.
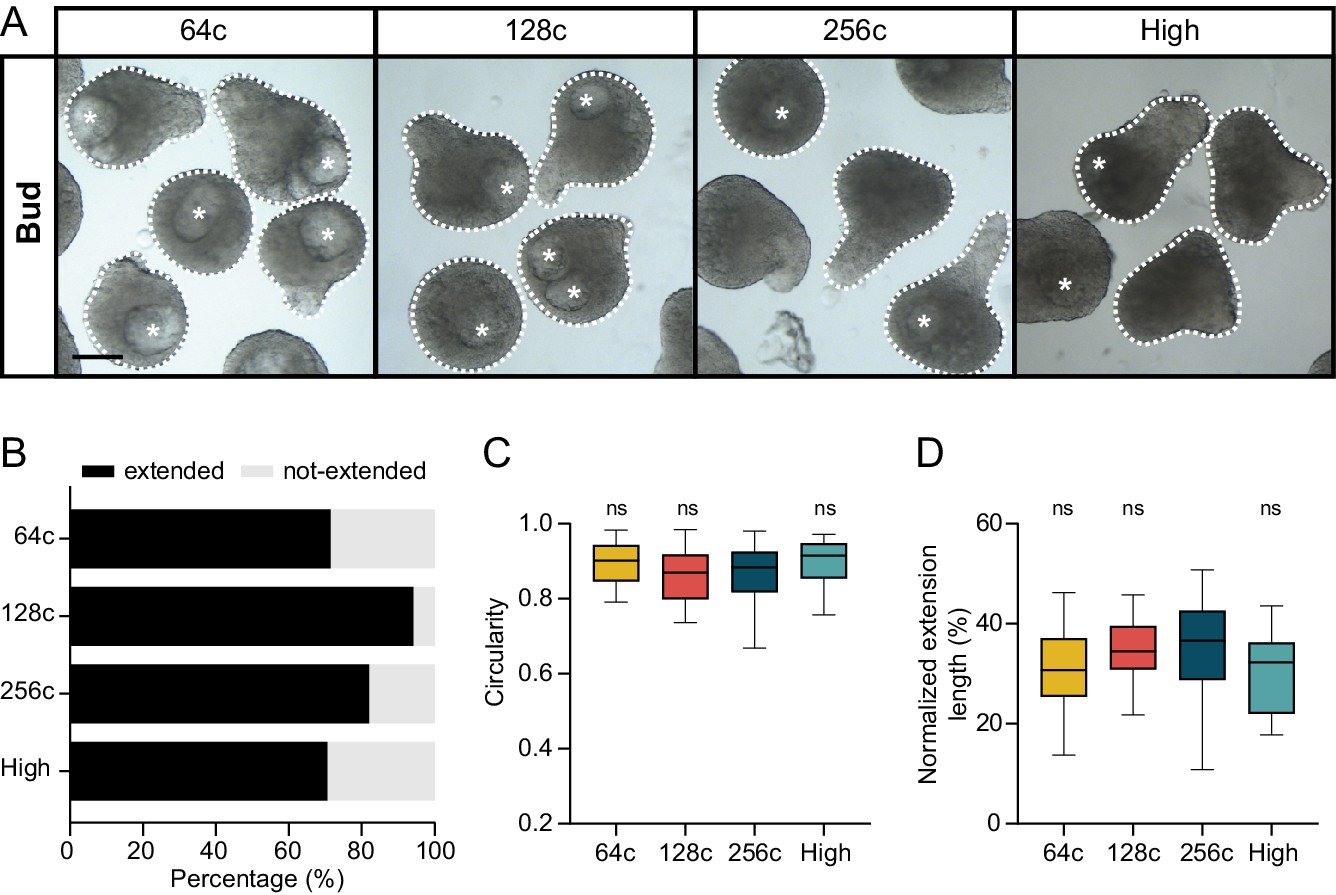
(A) Bright-field single-plane images of bud stage blastoderm explants prepared from 64 c (n = 28, N = 3), 128 c (n = 34, N = 3), 256 c (n = 39, N = 3) or high (n = 17, N = 2) stage embryos. The white dashed lines outline the shape of the explant, while the white asterisks denote the main luminal cavity. Scale bar, 200 µm. (B) Percentage of extended or not-extended bud stage blastoderm explants prepared from 64 c (n = 28, N = 3), 128 c (n = 34, N = 3), 256 c (n = 39, N = 3) or high stage (n = 17, N = 2) embryos. (C) Circularity of bud stage blastoderm explants prepared from 64 c (n = 28, N = 3), 128 c (n = 34, N = 3), 256 c (n = 39, N = 3) or high stage (n = 17, N = 2) embryos. (D) Normalized extension length of extended blastoderm explants, prepared from 64 c (n = 20, N = 3), 128 c (n = 30, N = 3), 256 c (n = 31, N = 3) or high stage (n = 12, N = 2) embryos, at bud stage. (C,D) ns, not significant (ANOVA test).
-
Figure 1—figure supplement 2—source data 1
Morphogenesis of blastoderm explants prepared at 64 c, 128 c, 256 c and high stage.
- https://cdn.elifesciences.org/articles/55190/elife-55190-fig1-figsupp2-data1-v2.xlsx
Figure 1—figure supplement 3
Relative spatial distribution of ectoderm and mesendoderm progenitor cell types in blastoderm explants.
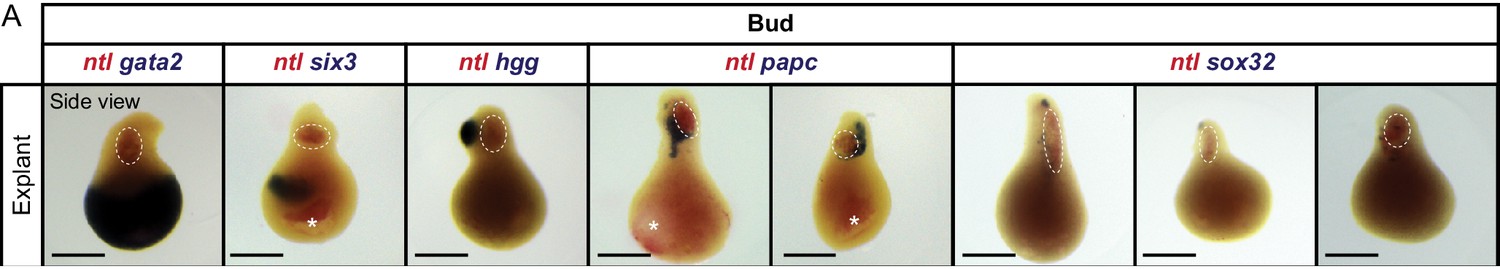
(A) Co-expression of ectoderm (gata2), neuroectoderm (six3), mesendoderm (hgg, papc) and endoderm (sox32) marker genes in blue with ntl, a mesodermal maker exhibiting a similar pattern to the posterior axial mesoderm marker flh in blastoderm explants, in red as determined by double whole mount in situ hybridization of bud stage explants (side view). Both ectoderm (gata2: n = 20, N = 3) and neuroectoderm (six3: n = 24, N = 3) marker genes were expressed predominantly within the round portion of the explant (as shown in the figure). In some cases, six3 expression was also detected in two domains located at the base and at the tip of the extension or, even less frequently, in a single domain at the extension tip (not shown). In contrast to the ectoderm progenitors, mesendoderm marker genes were exclusively found within or adjacent to the extension. Anterior axial mesendoderm (hgg: n = 17, N = 3) was found to localize directly adjacent to the extended region (as schematized in Figure 1G) or at variable positions along the extension (as shown in the figure). Paraxial mesoderm (papc: n = 22, N = 3) was consistently found adjacent to the posterior axial mesoderm (ntl), either exhibiting a single or two flanking domains. Finally, sox32 expression was found both in a compact cell cluster plus some sporadic cells (right), exclusively in a compact cluster (middle) or exclusively in sporadic cells distributed throughout the extension (left) (n = 31, N = 3). Scale bars: 200 µm.
Figure 1—figure supplement 4
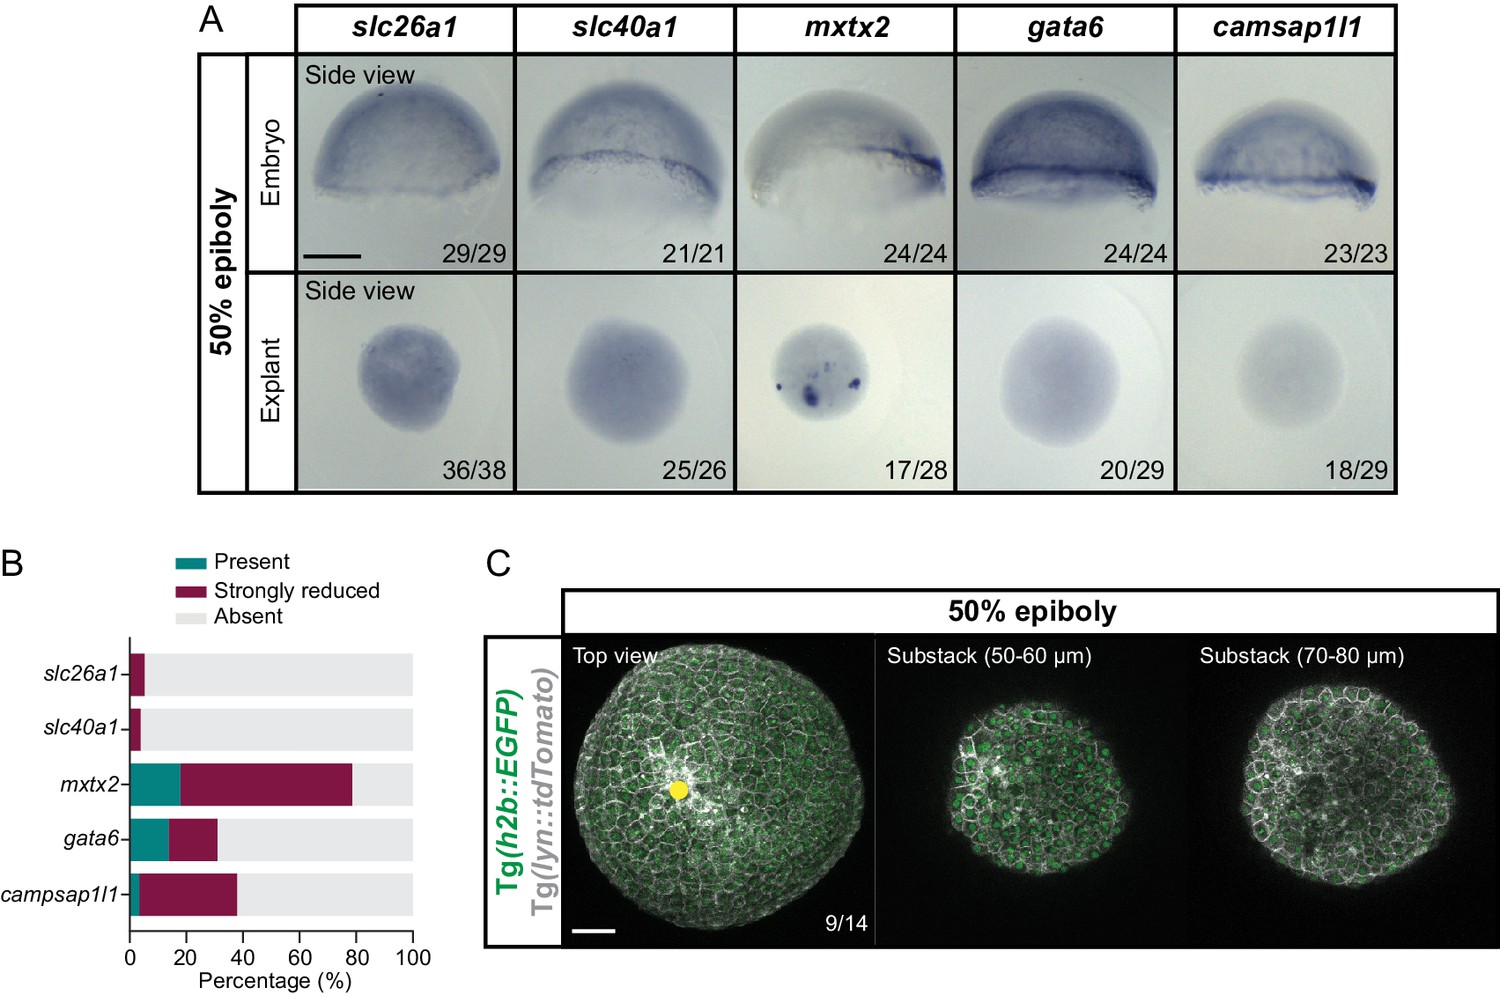
Blastoderm explants exhibit reduced or no YSL features.
(A) Expression of YSL marker genes (slc26a1, slc40a1, mxtx2, gata6 and camsap1l1) in stage-matched embryos (side view) and blastoderm explants (side view), as determined by whole mount in situ hybridization at 50% epiboly. The proportion of embryos or blastoderm explants with a phenotype similar to the images shown is indicated in the lower right corner (slc26a1: embryos, n = 29, N = 3, explants, n = 38, N = 3; slc40a1: embryos, n = 21, N = 3, explants, n = 26, N = 3; mxtx2: embryos, n = 24, N = 4, explants, n = 28, N = 4; gata6: embryos, n = 24, N = 3, explants, n = 29, N = 3; camsap1l1: embryos, n = 23, N = 3, explants, n = 29, N = 3). (B) Percentage of blastoderm explants showing normal, strongly reduced or no expression of YSL marker genes (slc26a1: n = 38, N = 3; slc40a1: n = 26, N = 3; mxtx2: n = 28, N = 4; gata6: n = 29, N = 3; camsap1l1: n = 29, N = 3) as determined by whole mount in situ hybridization at 50% epiboly. (C) High-resolution fluorescence images of a blastoderm explant at 50% epiboly (top views shown at different optical sections). Cell membranes (grey) are marked by lyn::tdTomato and nuclei (green) by h2b::EGFP. The proportion of blastoderm explants with a phenotype similar to the images shown is indicated in the lower right corner (n = 14, N = 3). Yellow circle denotes the wounding site. Scale bars: 200 µm (A), 100 µm (C).
-
Figure 1—figure supplement 4—source data 1
Blastoderm explants exhibit reduced or no expression of YSL markers.
- https://cdn.elifesciences.org/articles/55190/elife-55190-fig1-figsupp4-data1-v2.xlsx
Figure 2 with 3 supplements
Nodal signaling is active in blastoderm explants and is required for tissue extension.
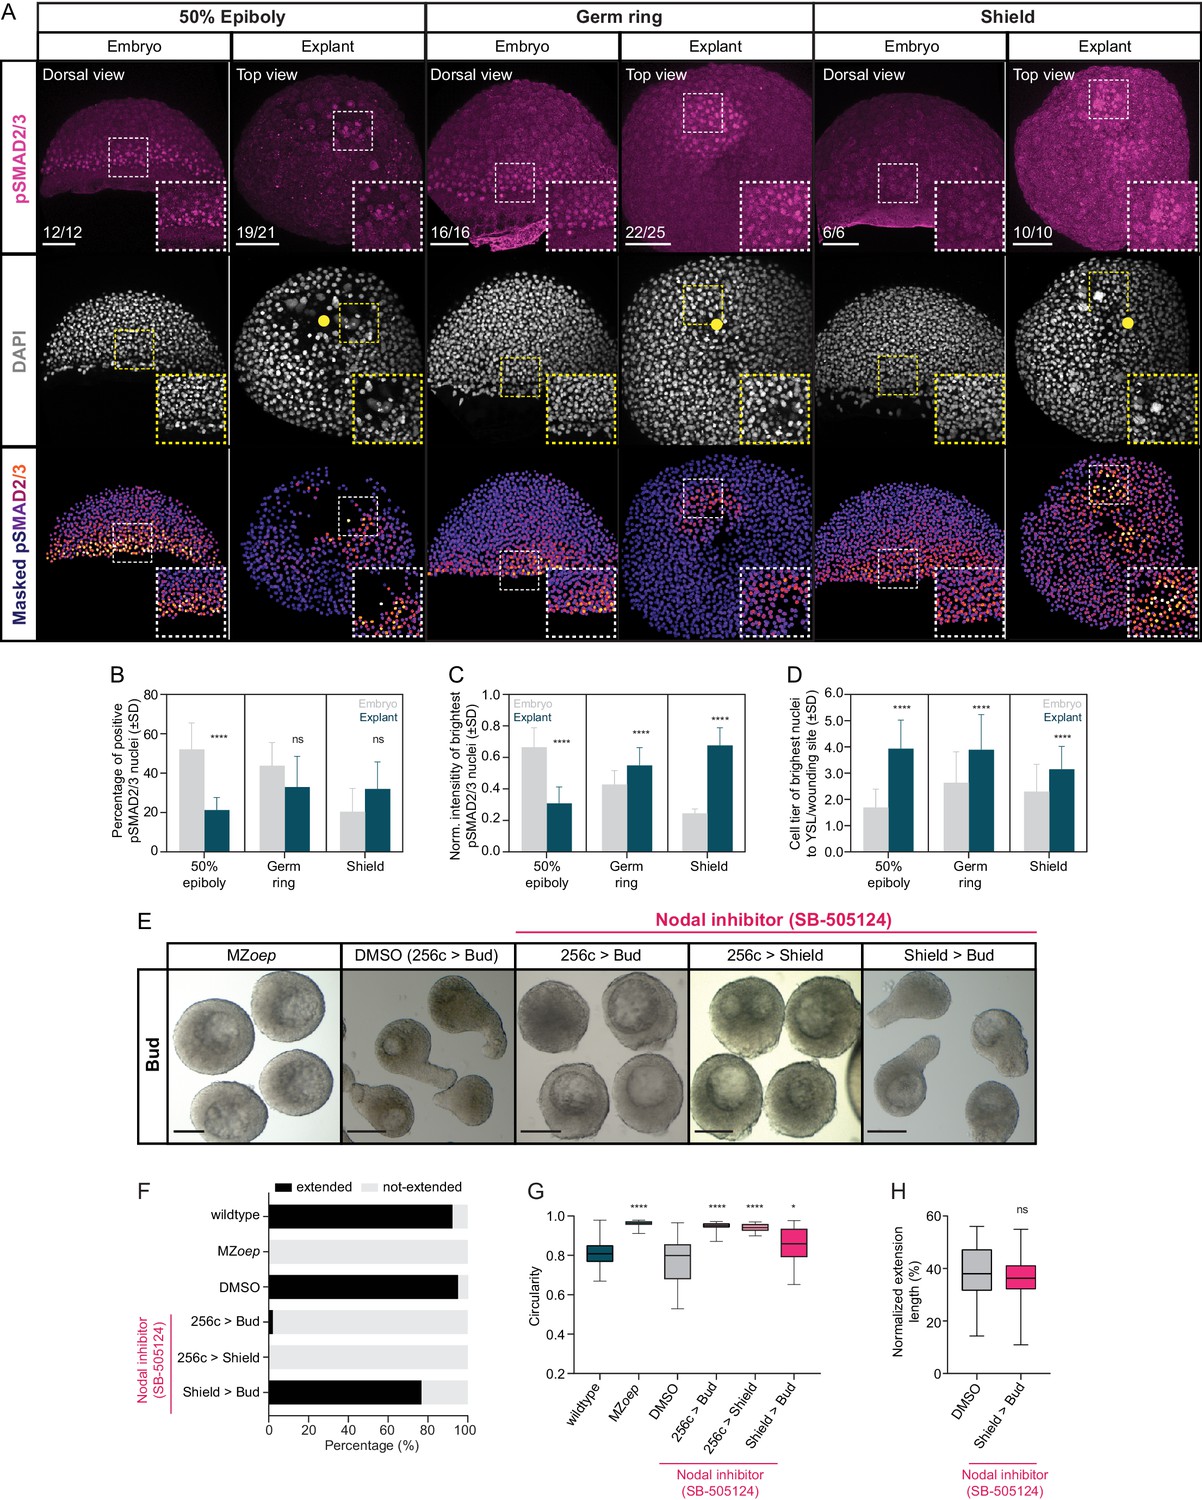
(A) High-resolution fluorescence images of stage-matched embryos (dorsal view) and blastoderm explants (top view) at 50% epiboly, germ ring and shield stage stained for both pSMAD2/3 (pink) and DAPI (grey). Nuclear pSMAD2/3 is color-coded using a fire lookup table (highest intensities in yellow) and was masked based on the DAPI signal. Insets are zoom-in images of the highlighted regions (dashed boxes). Yellow circles denote the wounding site in explants. The proportion of embryos and explants with a phenotype similar to the images shown is indicated in the lower left corner (50% epiboly: embryos, n = 12, N = 4, explants, n = 21, N = 4; germ ring: embryos, n = 16, N = 4, explants, n = 25, N = 4 and shield: embryos, n = 6, N = 3, explants, n = 10, N = 3). (B) Percentage of pSMAD2/3 positive nuclei in stage-matched embryos and blastoderm explants at 50% epiboly (embryos: n = 7, N = 3; explants: n = 10, N = 3), germ ring (embryos: n = 10, N = 4; explants: n = 10, N = 4) and shield stage (embryos: n = 6, N = 3; explants: n = 8, N = 3). ****p<0.0001, ns, not significant (ANOVA test). (C) Normalized intensity of the brightest pSMAD2/3 nuclei (for details see Materials and methods) in stage-matched embryos and blastoderm explants at 50% epiboly (embryos: n = 7, N = 3; explants: n = 10, N = 3), germ ring (embryos: n = 10, N = 4; explants: n = 10, N = 4) and shield stage (embryos: n = 6, N = 3; explants: n = 8, N = 3). ****p<0.0001 (Kruskal-Wallis test). (D) Normalized distance, expressed as cell tiers, of the brightest pSMAD2/3 nuclei (for details see Materials and methods) from the YSL or wounding site in stage-matched embryos and blastoderm explants at 50% epiboly (embryos: n = 7, N = 3; explants: n = 10, N = 3), germ ring (embryos: n = 10, N = 4; explants: n = 10, N = 4) and shield stage (embryos: n = 6, N = 3; explants: n = 8, N = 3). ****p<0.0001 (Kruskal-Wallis test). (E) Bright-field single-plane images of bud stage MZoep (n = 40, N = 3), DMSO (treated from 256 c to bud, n = 81, N = 5) or Nodal inhibitor (SB-505124)-treated blastoderm explants (treated from 256 c to bud, n = 49, N = 4; 256 c to shield, n = 38, N = 3; shield to bud, n = 43, N = 4). (F) Percentage of extended or not-extended wildtype (n = 26, N = 3), MZoep (n = 40, N = 3), DMSO (treated from 256 c to bud, n = 81, N = 5) and Nodal inhibitor (SB-505124)-treated blastoderm explants (treated from 256 c to bud, n = 49, N = 4; 256 c to shield, n = 38, N = 3; shield to bud, n = 43, N = 4) at bud stage. (G) Circularity of bud stage wildtype (n = 26, N = 3), MZoep (n = 40, N = 3), DMSO (treated from 256 c to bud, n = 81, N = 5) and Nodal inhibitor (SB-505124)-treated blastoderm explants (treated from 256 c to bud, n = 49, N = 4; 256 c to shield, n = 38, N = 3; shield to bud, n = 43, N = 4). ****p<0.0001, *p=0.0112 (Kruskal-Wallis test). (H) Normalized extension length of extended DMSO (treated from 256 c to bud, n = 77, N = 5) and Nodal inhibitor (SB-505124)-treated blastoderm explants (treated from shield to bud, n = 33, N = 4) at bud stage. ns, not significant (Unpaired t test). Scale bars: 100 µm (A), 200 µm (E).
-
Figure 2—source data 1
Nodal signaling is active in blastoderm explants and is required for tissue extension.
- https://cdn.elifesciences.org/articles/55190/elife-55190-fig2-data1-v2.xlsx
Figure 2—figure supplement 1

Temporal and spatial dynamics of Nodal signaling in blastoderm explants.
(A) Expression of sqt, as determined by whole mount in situ hybridization in 50% epiboly embryos (side view) and blastoderm explants (side view). (B) Expression of cyc, as determined by whole mount in situ hybridization in shield stage embryos (dorsal view) and blastoderm explants (side view). (A-B) The proportion of embryos or blastoderm explants with a phenotype similar to the images shown is indicated in the lower right corner (sqt: embryos, n = 29, N = 4, explants, n = 44, N = 4; cyc: embryos, n = 27, N = 4, explants, n = 24, N = 4). (C) High-resolution fluorescence images of stage-matched embryos (side view) and blastoderm explants (top view) at high (embryos: n = 13, N = 3; explants: n = 22, N = 3) and sphere (embryos: n = 16, N = 3; explants: n = 29, N = 3) stage stained for both pSMAD2/3 (pink) and DAPI (grey). Nuclear pSMAD2/3 is color-coded using a fire lookup table (highest intensities in yellow) and was masked based on the DAPI signal. Insets are zoom-in images of the highlighted regions (dashed boxes). Yellow circles denote the wounding site in explants. The proportion of embryos and explants with a phenotype similar to the images shown is indicated in the lower left corner. (D) High-resolution fluorescence images of stage-matched embryos and blastoderm explants expressing gsc::GFP-CAAX, at 50% epiboly (embryos: n = 12, N = 4; explants: n = 21, N = 4), germ ring (embryos: n = 16, N = 4; explants: n = 25, N = 4) and shield stage (embryos: n = 6, N = 3; explants: n = 10, N = 3). Embryos are shown from the dorsal side, and explants are shown as top views. Images correspond to the embryos and explants shown in Figure 2A. (E-J) Normalized intensity of pSMAD2/3 positive nuclei as a function of the distance to the YSL (embryos) or the wounding site (explants), expressed as cell tiers, at 50% epiboly (E,H; embryos: n = 7, N = 3; explants: n = 10, N = 3), germ ring (F,I; embryos: n = 10, N = 4; explants: n = 10, N = 4) and shield stage (G,J; embryos: n = 6, N = 3; explants: n = 8, N = 3). Scale bars: 200 µm (A,B), 100 µm (C,D).
-
Figure 2—figure supplement 1—source data 1
Temporal and spatial dynamics of Nodal signaling in the intact embryo and blastoderm explants.
- https://cdn.elifesciences.org/articles/55190/elife-55190-fig2-figsupp1-data1-v2.xlsx
Figure 2—figure supplement 2
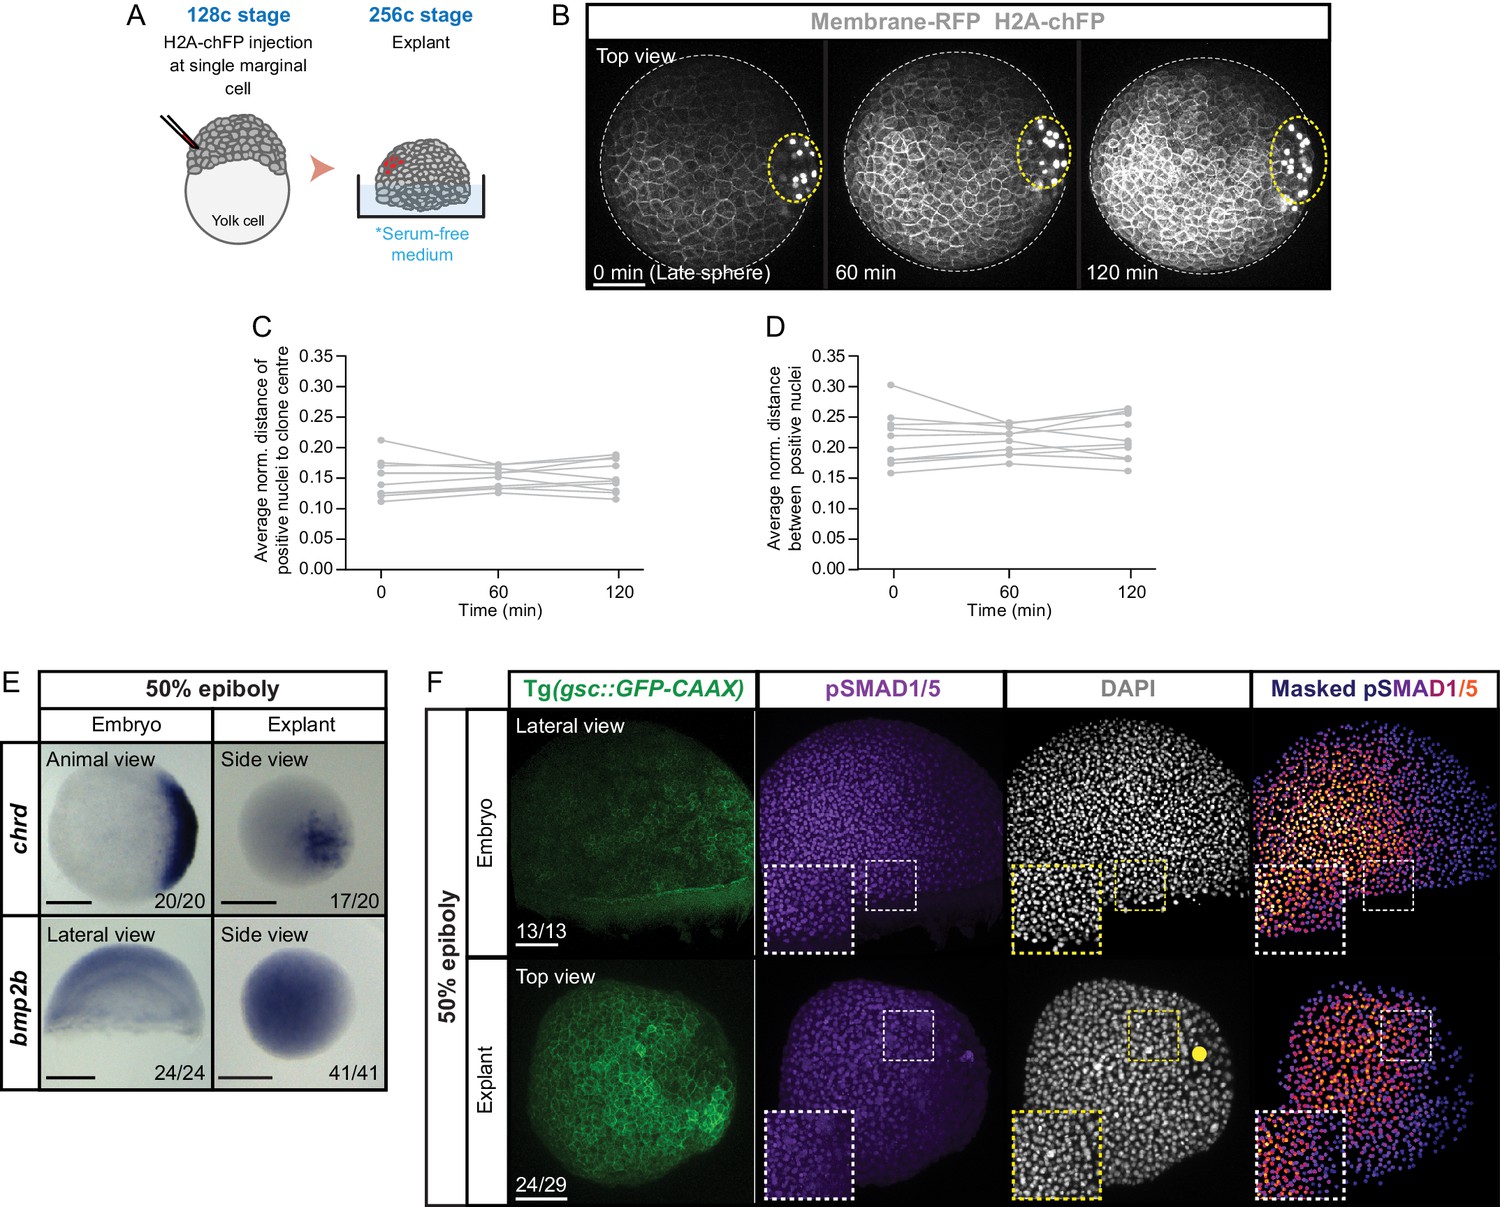
Reduced cell mixing in blastoderm explants close to the wounding site.
(A) Schematic representation of the injection method used to label a single marginal cell in 128 c embryos. (B) High-resolution fluorescence images of a blastoderm explant (top view) from late sphere stage onwards (n = 10, N = 3). Cell membranes (grey) are marked by Membrane-RFP and injected cells (grey) by H2A-chFP expression. Time in min. The explant and clone edges are outlined with a white or yellow dashed line, respectively. (C) Average normalized distance of positive cells (marked by H2A-chFP expression) to the clone center from sphere stage onwards (n = 10, N = 3). (D) Average normalized distance between positive cells (marked by H2A-chFP expression) from sphere stage onwards (n = 10, N = 3). (E) Expression of chrd (embryos, n = 20, N = 3; explants, n = 20, N = 3) and bmp2b (embryos, n = 24, N = 3; explants, n = 41, N = 3) in stage-matched embryos and blastoderm explants at 50% epiboly, as determined by whole mount in situ hybridization. The view shown for both embryos and blastoderm explants is indicated at the top. The proportion of embryos or blastoderm explants with a phenotype similar to the images shown is indicated in the lower right corner. (F) High-resolution fluorescence images of stage-matched embryos (lateral view) and blastoderm explants (top view) expressing gsc::GFP-CAAX stained both for pSMAD1/5 (purple) and DAPI (grey) at 50% epiboly (embryos: n = 13, N = 4; explants: n = 29, N = 4). Nuclear pSMAD1/5 is color-coded using a fire lookup table (highest intensities in yellow) and was masked based on the DAPI signal. Insets are zoom-in images of the highlighted regions (dashed boxes). Yellow circle denotes the wounding site in the explant. Scale bars: 100 µm (B,F), 200 µm (E).
-
Figure 2—figure supplement 2—source data 1
Reduced cell mixing in blastoderm explants close to the wounding site.
- https://cdn.elifesciences.org/articles/55190/elife-55190-fig2-figsupp2-data1-v2.xlsx
Figure 2—figure supplement 3

Nodal signaling is required for mesendoderm specification in blastoderm explants.
(A) High-resolution images of bud stage blastoderm explants treated with DMSO (treated from 256 c to Bud, n = 20, N = 4) or Nodal inhibitor (SB-505124; treated from 256 c to Bud, n = 18, N = 4; 256 c to Shield, n = 20, N = 4 and Shield to Bud, n = 28, N = 3). In all cases, blastoderm explants were prepared from sebox::EGFP-expressing embryos (green) and are shown as side views. The proportion of blastoderm explants with a phenotype similar to the images shown is indicated in the lower right corner. Scale bar: 100 µm. (B) Percentage of DMSO (treated from 256 c to bud: n = 20, N = 4) or Nodal inhibitor (SB-505124)-treated explants (treated from 256 c to bud: n = 18, N = 4; 256 c to shield: n = 20, N = 4; shield to bud: n = 28, N = 3) showing normal, reduced or no sebox::EGFP expression at bud stage (see Materials and methods for additional details). (C) Area of the sebox::EGFP domain in DMSO (treated from 256 c to bud: n = 20, N = 4) or Nodal inhibitor (SB-505124)-treated explants (treated from 256 c to bud: n = 18, N = 4; 256 c to shield: n = 20, N = 4; shield to bud: n = 28, N = 3) at bud stage. ****p<0.0001, ns, not significant (Kruskal-Wallis test). (D) Area of the sebox::EGFP domain versus the normalized extension length in DMSO (treated from 256 c to bud: n = 20, N = 4) or Nodal inhibitor (SB-505124)-treated explants (treated from 256 c to bud: n = 18, N = 4; 256 c to shield: n = 20, N = 4; shield to bud: n = 28, N = 3) at bud stage.
-
Figure 2—figure supplement 3—source data 1
Nodal signaling is required for mesendoderm specification in blastoderm explants.
- https://cdn.elifesciences.org/articles/55190/elife-55190-fig2-figsupp3-data1-v2.xlsx
Figure 3 with 1 supplement
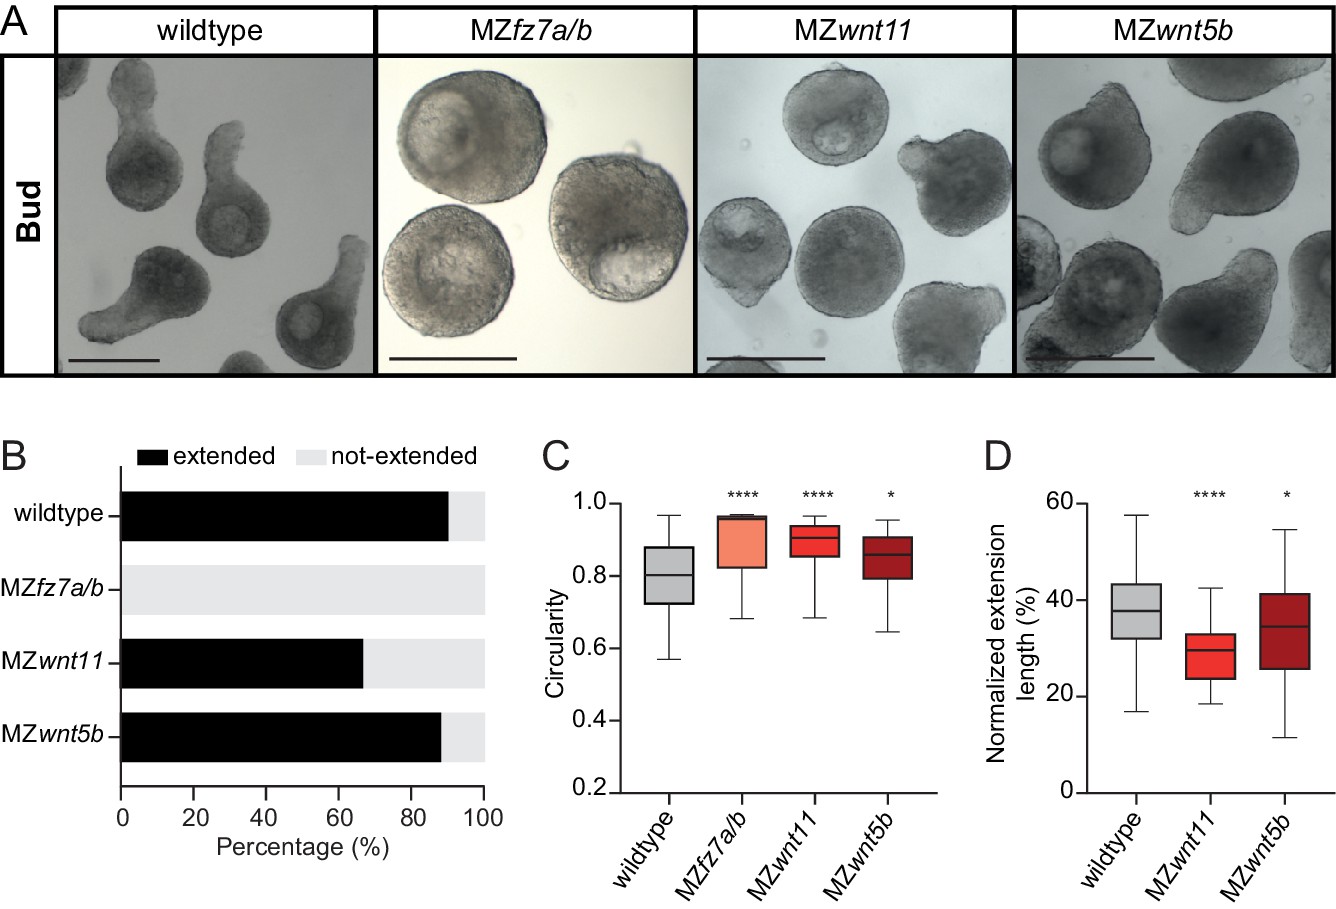
Non-canonical Wnt/PCP signaling is required for blastoderm explant morphogenesis.
(A) Bright-field single-plane images of wildtype (n = 120, N = 8), MZfz7a/b (n = 31, N = 3), MZwnt11 (n = 69, N = 5) and MZwnt5b (n = 75, N = 4) blastoderm explants at bud stage. Scale bars: 200 µm. (B) Percentage of extended or not-extended wildtype (n = 120, N = 8), MZfz7a/b (n = 31, N = 3), MZwnt11 (n = 69, N = 5) and MZwnt5b (n = 75, N = 4) blastoderm explants at bud stage. (C) Circularity of wildtype (n = 120, N = 8), MZfz7a/b (n = 31, N = 3), MZwnt11 (n = 69, N = 5) and MZwnt5b (n = 75, N = 4) blastoderm explants at bud stage. ****p<0.0001, *p=0.0424 (Kruskal-Wallis test). (D) Normalized extension length of extended wildtype (n = 108, N = 8), MZwnt11 (n = 46, N = 5) and MZwnt5b (n = 66, N = 4) blastoderm explants at bud stage. ****p<0.0001, *p=0.0461 (ANOVA test).
-
Figure 3—source data 1
Non-canonical Wnt/PCP signaling is required for blastoderm explant morphogenesis.
- https://cdn.elifesciences.org/articles/55190/elife-55190-fig3-data1-v2.xlsx
Figure 3—figure supplement 1
Cell proliferation is dispensable during blastoderm explant extension.
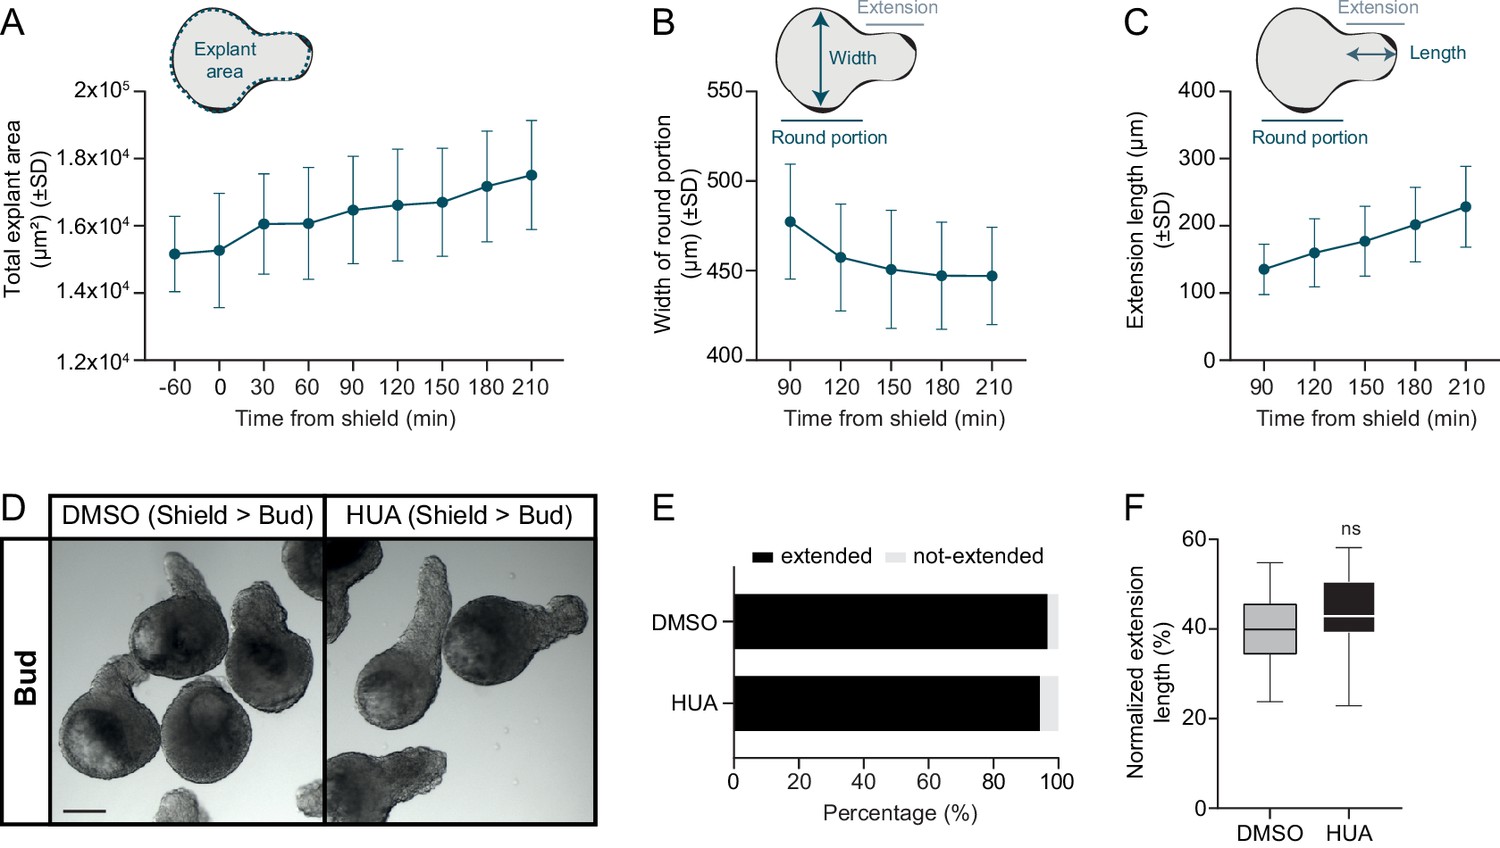
(A) Total blastoderm explant area prior and from shield stage onwards (−60 min: n = 24, N = 3; 0 min: n = 23, N = 3; 30 min: n = 23, N = 3; 60 min: n = 22, N = 3; 90 min: n = 21, N = 3; 120 min: n = 22, N = 3; 150 min: n = 23, N = 3; 180 min: n = 22, N = 3; 210 min: n = 23, N = 3). (B) Width of the round portion of blastoderm explants from shield stage onwards (90 min: n = 20, N = 3; 120 min: n = 22, N = 3; 150 min: n = 23, N = 3; 180 min: n = 22, N = 3; 210 min: n = 23, N = 3). (C) Length of the explant extension from shield stage onwards (90 min: n = 20, N = 3; 120 min: n = 22, N = 3; 150 min: n = 23, N = 3; 180 min: n = 22, N = 3; 210 min: n = 23, N = 3). Time in min. Schematic representation of the quantification method is shown at the top (A-C). (D) Bright-field single-plane images DMSO or HUA-treated blastoderm explants (treated from shield to bud stage; DMSO: n = 29, N = 3; HUA: n = 35, N = 3) at bud stage. Scale bar: 200 µm. (E) Percentage of extended or not-extended DMSO or HUA-treated blastoderm explants (treated from shield to bud stage; DMSO: n = 28, N = 3; HUA: n = 34, N = 3) at bud stage. (F) Normalized extension length of extended DMSO or HUA-treated blastoderm explants (treated from shield to bud stage; DMSO: n = 28, N = 3; HUA: n = 32, N = 3) at bud stage. ns, not significant (Unpaired t test).
-
Figure 3—figure supplement 1—source data 1
Cell proliferation is dispensable during blastoderm explant extension.
- https://cdn.elifesciences.org/articles/55190/elife-55190-fig3-figsupp1-data1-v2.xlsx
Figure 4 with 3 supplements
Maternal pre-patterning is required for Nodal signaling in blastoderm explants.
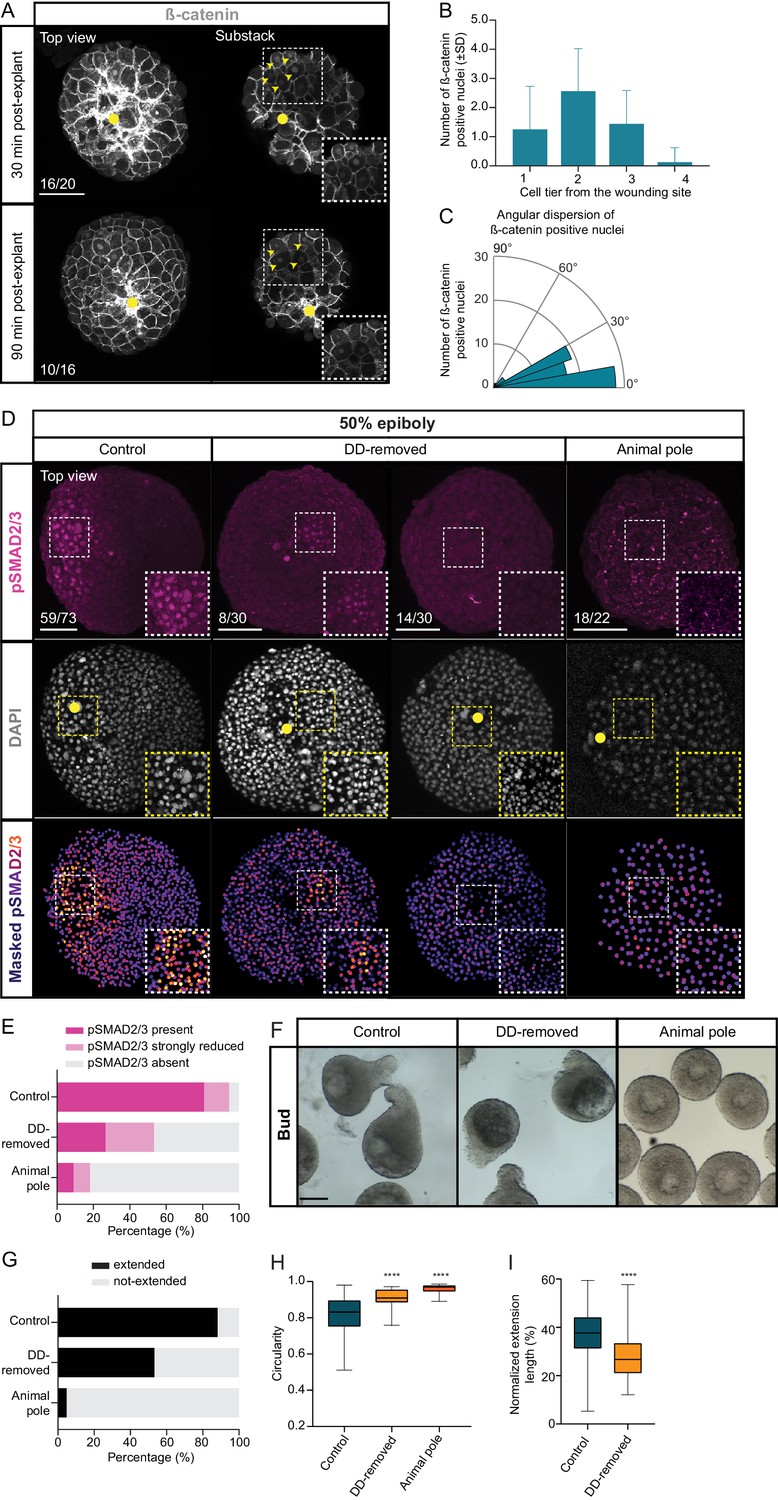
(A) High-resolution fluorescence images of blastoderm explants 30 and 90 min post-explanting stained for both β-catenin (grey) and DAPI (not shown). Both full projection and substack top views are shown to facilitate simultaneous visualization of the wounding site (yellow circle) and nuclear accumulation of β-catenin (yellow arrowheads). Insets are zoom-in images of the highlighted regions (dashed boxes). The proportion of blastoderm explants with a phenotype similar to the images shown is indicated in the lower left corner (30 min: n = 20, N = 6; 90 min: n = 16, N = 4). (B) Number of β-catenin positive nuclei 30 min post-explant preparation as a function of the distance to the wounding site, expressed as cell tiers (n = 16, N = 6). (C) Angular dispersion of β-catenin positive nuclei 30 min post-explant preparation (for details see Materials and methods; n = 16, N = 6). (D) High-resolution fluorescence images of control, dorsal determinants-removed (DD-removed) and animal pole explants at 50% epiboly stained for both pSMAD2/3 (pink) and DAPI (grey). Nuclear pSMAD2/3 is color-coded using a fire lookup table (highest intensities in yellow) and was masked based on the DAPI signal. Insets are zoom-in images of the highlighted regions (dashed boxes) and the yellow circles denote the wounding site. The proportion of blastoderm explants with a phenotype similar to the images shown is indicated in the lower left corner (control: n = 73, N = 14; DD-removed: n = 30, N = 7; animal pole: n = 22, N = 6). (E) Percentage of control (n = 73, N = 14), DD-removed (n = 30, N = 7) and animal pole (n = 22, N = 6) explants showing a domain of pSMAD2/3 positive nuclei (present), a few sporadic pSMAD2/3 positive nuclei (strongly reduced) or no positive nuclei (absent) at 50% epiboly (see Materials and methods for additional details). (F) Bright-field single-plane images of control (n = 228, N = 15), DD-removed (n = 75, N = 8) and animal pole (n = 42, N = 5) explants at bud stage. Control explants partially correspond to explants shown in Figure 1—figure supplement 2A–D. (G) Percentage of extended or not-extended control (n = 228, N = 15), DD-removed (n = 75, N = 8) and animal pole (n = 42, N = 5) explants at bud stage. (H) Circularity of control (n = 228, N = 15), DD-removed (n = 75, N = 8) and animal pole (n = 42, N = 5) explants at bud stage. ****p<0.0001 (Kruskal-Wallis test). (I) Normalized extension length of extended control (n = 199, N = 15) and DD-removed (n = 40, N = 8) blastoderm explants at bud stage. ****p<0.0001 (Unpaired t test). Scale bars: 100 µm (A,D), 200 µm (F).
-
Figure 4—source data 1
Maternal pre-patterning is required for Nodal signaling in blastoderm explants.
- https://cdn.elifesciences.org/articles/55190/elife-55190-fig4-data1-v2.xlsx
Figure 4—figure supplement 1
Maternal pre-patterning is required for β-catenin nuclear localization.
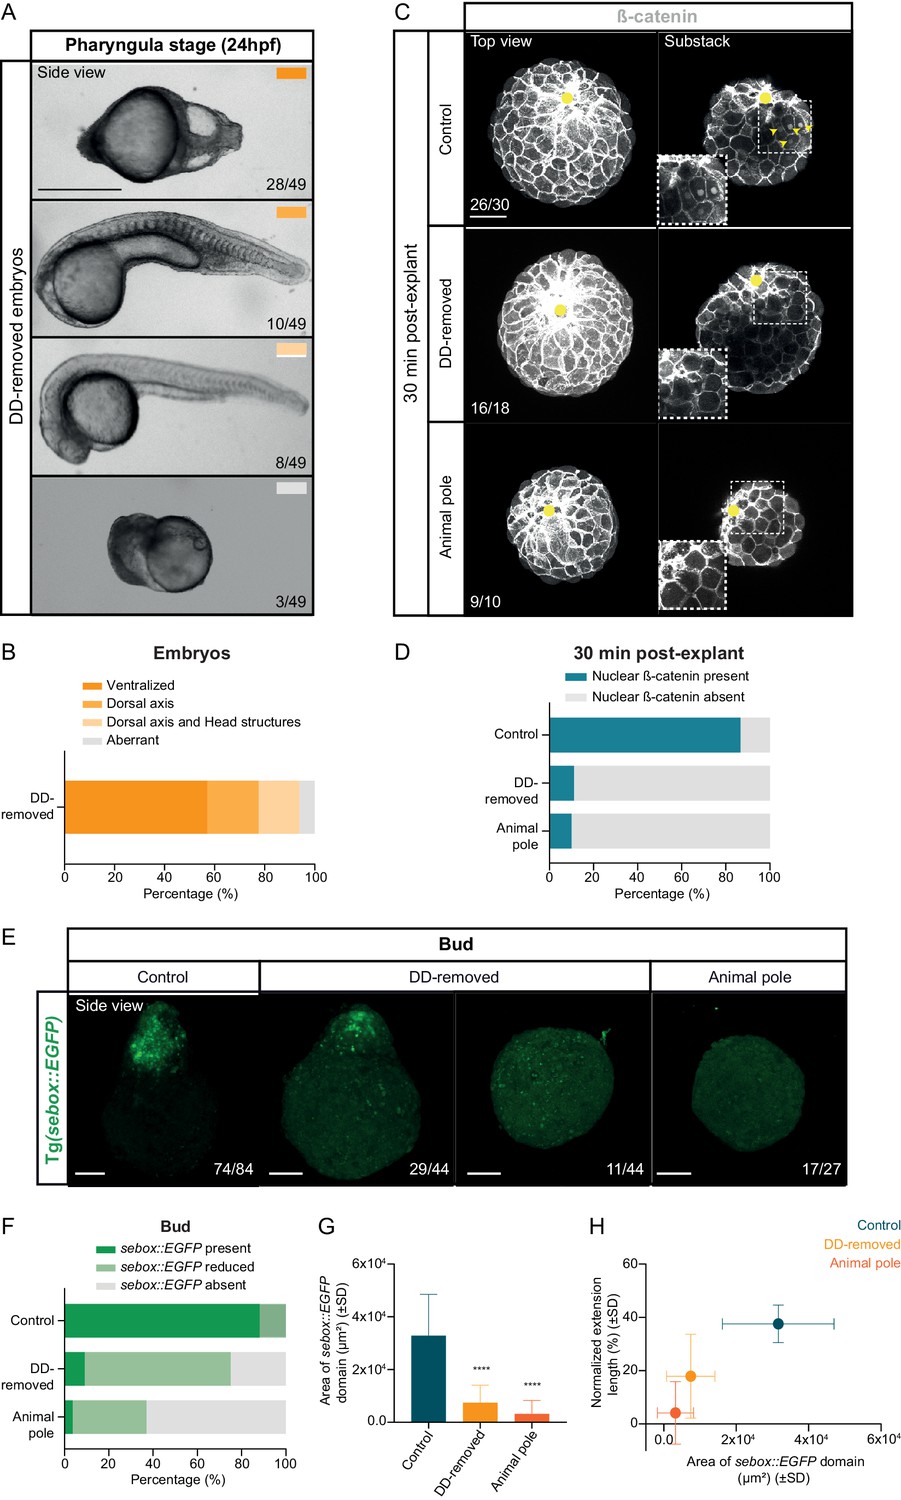
(A) Bright-field single-plane images of dorsal determinants removed (DD-removed) embryos at pharyngula stage (24 hpf). The proportion of embryos with a phenotype similar to the images shown is indicated in the lower right corner (n = 49, N = 4). The color-coded rectangles refer to the different phenotypic classes shown in (B). (B) Percentage of pharyngula stage DD-removed embryos displaying either a fully ventralized phenotype, some residual dorsal structures, both dorsal and head structures or various abnormalities (n = 49, N = 4). (C) High-resolution fluorescence images of control, DD-removed and animal pole explants 30 min after explant preparation stained for both β-catenin (grey) and DAPI (not shown). Both full projection and substack top views are shown to facilitate simultaneous visualization of the wounding site (yellow circle) and nuclear accumulation of β-catenin (yellow arrowheads). Insets are zoom-in images of the highlighted regions (dashed boxes). The proportion of blastoderm explants with a phenotype similar to the images shown is indicated in the lower left corner (control: n = 30, N = 6; DD-removed: n = 18, N = 4; animal pole: n = 10, N = 2). (D) Percentage of control (n = 30, N = 6), DD-removed (n = 18, N = 4) and animal pole (n = 10, N = 2) explants showing nuclear β-catenin staining 30 min after explant preparation. (E) High-resolution images of control (n = 84, N = 8), DD-removed (n = 44, N = 5) and animal pole (n = 27, N = 5) blastoderm explants at bud stage. In all cases, blastoderm explants were prepared from sebox::EGFP-expressing embryos (green) and are shown as side views. The proportion of blastoderm explants with a phenotype similar to the images shown is indicated in the lower right corner. (F) Percentage of control (n = 84, N = 8), DD-removed (n = 44, N = 5) and animal pole (n = 27, N = 5) blastoderm explants showing normal, reduced or no sebox::EGFP expression at bud stage (see Materials and methods for additional details). (G) Area of the sebox::EGFP domain in control (n = 84, N = 8), DD-removed (n = 44, N = 5) and animal pole (n = 27, N = 5) blastoderm explants at bud stage. ****p<0.0001 (Kruskal-Wallis test). (H) Area of the sebox::EGFP domain versus the normalized extension length in control (n = 77, N = 8), DD-removed (n = 44, N = 5) and animal pole (n = 27, N = 5) blastoderm explants at bud stage. Scale bars: 500 µm (A), 100 µm (C, E).
-
Figure 4—figure supplement 1—source data 1
Maternal pre-patterning is required for β-catenin nuclear localization.
- https://cdn.elifesciences.org/articles/55190/elife-55190-fig4-figsupp1-data1-v2.xlsx
Figure 4—figure supplement 2
Loss of dorsal determinants is not sufficient to abolish Nodal signaling within the intact embryo.
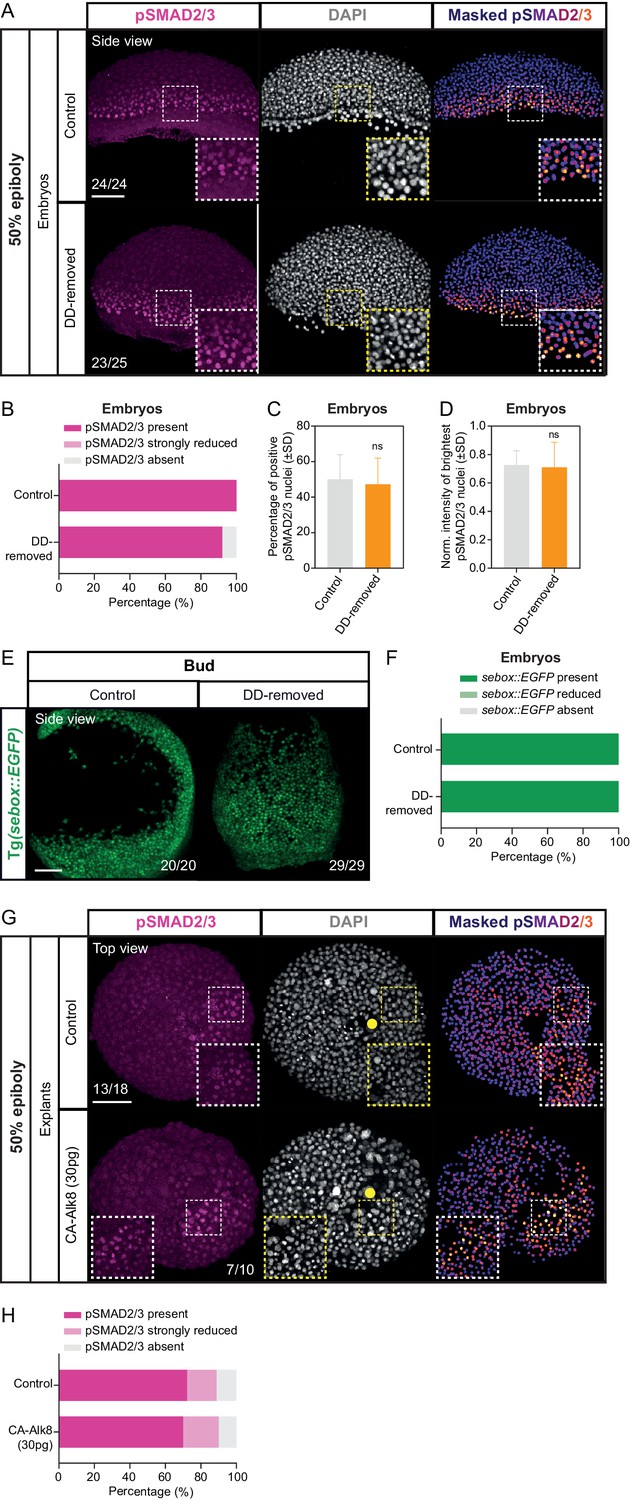
(A) High-resolution fluorescence images of 50% epiboly control and dorsal determinants removed (DD-removed) embryos stained both for pSMAD2/3 (pink) and DAPI (grey). Nuclear pSMAD2/3 is color-coded using a fire lookup table (highest intensities in yellow) and was masked based on the DAPI signal. Insets are zoom-in images of the highlighted regions (dashed boxes). The proportion of embryos with a phenotype similar to the images shown is indicated in the lower left corner (control: n = 24, N = 8; DD-removed: n = 25, N = 7). (B) Percentage of control (n = 24, N = 8) and DD-removed (n = 25, N = 7) embryos showing a domain of pSMAD2/3 positive nuclei (present), a few sporadic pSMAD2/3 positive nuclei (strongly reduced) or no positive nuclei (negative) at 50% epiboly (see Materials and methods for additional details). (C) Percentage of pSMAD2/3 positive nuclei in control (n = 10, N = 3) and DD-removed (n = 9, N = 3) embryos at 50% epiboly. ns, not significant (Unpaired t test). (D) Normalized intensity of the brightest pSMAD2/3 nuclei (for details see Materials and methods) in control (n = 10, N = 3) and DD-removed (n = 9, N = 3) embryos at 50% epiboly. ns, not significant (Mann-Whitney test). (E) High-resolution images of sebox::EGFP-expressing control (n = 20, N = 2) and DD-removed (n = 29, N = 2) embryos at bud stage. The embryos are shown as side views and the proportion of embryos expressing sebox::EGFP shown is indicated in the lower right corner. (F) Percentage of control (n = 20, N = 2) and DD-removed (n = 29, N = 2) embryos showing normal, reduced or no sebox::EGFP expression at bud stage (see Materials and methods for additional details). (G) High-resolution fluorescence images of 50% epiboly control (n = 18, N = 4) and CA-Alk8 (30 pg; n = 10, N = 4) overexpressing blastoderm explants stained for both pSMAD2/3 (pink) and DAPI (grey). Nuclear pSMAD2/3 is shown in a fire lookup table and was masked based on the DAPI signal. Insets are zoom-in images of the highlighted regions (dashed boxes). Yellow circles denote the wounding site. The proportion of blastoderm explants with a phenotype similar to the images shown is indicated in the lower left or right corner. (H) Percentage of control (n = 18, N = 4) and CA-Alk8-overexpressing (30 pg; n = 10, N = 4) blastoderm explants showing a domain of pSMAD2/3 positive nuclei (present), a few sporadic pSMAD2/3 positive nuclei (strongly reduced) or no positive nuclei (negative) at 50% epiboly (see Materials and methods for additional details). Scale bars: 100 µm (A,E,G).
-
Figure 4—figure supplement 2—source data 1
Loss of dorsal determinants is not sufficient to abolish Nodal signaling in the intact embryo.
- https://cdn.elifesciences.org/articles/55190/elife-55190-fig4-figsupp2-data1-v2.xlsx
Figure 4—figure supplement 3
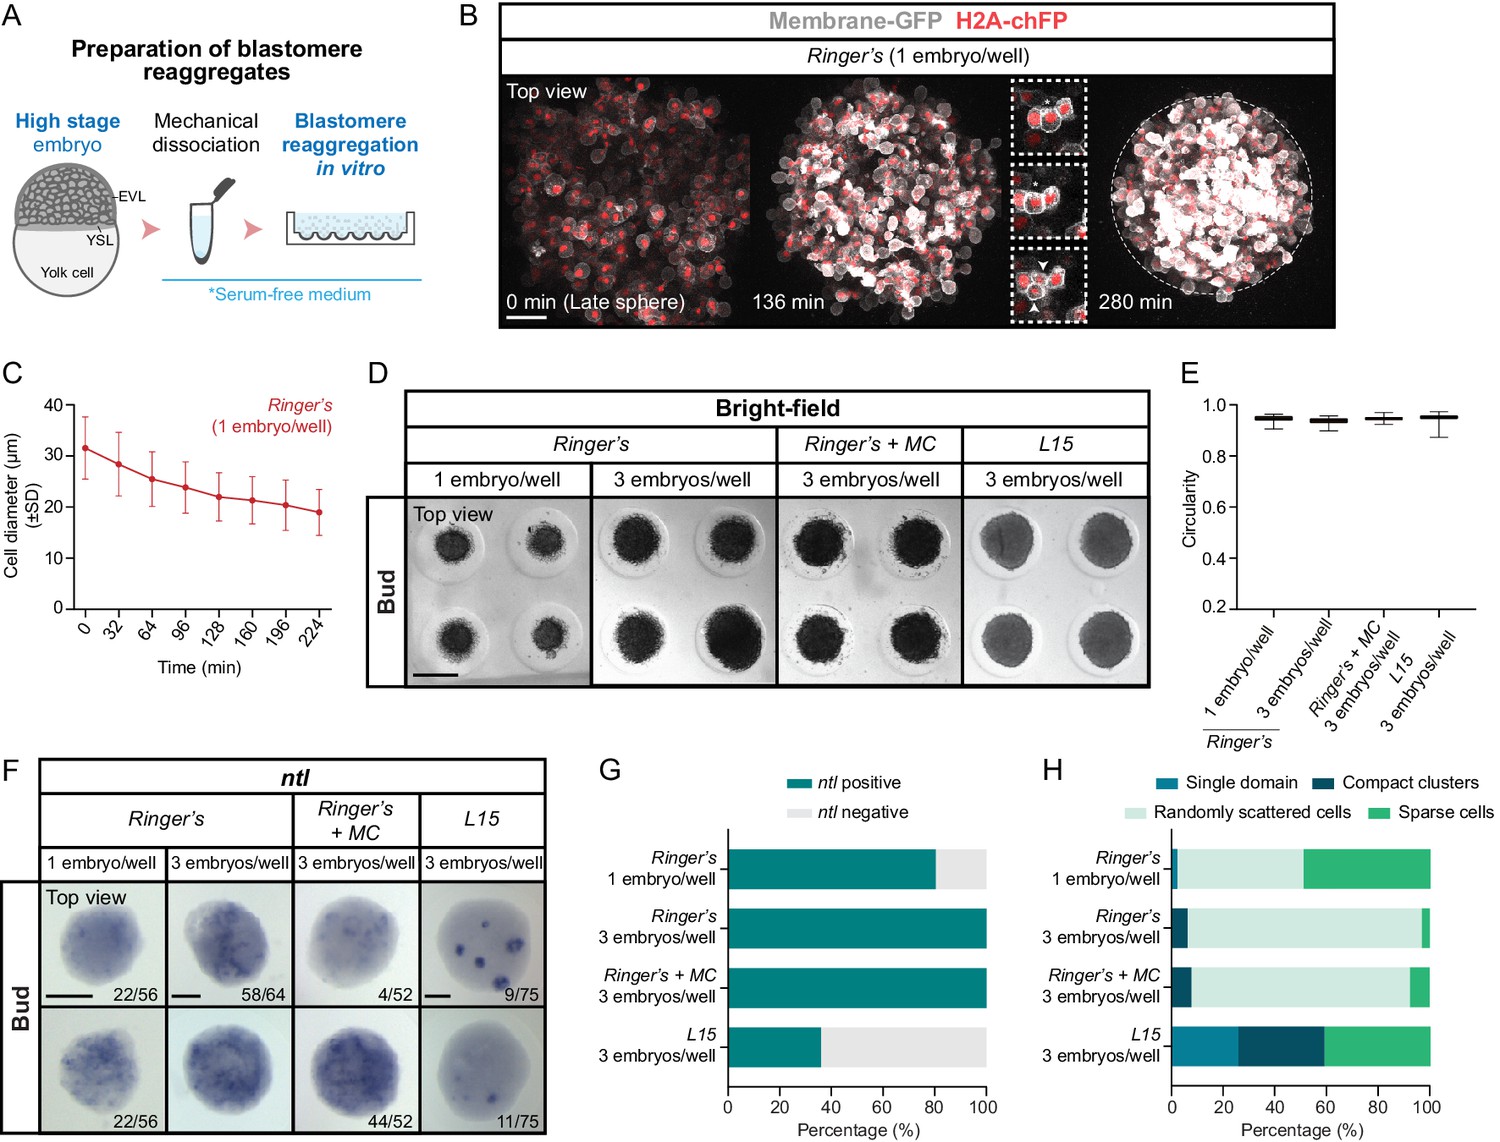
Mesoderm specification in blastomere reaggregates.
(A) Schematic representation of the preparation method of blastomere reaggregates from high stage embryos. (B) High-resolution fluorescence images of a blastomere reaggregate (top view) from late sphere stage onwards (30–45 min after reaggregate preparation; n = 8, N = 8). Cell membranes (grey) are marked by Membrane-RFP and nuclei (red) by H2A-chFP expression. Time in min. The reaggregate edges at the end of the acquisition are outlined by a white dashed line. Insets are zoom-in images of a cell division event completed at 136 min (dashed boxes). The dividing cell is highlighted with an asterisk and the two daughter cells with white arrowheads. (C) Cell diameter in blastomere reaggregates from late sphere stage onwards (0 min: number of cells = 211, n = 8, N = 8; 32 min: number of cells = 209, n = 8, N = 8; 64 min: number of cells = 208, n = 8, N = 8; 96 min: number of cells = 199, n = 8, N = 8; 128 min: number of cells = 197, n = 8, N = 8; 160 min: number of cells = 198, n = 8, N = 8; 192 min: number of cells = 210, n = 8, N = 8; 224 min: number of cells = 199, n = 8, N = 8). (D) Bright-field single-plane images of blastomere reaggregates (top view) prepared at a density of one or three embryos/well (indicated at the top) and subsequently cultured in either Ringer’s (one embryo/well: n = 233, N = 3; three embryos/well: n = 202, N = 3), Ringer’s with methylcellulose (MC 0.3%; three embryos/well: n = 184, N = 3) or L15 (three embryos/well: n = 227, N = 3) media until bud stage. (E) Circularity of bud stage blastomere reaggregates prepared at a density of one or three embryos/well (indicated at the side) and cultured in either Ringer’s (one embryo/well: n = 233, N = 3; three embryos/well: n = 202, N = 3), Ringer’s with methylcellulose (MC 0.3%; three embryos/well: n = 184, N = 3) or L15 (three embryos/well: n = 227, N = 3) media. (F) Expression of the mesodermal marker ntl, as determined by whole mount in situ hybridization in blastomere reaggregates (top view) prepared at a density of one or three embryos/well (indicated at the top) and subsequently cultured in either Ringer’s (one embryo/well: n = 56, N = 4; three embryos/well: n = 64, N = 4), Ringer’s with methylcellulose (MC 0.3%; three embryos/well: n = 52, N = 3) or L15 (three embryos/well: n = 75, N = 5) media until bud stage. The proportion of blastomere reaggregates with a phenotype similar to the images shown is indicated in the lower right corner. (G) Percentage of bud stage blastomere reaggregates prepared at a density of one or three embryos/well (indicated at the side) and cultured in either Ringer’s (one embryo/well: n = 56, N = 4; three embryos/well: n = 64, N = 4), Ringer’s with methylcellulose (MC 0.3%; three embryos/well: n = 52, N = 3) or L15 (three embryos/well: n = 75, N = 5) media showing or not ntl expression, as determined by whole mount in situ hybridization. (H) Percentage of bud stage blastomere reaggregates prepared at a density of one or three embryos/well (indicated at the side) and cultured in either Ringer’s (one embryo/well: n = 45, N = 4; three embryos/well: n = 64, N = 4), Ringer’s with methylcellulose (MC 0.3%; three embryos/well: n = 52, N = 3) or L15 (three embryos/well: n = 27, N = 4) media showing a single coherent ntl expression domain, several compact ntl-positive cell clusters (example shown for L15 cultured reaggregates in F), few sparse ntl positive cells (example shown for Ringer’s, Ringer’s + MC and L15 cultured reaggregates in F) or randomly scattered groups of ntl expressing cells (examples shown for Ringer’s or Ringer’s + MC cultured reaggregates in F), as determined by whole mount in situ hybridization. Scale bars: 100 µm (B), 500 µm (D), 150 µm (F).
-
Figure 4—figure supplement 3—source data 1
Mesoderm specification in blastomere reaggregates.
- https://cdn.elifesciences.org/articles/55190/elife-55190-fig4-figsupp3-data1-v2.xlsx
Figure 5 with 1 supplement

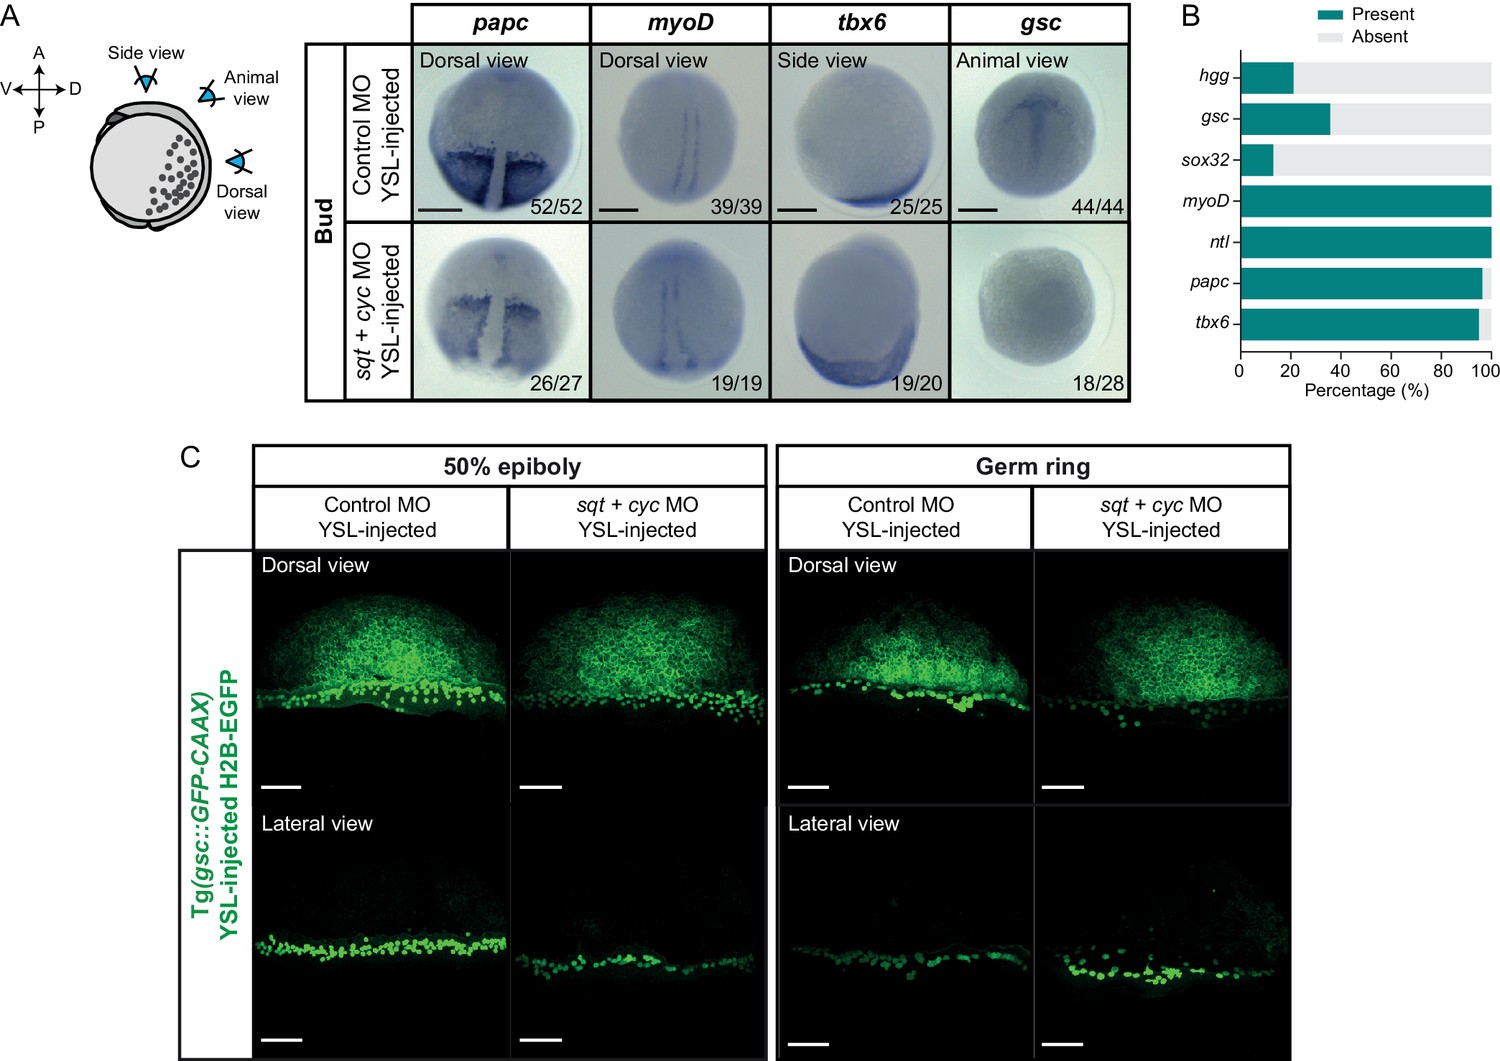
YSL-derived Nodal signals are required for inducing head mesoderm and endoderm in the intact embryo.
(A) Expression of mesendoderm (hgg and ntl) and endoderm (sox32) marker genes, as determined by whole mount in situ hybridization in control MO (6 ng) or sqt (2 ng) + cyc (4 ng) MO YSL-injected embryos at bud stage. Schematic representation of the embryo views is shown on the left. The proportion of embryos with a phenotype similar to the images shown is indicated in the lower right corner (hgg: control, n = 69, N = 4, sqt/cyc, n = 57, N = 4; ntl: control, n = 50,N = 4, sqt/cyc, n = 28, N = 4 and sox32: control, n = 48, N = 3, sqt/cyc, n = 23, N = 3). (B) Bright-field single-plane images of pharyngula stage (32 hpf) control MO (6 ng) or sqt (2 ng) + cyc (4 ng) MO YSL-injected embryos. The proportion of embryos with a phenotype similar to the images shown is indicated in the lower right corner (n = 19, N = 2; n = 14, N = 2). (C) High-resolution fluorescence images of control MO (6 ng) or sqt (2 ng) + cyc (4 ng) MO YSL-injected embryos stained both for pSMAD2/3 (pink) and DAPI (grey) at 50% epiboly (dorsal domain: control, n = 10, N = 4; sqt/cyc, n = 7, N = 4; lateral domain: control, n = 9, N = 4; sqt/cyc, n = 7, N = 4) and germ ring (dorsal domain: control, n = 7, N = 4; sqt/cyc, n = 8, N = 4; lateral domain: control, n = 8, N = 4; sqt/cyc, n = 7, N = 4). Nuclear pSMAD2/3 is color-coded using a fire lookup table (highest intensities in yellow) and was masked based on the DAPI signal. Insets are zoom-in images of the highlighted regions (dashed boxes). (D) Percentage of pSMAD2/3 positive nuclei in control MO (6 ng) or sqt (2 ng) + cyc (4 ng) MO YSL-injected embryos at 50% epiboly (dorsal domain: control, n = 10, N = 4; sqt/cyc, n = 7, N = 4; lateral domain: control, n = 9, N = 4; sqt/cyc, n = 7, N = 4) and germ ring (dorsal domain: control, n = 7, N = 4; sqt/cyc, n = 8, N = 4; lateral domain: control, n = 8, N = 4; sqt/cyc, n = 7, N = 4). ****p<0.0001, **p=0.0093, **p=0.0023, respectively (ANOVA test). (E) Normalized intensity of the brightest pSMAD2/3 positive nuclei (for details see Materials and methods) in control MO (6 ng) or sqt (2 ng) + cyc (4 ng) MO YSL-injected embryos at 50% epiboly (dorsal domain: control, n = 10, N = 4; sqt/cyc, n = 7, N = 4; lateral domain: control, n = 9, N = 4; sqt/cyc, n = 7, N = 4) and germ ring (dorsal domain: control, n = 7, N = 4; sqt/cyc, n = 8, N = 4; lateral domain: control, n = 8, N = 4; sqt/cyc, n = 7, N = 4). ****p<0.0001, ***p=0.0010 (Kruskal-Wallis test). (F,G) Normalized intensity of the brightest pSMAD2/3 positive nuclei as a function of the distance to the YSL, expressed as cell tiers, in control MO (6 ng) or sqt (2 ng) + cyc (4 ng) MO YSL-injected embryos at 50% epiboly (for details see Materials and methods; dorsal domain: control, n = 10, N = 4; sqt/cyc, n = 7, N = 4; lateral domain: control, n = 9, N = 4; sqt/cyc, n = 7, N = 4) and germ ring (dorsal domain: control, n = 7, N = 4; sqt/cyc, n = 8, N = 4; lateral domain: control, n = 8, N = 4; sqt/cyc, n = 7, N = 4). (C-G) The position along the dorsal-ventral axis is indicated at the top. Scale bars: 200 µm (A), 500 µm (B), 100 µm (C).
-
Figure 5—source data 1
YSL-derived Nodal signals are required for inducing head mesoderm in the intact embryo.
- https://cdn.elifesciences.org/articles/55190/elife-55190-fig5-data1-v2.xlsx
Figure 5—figure supplement 1
Mesendoderm patterning in embryos with reduced YSL-derived Nodal signals.
(A) Expression of additional mesendoderm marker genes (papc, myoD, tbx6 and gsc) as determined by whole mount in situ hybridization in control MO (6 ng) or sqt (2 ng) + cyc (4 ng) MO YSL-injected embryos at bud stage. Schematic representation of the embryo views is shown in the left. The proportion of embryos with a phenotype similar to the images shown is indicated in the lower right corner (papc: control, n = 52, N = 3, sqt/cyc, n = 27, N = 3; myoD: control, n = 39, N = 3, sqt/cyc, n = 19, N = 3; tbx6: control, n = 25, N = 3, sqt/cyc, n = 20, N = 3 and gsc: control, n = 44, N = 3, sqt/cyc, n = 28, N = 3). (B) Percentage of bud stage sqt (2 ng) + cyc (4 ng) MO YSL-injected embryos showing expression of mesendoderm (hgg: n = 57, N = 4; gsc: n = 28, N = 3; myoD: n = 19, N = 3; ntl: n = 28, N = 4; papc: n = 27, N = 3; tbx6: n = 20, N = 3) and endoderm (sox32: n = 23, N = 3) marker genes, as determined by whole mount in situ hybridization. (C) High-resolution images of control MO (6 ng) or sqt (2 ng) + cyc (4 ng) MO YSL-injected embryos expressing gsc::GFP-CAAX and H2B-EGFP (injection control) at 50% epiboly (dorsal domain: control, n = 10, N = 4; sqt/cyc, n = 7, N = 4; lateral domain: control, n = 9, N = 4; sqt/cyc, n = 7, N = 4) and germ ring (dorsal domain: control, n = 7, N = 4; sqt/cyc, n = 8, N = 4; lateral domain: control, n = 8, N = 4; sqt/cyc, n = 7, N = 4). The position along the dorsal-ventral axis is indicated at the top. Images correspond to the embryos shown in Figure 5C. Scale bars: 200 µm (A), 100 µm (C).
-
Figure 5—figure supplement 1—source data 1
Mesendoderm patterning in embryos with reduced YSL-derived Nodal signals.
- https://cdn.elifesciences.org/articles/55190/elife-55190-fig5-figsupp1-data1-v2.xlsx
Figure 6 with 1 supplement
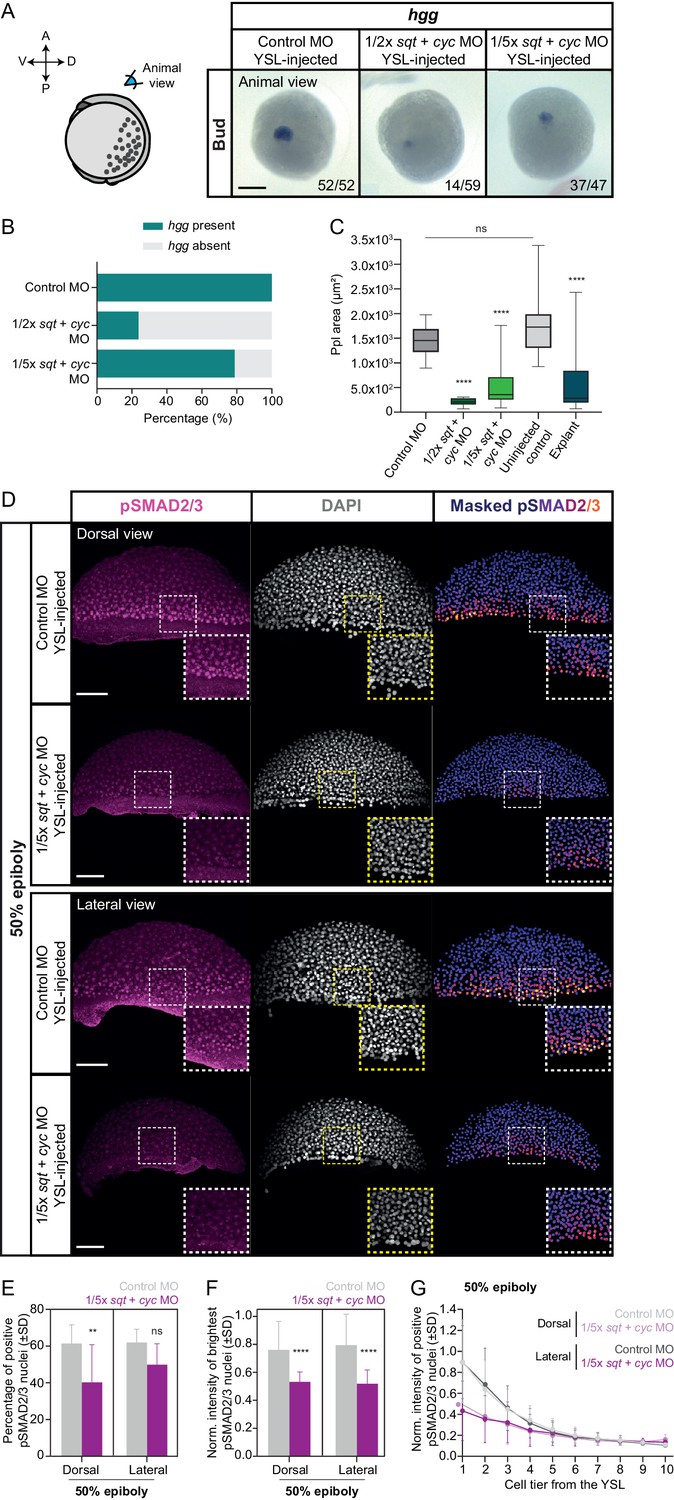
Reducing the dosage of YSL-derived Nodal signals results in variable induction of head mesoderm in intact embryos.
(A) Expression of hgg, a head mesoderm marker gene, in bud stage control MO (6 ng) or varying dosages of sqt + cyc MO YSL-injected embryos (1/2x: 1 ng sqt + 2 ng cyc MO and 1/5x: 0.4 ng sqt + 0.8 ng cyc MO), as determined by whole mount in situ hybridization. All embryos are shown as an animal view (schematic representation in the left). The proportion of embryos with a phenotype similar to the images shown is indicated in the lower right corner (control MO: n = 52, N = 3; 1/2x sqt/cyc: n = 59, N = 3; 1/5x sqt/cyc: n = 47, N = 3). (B) Percentage of control MO (n = 52, N = 3) or sqt + cyc MO YSL-injected embryos (1/2x sqt/cyc: n = 59, N = 3; 1/5x sqt/cyc: n = 47, N = 3) showing expression of hgg as determined by whole mount in situ hybridization at bud stage. (C) Ppl area (based on hgg staining, as determined by whole mount in situ hybridization) in control MO (n = 52, N = 3) or sqt + cyc MO YSL-injected embryos (1/2x sqt/cyc: n = 14, N = 3; 1/5x sqt/cyc: n = 37, N = 3), uninjected wildtype embryos (n = 31, N = 4) or blastoderm explants, prepared from 256 c embryos (n = 20, N = 5). ****p<0.0001, ns, not significant. (Kruskal-Wallis test). (D) High-resolution fluorescence images of control MO (6 ng) or 1/5x sqt (0.4 ng) + cyc (0.8 ng) MO YSL-injected embryos stained both for pSMAD2/3 (pink) and DAPI (grey) at 50% epiboly (dorsal domain: control, n = 11, N = 5; 1/5x sqt/cyc, n = 8, N = 3; lateral domain: control, n = 9, N = 4; 1/5x sqt/cyc, n = 7, N = 3). Nuclear pSMAD2/3 is color-coded using a fire lookup table (highest intensities in yellow) and was masked based on the DAPI signal. Insets are zoom-in images of the highlighted regions (dashed boxes). (E) Percentage of pSMAD2/3 positive nuclei in control MO (6 ng) or 1/5x sqt (0.4 ng) + cyc (0.8 ng) MO YSL-injected embryos at 50% epiboly (dorsal domain: control, n = 11, N = 5; 1/5x sqt/cyc, n = 8, N = 3; lateral domain: control, n = 9, N = 4; 1/5x sqt/cyc, n = 7, N = 3). **p=0.0086, ns, not significant (Kruskal-Wallis test). (F) Normalized intensity of the brightest pSMAD2/3 nuclei (for details see Materials and methods) in control MO (6 ng) or 1/5x sqt (0.4 ng) + cyc (0.8 ng) MO YSL-injected embryos at 50% epiboly (dorsal domain: control, n = 11, N = 5; 1/5x sqt/cyc, n = 8, N = 3; lateral domain: control, n = 9, N = 4; 1/5x sqt/cyc, n = 7, N = 3). ****p<0.0001 (Kruskal-Wallis test). (G) Normalized intensity of pSMAD2/3 positive nuclei as a function of the distance to the YSL, expressed as cell tiers, in control MO (6 ng) or 1/5x sqt (0.4 ng) + cyc (0.8 ng) MO YSL-injected embryos at 50% epiboly (see Materials and methods for additional details; dorsal domain: control, n = 11, N = 5; 1/5x sqt/cyc, n = 8, N = 3; lateral domain: control, n = 9, N = 4; 1/5x sqt/cyc, n = 7, N = 3). (D-G) The position along the dorsal-ventral axis is indicated in the top right corner or at the bottom. Part of the control MO samples for (A-G) is also shown in Figure 5A and C–G. Scale bars: 200 µm (A), 100 µm (D).
-
Figure 6—source data 1
Reducing the dosage of YSL-derived Nodal signals results in variable induction of head mesoderm in intact embryos.
- https://cdn.elifesciences.org/articles/55190/elife-55190-fig6-data1-v2.xlsx
Figure 6—figure supplement 1
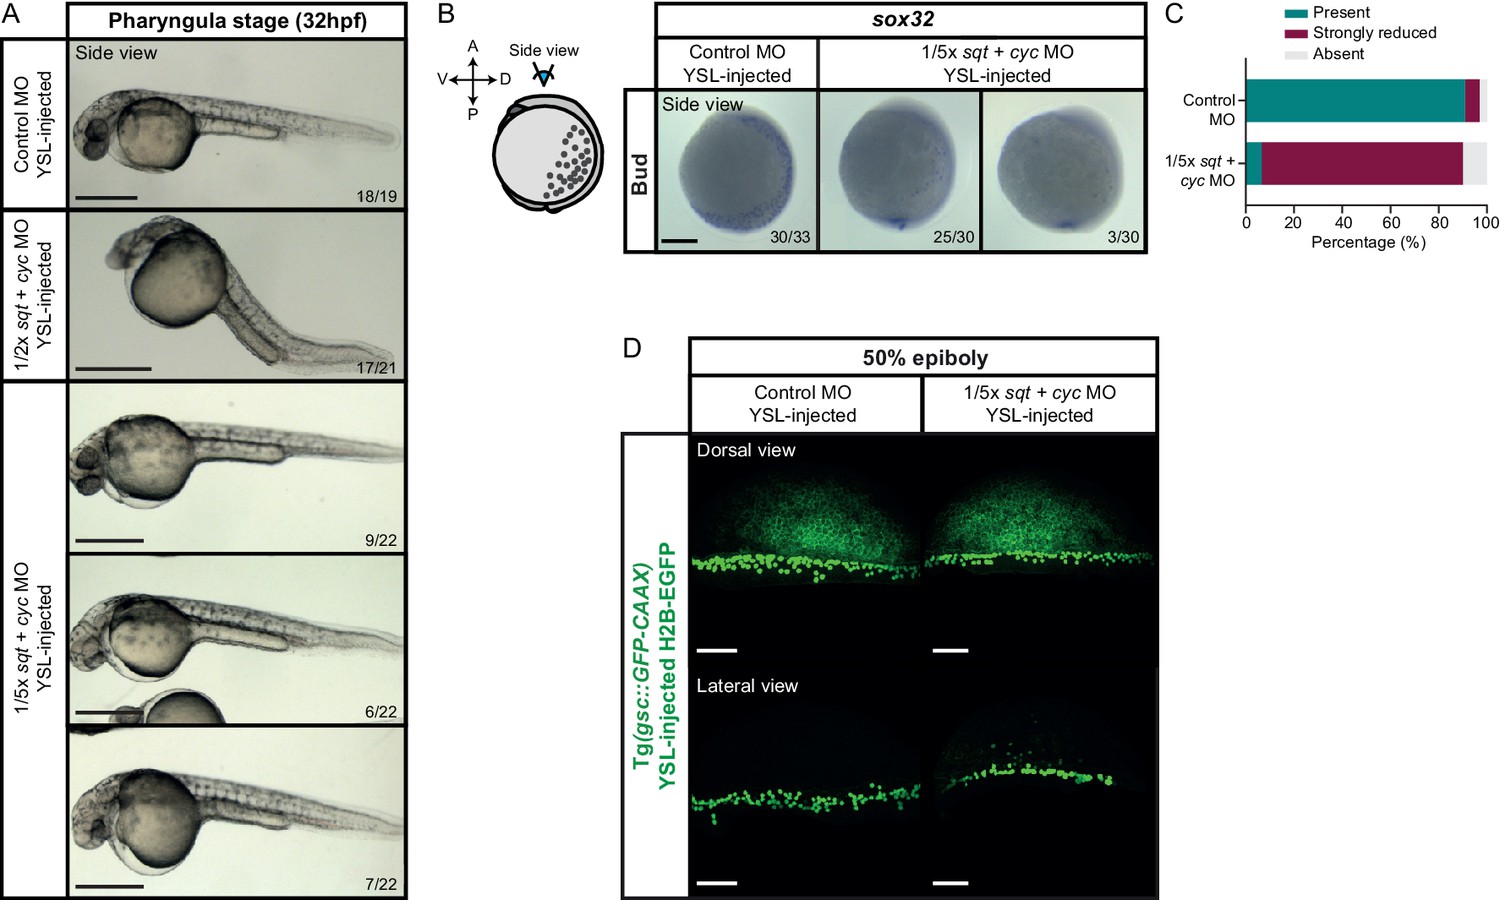
Mesendoderm patterning in embryos with varying dosages of YSL-derived Nodal signals.
(A) Bright-field single-plane images of control MO (6 ng), 1/2x or 1/5x sqt (1 or 0.4 ng, respectively) + cyc (2 or 0.8 ng, respectively) MO YSL-injected embryos at pharyngula stage (32 hpf). The proportion of embryos with a phenotype similar to the images shown is indicated in the lower right corner (control: n = 19, N = 2; 1/2x sqt/cyc: n = 21, N = 2 and 1/5x sqt/cyc: n = 22, N = 2). The control MO samples are also shown in Figure 5B. (B) Expression of sox32, an endoderm marker gene, as determined by whole mount in situ hybridization in control MO (6 ng) or 1/5x sqt (0.4 ng) + cyc (0.8 ng) MO YSL-injected embryos (side views) at bud stage. Embryos are shown as an animal view (schematic representation shown on the left). The proportion of embryos with a phenotype similar to the images shown is indicated in the lower right corner (control MO: n = 33, N = 3 and 1/5x sqt/cyc: n = 30, N = 3). (C) Percentage of bud stage control MO (n = 33, N = 3) or 1/5x sqt (0.4 ng) + cyc (0.8 ng) MO YSL-injected embryos (n = 30, N = 3) showing normal, strongly reduced or no expression of sox32, as determined by whole mount in situ hybridization. (D) High-resolution images of control MO (6 ng) or 1/5x sqt (0.4 ng) + cyc (0.8 ng) MO YSL-injected embryos expressing gsc::GFP-CAAX and H2B-EGFP (injection control) at 50% epiboly (dorsal domain: control, n = 11, N = 5; sqt/cyc, n = 8, N = 3; lateral domain: control, n = 9, N = 4; sqt/cyc, n = 7, N = 3). The position along the dorsal-ventral axis is indicated at the top. Images correspond to the embryos also shown in Figure 6D. Scale bars: 500 µm (A), 200 µm (B), 100 µm (C).
-
Figure 6—figure supplement 1—source data 1
Mesendoderm patterning in embryos with varying dosages of YSL-derived Nodal signals.
- https://cdn.elifesciences.org/articles/55190/elife-55190-fig6-figsupp1-data1-v2.xlsx
Author response image 1
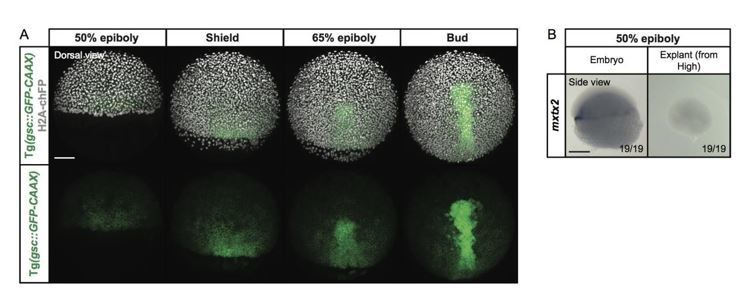
Expression of the YSL marker gene mxtx2 in blastoderm explants, prepared from high stage embryos.
(A) Exemplary high-resolution fluorescence images of a gsc::GFP-CAAX-expressing embryo (green) at different stages of gastrulation. The cell nuclei (grey) are marked by the expression of H2A-chFP. Dorsal side views. (B) Expression of the YSL marker gene mxtx2, as determined by whole mount in situ hybridization in 50% epiboly stage embryos (side view) and blastoderm explants (side view) that were prepared from high stage embryos. The proportion of embryos or blastoderm explants with a phenotype similar to the images shown is indicated in the lower right corner (embryos: n=19, N=3; explants: n=19, N=3). Scale bars: 100 µm (A), 200 µm (B).
Videos
Video 1
Blastoderm explant morphogenesis in the absence of the yolk cell and its associated YSL.
Bright-field time-lapse imaging of a blastoderm explant (cross-section) from late sphere to bud stage (n = 10, N = 3). The white dashed lines outline the initial and final shape of the explant. White asterisks denote the main luminal cavity. Time in min. Scale bar: 200 µm.
Video 2
Formation of the luminal cavity in blastoderm explants.
High-resolution fluorescence time-lapse imaging of a blastoderm explant (cross-section) from oblong stage onwards (n = 9, N = 2). Interstitial fluid (green) is marked by dextran Alexa Fluor 647 and the cell membranes (white) are marked by Membrane-GFP. White asterisks denote the two luminal cavities. Time in min. Scale bar: 100 µm.
Video 3
Mesendoderm progenitor cells organize into an extension without undergoing clear internalization movements.
High-resolution fluorescence time-lapse imaging of a blastoderm explant from late 50% epiboly onwards (n = 14, N = 14). The cell nuclei (white) are marked by H2A-chFP and the mesendoderm tissue (green) by expression of gsc::GFP-CAAX. The explant is shown both from the top and from a side view along the extension axis. Time in min. Scale bar: 100 µm.
Video 4
Maternal pre-patterning is required for Nodal signaling in blastoderm explants.
High-resolution fluorescence images of 50% epiboly control (left; n = 73, N = 14), dorsal determinants-removed (DD-removed, middle; n = 30, N = 7) and animal pole (right; n = 22, N = 6) explants stained for both pSMAD2/3 (pink) and DAPI (grey). A full stack projection (also shown in Figure 4D) for each condition is shown first, followed by the individual z stacks. The explants are shown as top views and the yellow circles denote the wounding site. Scale bar: 100 µm.
Tables
Key resources table
| Reagent type (species) or resource | Designation | Source or reference | Identifiers | Additional information |
|---|---|---|---|---|
| Strain, strain background (D. rerio) | Zebrafish: wildtype ABxTL | MPI-CBG dresden | ||
| Strain, strain background (D. rerio) | Zebrafish: Tg(gsc::EGFP-CAAX) | (Smutny et al., 2017) | ZFINID:ZDB-ALT-170811–2 | |
| Strain, strain background (D. rerio) | Zebrafish: Tg(sebox::EGFP) | (Ruprecht et al., 2015) | ZFINID:ZDB-ALT-150727–1 | |
| Strain, strain background (D. rerio) | Zebrafish: Tg(krt4::EGFP-CAAX) | (Krens et al., 2011) | ZFINID:ZDB-ALT-111207–5 | |
| Strain, strain background (D. rerio) | Zebrafish: Tg(actb2::lyntdtomato;actb2::H2B-EGFP) | (Stegmaier et al., 2016) | ZFINID:ZDB-ALT-161017–9 | |
| Strain, strain background (D. rerio) | Zebrafish: MZoep | (Gritsman et al., 1999) | ZFINID:ZDB-ALT-980203–1256 | |
| Strain, strain background (D. rerio) | Zebrafish: MZfz7a/b | (Quesada-Hernández et al., 2010) | ZFINID:ZDB-FISH-150901–19586 | |
| Strain, strain background (D. rerio) | Zebrafish: MZfz7a/b; Tg(gsc::EGFP-CAAX) | (Čapek et al., 2019) | ||
| Strain, strain background (D. rerio) | Zebrafish: MZwnt11 | (Heisenberg et al., 2000) | ZFINID:ZDB- ALT-980203–1302 | |
| Strain, strain background (D. rerio) | Zebrafish: MZwnt5b | (Kilian et al., 2003) | ZFINID:ZDB- ALT-980203–1630 | |
| Recombinant DNA reagent | pCS2+-Membrane-GFP plasmid for mRNA synthesis | (Kimmel and Meyer, 2010) | 60–100 pg (1 c injection) | |
| Recombinant DNA reagent | pCS2-Membrane-RFP plasmid for mRNA synthesis | (Iioka et al., 2004) | 80 pg (1 c injection) | |
| Recombinant DNA reagent | pCS2+-H2B-eGFP plasmid for mRNA synthesis | (Keller et al., 2008) | 50 pg (1 c or YSL injection) | |
| Recombinant DNA reagent | pCS2-H2A-mCherry plasmid for mRNA synthesis | (Arboleda-Estudillo et al., 2010) | 6.5 pg (128 c injection)50 pg (1 c injection) | |
| Recombinant DNA reagent | pCS2+-CA-Alk8 plasmid for mRNA synthesis | (Payne et al., 2001) | 30 pg (1 c injection) | |
| Sequence-based reagent | Human β-Globin Morpholino: 5′-CCTCTTACCTCAG TTACAATTTATA-3′ | Gene Tools | 6 ng (YSL injection) | |
| Sequence-based reagent | sqt Morpholino: 5’-ATGTCAAATCAAGG TAATAATCCAC-3′ | Gene Tools | ZFINID:ZDB-MRPHLNO-060809–1 | 0.4–2 ng (YSL injection) |
| Sequence-based reagent | cyc Morpholino: 5’-GCGACTCCGAGCGTGTGCATGATG-3′ | Gene Tools | ZFINID:ZDB-MRPHLNO-060930–4 | 0.8–4 ng (YSL injection) |
| Antibody | Anti-Phospho-Smad2 (Ser465/467)/Smad3 (Ser423/425) (clone D27F4) | Cell Signaling | Cat# 8828, RRID:AB_2631089 | 1:1000 (WMIF) |
| Antibody | Anti-β-Catenin (clone 15B8) | Sigma-Aldrich | Cat# C7207, RRID:AB_476865 | 1:500 (WMIF) |
| Antibody | Anti-Phospho-Smad1/5 (Ser463/465) (clone 41D10) | Cell Signaling | Cat#: 9516, RRID:AB_491015 | 1:100 (WMIF) |
| Antibody | Alexa Fluor 546 Goat Anti-rabbit IgG (H + L) | Thermo Fisher Scientific | Cat#: A-11010; RRID:AB_2534077 | 1:500 (WMIF) |
| Antibody | Alexa Fluor 488 Goat Anti-mouse IgG (H + L) | Thermo Fisher Scientific | Cat#: A-11001; RRID:AB_2534069 | 1:500 (WMIF) |
| Antibody | Alexa Fluor 647 Goat Anti-mouse IgG (H + L) | Thermo Fisher Scientific | Cat# A-21235; RRID:AB_2535804 | 1:500 (WMIF) |
| Antibody | Anti-Digoxigenin-AP Fab fragments | Roche | Cat#11093274910 RRID:AB_2734716 | 1:1000 (WMISH) |
| Antibody | Anti-Fluorescein-AP Fab fragments | Roche | Cat#11426338910 RRID :AB_2734723 | 1:500 (WMISH) |
| Chemical compound, drug | DMSO | Sigma-Aldrich | Cat#D8418 | 50 μM |
| Chemical compound, drug | SB-505124 | Sigma-Aldrich | Cat# S4696 | 50 μM |
| Chemical compound, drug | Dextran Alexa Fluor 647 | Invitrogen | Cat#D22914 | 2 ng (Sphere stage injection) |
| Chemical compound, drug | Dextran Cascade Blue | Invitrogen | Cat# D1976 | 2 ng (Sphere stage injection) |
| Chemical compound, drug | Hydroxyurea | Sigma-Aldrich | Cat#H8627 | 60 mM |
| Chemical compound, drug | Aphidicolin | Sigma-Aldrich | Cat#A0781 | 300 μM |
| Chemical compound, drug | DAPI | Invitrogen | Cat#D1306 | 1 µg/mL (WMIF) |
| Chemical compound, drug | Methylcellulose | Sigma-Aldrich | Cat#M0387 | 0.3% |
| Chemical compound, drug | Digoxigenin (DIG)-modified nucleotides | Sigma-Aldrich | Cat#11277073910 | |
| Chemical compound, drug | Fluorescein-labeled nucleotides | Sigma-Aldrich | Cat#11685619910 | |
| Chemical compound, drug | SIGMAFAST Fast Red TR/Naphthol AS-MX Tablets | Sigma-Aldrich | Cat#F4648 | |
| Cell culture reagent | L15 | Sigma-Aldrich | Cat# L4386 | |
| Software, Algorithm | Imaris | Bitplane | https://imaris.oxinst.com/packages | |
| Software, Algorithm | Fiji | (Schindelin et al., 2012) | https://fiji.sc/ | |
| Software, Algorithm | GraphPad Prism | GraphPad Software | https://www.graphpad.com/scientific-software/prism/ | |
| Software, Algorithm | MATLAB | MATLAB Software | https://www.mathworks.com/products/ matlab.html | |
| Software, Algorithm | pSMAD2/3 and β-catenin analysis (custom-made script) | This paper | Source code 1 | |
| Software, Algorithm | Excel | Microsoft | https://products.office.com/en-us/?rtc=1 |
Additional files
-
Source code 1
pSMAD2/3 and β-catenin analysis.
- https://cdn.elifesciences.org/articles/55190/elife-55190-code1-v2.zip
-
Transparent reporting form
- https://cdn.elifesciences.org/articles/55190/elife-55190-transrepform-v2.pdf
Download links
A two-part list of links to download the article, or parts of the article, in various formats.
Downloads (link to download the article as PDF)
Open citations (links to open the citations from this article in various online reference manager services)
Cite this article (links to download the citations from this article in formats compatible with various reference manager tools)
Zebrafish embryonic explants undergo genetically encoded self-assembly
eLife 9:e55190.
https://doi.org/10.7554/eLife.55190


