The visual pigment xenopsin is widespread in protostome eyes and impacts the view on eye evolution
- Sars International Centre for Marine Molecular Biology, University of Bergen, Norway
Figures
Figure 1 with 1 supplement

Conservation of functionally important motifs and residues in different opsin types.
Alignment of parts of the transmembrane domain VII and the cytosolic helix VIII of selected opsin sequences showing the conserved lysine 296 (K296) chromophore binding site and other conserved motifs important for opsin-G protein interaction like NPXXY and the tripeptide (NKQ in c-opsins and several xenopsins; HPK in r-opsins). The sequences investigated in this study are highlighted in blue.
Figure 1—figure supplement 1
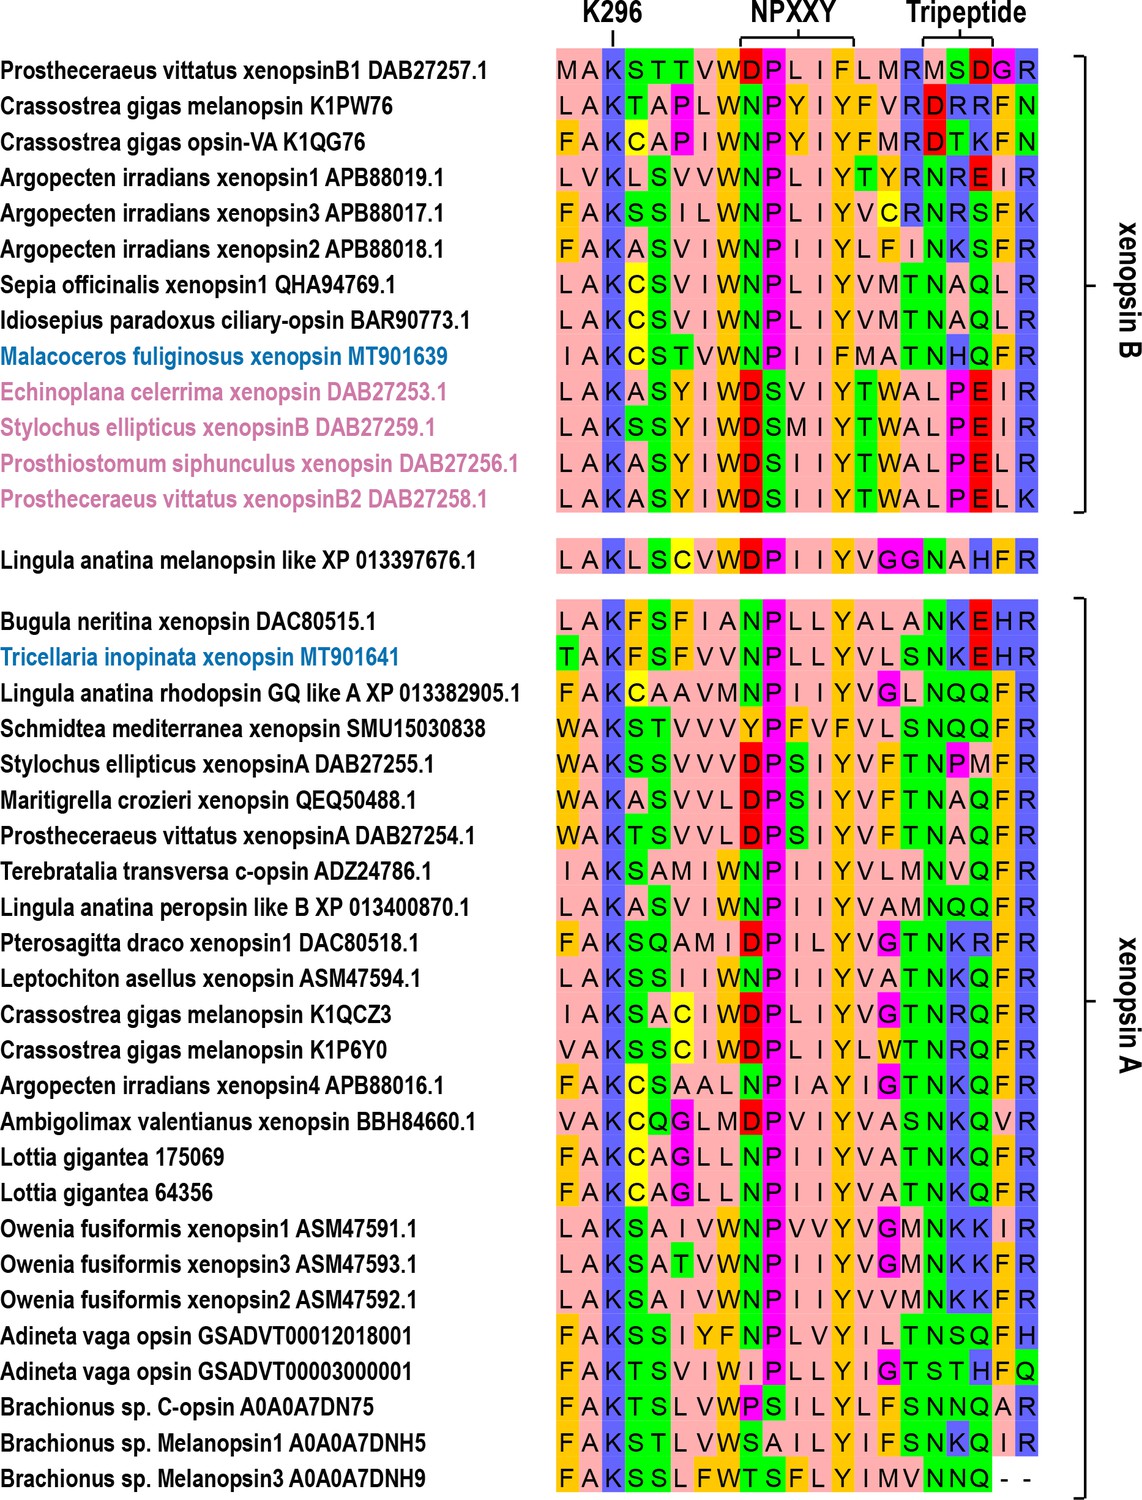
Conservation of functionally important motifs and residues in xenopsins.
Alignment of parts of the transmembrane domain VII and the cytosolic helix VIII of selected opsin sequences showing the conserved lysine 296 (K296) chromophore binding site and other motifs important for opsin-G protein interaction like NPXXY and the tripeptide. The tripeptide and the NPXXY motif are strongly modified in several flatworm xenopsin B sequences (highlighted in red), but are conserved in M. fuliginosus and T. inopinata xenopsin (highlighted in blue).
Figure 2 with 8 supplements
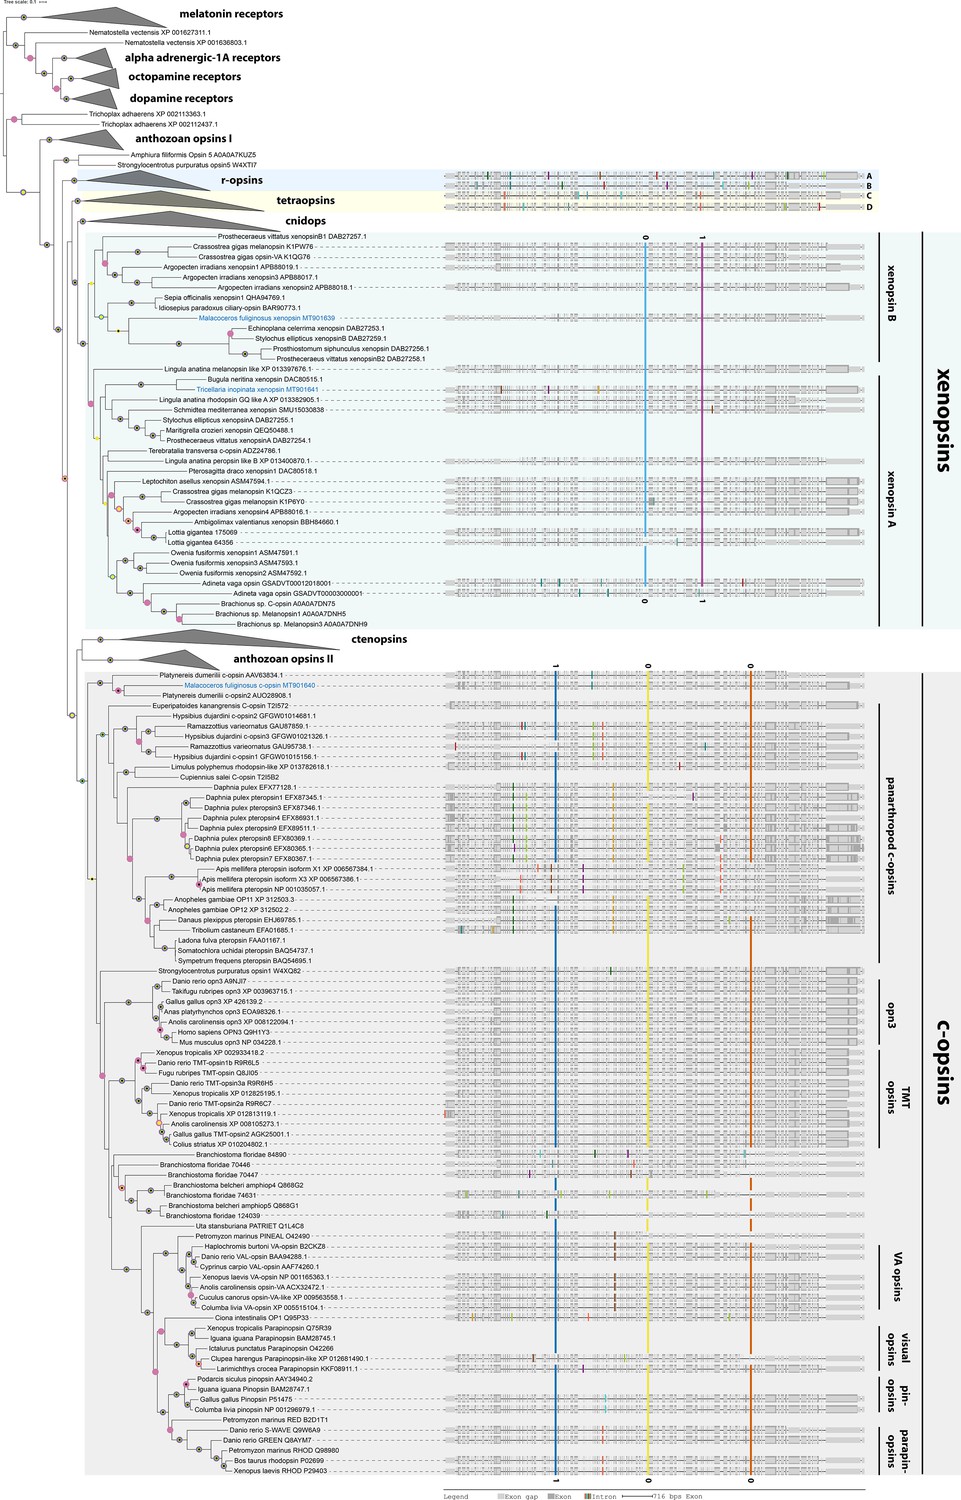
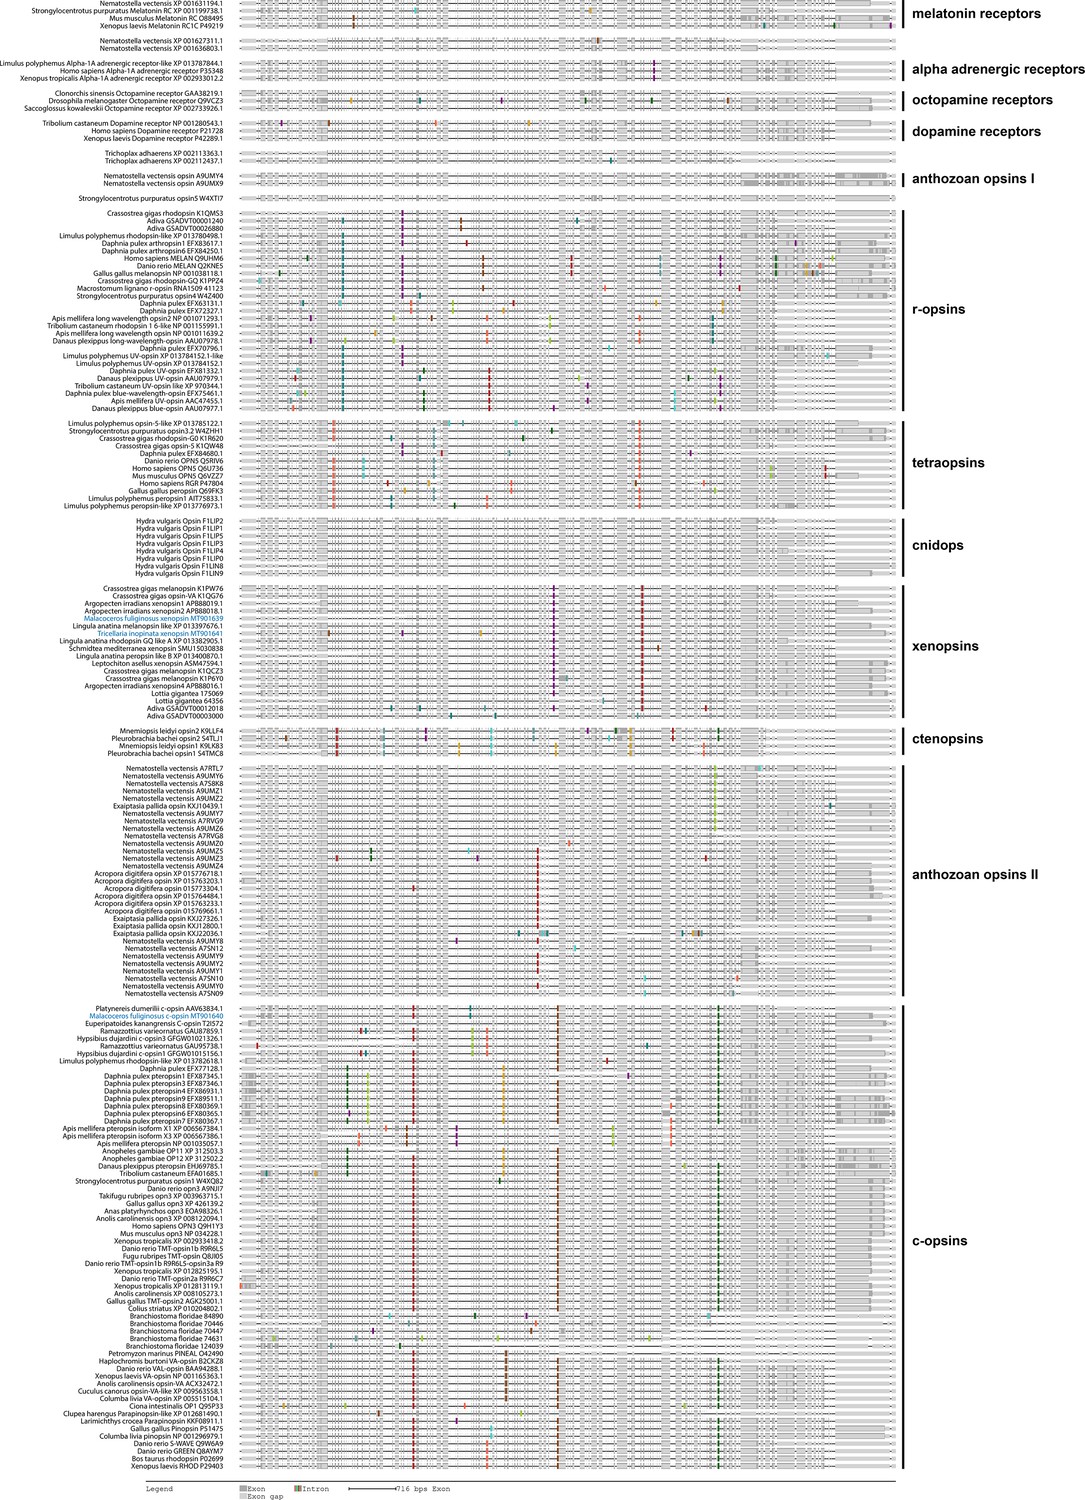
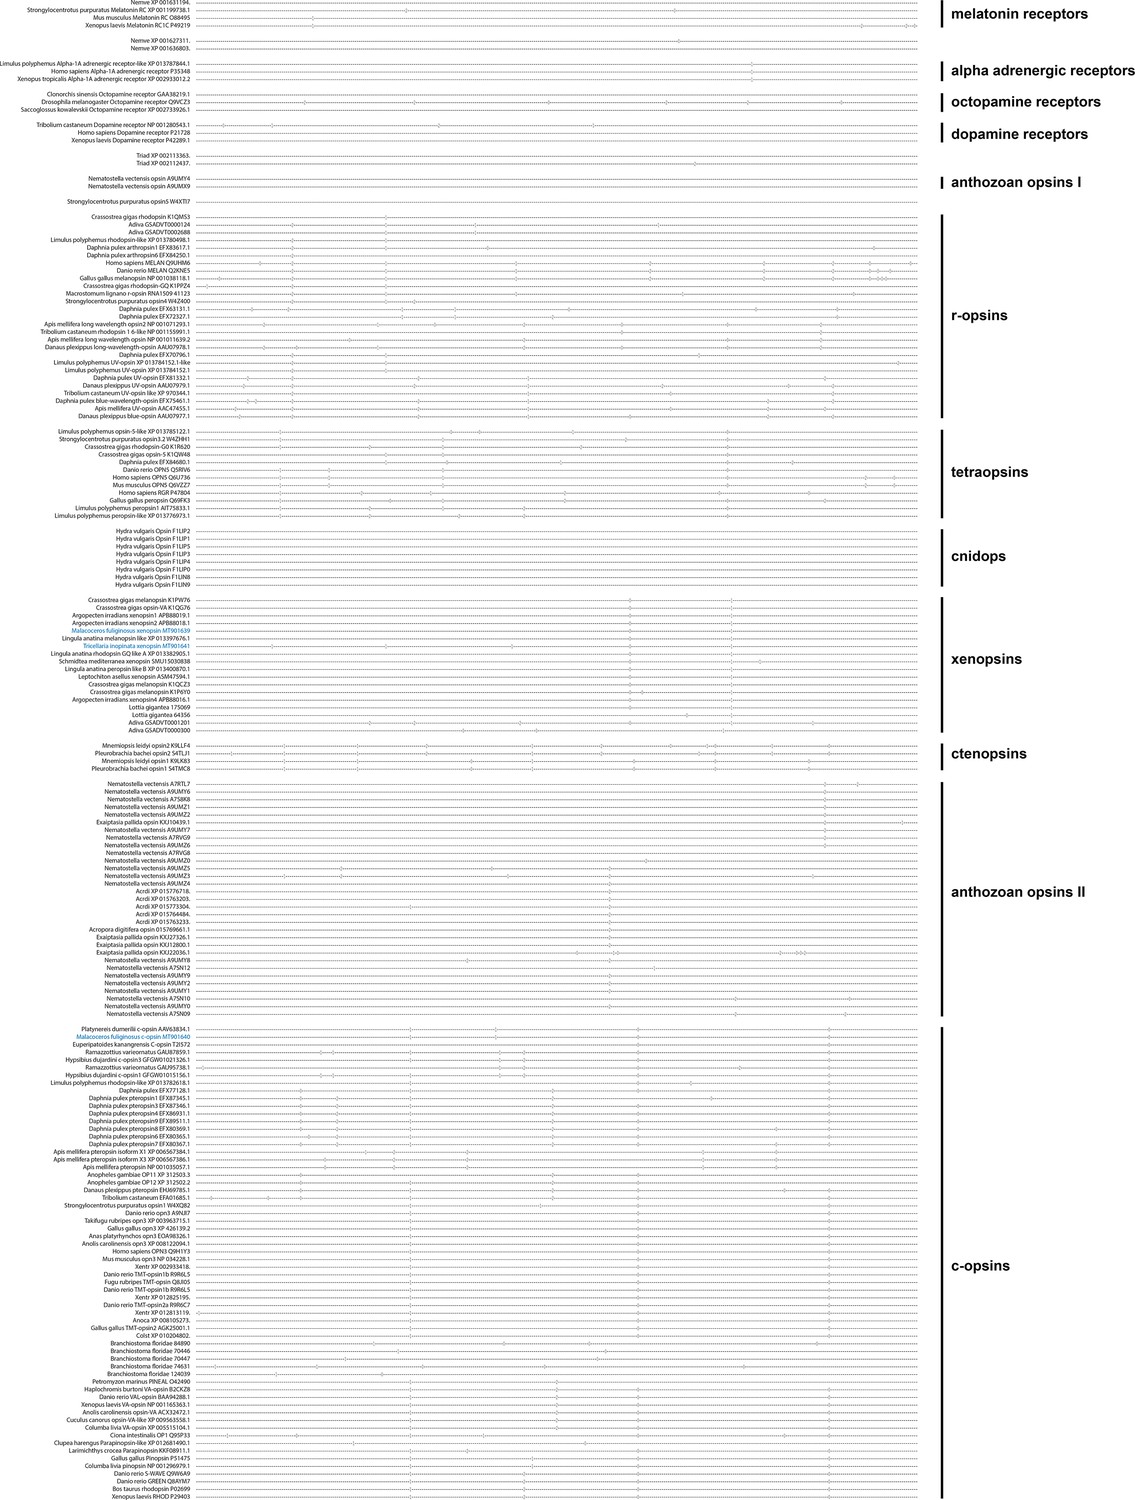
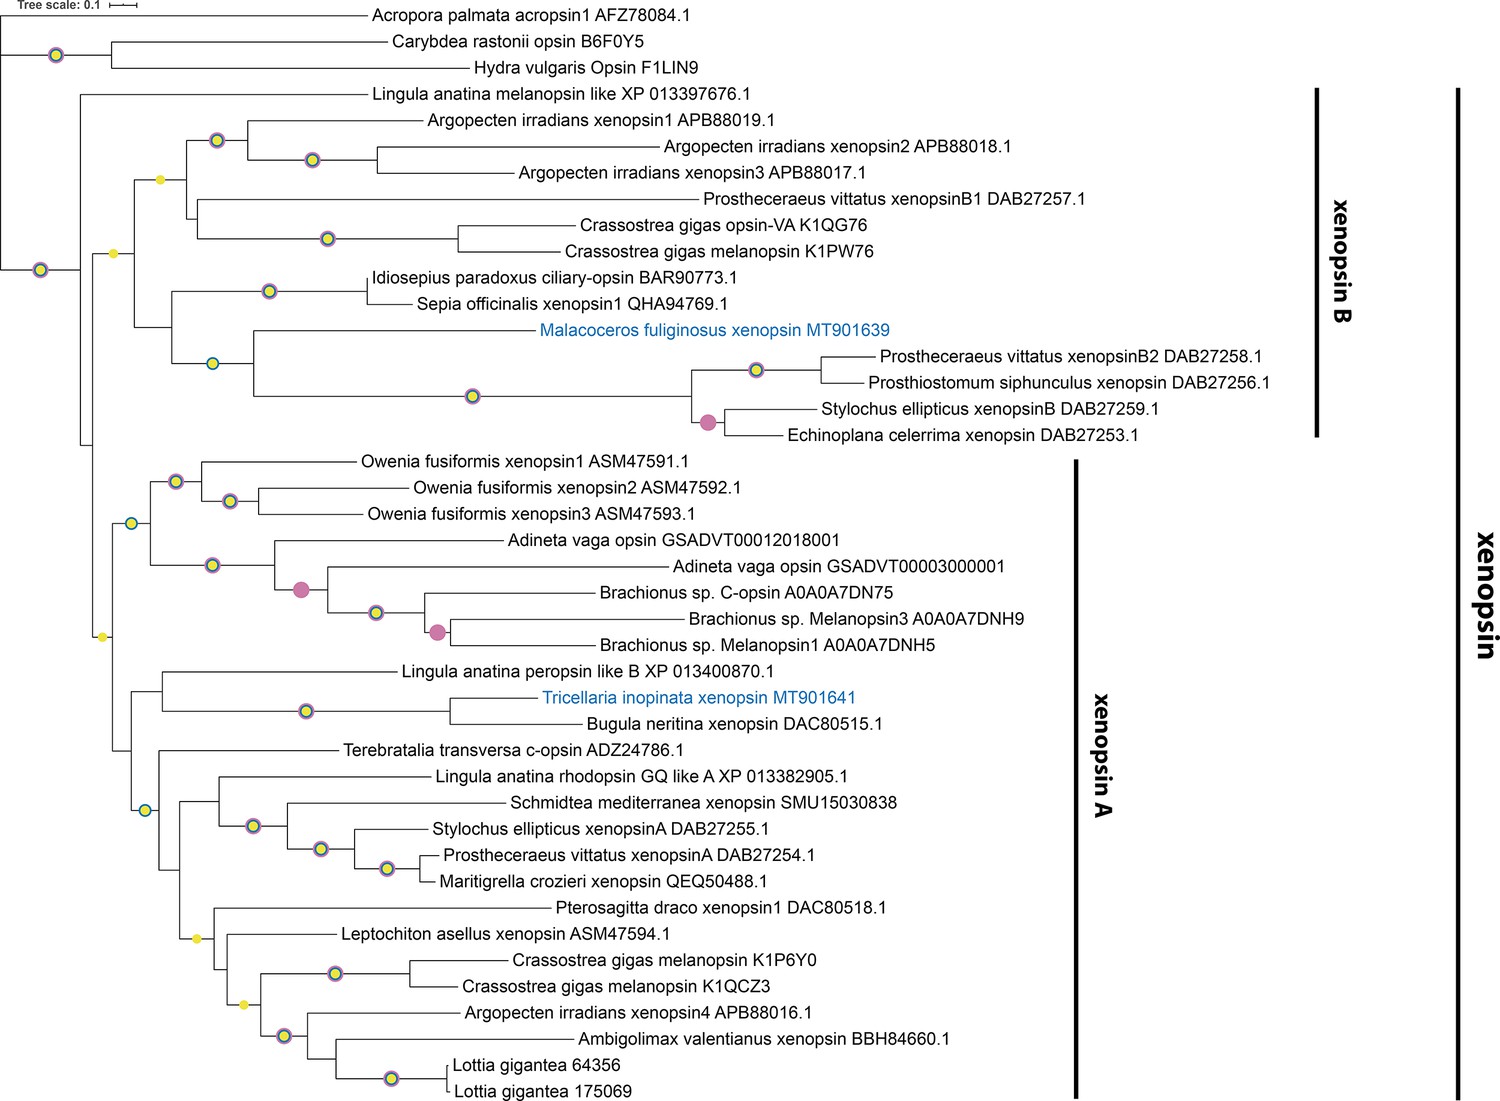
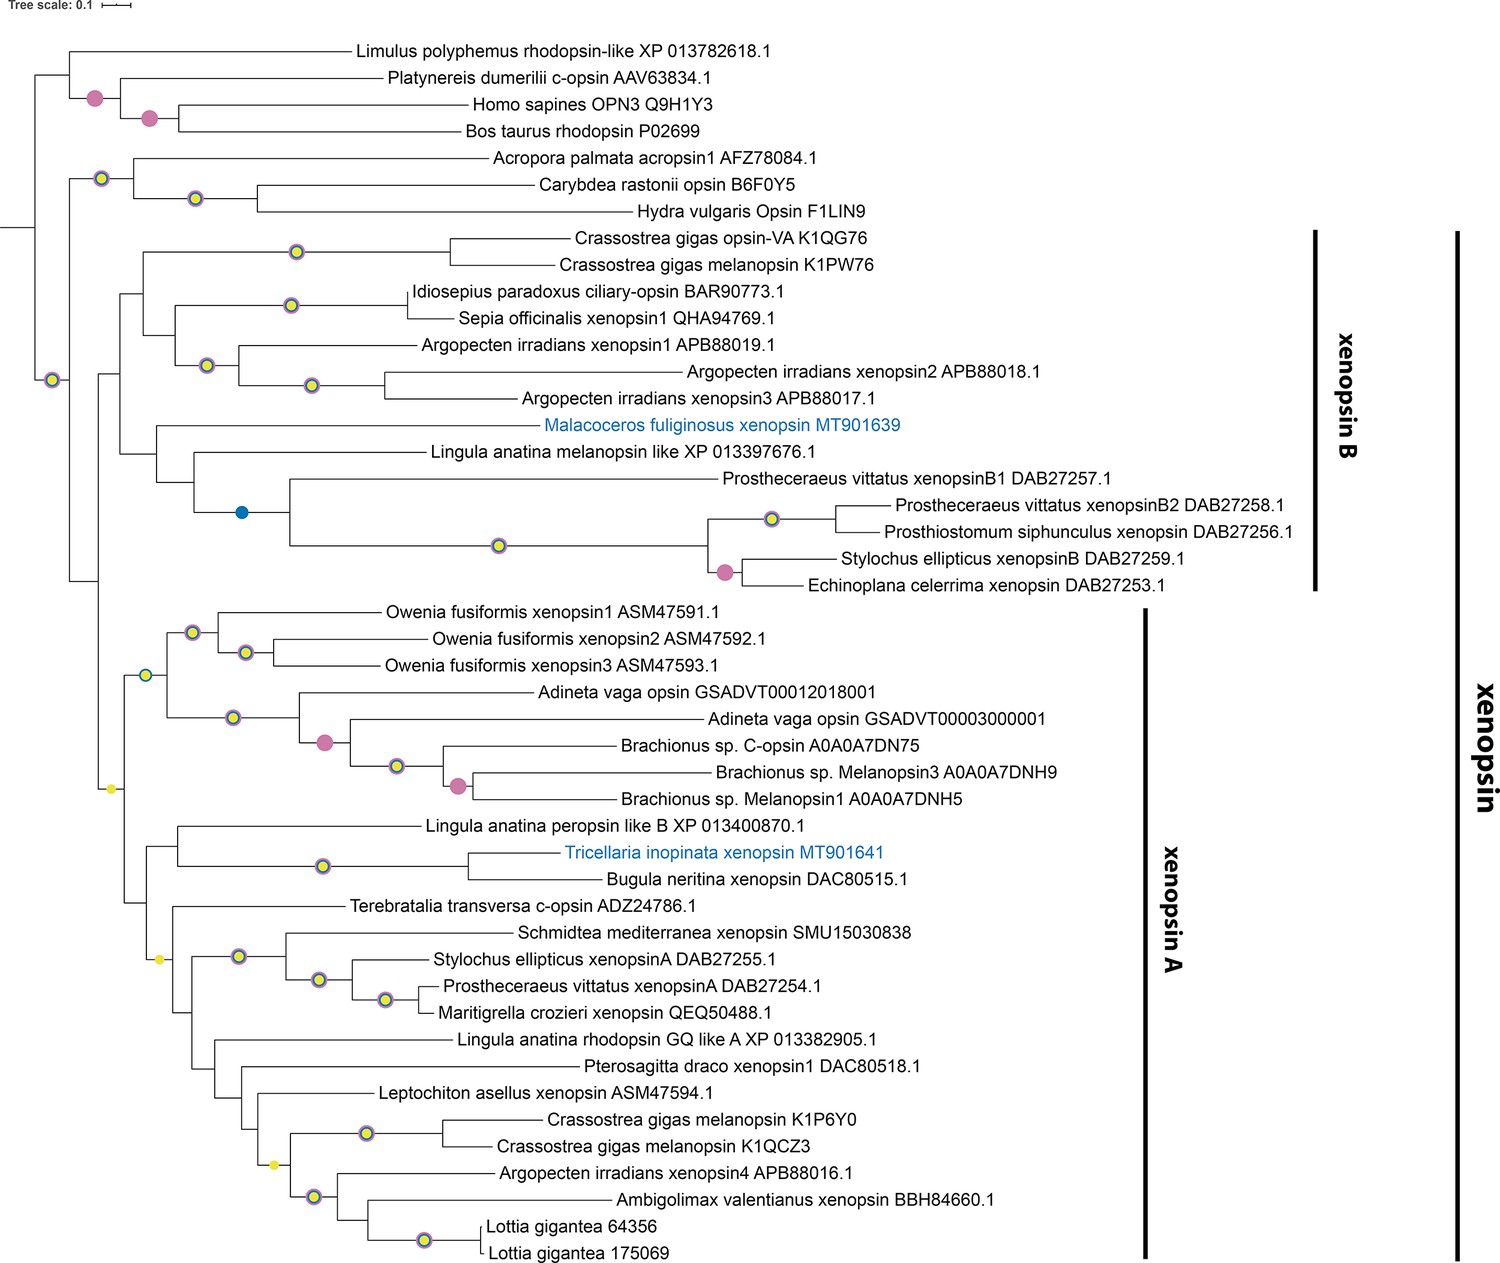
C-opsins and xenopsins display type-specific conserved gene structures.
Maximum Likelihood tree of opsin protein sequences (IQ-TREE, LG+F+R8). Labeled nodes have support values of SH-like approximate likelihood ratio test (blue dot) and ultrafast bootstrap ≥0.9 (purple dot), approximate Bayes test ≥0.98(yellow dot), and a posterior probability ≥0.95 (black dot) in a parallel Bayesian analysis (Phylobayes, DS-GTR + G, consensous of two out of three chains, 90,000 cycles). Intron positions (colored bars) are mapped on the un-curated protein sequence alignment, and introns conserved in position and phase are highlighted by bars spanning several sequences and labels for the intron position. The sequences investigated in this study are highlighted in blue. The xenopsins of M. fuliginosus and T. inopinata display xenopsin type gene structures. The c-opsin of M. fuliginosus groups with Platynereis dumerilii c-opsin going along with a corresponding gene structure. For r-opsins and tetraopsins gene structures are shown for A: Homo sapiens MELAN Q9UHM6, B: Apis mellifera UV opsin AAC47455.1, C: Limulus polyphemus opsin-5-like XP 013785122.1, and D: Homo sapiens OPN5 Q6U736. See Figure 2—figure supplement 1 for un-collapsed ML tree, Figure 2—figure supplement 2 for un-collapsed Phylobayes tree, Figure 2—figure supplement 3 for the whole set of gene structures, Figure 2—figure supplement 4 for intron phases, Figure 2—figure supplement 5 for an unrooted tree of only xenopsins, Figure 2—figure supplement 6 for a tree of only xenopsins plus a few c-opsins as outgroup, Figure 2—figure supplement 7 for a tree of xenopsins only plus a few cnidops as outgroup, Figure 2—figure supplement 8 for a tree of xenopsins only plus a few c-opsins and cnidops as outgroup and Figure 2—source data 1 for gene accession numbers.
-
Figure 2—source data 1
Accession numbers of the genes used for gene tree inference.
- https://cdn.elifesciences.org/articles/55193/elife-55193-fig2-data1-v2.xlsx
Figure 2—figure supplement 1
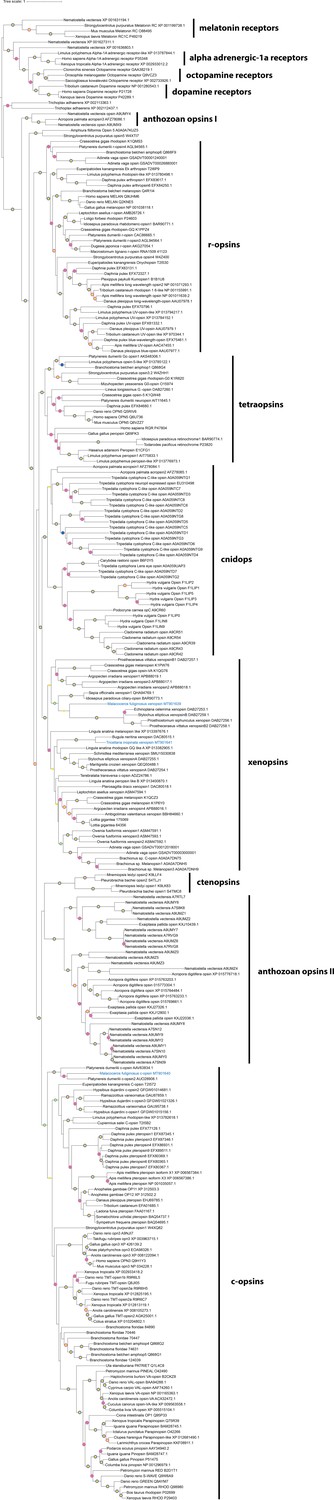
Un-collapsed tree of phylogeny shown in Figure 2.
Maximum Likelihood tree (IQ-TREE, LG+F+R8). Labeled nodes have support values of approximate Bayes test ≥0.98 (yellow dot), SH-like approximate likelihood ratio test ≥90 (blue dot) and ultrafast bootstrap ≥90 (purple dot). The sequences investigated in this study are highlighted in blue.
Figure 2—figure supplement 2
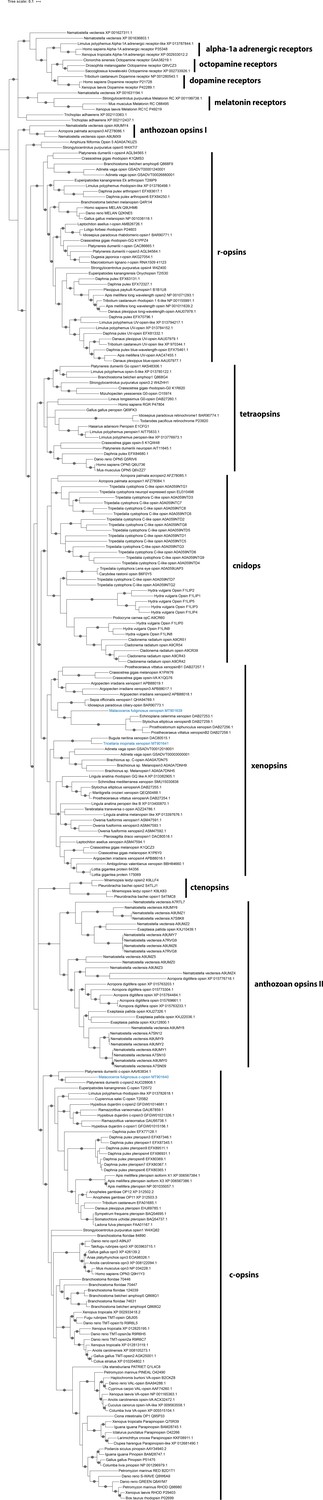
Bayesian analysis (Phylobayes) of sequence alignment used in Figure 2.
Parametric Γ modeling of the dataset specific substitution matrix (DS-GTR) generated by Vöcking et al., 2017. Consensus tree of two out three chains (90.000 cycles, burn-in 18.000, mean difference 0.079). Labeled nodes have support values of posterior probability ≥0.95 (black dot). The sequences investigated in this study are highlighted in blue.
Figure 2—figure supplement 3
Gene structures of all sequences, which were used for gene tree calculation and for which genomic information was available or generated in this study, mapped on the un-curated protein sequence alignment.
The sequences investigated in this study are highlighted in blue.
Figure 2—figure supplement 4
Intron phase and position of all sequences, which were used for gene tree calculation and for which genomic information was available or generated in this study, mapped on the un-curated protein sequence.
The sequences investigated in this study are highlighted in blue.
Figure 2—figure supplement 5
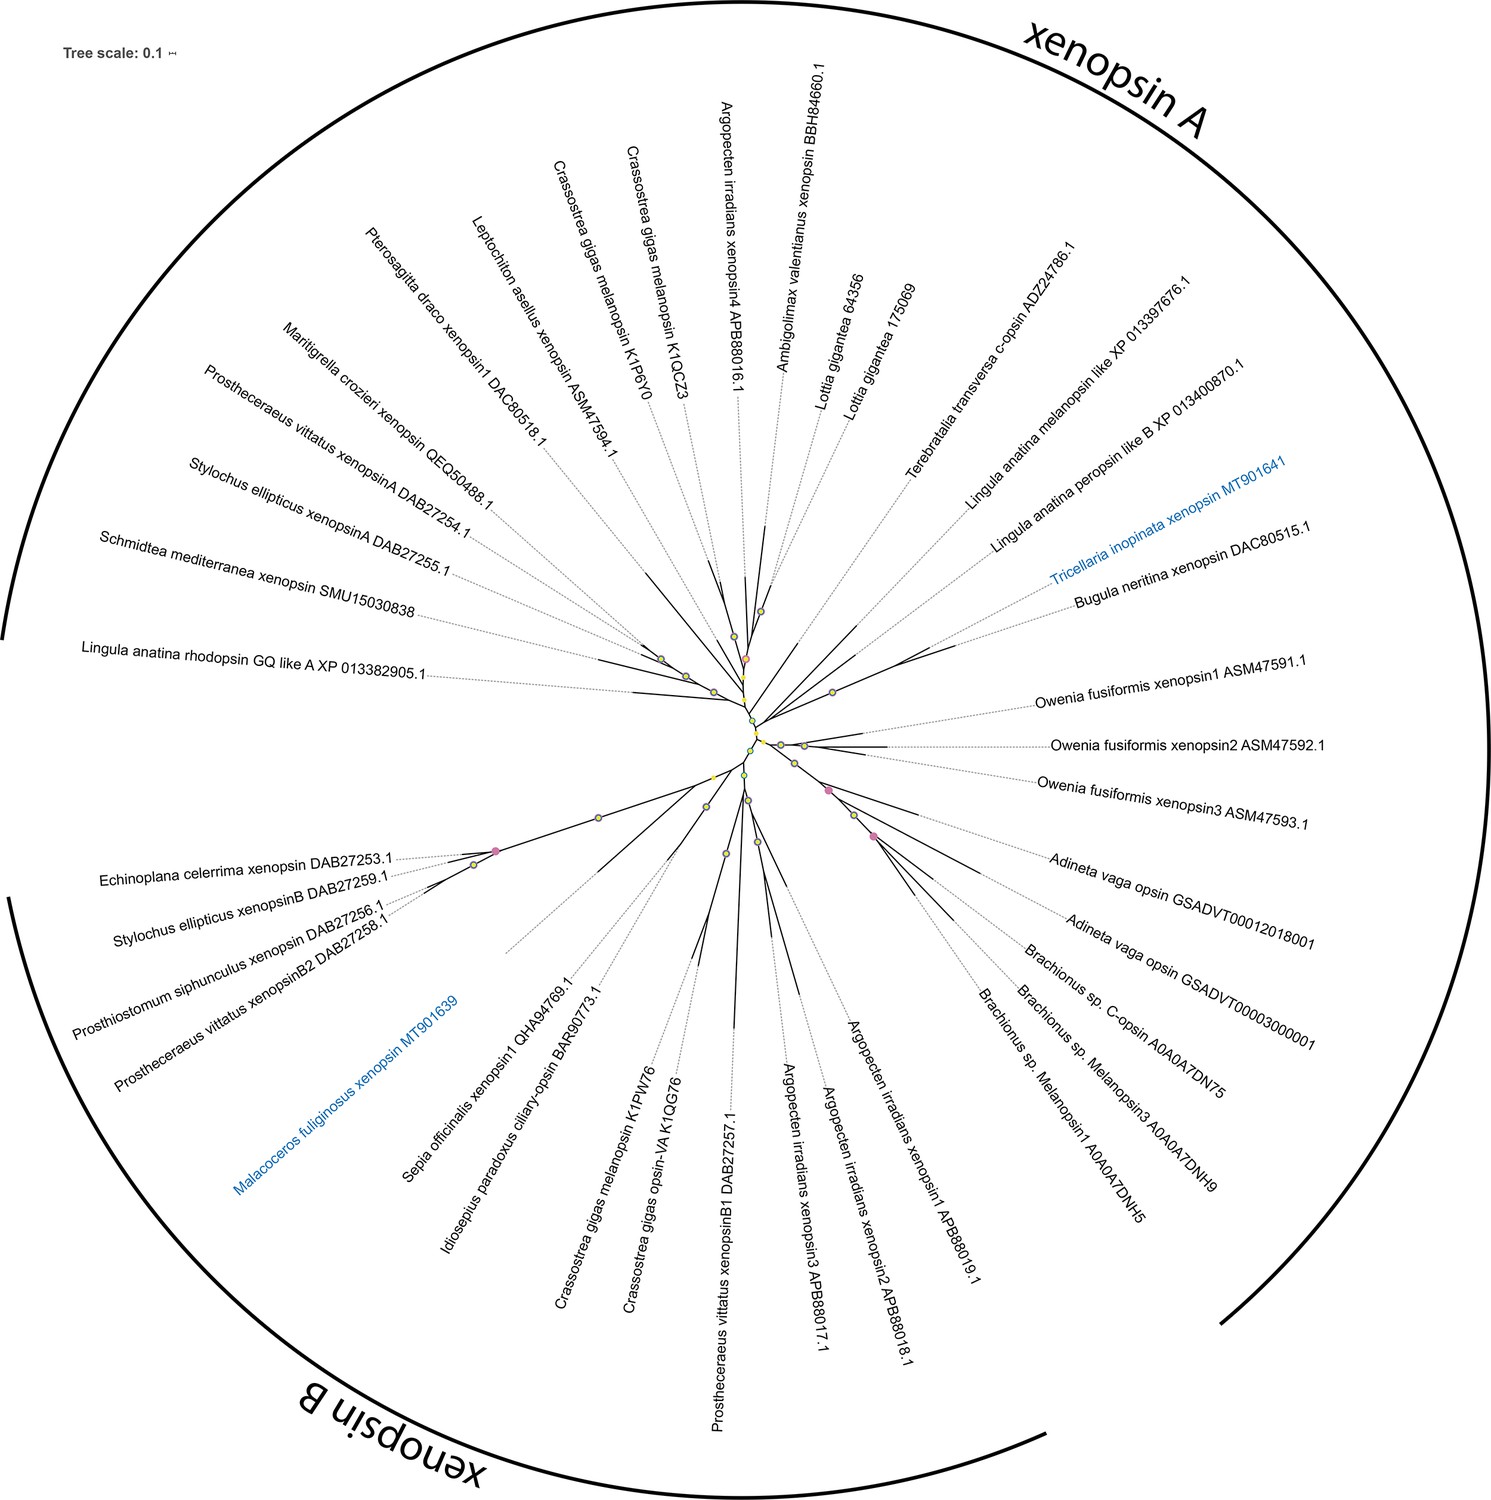
Unrooted xenopsin tree.
Maximum Likelihood analysis (IQ-TREE, LG+F+I+G4). Labeled nodes have support values of approximate Bayes test ≥0.98 (yellow dot), SH-like approximate likelihood ratio test ≥90 (blue dot), and ultrafast bootstrap ≥90 (purple dot). The sequences investigated in this study are highlighted in blue.
Figure 2—figure supplement 6
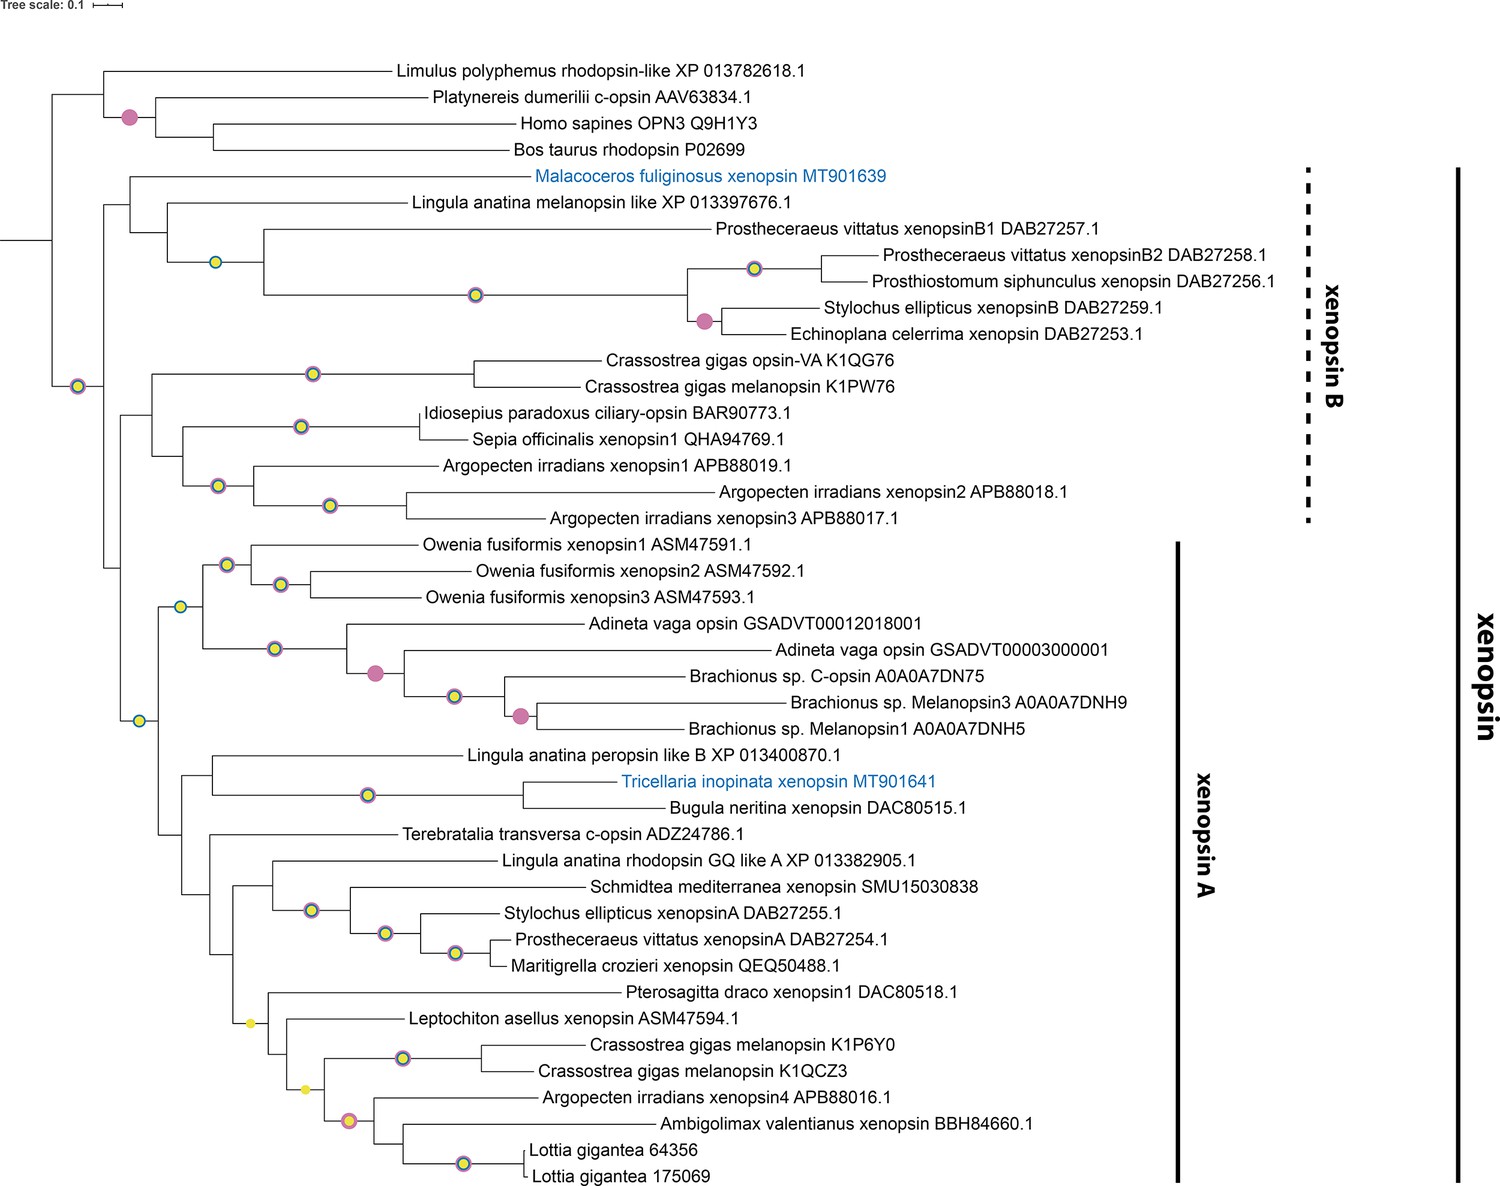
Xenopsin tree rooted with few c-opsins.
Maximum Likelihood analysis (IQ-TREE, LG+F+I+G4). Labeled nodes have support values of approximate Bayes test ≥0.98 (yellow dot), SH-like approximate likelihood ratio test ≥90 (blue dot), and ultrafast bootstrap ≥90 (purple dot). The sequences investigated in this study are highlighted in blue.
Figure 2—figure supplement 7
Xenopsin tree rooted with few cnidops.
Maximum Likelihood analysis (IQ-TREE, LG+F+I+G4). Labeled nodes have support values of approximate Bayes test ≥0.98 (yellow dot), SH-like approximate likelihood ratio test ≥90 (blue dot), and ultrafast bootstrap ≥90 (purple dot). The sequences investigated in this study are highlighted in blue.
Figure 2—figure supplement 8
Xenopsin tree rooted with few c-opsins and cnidops.
Labeled nodes have support values of approximate Bayes test ≥0.98 (yellow dot), SH-like approximate likelihood ratio test ≥90 (blue dot), and ultrafast bootstrap ≥90 (purple dot). The sequences investigated in this study are highlighted in blue.
Figure 3 with 1 supplement
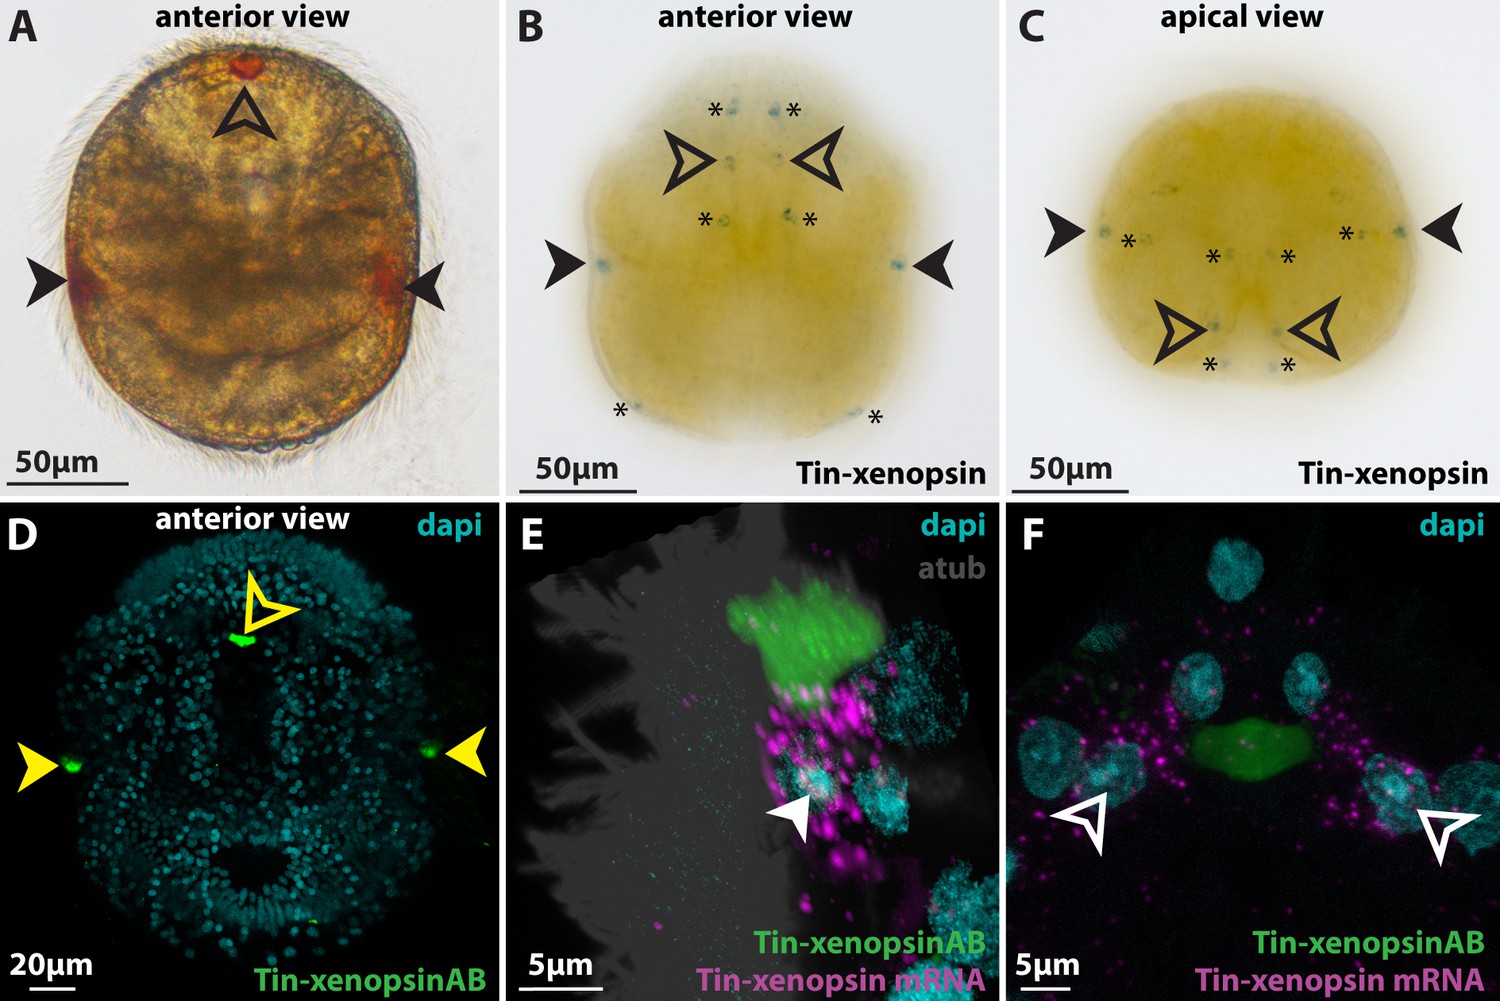
Xenopsin expression in Tricellaria inopinata.
(A) Anterior view of a larva showing the pigment spots of the paired lateral eyes (filled arrowheads) and the single median eye (outlined arrowheads). (B,C) WMISH of Tin-xenopsin. Maximum projections of z-stacks spanning the whole larva. Single spots are labeled in the positions of the lateral eyes and two spots in the position of the single median eye. Several cells not associated with shielding pigment (asterisks) are also labeled. (D) Anti Tin-xenopsin antibody labels only the eyespot regions (filled yellow arrowheads: lateral eyes, outlined yellow arrowhead: median eye). (E,F) Combination of ISH and IHC. (E) Lateral eye. Tin-xenopsin antibody localizes adjacent to the mRNA around the nucleus of the eye photoreceptor cell (filled white arrowhead). (F) Median eye. Tin-xenopsin antibody localizes between a left and a right photoreceptor cell (outlined white arrowheads). See Figure 3—figure supplement 1 for details on Tin-xenopsin expression in extraocular cells.
Figure 3—figure supplement 1
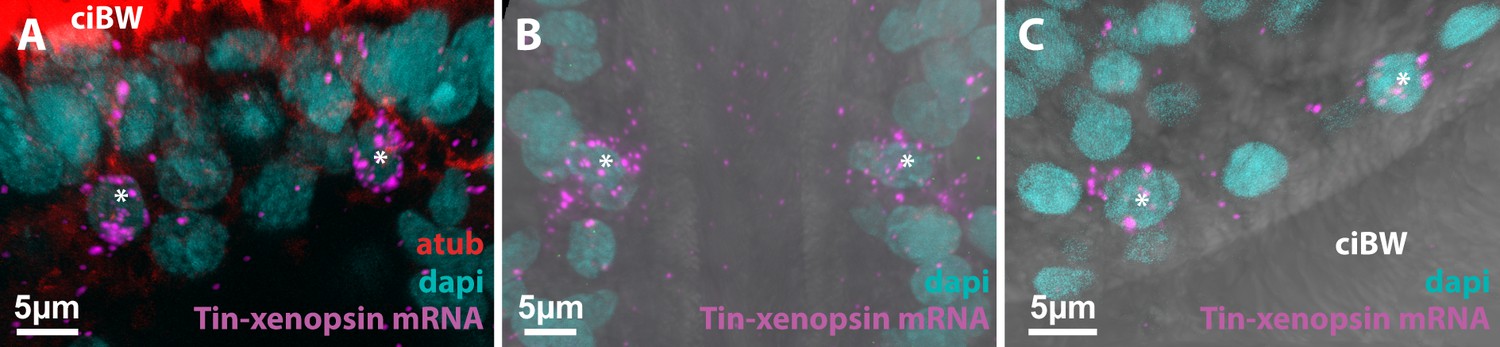
Expression of Tin-xenopsin in cells not associated with shielding pigment (asterisks).
FISH combined with antibody staining against acetylated alpha-tubulin (atub) and DAPI nuclear dye. (A) Close to the apical organ. (B) At the edge of the anterior ciliary groove. (C) At the opening of the internal sack. Cell bodies expressing xenopsin are labeled with asterisks. ciBW: body wall cilia.
Figure 4 with 3 supplements

Subcellular localization of xenopsin in the lateral eye of Tricellaria inopinata.
(A,B) Electron microscopic images (cryofixation) showing the photoreceptor cell (PRC) sending numerous cilia (ciPRC) into the eye invagination. The cilia possess basal bodies (white asterisks) and vertical (vr) and horizontal (hr) rootlets. Shielding pigment vesicles (black arrowheads) are present in the PRC and the adjacent pigmented coronal cells (PCC1, PCC2). Inset in B: cross-section of eye PRC cilia (chemical fixation) showing the 9 × 2 +2 organization of the axoneme. (C–F) IHC labeling of Tin-xenopsin and acetylated alpha-tubulin. Same orientation as in (A,B). Tin-xenopsin protein localizes within the cilia projecting into the eye invagination of the eye PRC. The basal bodies (white asterisks) are visible inside the eye PRC. ciBW: cilia of the body wall, cu: cuticle, nuPRC: nucleus of the photoreceptor cell. See Figure 4—figure supplement 1 for Tin-xenopsin localization in the median eye, Figure 4—figure supplement 2 for the cellular composition of the lateral eye, and Figure 4—figure supplement 3 for differences in the appearance of shielding pigment granules between chemical and cryofixation.
Figure 4—figure supplement 1
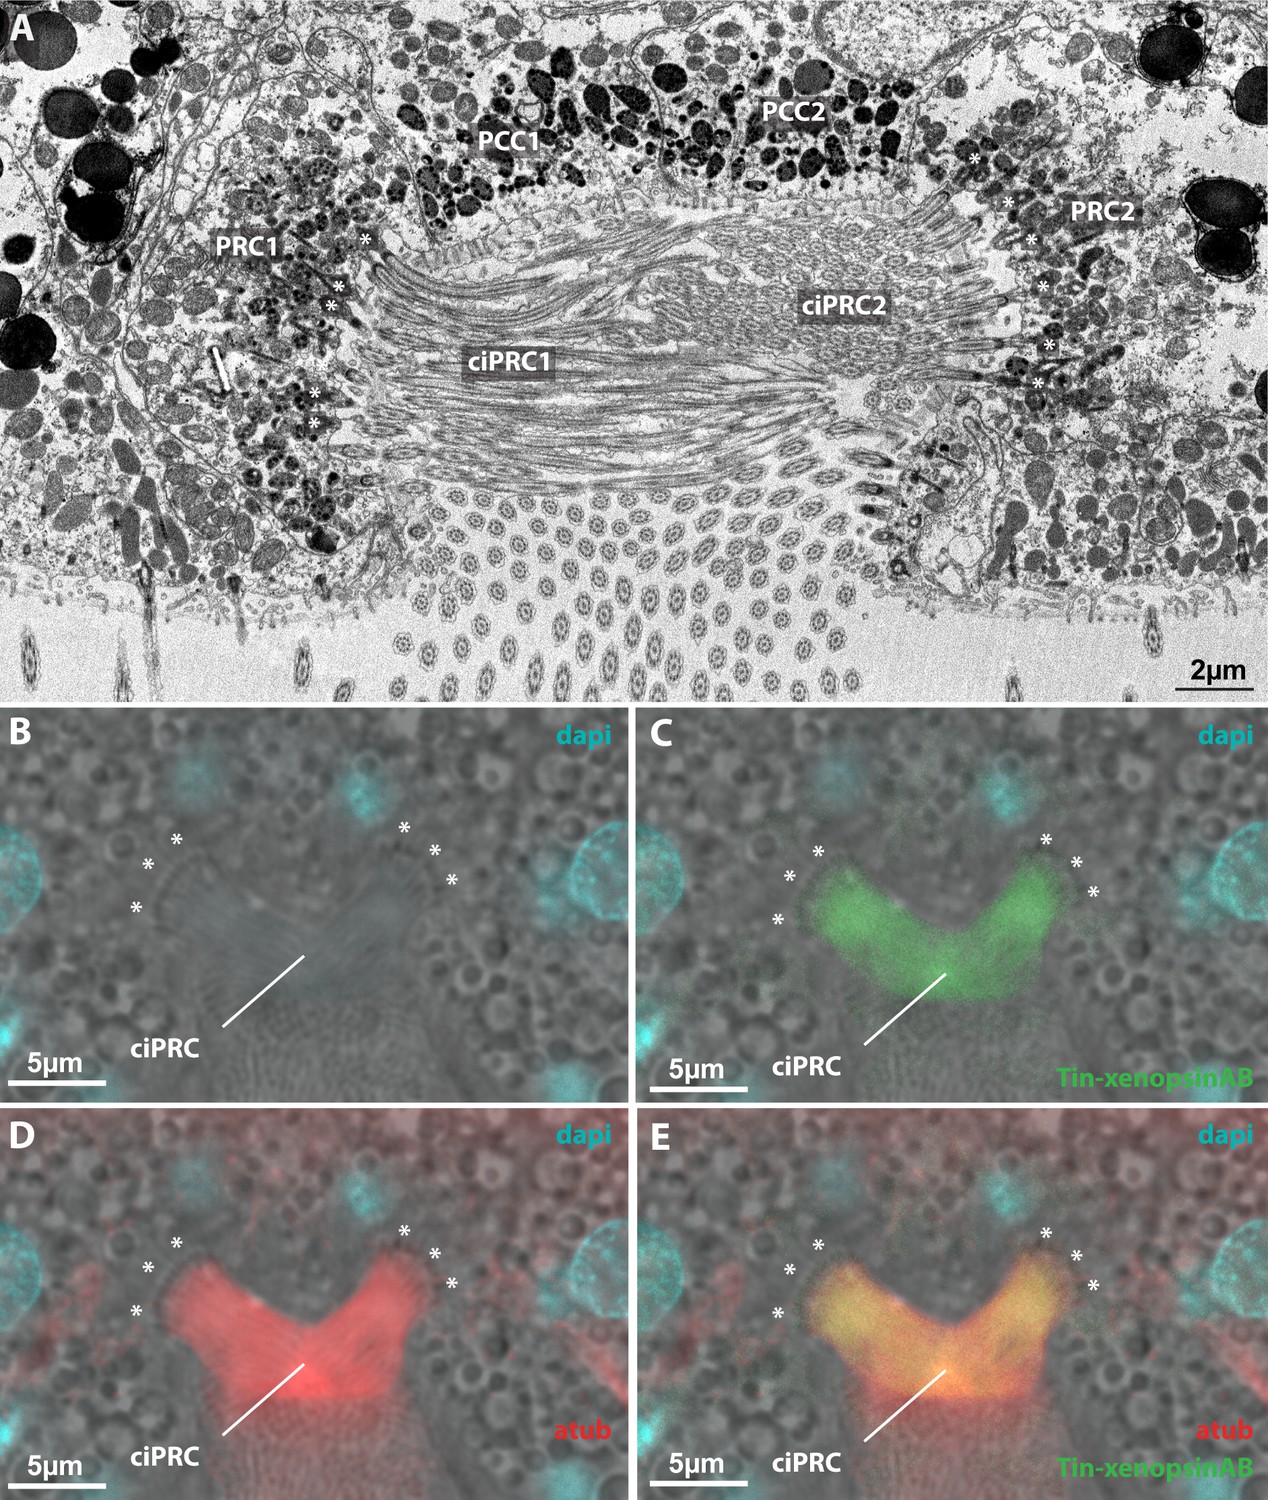
Subcellular localization of xenopsin in the median eye of Tricellaria inopinata.
(A) Electron microscopic images (chemical fixation) showing two photoreceptor cell1 (PRC1, PRC2) on the lateral sides of the eye invagination. Two pigmented coronal cells (PCC1, PCC2) line the bottom of the invagination. PRC1 and PRC2 send numerous cilia (ciPRC1, ciPRC2) into the lumen of the invagination. The cilia of the PRCs possess basal bodies (white asterisks) and rootlets. (B–E) IHC labeling of Tin-xenopsin and acetylated alpha-tubulin. Same orientation as in (A). Tin-xenopsin protein localizes within cilia projecting from lateral cells into the eye invagination. The basal bodies (white asterisks) are visible inside the eye PRCs.
Figure 4—figure supplement 2
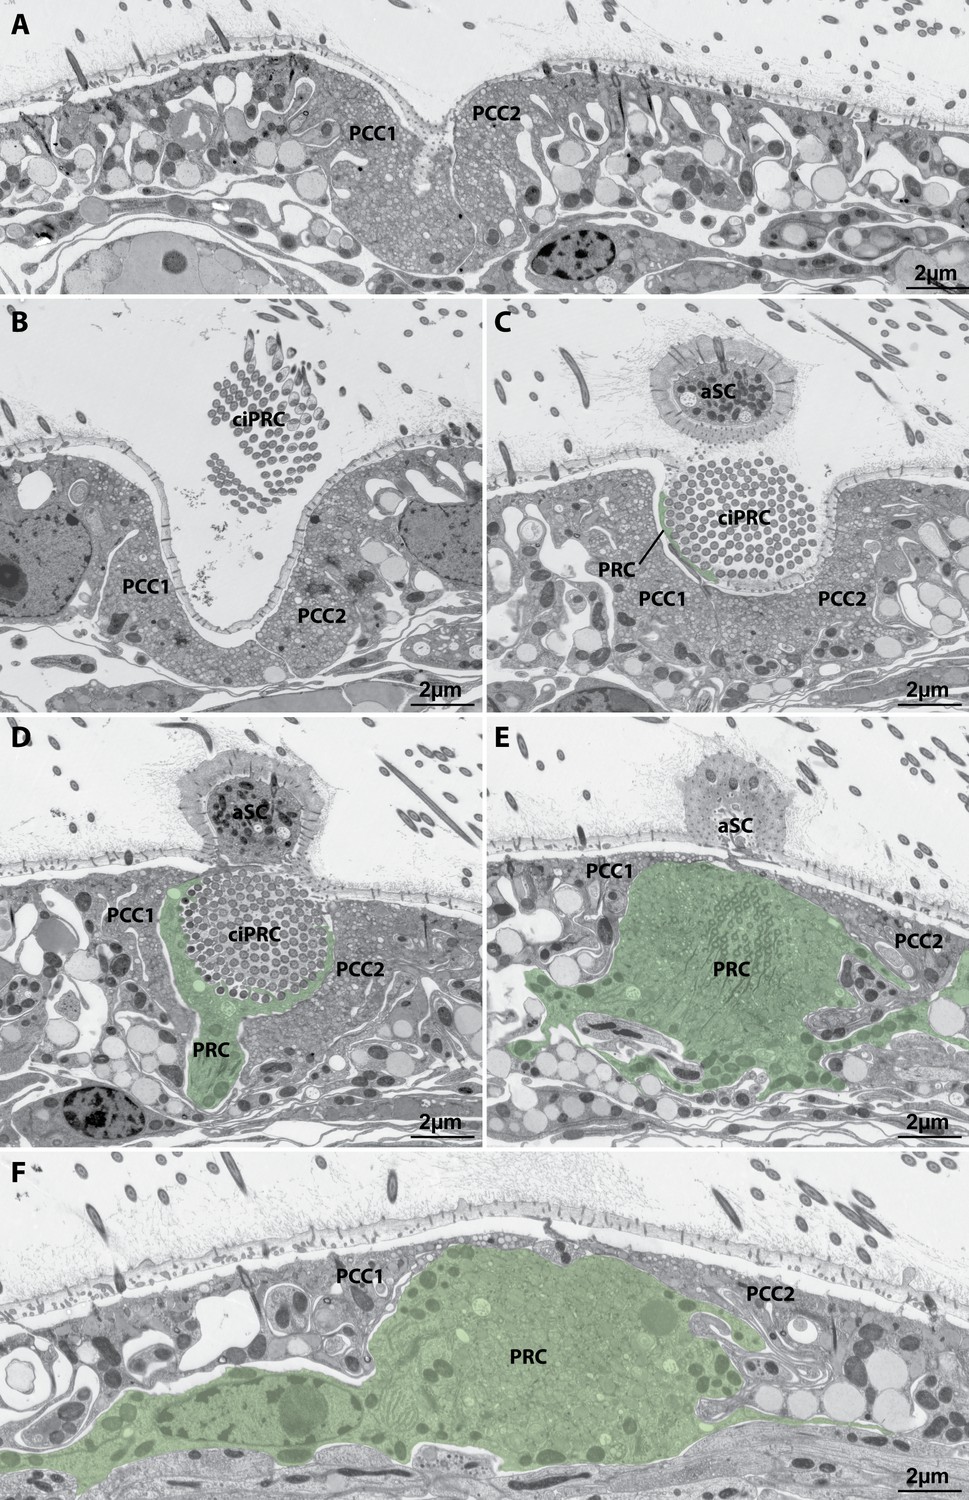
Organization of the lateral larval eye of Tricellaria inopinata.
Serial sections (apical view) from apical (A) to abapical (F). The two pigmented coronal cells (PCC1, PCC2) do not bear cilia in the region of the eye invagination and line the apical and lateral walls of the invagination. The cilia (ciPRC) of the photoreceptor cell (PRC, green overlay) project into the eye invagination and form a bundle extending above the surface of the larva. An adjacent sensory cell (asC) forms a pillar-like elevation abapical of the eye invagination.
Figure 4—figure supplement 3
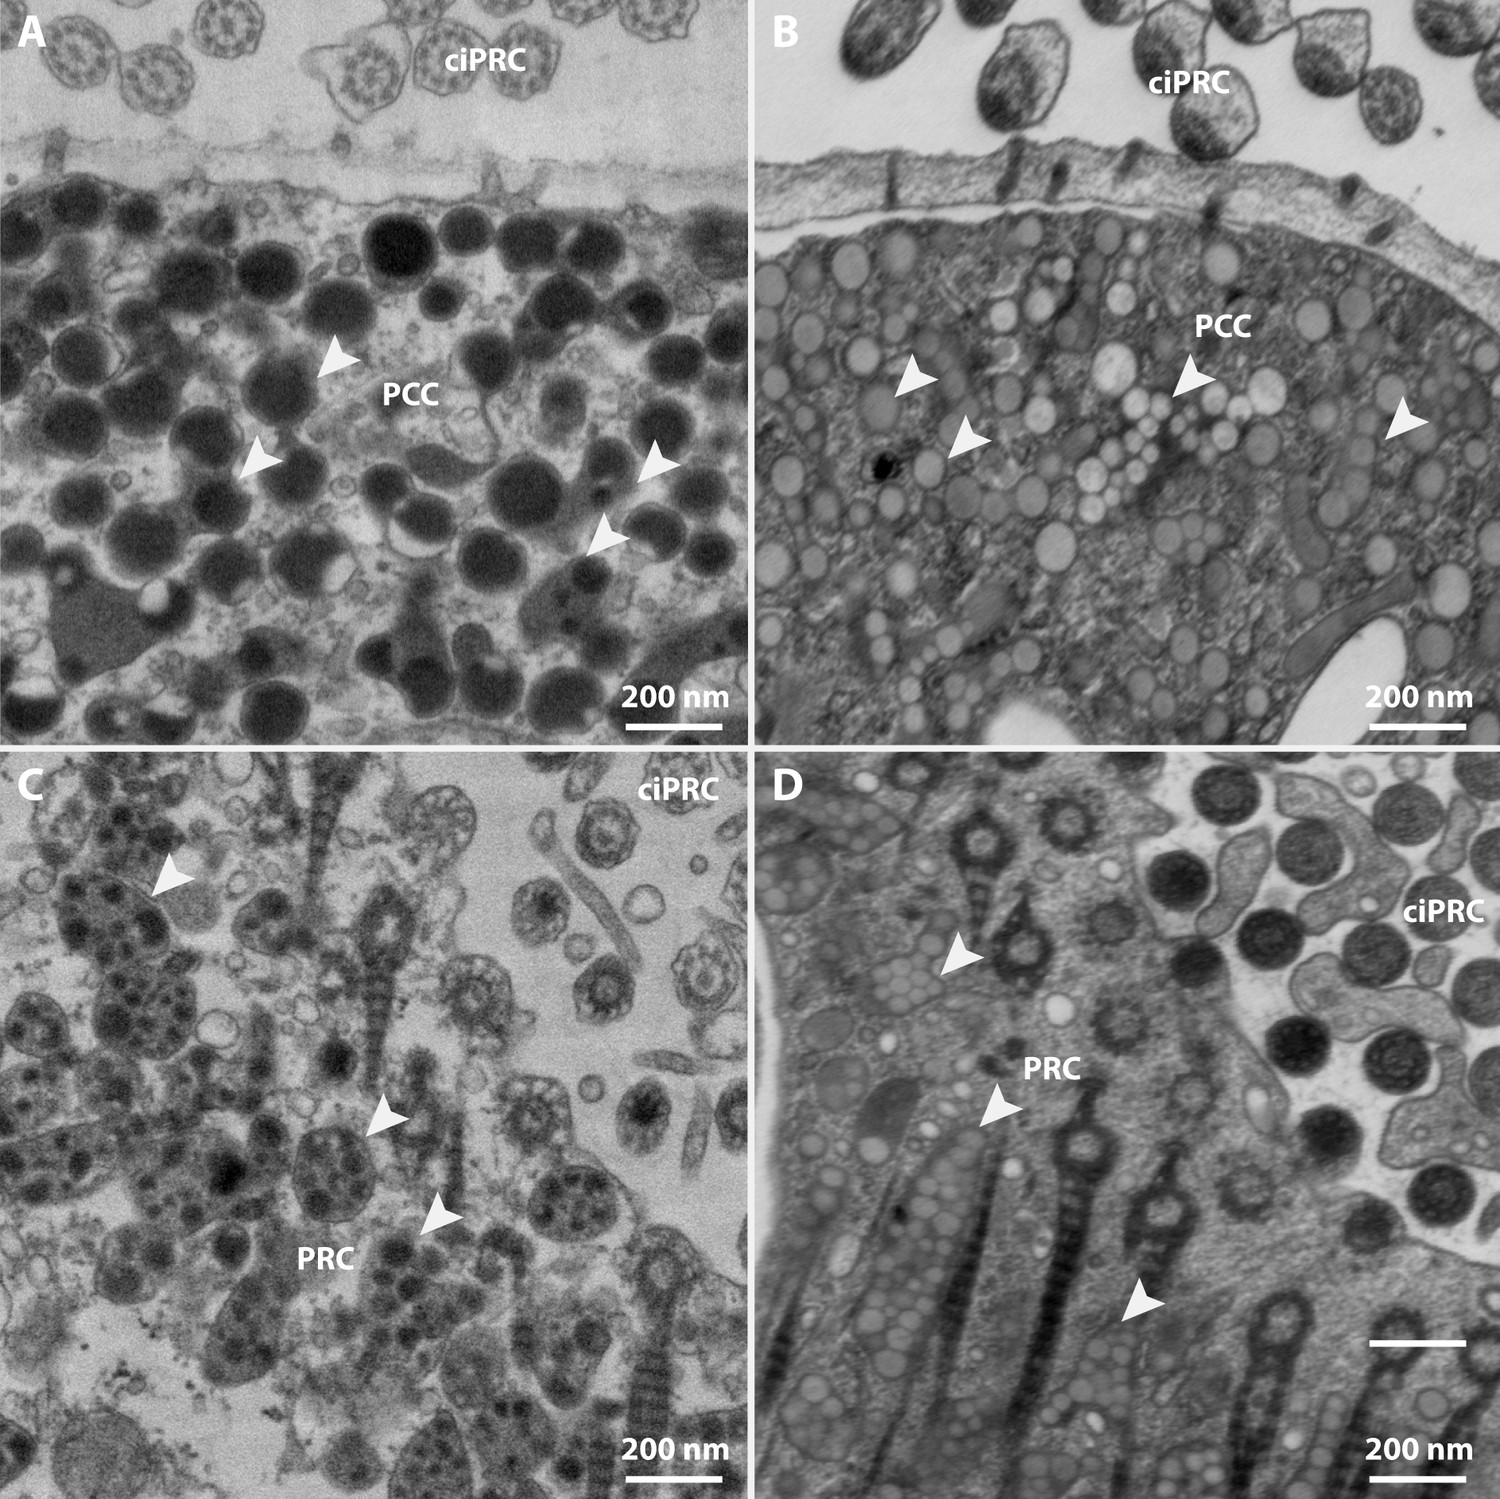
Appearance of shielding pigment granules in the lateral eye of Tricellaria inopinata.
Shielding pigment granules (white arrowheads) appear electron-dense after chemical (A,C) and rather electron-lucent after cryofixation (B,D) in both the photoreceptor cell (PRC) and the pigmented coronal cells (PCC) in the eye invagination. ciPRC: photoreceptor cell cilia.
Figure 5 with 1 supplement
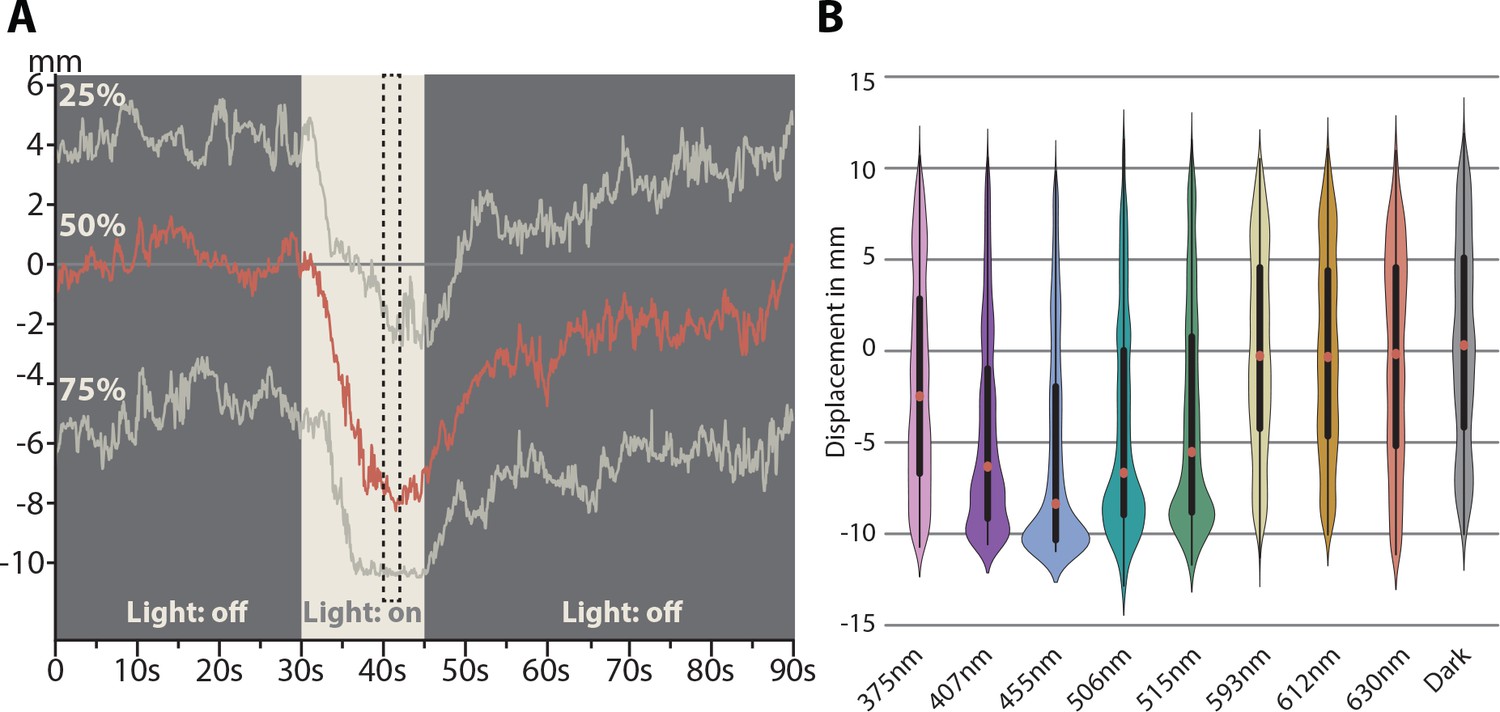
Spectral response of Tricellaria inopinata larvae.
(A) One-dimensional displacement of larvae during stimulation with blue (454 nm) light. Each recording started with no stimulus for 30 s. Afterwards, the light stimulus was activated for 15 s, followed by another 45 s in darkness. To generate violin plots, all tracked positions during a time of guaranteed illumination were used (seconds 40 to 42, dashed box). (B) Violin plot of the spectral response of the larvae. The animals show the greatest displacement under blue light (454 nm). Within the green and violet spectrum, the animals still respond positively, but further in the ultraviolet and wavelength beyond yellow (593 nm) only weak reactions were detectable. Violin plots based on videos containing between 50 to 230 animals each: 375 nm n = 5; 407 nm n = 4; 455 nm n = 5; 506 nm n = 8; 515 nm n = 13; 593 nm n = 4; 612 nm n = 3; 630 nm n = 3; Dark n = 3. See Figure 5—figure supplement 1 for violin plots of each individual experiment, Figure 5—source data 1 for raw data of graph in A and Figure 5—source data 2 for raw data for the graph in B.
-
Figure 5—source data 1
Raw data of behavioral experiment on larval displacement during stimulation with blue light.
- https://cdn.elifesciences.org/articles/55193/elife-55193-fig5-data1-v2.xlsx
-
Figure 5—source data 2
Raw data of behavioral experiments on the spectral response of the larva.
- https://cdn.elifesciences.org/articles/55193/elife-55193-fig5-data2-v2.xlsx
Figure 5—figure supplement 1
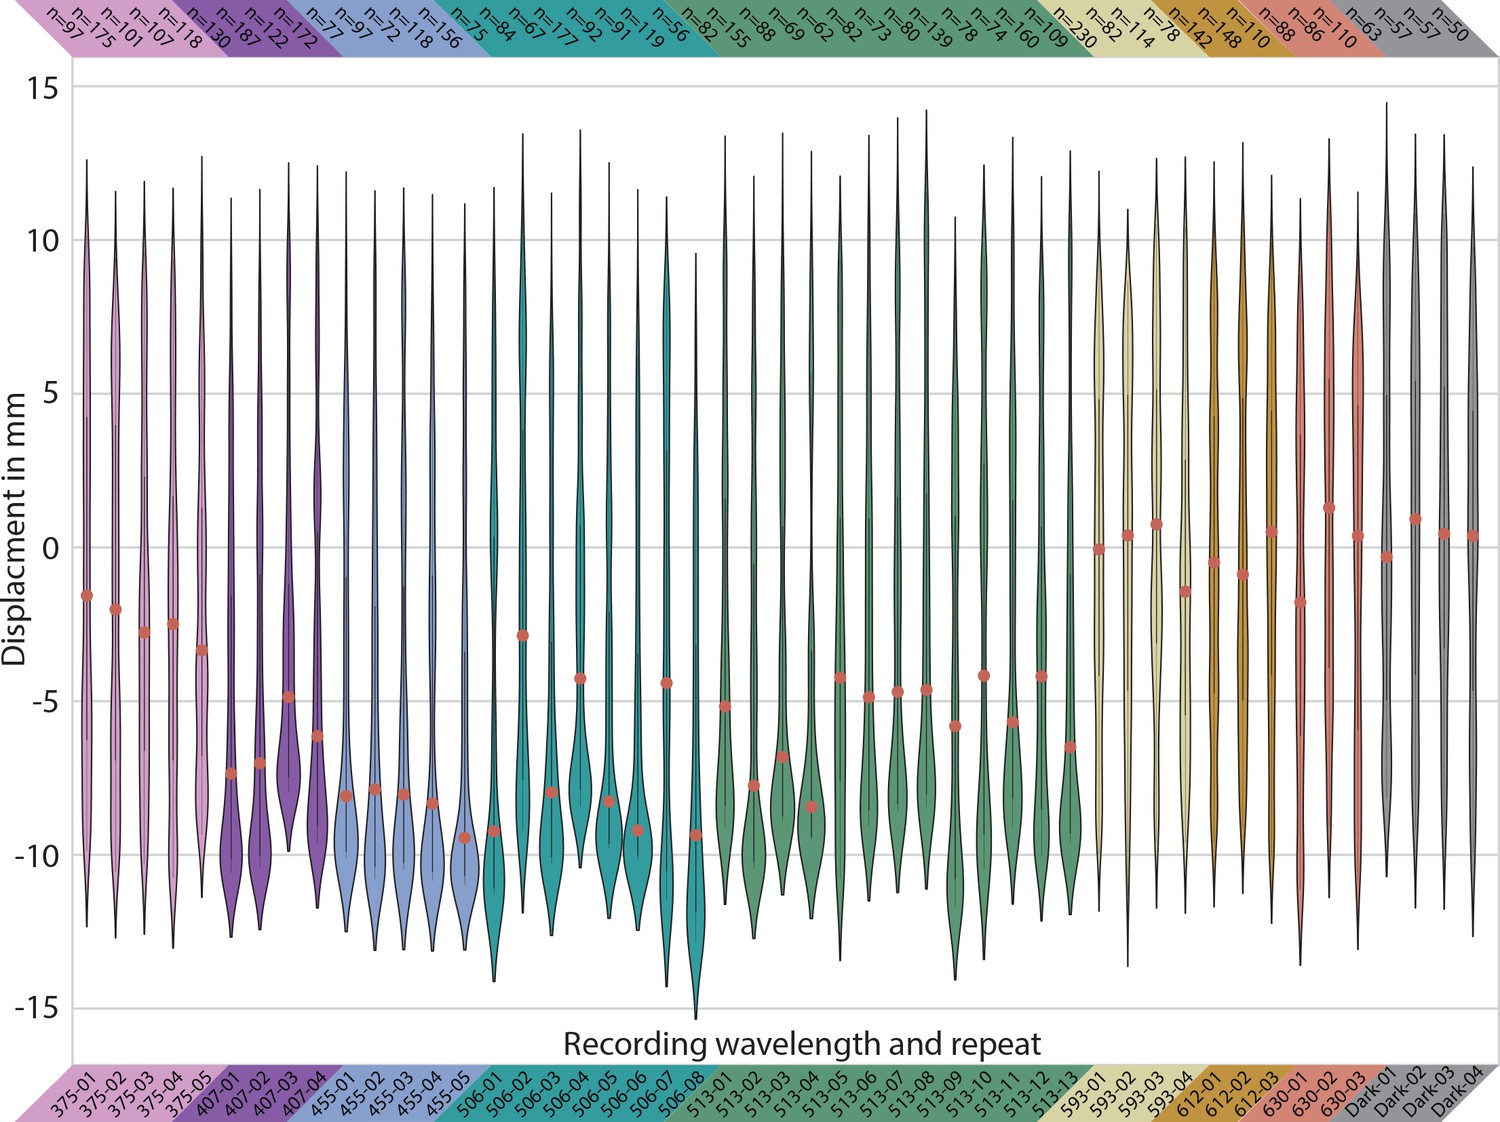
Spectral response of the larvae.
Violin plots of all individual experiments.
Figure 6 with 1 supplement
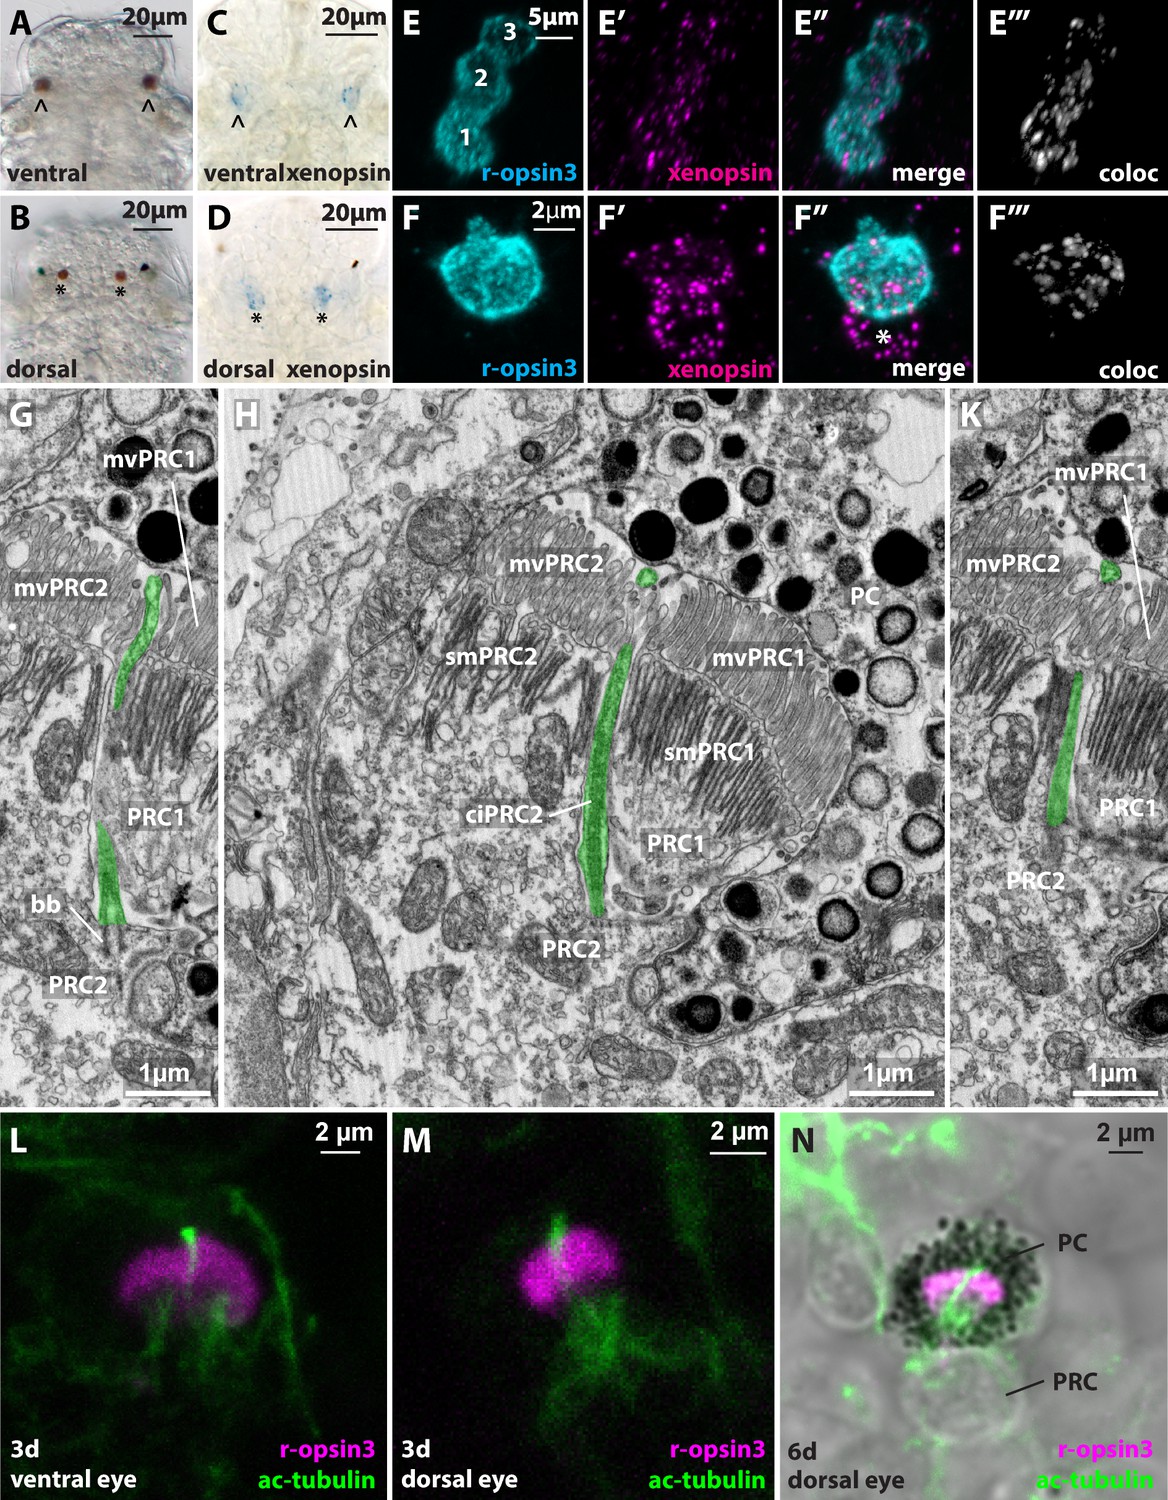
Xenopsin in the dorsal and ventral eyes of Malacoceros fuliginosus.
(A,B) Light micrographs of ventral (arrowhead) and dorsal (asterisk) microvillar eyes at 48 hpf. (C,D) WMISH of Mfu-xenopsin in the ventral (arrowhead) and dorsal (black asterisk) eyes. (E–F’’’) Double FISH of Mfu-xenopsin and Mfu-r-opsin3. Mfu-xenopsin co-localizes with Mfu-r-opsin3 in all three PRCs of the ventral eye (E’’’). Numbers indicate the PRCs in the order of their development. (F–F’’’) Mfu-xenopsin and Mfu-r-opsin3 colocalization in the dorsal eye PRC (F’’’). Mfu-xenopsin is also expressed in an adjacent cell (white asterisk). (G–K) Ultrastructure of the second ventral eye photoreceptor cell (PRC2) depicting the cilium (ciPRC2, highlighted in green). (L–N) Antibody labeling against Mfu-r-opsin3 and acetylated alpha-tubulin reveals a prominent cilium emerging in between the r-opsin3+ microvilli in both the ventral and the dorsal eye. bb: basal body; mvPRC1: microvilli of PRC1; mvPRC2: microvilli of PRC2; PRC1: first PRC; smPRC1: submicrovillar cisternae of PRC1; smPRC2: submicrovillar cisternae of PRC2.
Figure 6—figure supplement 1
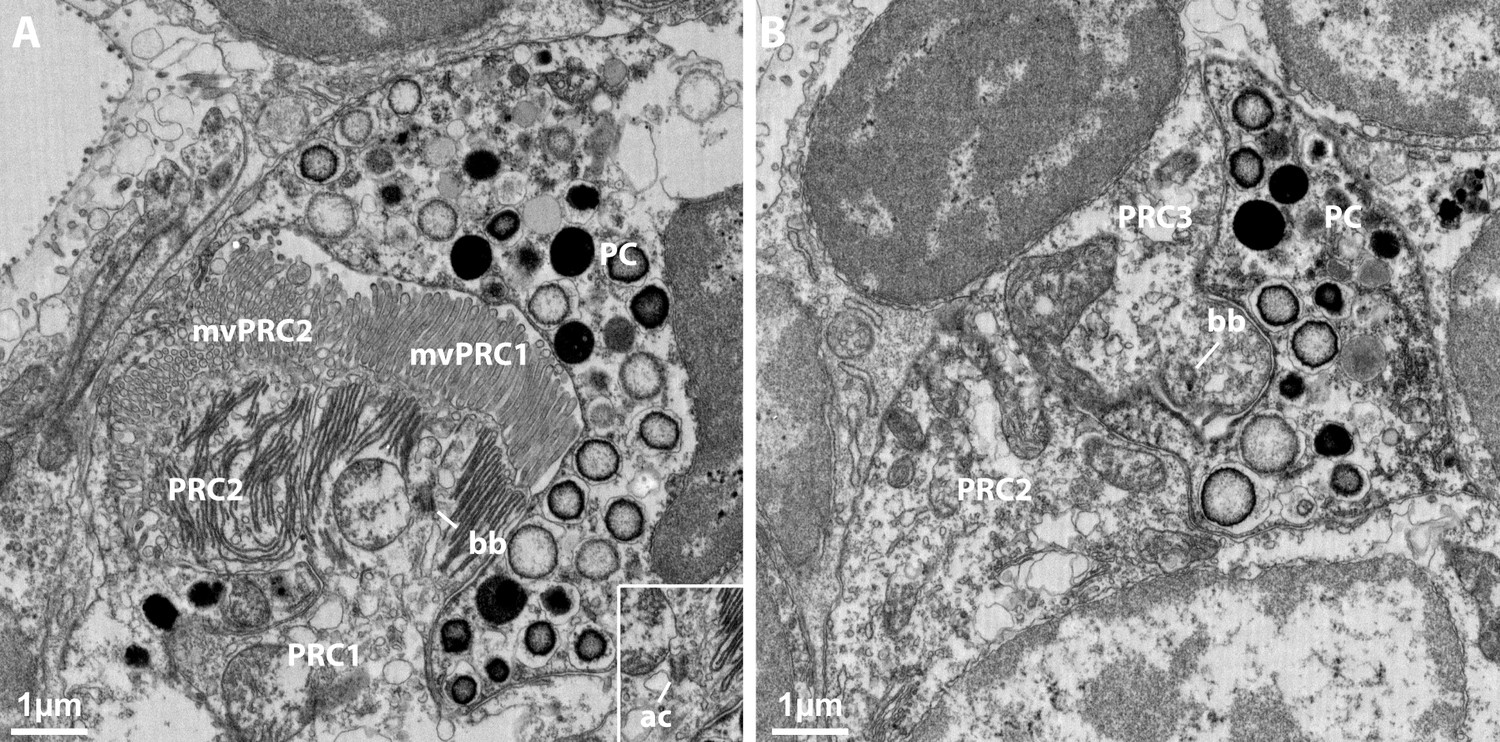
The first (PRC1) and third (PRC3) photoreceptor cell of the ventral eye of Malacoceros fuliginosus bear no cilia, but exhibit basal bodies (bb) close to the apical surface.
(A) First photoreceptor cell. An accessory centriole (ac in inlet) lies close to the basal body in another layer (B) Third photoreceptor cell. mvPRC1: sensory microvilli of PRC1. mvPRC2: sensory microvilli of PRC2. PC: pigmented cell. PRC2: second photoreceptor cell.
Figure 7
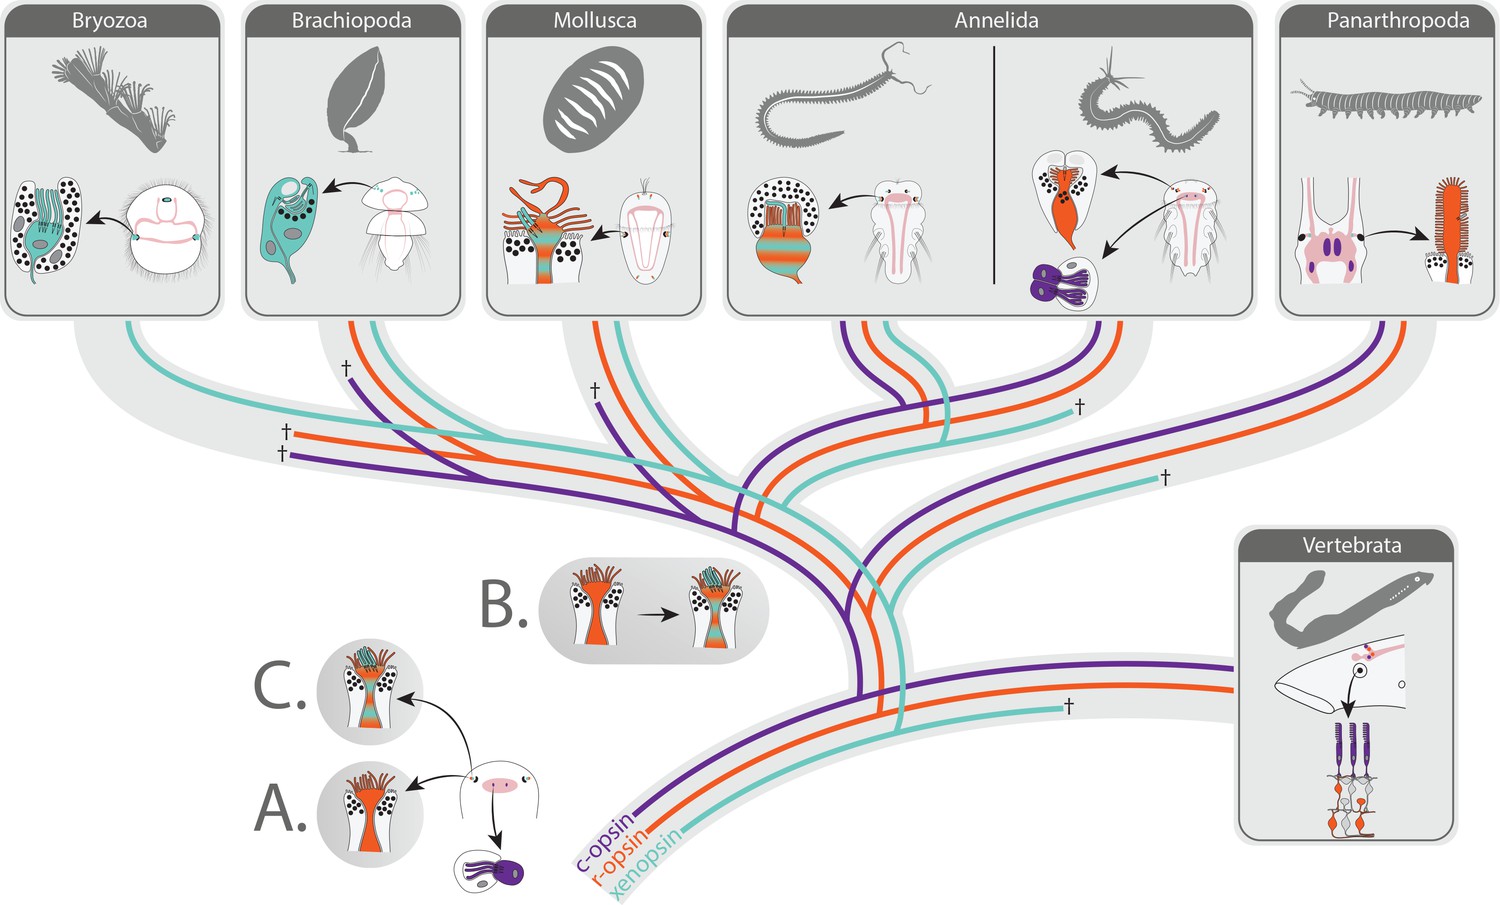
Scenarios on eye PRC evolution in Bilateria.
The bilaterian ancestor had extraocular c-opsin+ ciliary PRCs. These became integrated into the eyes in the lineage leading to vertebrates and were lost in many protostomes along with secondary loss of c-opsin. Scenario A: Cerebral eyes contained microvillar r-opsin+ PRCs in the bilaterian ancestor. Xenopsin was co-opted several times independently by microvillar PRCs, and eye PRCs were several times independently transformed into or replaced by ciliary xenopsin+ PRCs. Scenario B: Ancestral r-opsin+ microvillar eye PRCs were transformed once into mixed microvillar/ciliary PRCs coexpressing r-opsin and xenopsin. In extant organisms, those were retained or changed into purely microvillar r-opsin+ or ciliary xenopsin+ PRCs going along with genomic loss or downregulation of xenopsin or r-opsin, respectively. Scenario C: Mixed ciliary/microvillar PRCs were already present in the bilaterian ancestor.
Tables
Key resources table
| Reagent type (species) or resource | Designation | Source or reference | Identifiers | Additional information |
|---|---|---|---|---|
| Gene (Tricellaria inopinata) | Xenopsin | Genbank | MT901641 | |
| Gene (Malacoceros fuliginosus) | Xenopsin | Genbank | MT901639 | |
| Gene (Malacoceros fuliginosus) | Ciliary opsin | Genbank | MT901640 | |
| Strain, strain background (Malacoceros fuliginosus) | Wild type | University of Bergen, Sars Centre for Marine Molecular Biology | NCBITaxon: 271776 | |
| Antibody | mouse monoclonal anti-acetylated α-tubulin IgG1 | Sigma-Aldrich | RRID:AB_609894 | Dilution 1:300 (Mfu) 1:50 (Tin) |
| Antibody | Rat polyclonal anti-Mfu-r-opsin3 IgG | University of Bergen, Sars Centre for Marine Molecular Biology | 1:100 | |
| Antibody | Rabit polyclonal anti-Tin-xenopsin IgG | University of Bergen, Sars Centre for Marine Molecular Biology | 1:500 | |
| Antibody | Alexa Fluor 633 goat monoclonal anti-rat IgG | ThermoFisher Scientific | RRID:AB_2535749 | 1:500 |
| Antibody | Alexa Fluor 488 goat momoclonal anti-mouse IgG | ThermoFisher Scientific | RRID:AB_2535764 | 1:500 |
| Recombinant DNA reagent | PGem-T-Tin-xenops (plasmid) | University of Bergen, Sars Centre for Marine Molecular Biology | Used for synthesizing WMISH probes | |
| Recombinant DNA reagent | PGem-T-Mfu-xenops (plasmid) | University of Bergen, Sars Centre for Marine Molecular Biology | Used for synthesizing WMISH probes | |
| Recombinant DNA reagent | PGem-T-Mfu-cops (plasmid) | University of Bergen, Sars Centre for Marine Molecular Biology | Used for synthesizing WMISH probes | |
| Sequence-based reagent | Mfu-xenops-WMISH forward primer (5’- > 3’) | University of Bergen, Sars Centre for Marine Molecular Biology | 5’-CACCATCATGTTGAATAATGACTCCTACTC-3’ | |
| Sequence-based reagent | Mfu-xenops-WMISH reverse primer (5’- > 3’) | University of Bergen, Sars Centre for Marine Molecular Biology | 5’-GATTCGTGGAATGCTGATTTGTGAC-3’ | |
| Sequence-based reagent | Mfu-cops-WMISH forward primer (5’- > 3’) | University of Bergen, Sars Centre for Marine Molecular Biology | 5’-ATCACACAGGATATCACAAATGCCTCAG-3’ | |
| Sequence-based reagent | Mfu-cops-WMISH reverse primer (5’- > 3’) | University of Bergen, Sars Centre for Marine Molecular Biology | 5’-GCAATAACGATGTCACCTGGACATTG-3’ | |
| Sequence-based reagent | Tin_xenopsin-WMISH forward primer (5’- > 3’) | University of Bergen, Sars Centre for Marine Molecular Biology | 5’-CTTATGGTCATTGCTGT-3’ | |
| Sequence-based reagent | Tin_xenopsin-WMISH reverse primer (5’- > 3’) | University of Bergen, Sars Centre for Marine Molecular Biology | 5’-CACCCTGCCATTAGTC-3’ | |
| Sequence-based reagent | Tin_xenopsin-WMISH forward nested primer (5’- > 3’) | University of Bergen, Sars Centre for Marine Molecular Biology | 5’-TGGGGGTTGTTTTGGTCGT-3’ | |
| Sequence-based reagent | Tin_xenopsin-WMISH reverse nested primer (5’- > 3’) | University of Bergen, Sars Centre for Marine Molecular Biology | 5’-CTGTTGCCTTCTTCTCTCGT-3’ | |
| Commercial assay or kit | Superscript III First-Strand Synthesis System | ThermoFisher Scientific | Catalog number: 18080051 | |
| Commercial assay or kit | RNeasy Mini Kit | Qiagen | Catalog number: 74104 | |
| Software, algorithm | IQ-TREE | http://www.iqtree.org/ | RRID:SCR_017254 | |
| Software, algorithm | Phylobayes-MPI | https://github.com/bayesiancook/pbmpi | RRID:SCR_006402 | |
| Software, algorithm | MAFFT 7 | https://mafft.cbrc.jp/alignment/server/ | RRID:SCR_011811 | |
| Software, algorithm | CLC Main Workstation | Qiagen | RRID:SCR_000354 | |
| Software, algorithm | ImageJ | NIH | RRID:SCR_003070 | |
| Software, algorithm | Imaris 8.41 | Bitplane | RRID:SCR_007370 |
Additional files
Download links
A two-part list of links to download the article, or parts of the article, in various formats.
Downloads (link to download the article as PDF)
Open citations (links to open the citations from this article in various online reference manager services)
Cite this article (links to download the citations from this article in formats compatible with various reference manager tools)
The visual pigment xenopsin is widespread in protostome eyes and impacts the view on eye evolution
eLife 9:e55193.
https://doi.org/10.7554/eLife.55193


