Secondary ossification center induces and protects growth plate structure
- Department of Physiology and Pharmacology, Karolinska Institutet, Sweden
- Department of Evolutionary Morphology, Schmalhausen Institute of Zoology of NAS of Ukraine, Ukraine
- Division of Anatomy, MIC, Medical University of Vienna, Austria
- Science for Life Laboratory and Uppsala University, Subdepartment of Evolution and Development, Department of Organismal Biology, Sweden
- Institute for Regenerative Medicine, Sechenov University, Russian Federation
- Department of Women’s and Children’s Health, Karolinska Institutet and Astrid Lindgren Children’s Hospital, Karolinska University Hospital, Sweden
- Semenov Institute of Chemical Physics, Russian Federation
- Division of Biological Sciences, University of California San Diego, United States
- Endocrine Unit, Department of Medicine, Massachusetts General Hospital and Harvard Medical School, United States
- Department of Theoretical Biology, University of Vienna, Austria
- Bone and Biomaterials Research, Center for Anatomy and Cell Biology, Medical University of Vienna, Austria
- Institute of Photonic Technologies, Research center "Crystallography and Photonics", Russian Federation
- Department of Cell and Molecular Biology, Karolinska Institutet, Sweden
- Department of Solid Mechanics, KTH Royal Institute of Technology, Sweden
- European Synchrotron Radiation Facility, France
- Department of Neuroscience, Karolinska Institutet, Sweden
- Chemistry Department, Lomonosov Moscow State University, Leninskiye Gory 1-3, Russian Federation
- Sorbonne Université – CR2P – MNHN, CNRS, UPMC, France
- Department of Neuroimmunology, Medical University of Vienna, Austria
- Department of Mechanics, KTH Royal Institute of Technology, Sweden
Figures
Figure 1 with 2 supplements
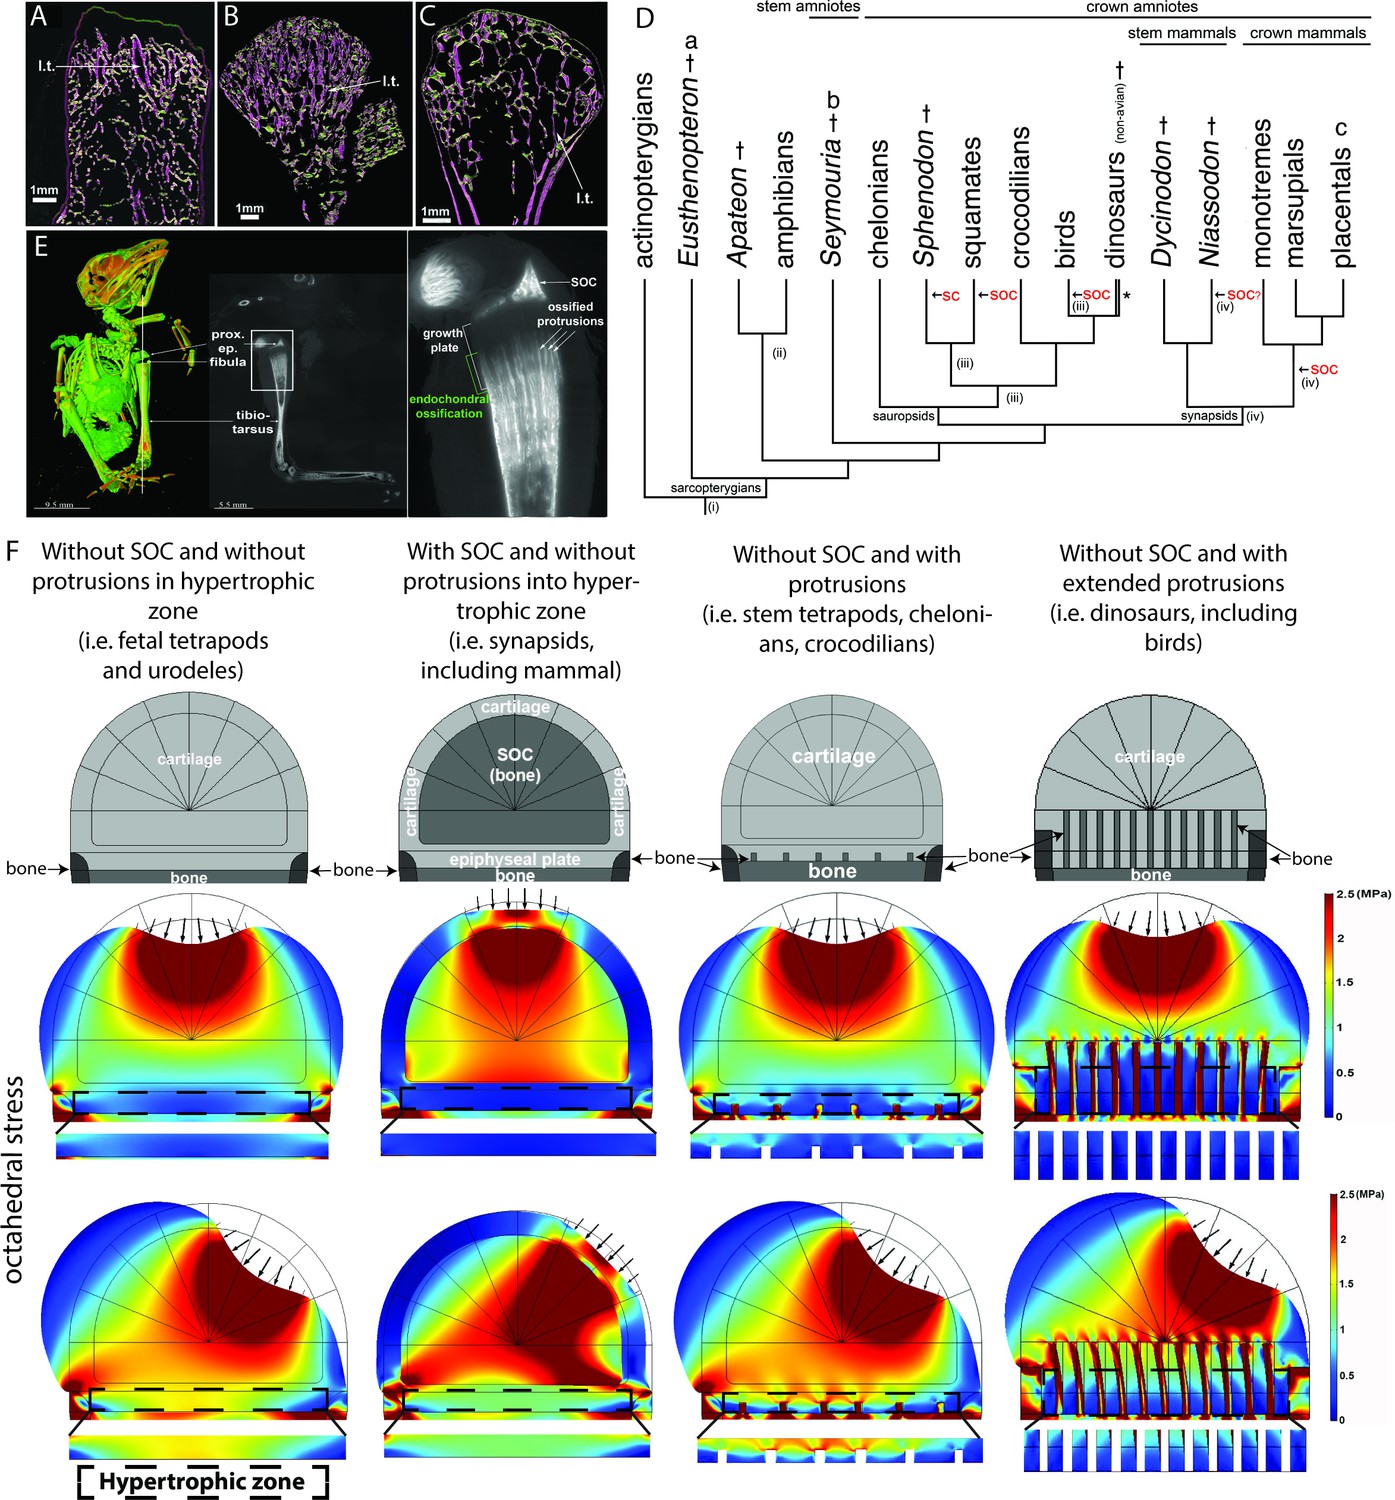
Evolutionary appearance of the SOC and its role in distributing octahedral stress.
(A–C) The proximal humeral metaphyses of Eusthenopteron (A), Seymouria (B), and Sciurus vulgaris (red squirrel) (C). The longitudinal trabeculae resulting from endochondral ossification at the base of the growth plate in adults are shown in pink, while the transverse trabeculae appear green. The longitudinal trabeculae (l.t.) are designated marrow processes invading the growth plate. (D) Phylogeny tree, illustrating the major changes in the evolution of long-bone epiphyses. The black arrows indicate the presence of a secondary calcified center (SC) or a secondary ossification center (SOC). (i) Estimated appearance of endochondral formation of long bones based on the fossil record to date; (ii) Cartilaginous epiphyses in long-bones; (iii) Hypothetical presence of an ancestral SCs in sauropsids; (iv) Hypothetical presence of an ancestral SOCs in synapsids. * indicates paraphyly within the group. (E) A synchrotron scan of a juvenile sparrow demonstrates the presence of SOC. 1, a virtual thin section of the proximal epiphysis. prox. ep., proximal epiphysis. (F) Deformation and distribution of octahedral stress from FEA simulation in different evolutionary taxa. Columns refer to (from left to right) ‘without SOC’ (representing i.e., fetal tetrapods and urodeles), ‘with SOC’ (representing i.e., synapsids including mammal), ‘stem tetrapods’ (representing i.e., juvenile stem tetrapods, chelonians, crocodilians), and archosaurs (representing i.e., birds and non-avian dinosaurs). For comparison of structural functionality, all situations used the same basic geometry and materials. The small arrows indicate the direction of loading. The supra-physiological loading level (3 MPa) was modeled. A hypertrophic zone free of bony elements is presented under each model for direct comparison.
Figure 1—figure supplement 1

Development of articular and epiphyseal cartilage in rodents and salamanders.
(A–D) Representative safranin O and fast green staining of sections of the epiphyseal end of the tibia of mouse (A), rat (B), and the hind limb of salamander species Pleurodeles waltl (C) and Notophthalmus viridescens (D). The dashed red lines outline the SOC. Red arrowheads mark the zone of hypertrophic cells. Walking behavior is indicated according to our daily observations. Pleurodeles waltl is an Iberian newt that spends most of its life in water. Notophthalmus viridescens is a north American newt that has an aquatic larval, a terrestrial eft, and a semiaquatic adult stage.
Figure 1—figure supplement 2
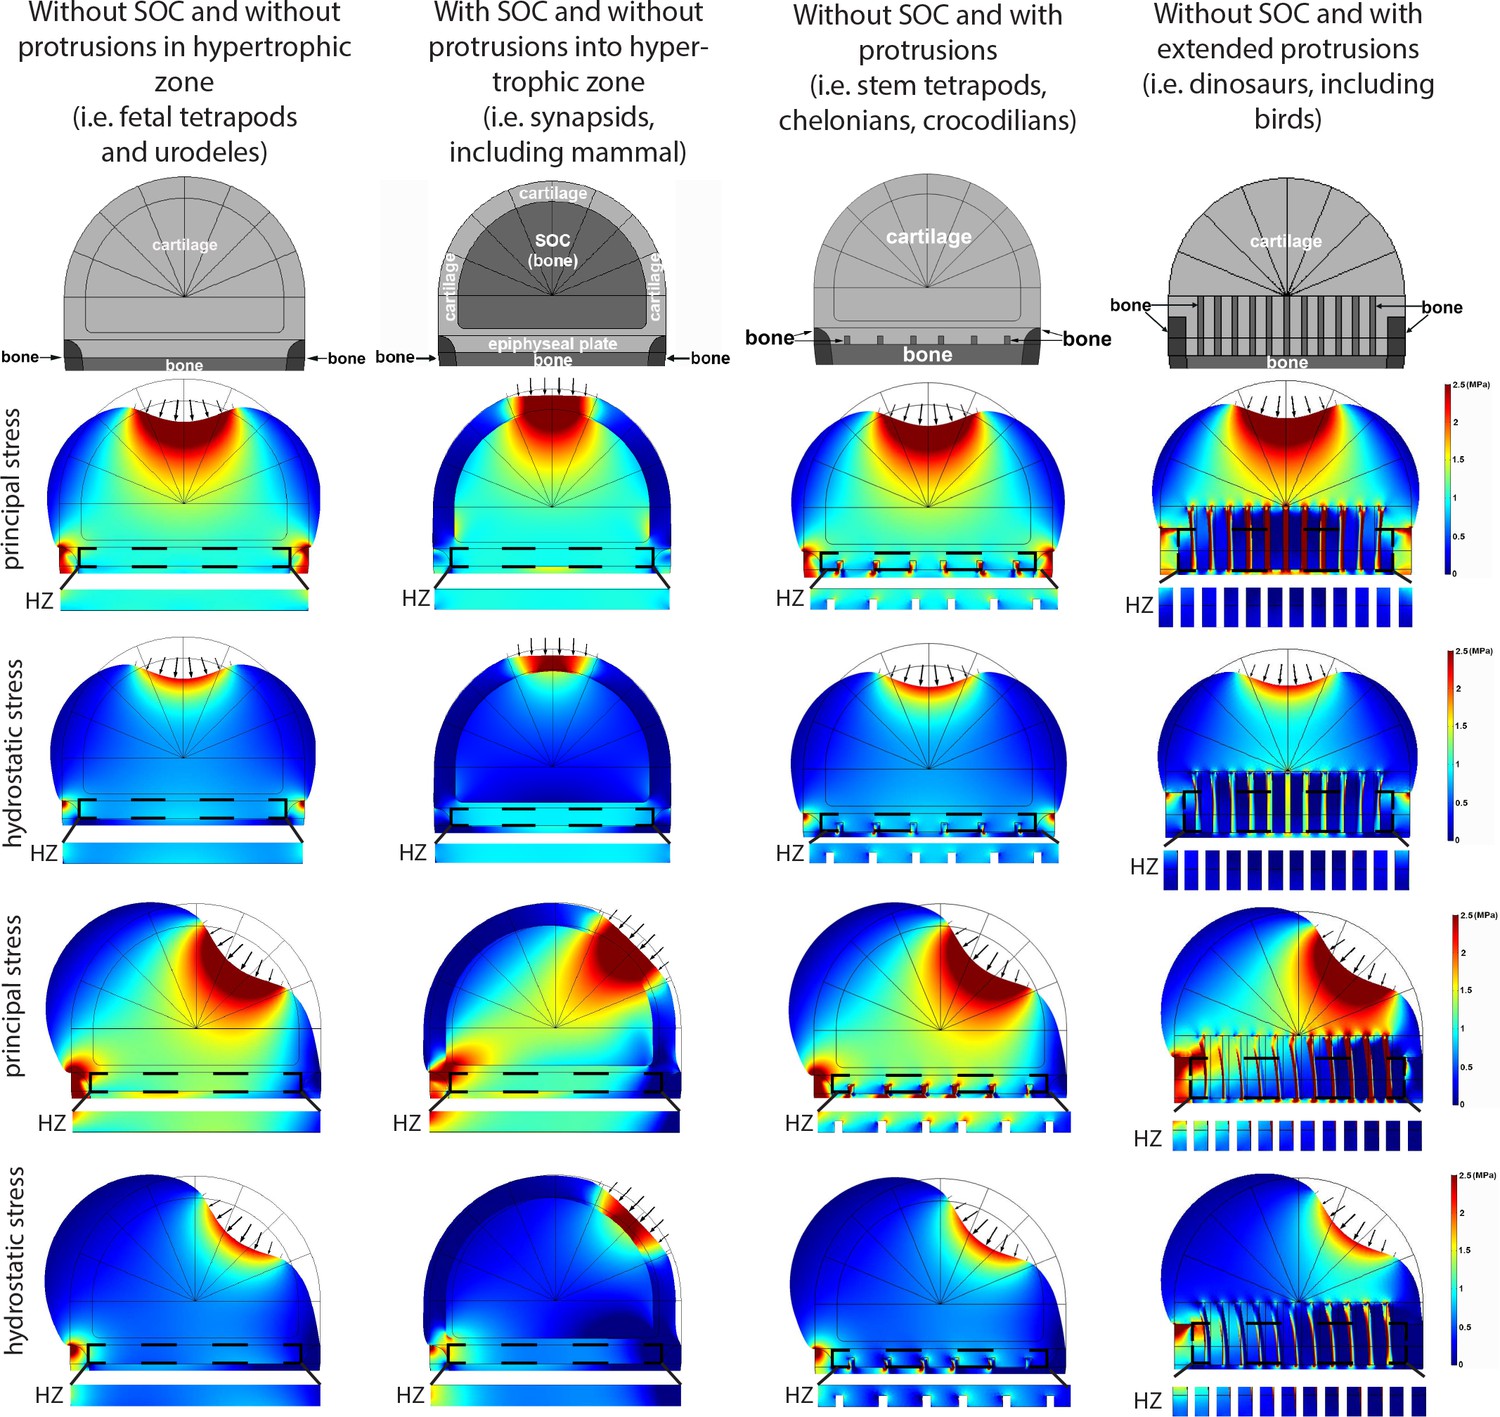
Deformation and distribution of comparison stress from FEA simulation in different evolutionary taxa.
Columns refer to (from left to right) ‘without SOC’ (representing i.e., fetal tetrapods and urodeles), ‘with SOC’ (representing i.e., synapsids including mammal), ‘stem tetrapods’ (representing i.e., juvenile stem tetrapods, chelonians, crocodilians), and archosaurs (representing i.e., birds and non-avian dinosaurs). For comparison of structural functionality, all situations used the same basic geometry and materials. The small arrows indicate the direction of loading. Supra-physiological loading level (3 MPa) was modeled. Hypertrophic zone free of bony elements is presented under each model for direct comparison. Hypertrophic zone, HZ.
Figure 2 with 1 supplement

Comparative analysis in bats.
(A) microCT image of a 1–3 days-old bat Pipistrellus pipistrellus. (A1) foot, with arrows pointing to growth plates, (A2) wing, with dashed blue lines outlining the areas of non-ossified cartilage. (B–C) Ossification of the autopod (B) and of the stylopod and zeugopod (C) in seven bat species at birth. (D–E) A generalized pattern of ossification of the autopod (D) and stylopod and zeugopod (E) of six bat species combined (Myotis lucifugus, Artibeus jamaicensis, Carollia perspicillata, Tadarida brasiliensis, Myotis austroriparius, and Myotis myotis).
Figure 2—video 1
3D model based on microCT surface images of a 1–3 day-old Pipistrellus pipistrellus s.l. (common pipistrelle bat).
The age could not be determined more precisely.
Figure 3 with 2 supplements
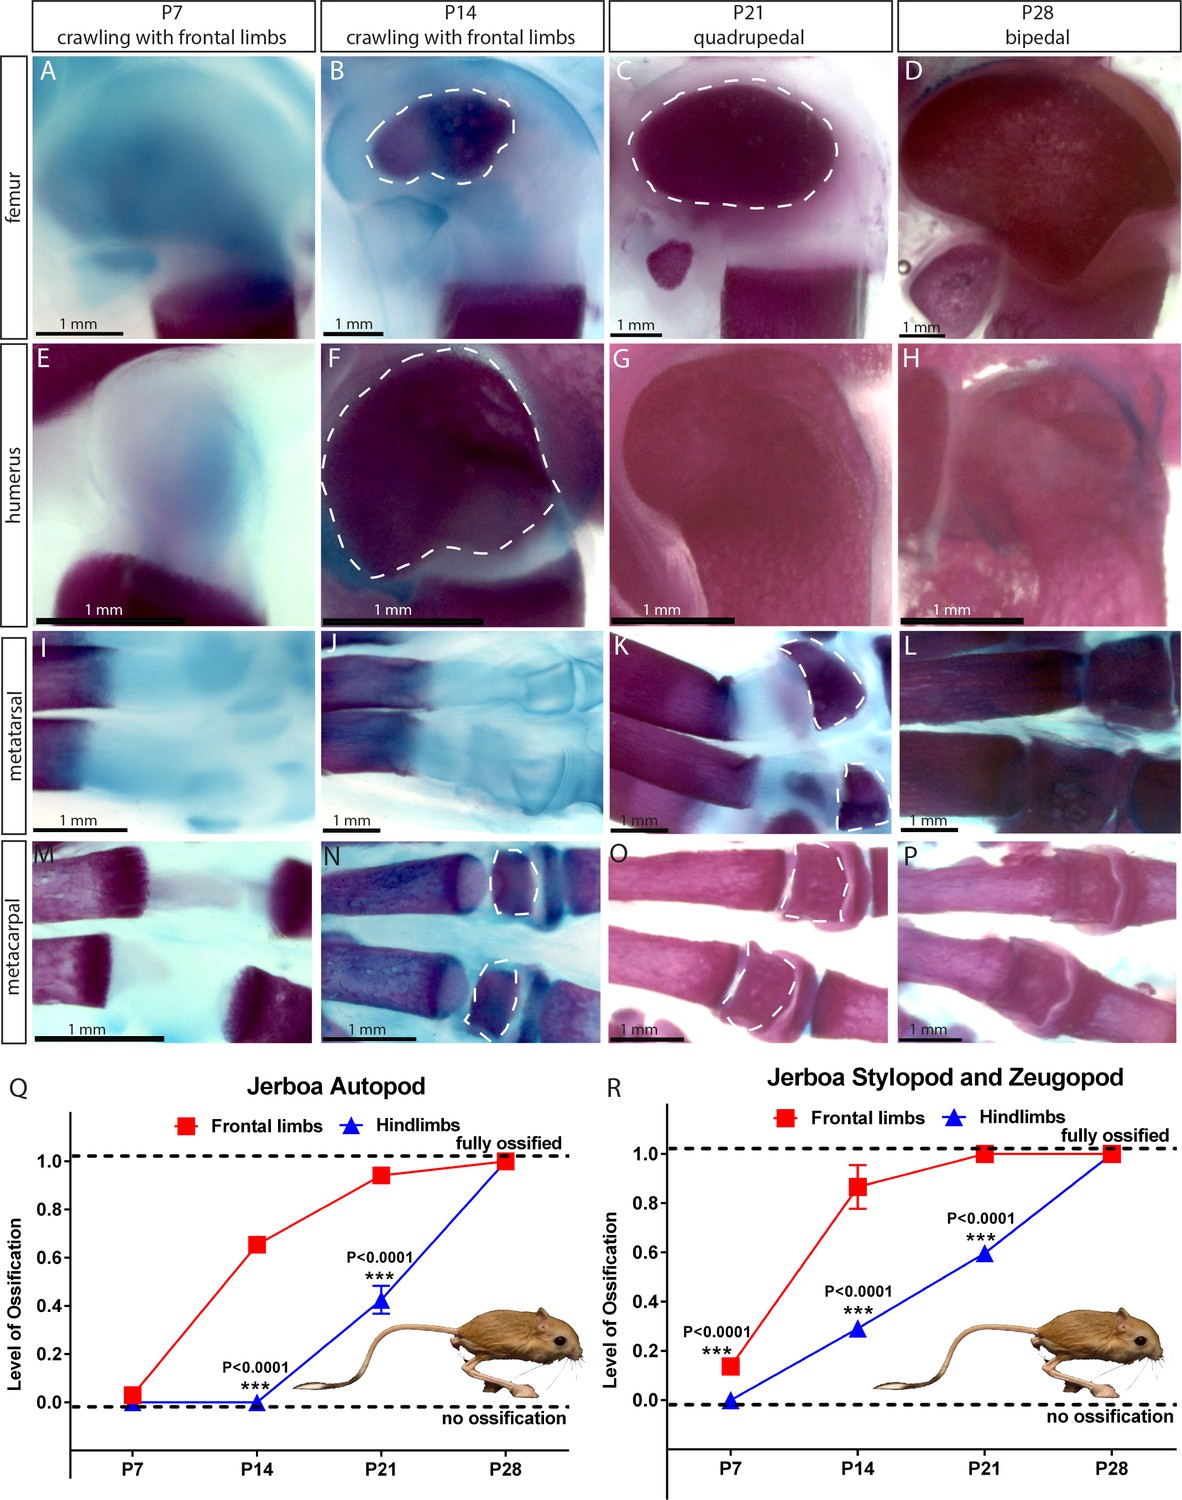
Comparative analysis in jerboa.
(A–P) Alcian blue and alizarin red staining of the femur (A–D), humerus (E–H), metatarsal (I–L), and metacarpal (M–P) of Jaculus jaculus (three-toed jerboa) at various postnatal (P) time points. The dashed white lines outline the SOC. The gait pattern was derived from our weekly observations (see Figure 3—videos 1 and 2). (Q–R) Ossification of the autopod (Q) and stylopod and zeugopod (R) of Jaculus jaculus (three-toed jerboa) at various postnatal stages. Data are means ± SD, representing inter-individual variation, one-way ANOVA. In (Q–R), n = 2 jerboa analyzed. ns, not significant.
Figure 3—video 1
Development of a gait pattern of jerboa Jaculus jaculus.
Figure 3—video 2
Development of a gait pattern of jerboa Jaculus orientalis.
Figure 4 with 1 supplement
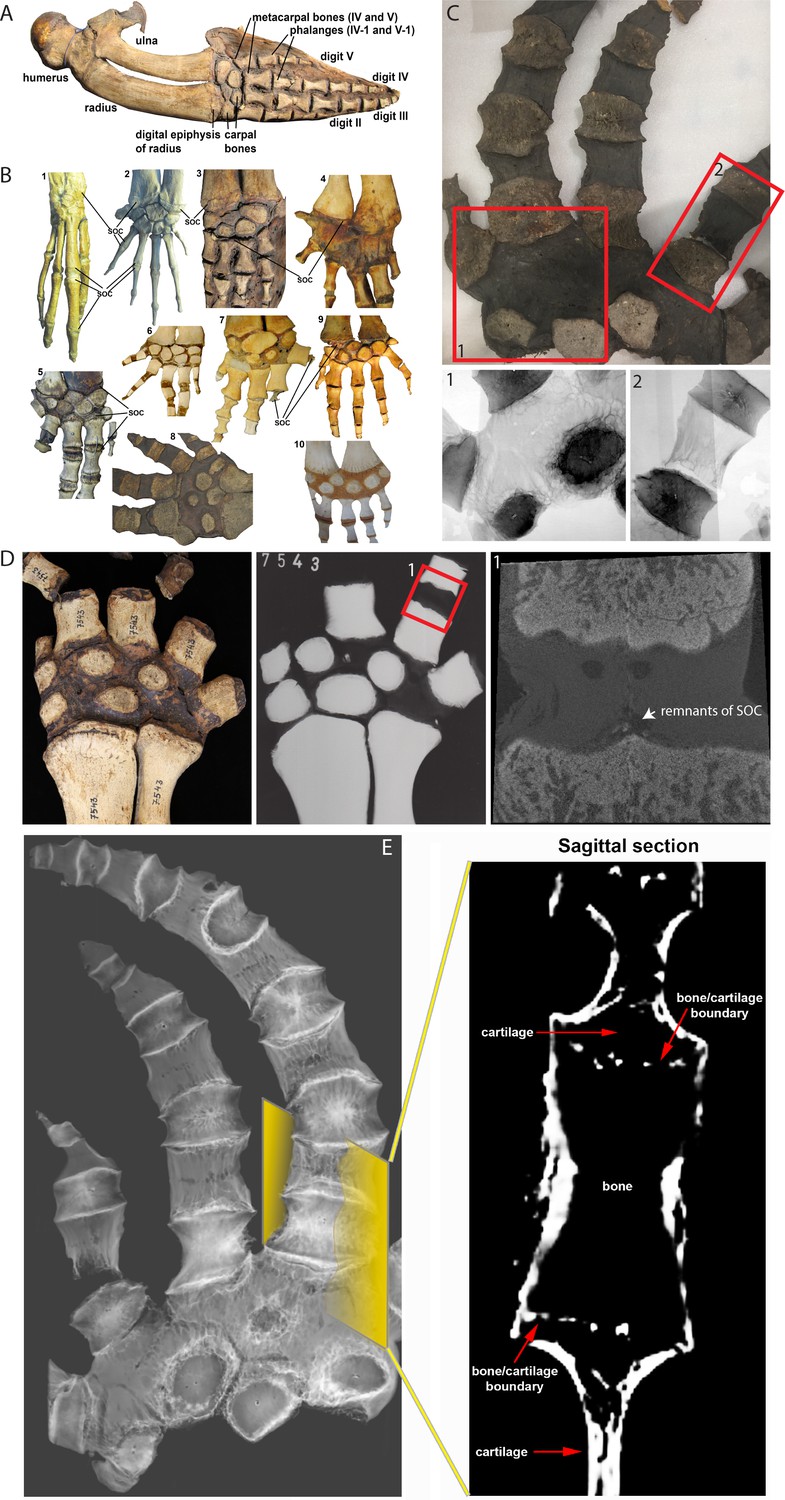
Comparative analysis in whales.
(A) Forelimb bones of the minke whale Balaenoptera acutorostrata. (B) Comparative anatomy of bony and cartilaginous epiphyses in the distal portion of the forelimbs of various cetacean whales: B1-B2 – early cetaceans; B3-B4 – baleen whales; B5-B10 – toothed whales. (B1) Maiacetus inuus, semi-aquatic from Eocene era (56–33.9 Mya), (B2) Dorudon atrox, fully-aquatic from Eocene era (B3) minke whale Balaenoptera acutorostrata from Miocene era (23–5.3 Mya) (B4) North Atlantic right whale Eubalaena glacialis, (B5) pilot whale Globicephala melas (B6) boto river dolphin Inia geoffrensis, (B7) narwhal Monodon monoceros, (B8) killer whale Orcinus orca, (B9) juvenile and (B10) subadult sperm whale Physeter catodon. (C) Sample image of an adult killer whale Orcinus orca (same species as B8) with X-ray images of the highlighted areas (C1 and C2) from the corresponding image on their left. (D) Sample (left) and X-ray (right) images of an adult beluga whale Delphinapterus leucas. (D1) Micro-CT reconstruction of the highlighted phalange joint. (E) CT image of an adult killer whale Orcinus orca and a virtual sagittal section of the metacarpal II demonstrating the absence of the SOC.
Figure 4—video 1
CT scan of the manus of a killer whale Orcinus orca.
Figure 5 with 3 supplements
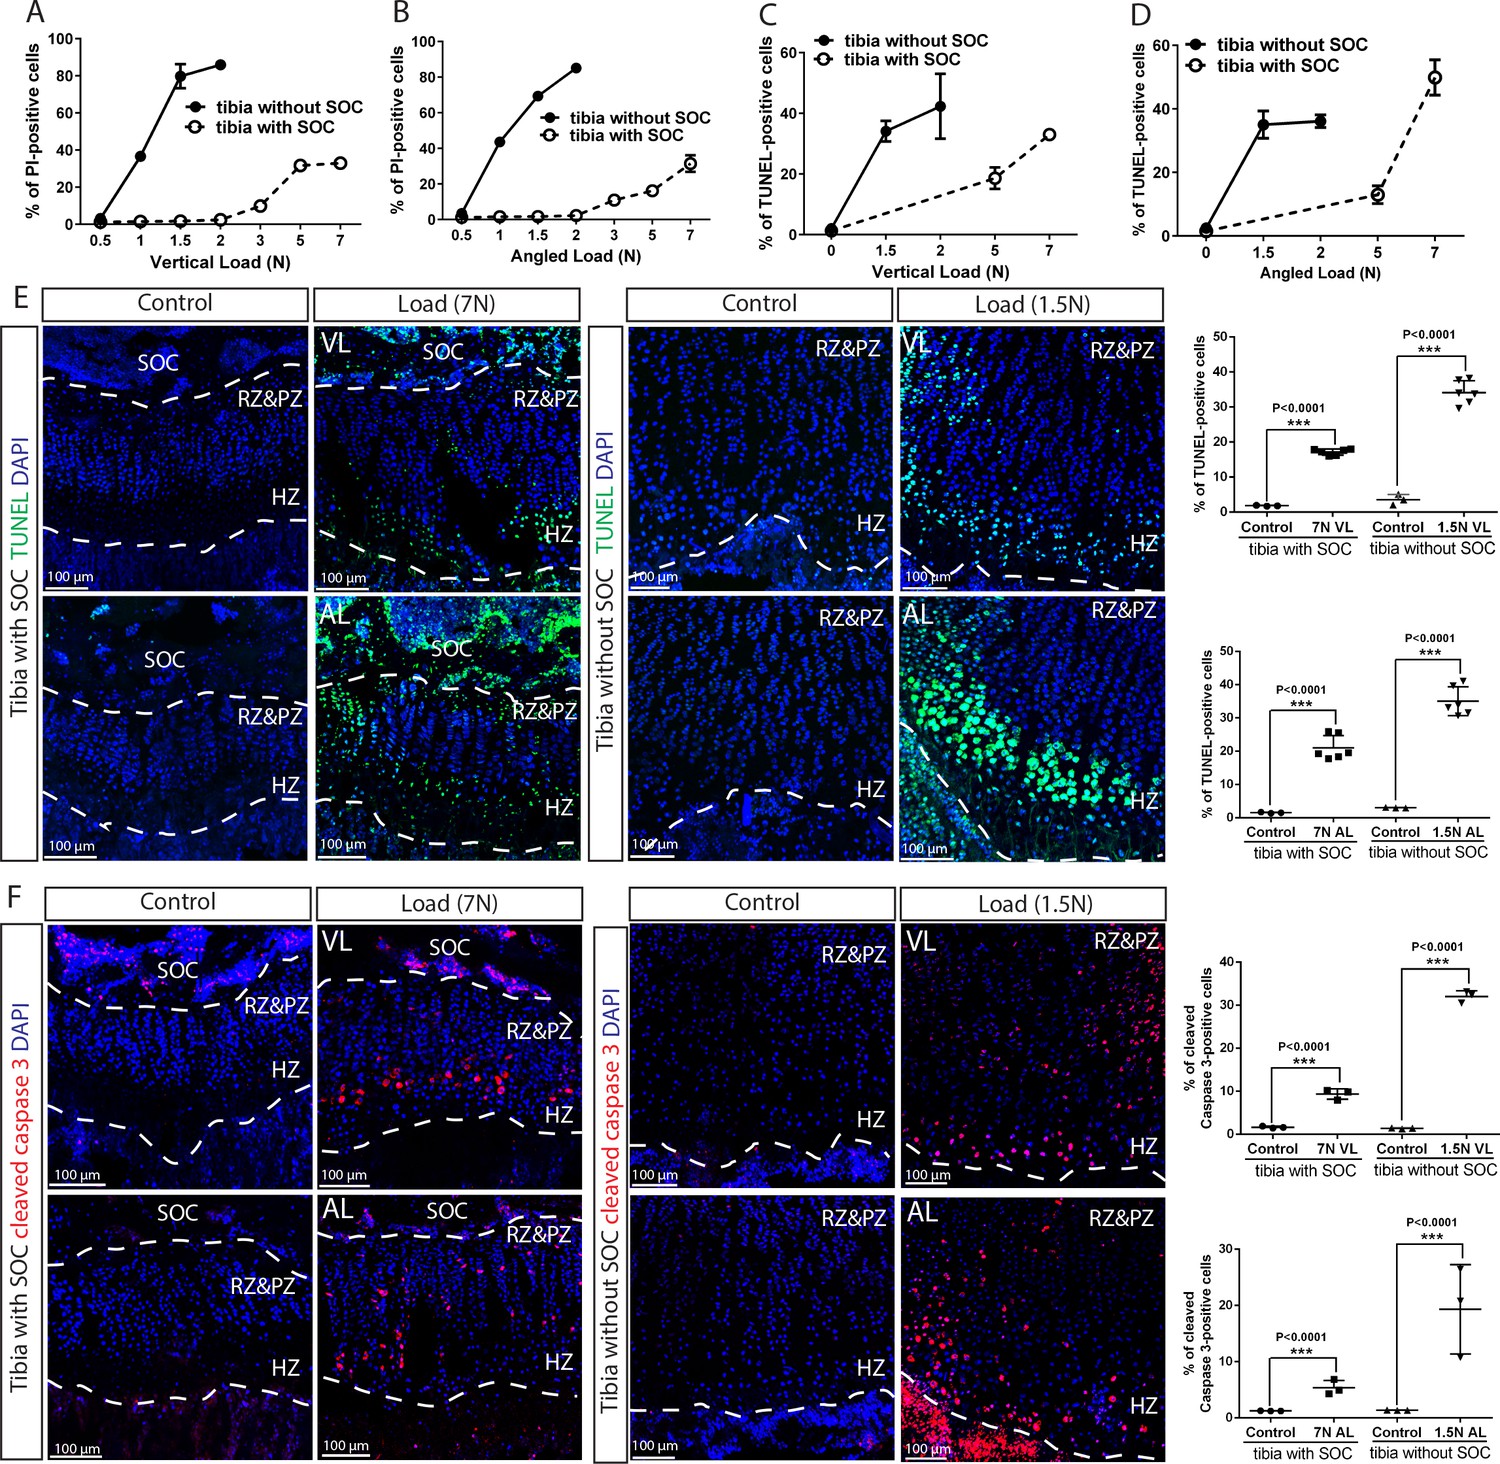
The SOC protects epiphyseal chondrocytes from apoptosis induced by mechanical stress.
(A–D) Quantification of propidium iodide- (PI) (A–B) and TUNEL- (C–D) positive cells in the growth plates of the tibia with and without SOCs loaded vertically (A, C) or at an angle (B, D). (E–F) Representative images and quantification of TUNEL staining (green) (E) and cleaved caspase-3 staining (red) (F) in the growth plates of loaded tibias with and without SOCs. DAPI was used for counterstaining (blue). Data are means ± SD, two-tailed Student’s t-test. In (A–F), n = 3. The control and loaded tibia were from the same animal. VL, vertical load, AL, angled load. RZ and PZ, resting zone and proliferative zone combined, HZ, hypertrophic zone. ‘tibia with SOC’ and ‘tibia without SOC’ in the figure refer to tibias from 30-day-old mice and 10-day-old rats, respectively (see Figure 5—figure supplement 1A–B).
Figure 5—figure supplement 1
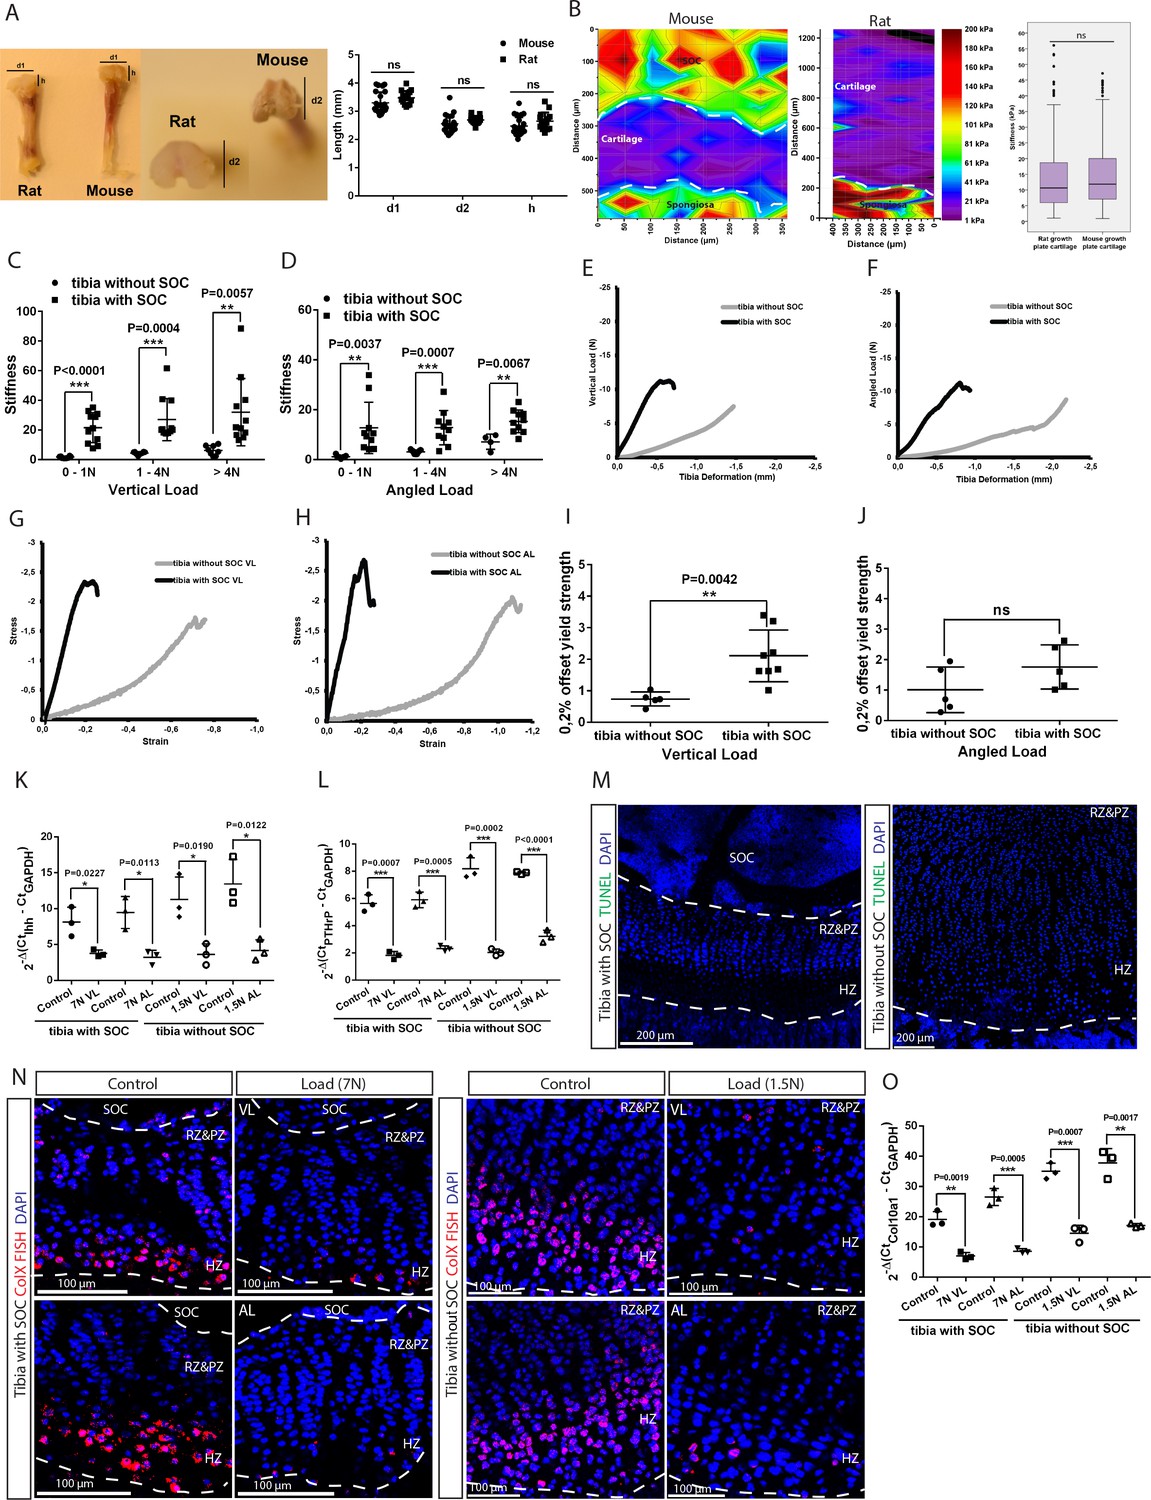
Establishing and characterizing SOC± model in relation to stifness and cell death.
(A) Mouse (30-day-old) and rat (10-day-old) tibia with and without a SOC, respectively, have similar physical dimensions of the epiphyses (d1, d2, h). (B) Representative images and quantification of the nanoindentation test of 30-day-old mice and 10-day-old rats. (C–D) The stiffness of bones with fully developed SOCs (tibia with SOC) and with immature SOCs (tibia without SOC) was measured at different loads and in both the vertical (C) and angled (D) direction. (E–J) Representative load/deformation (E–F) and stress/strain (G–H) curves of vertically (VL) (E, G) and angularly (AL) (F, H) loaded tibias with and without SOCs. (I–J) The elasticity of tibias with and without SOCs under vertical (I) and angled load (J). (K–L) The QPCR analysis of Indian hedgehog (Ihh) (K) and parathyroid hormone-related peptide (PTHrP) (L) levels in the epiphyseal end of tibia with and without SOCs. (M) Representative images of growth plates of tibias with and without SOCs fixed after dissection and prior loading. TUNEL staining (green) and nucleus counterstaining with DAPI (blue). (N) Fluorescent in situ hybridization of collagen type X (ColX) in the loaded growth plates of tibias with and without SOCs. VL, vertical load, AL, angled load. RZ and PZ, resting zone and proliferative zones, HZ, hypertrophic zone. (O) QPCR analysis of ColX level in the epiphyseal end of tibia with and without SOCs exposed to different loading. Data are means ± SD, two-tailed Student’s t-test, except in (B) where Mann-Whitney U-test was used. In (A), n = 23 for ‘Mouse’ and n = 15 for ‘Rat’. In (B), n = 5 for ‘Mouse’ and n = 4 for ‘Rat’. In (C), n = 10 for ‘tibia with SOC’ at all loads; n = 9 for ‘tibia without SOC’ at 0–1N and 1–4N, n = 4 for>4N. In (D), n = 11 for ‘tibia with SOC’ at all loads; n = 8 for ‘tibia without SOC’ at all loads. In (I–L, O), n = 3. ns, not significant.
Figure 5—figure supplement 2

Death of the growth plate chondrocytes upon various loading in the presence and absence of the SOC.
(A–B) Representative images and quantification of the distribution of propidium iodide (PI)-positive cells in the growth plates of tibia with (A) and without a SOC (B) loaded vertically or angularly. During the end of culture period, bones were incubated with PI, which penetrates only into dead cells (red). Representative pictures (images) and quantifications (graphs) are shown. DAPI (blue) counterstaining of all nucleus was done on the fixed tissue sections. RZ and PZ, resting zone and proliferative zones, HZ, hypertrophic zone. ‘tibia with SOC’ and ‘tibia without SOC’ refer to tibias from 30-day-old mice and 10-day-old rats, respectively (see Figure 5—figure supplement 1A–B). Data are means ± SD, two-tailed Student’s t-test. In (A–B), n = 3.
Figure 5—figure supplement 3
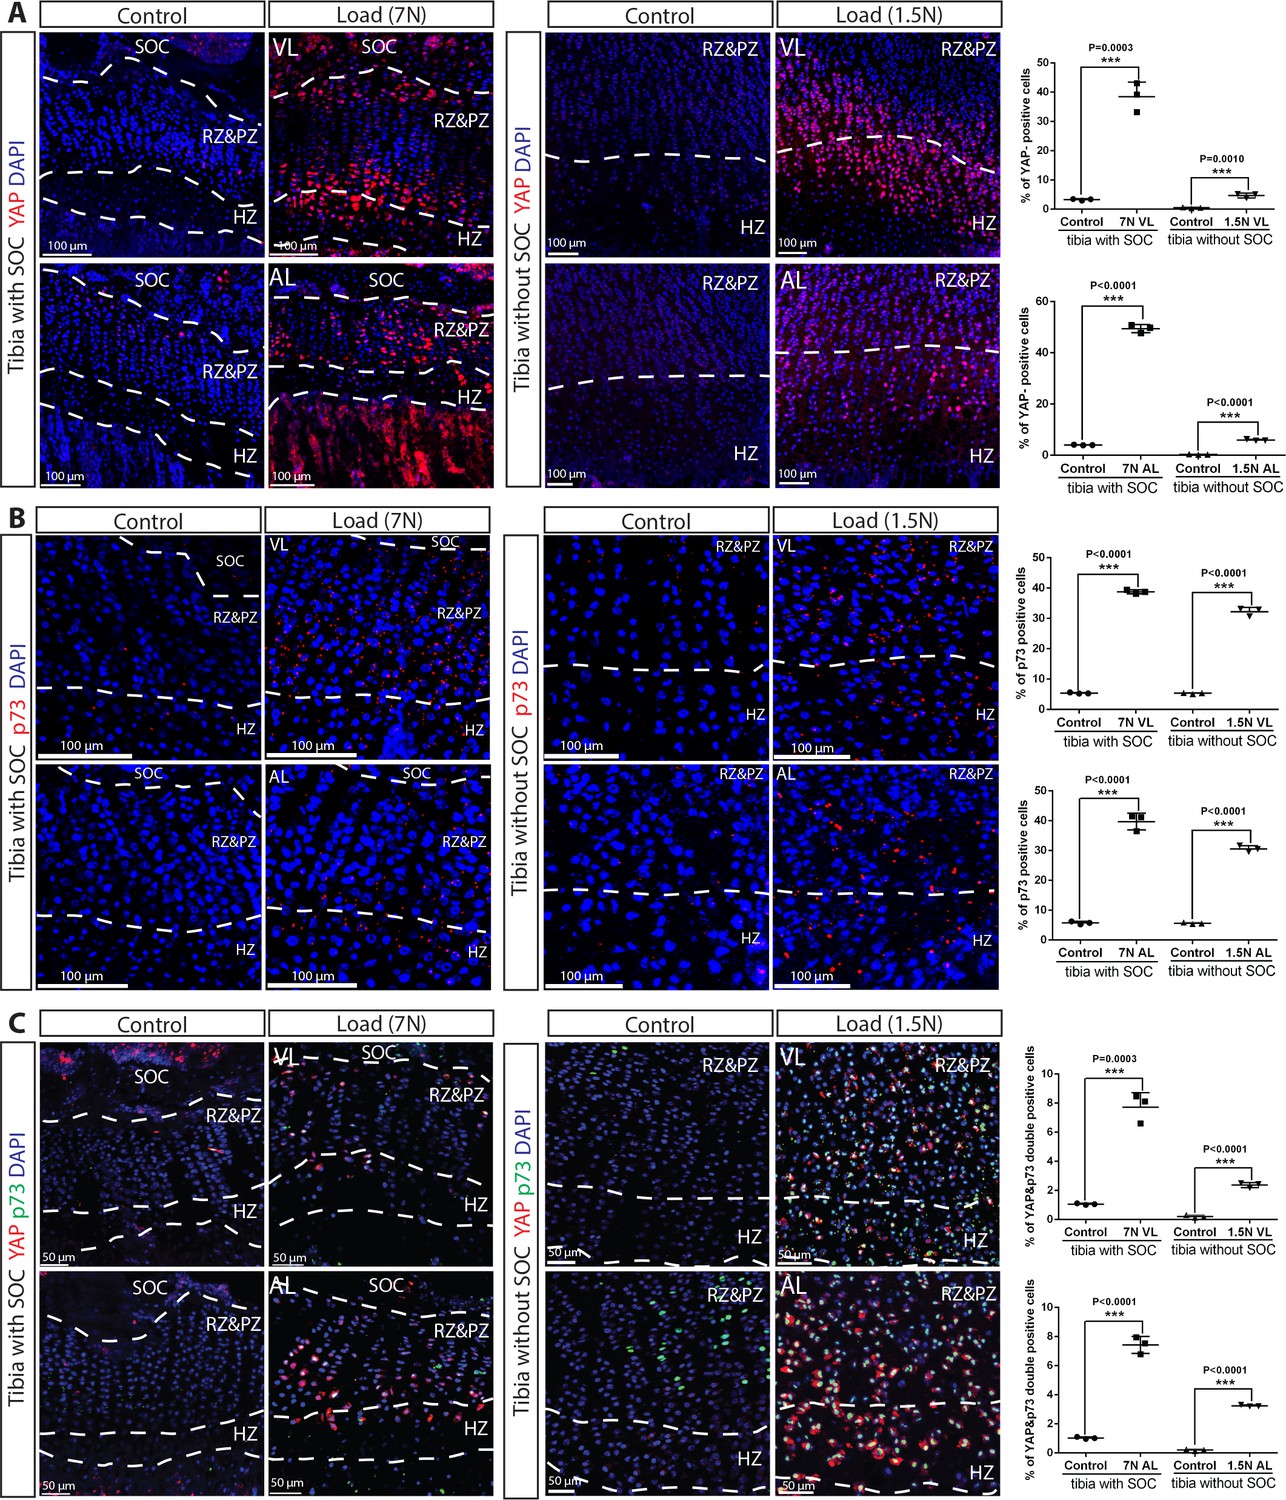
YAP/p73 activation the growth plate chondrocytes upon loading.
(A–C) Immunostaining and quantification of YAP (A), p73 (B), and YAP + p73 double-positive cells (C) in the growth plates of loaded tibias with and without SOCs loaded vertically (VL) and angularly (AL). RZ and HZ, resting zone and proliferative zone, HZ, hypertrophic zone. ‘tibia with SOC’ and ‘tibia without SOC’ refer to tibias from 30-day-old mice and 10-day-old rats, respectively (see Figure 5—figure supplement 1A–B). Data are means ± SD, two-tailed Student’s t-test. In (A–C), n = 3.
Figure 6 with 1 supplement
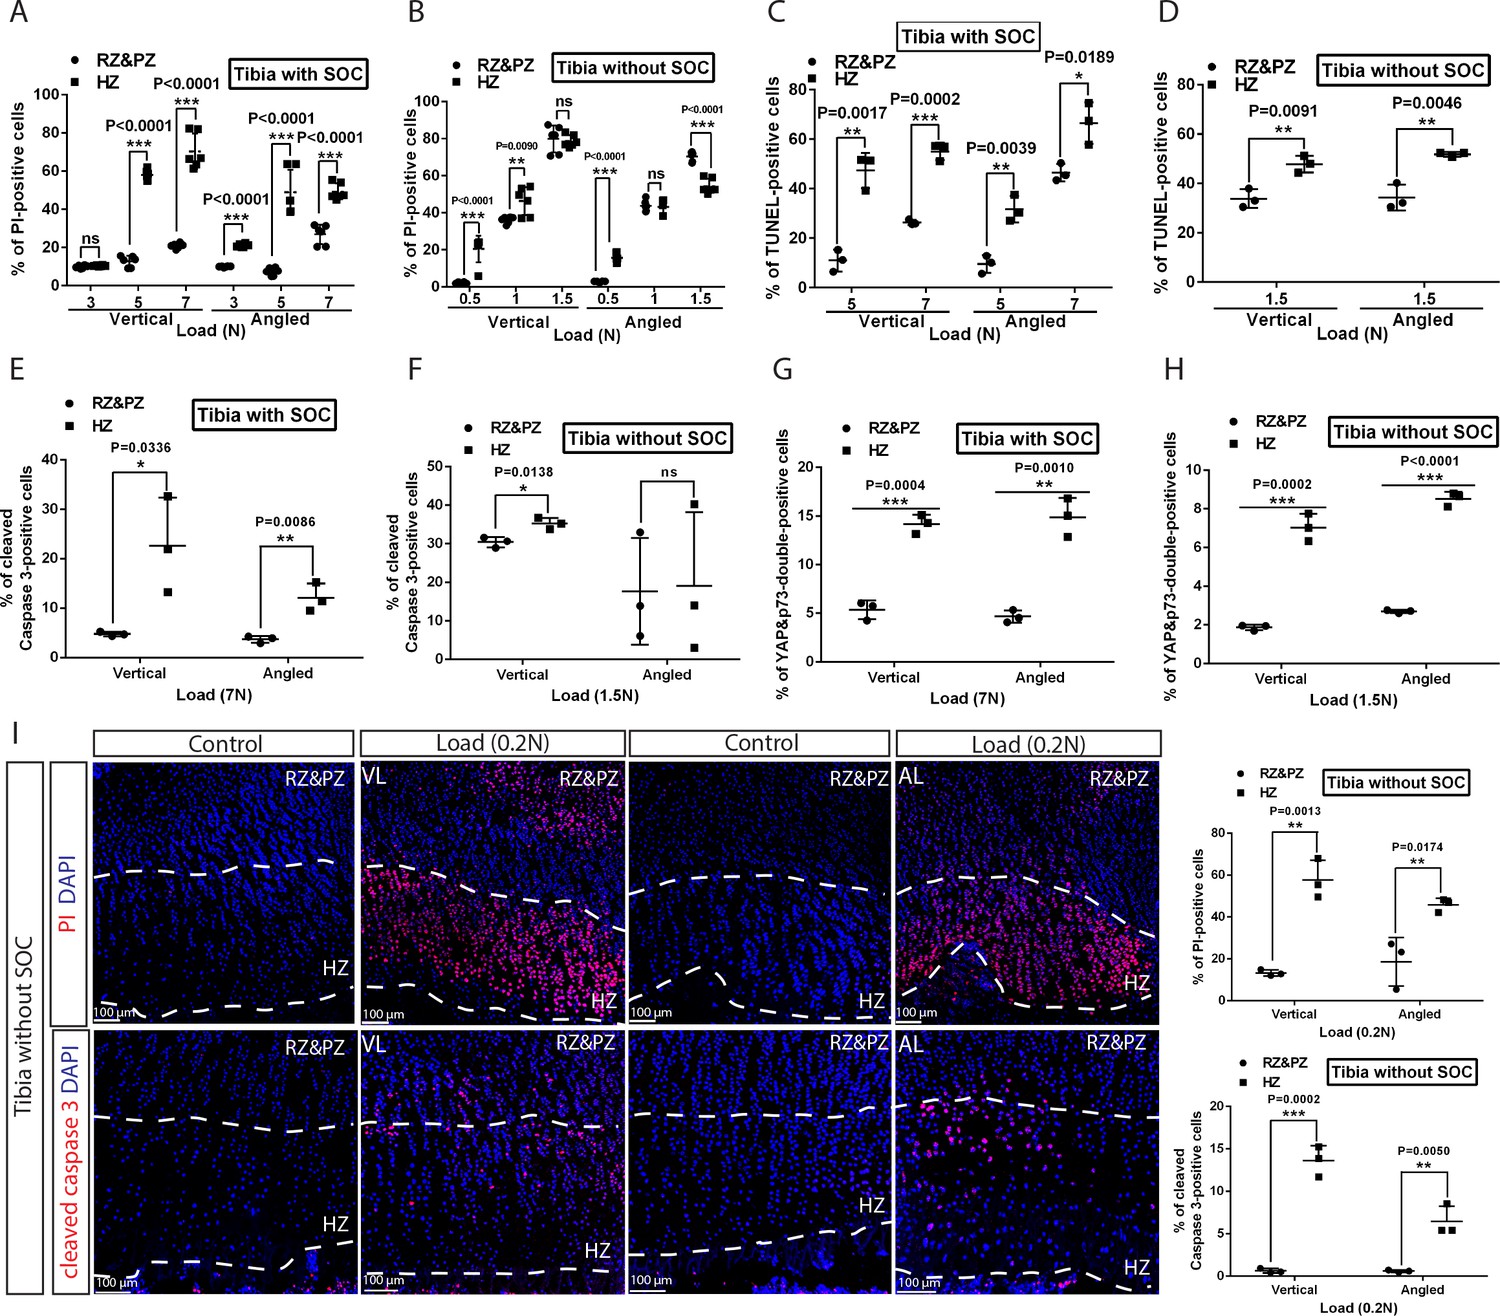
Hypertrophic cells are the most sensitive cell type in response to mechanical stress.
(A–D) Comparison of the extent of cell death between resting+proliferative zones (RZ and PZ) and hypertrophic zone (HZ) of the vertically and angularly loaded growth plates with (A, C) and without (B, D) SOCs as assessed by PI staining (A–B) and TUNEL (C–D). (E to H) Distribution of immunohistological staining along the longitudinal axis for cleaved caspase-3 staining (E–F) and YAP and p73 double staining (G–H) of the vertically and angularly loaded tibia with (E, G) and without (F, H) SOCs. (I) Representative images and quantification of propidium iodide (PI) staining (upper panel) and cleaved caspase-3 staining (lower panel) in the growth plates of vertically or angularly 0.2N loaded tibias without SOCs. The control and loaded tibia were from the same animal. DAPI was used for counterstaining (blue) in (I). Data are means ± SD, two-tailed Student’s t-test. In (A–I), n = 3. ns, not significant. ‘tibia with SOC’ and ‘tibia without SOC’ refer to tibias from 30-day-old mice and 10-day-old rats, respectively (see Figure 5—figure supplement 1A–B).
Figure 6—figure supplement 1
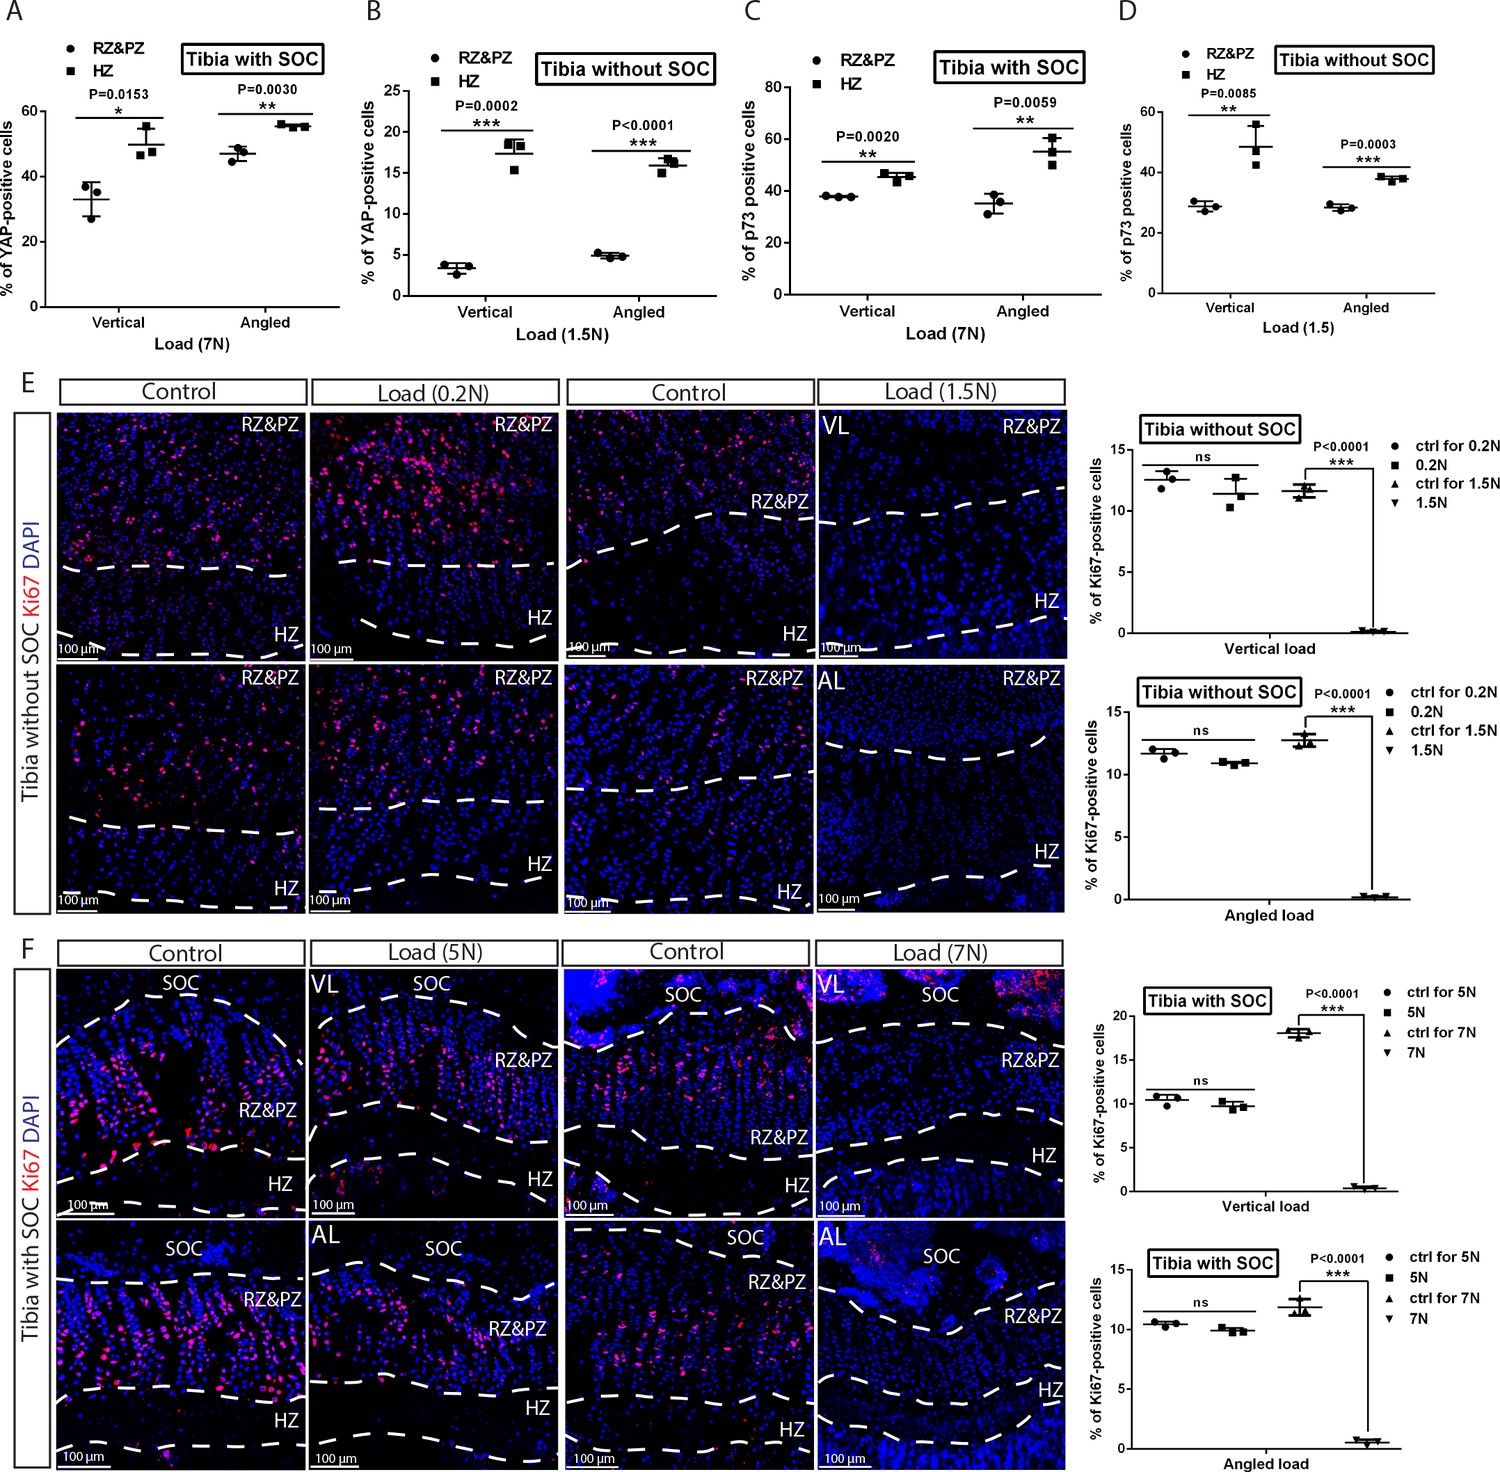
Distribution of YAP/p73 activation along longitudinal bone axis and the effect of loading on chondrocyte proliferation.
(A–D) Comparison of YAP (A–B) and p73 (C–D) staining between the resting plus proliferative zones (RZ and PZ) and hypertrophic zone (HZ) in the growth plates of tibias with (A, C) and without (B, D) SOCs. (E–F) Representative images and quantification of the ki67 staining in the growth plates of tibias with (F) and without (E) SOCs. Data are means ± SD, two-tailed Student’s t-test. In (A–F), n = 3. ns, not significant.
Figure 7
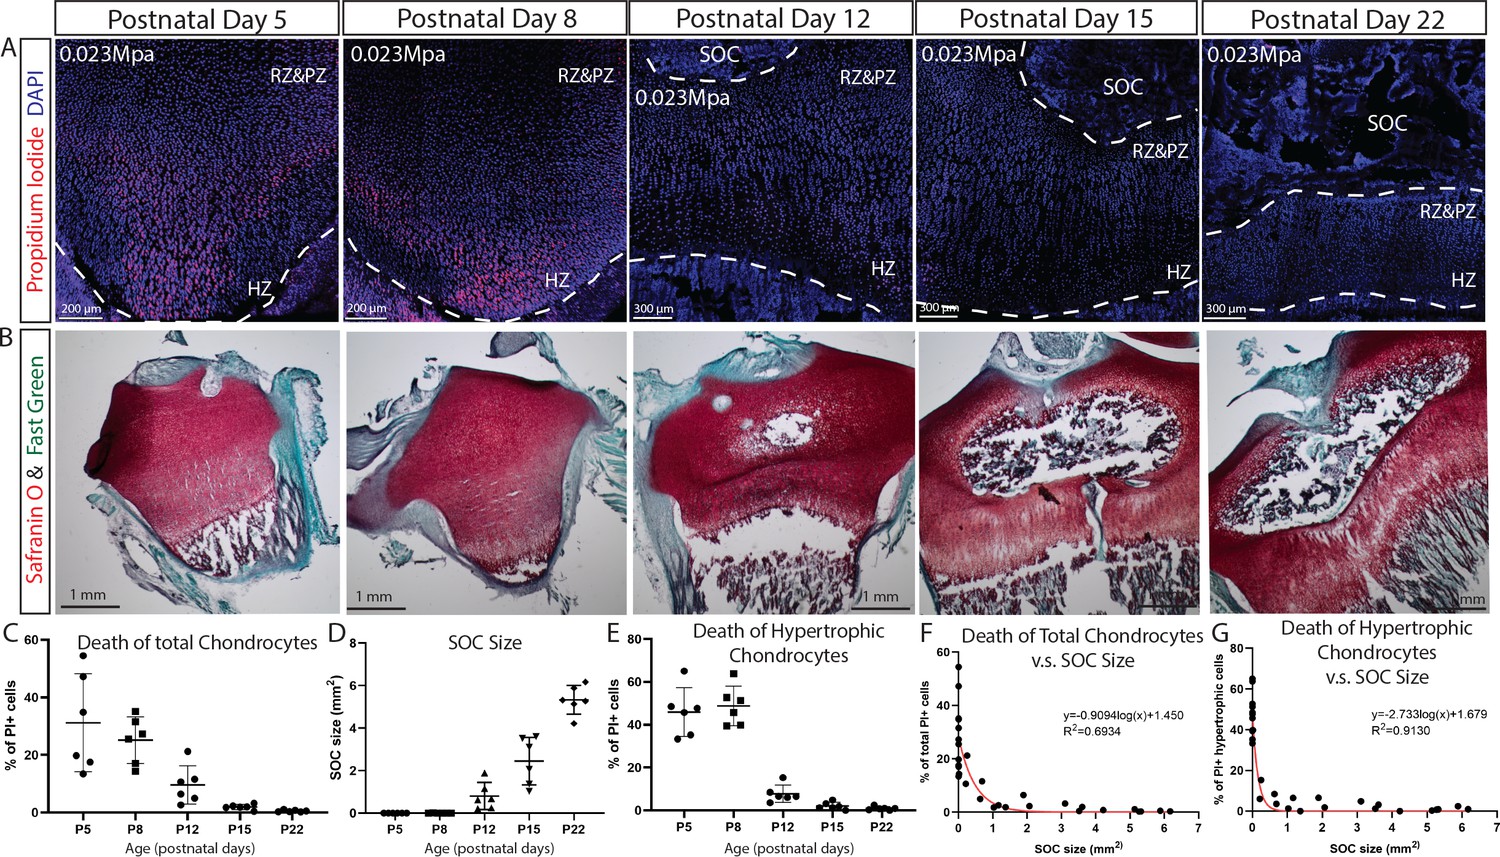
SOC size is negatively correlated with load-induced chondrocyte death in rat tibia growth plate.
(A) Representative images of the distribution of propidium iodide (PI)-positive cells in the growth plates of rat tibia with the same vertical pressure of 0.023 Mpa (equivalent to the load of 0.2N for postnatal day 5 rat tibia). (B) Representative images of safranin O and fast green staining of the corresponding rat tibia to illustrate the development of SOC. (C–E) Quantification of PI-positive total growth plate chondrocytes (C), SOC size (D) and PI-positive hypertrophic chondrocytes (E) in the loaded rat tibia at different ages. (F–G) Correlation analysis of PI-positive total growth plate chondrocytes (F) or PI-positive hypertrophic chondrocytes (G) with SOC size. Semilog line of nonlinear regression curve fit was used (red line). During the end of the culture period, bones were incubated with PI, which penetrates only into dead cells (red). DAPI (blue) counterstaining of all nucleus was done on the fixed tissue sections. RZ and PZ, resting zone and proliferative zones, HZ, hypertrophic zone. Data are means ± SD, n = 6. Two independent experiments were performed with three animals per time point per experiment. Each data point in (F–G) represents one animal.
Figure 8
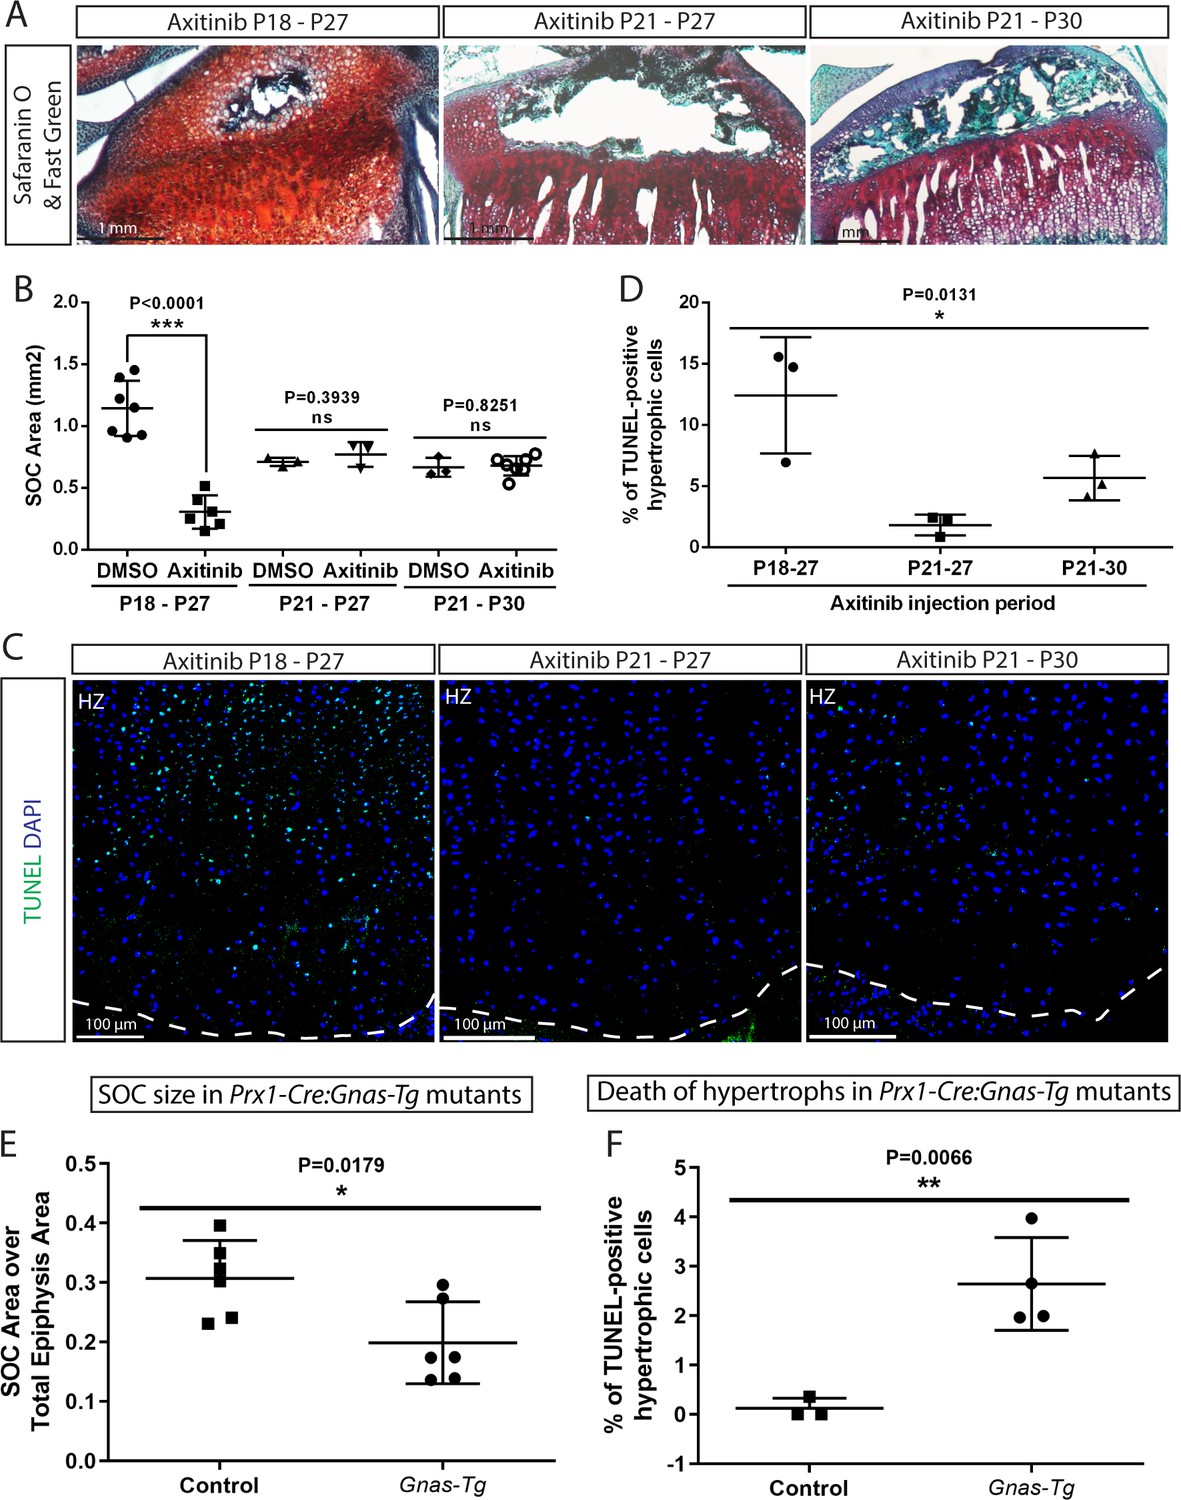
Inhibition of the SOC size in vivo is associated with increased epiphyseal chondrocyte apoptosis.
Size of the SOC was inhibited either pharmacologically employing axitinib (A–D) or genetically employing activation of Gnas (E, F). (A–B) Representative histology images of the tibia epiphysis (A) and quantification of the SOC size (B) of wild type mice injected with axitinib at various time periods. P refers to postnatal day. (C–D) Representative images (C) and quantification of TUNEL staining (green) (D) in the hypertrophic cells of the tibia growth plate of the axitinib injected mice. (E–F) Quantification of SOC size (E) and TUNEL staining (F) of the hypertrophic cells in the growth plates of stopGnasR201H (Control) and Prx-Cre:GnasR201H (Gnas-Tg) mice. DAPI was used for counterstaining (blue) in (C). Data are means ± SD, two-tailed Student’s t-test. In (A–F), n = 3. ns, not significant.
Figure 9 with 1 supplement
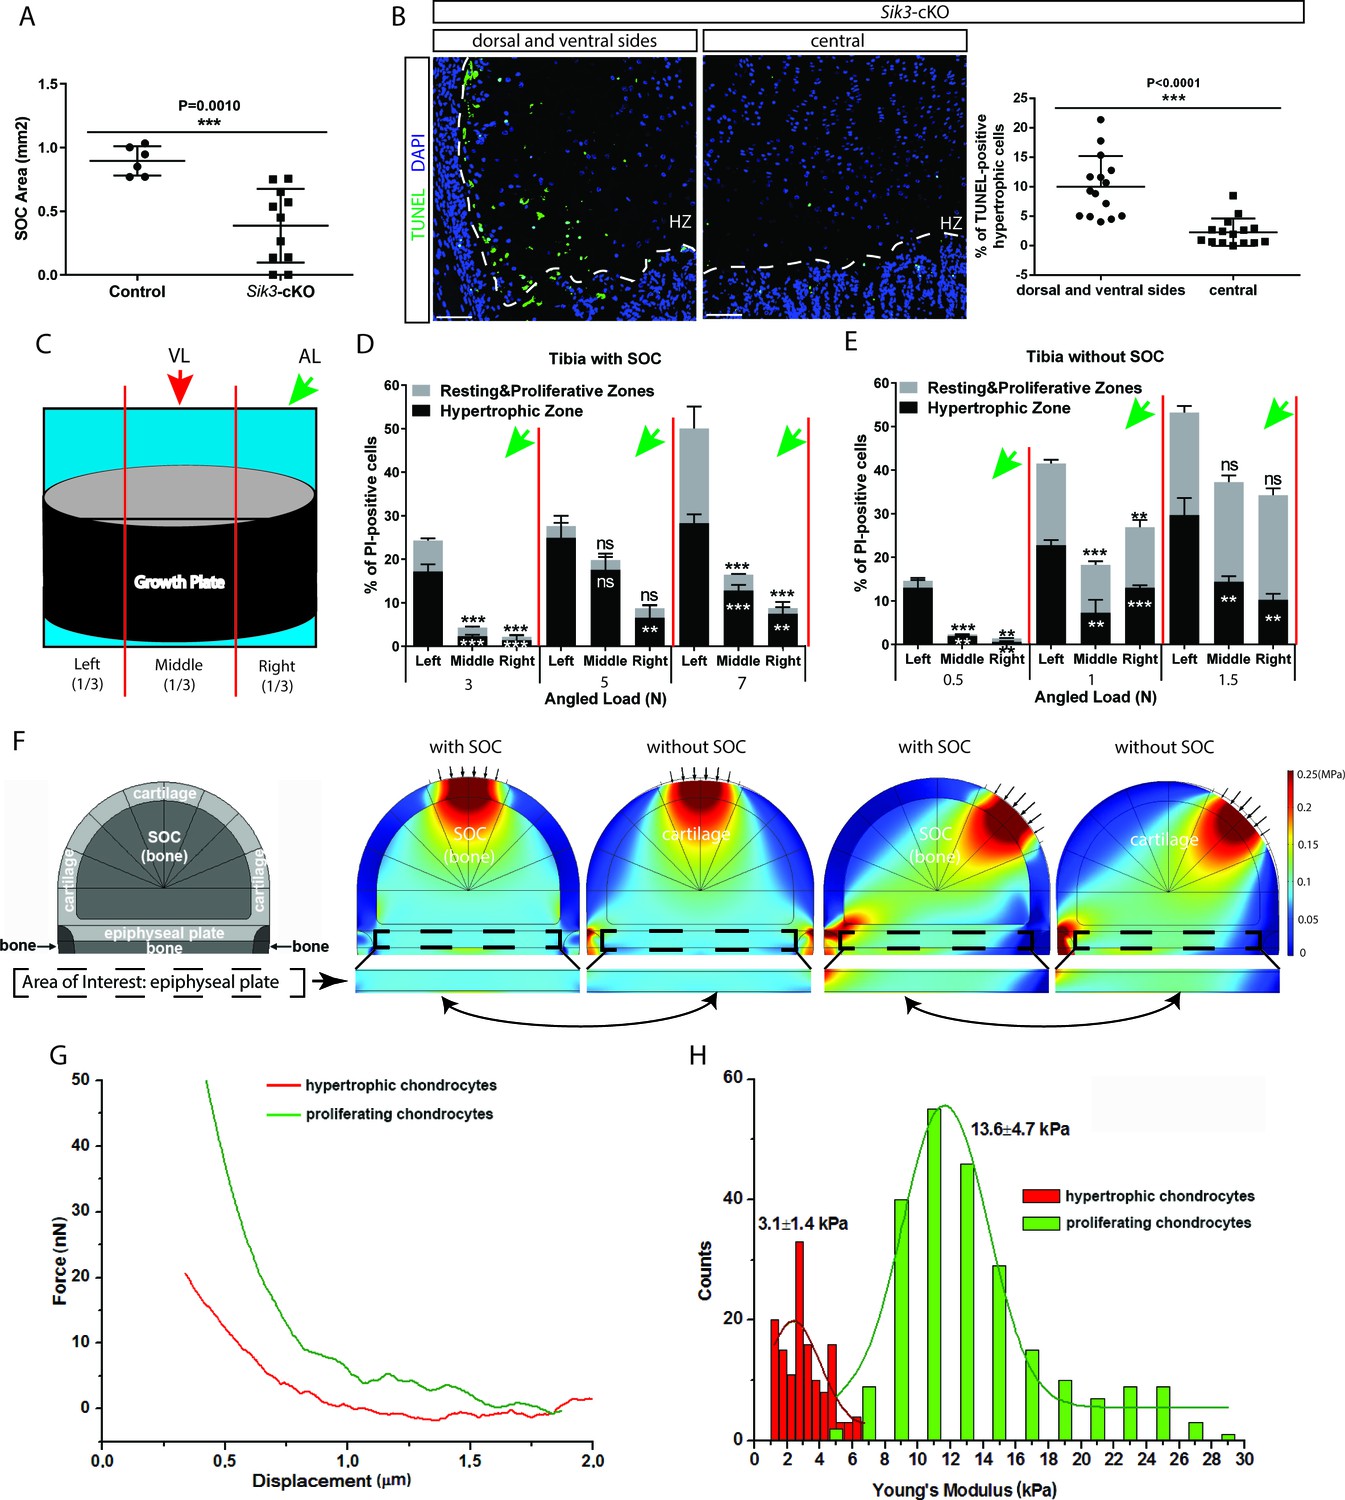
Low stiffness of hypertrophic chondrocytes renders them sensitive to mechanical stress.
(A) Quantification of the SOC size of postnatal day 28 Sik3F/F (Control) and Col2a1-Cre:Sik3F/F (Sik3-cKO) mice. (B) Representative images and quantification of TUNEL staining (green) between the lateral and middle parts of Sik3-cKO mice. DAPI was used for counterstaining (blue). HZ, hypertrophic zone. In (A–B), data are means ± SD, two-tailed Student’s t-test, n = 3 for ‘Control’ and n = 5 animals for ‘Sik3-cKO’ whereas each dot represents one histological section analyzed. (C) Schematic illustration of a section plan and loading directions in relation to the quantitative analysis of cell death distribution in the lateral-medial direction presented in (D–E). The growth plate is divided into three equal parts, (left, middle, and right) in relationship to the angle at which the load is applied (green or red arrows). (D–E) Quantification of propidium iodide (PI)-positive chondrocytes in the resting and proliferative zones and hypertrophic zone of tibias with (D) and without (E) SOCs subjected to an angled load (AL, green arrow, always applied from the right). Data are means ± SD, one-way ANOVA. **, p<0.001 and ***, p<0.0001 in comparison with the left portion. ns, not significant. The black and white asterisks indicate the significance for the resting and proliferative and hypertrophic zones, respectively. (F) Principal compressive stress from FEA modeling with physiological loading level. The small arrows indicate the direction of loading. The two-headed curved arrows indicate areas for comparison. (G) Typical force curves for hypertrophic and proliferating chondrocytes obtained by atomic force microscopy. (H) Comparison of the elastic moduli of hypertrophic and proliferating chondrocytes.
Figure 9—figure supplement 1
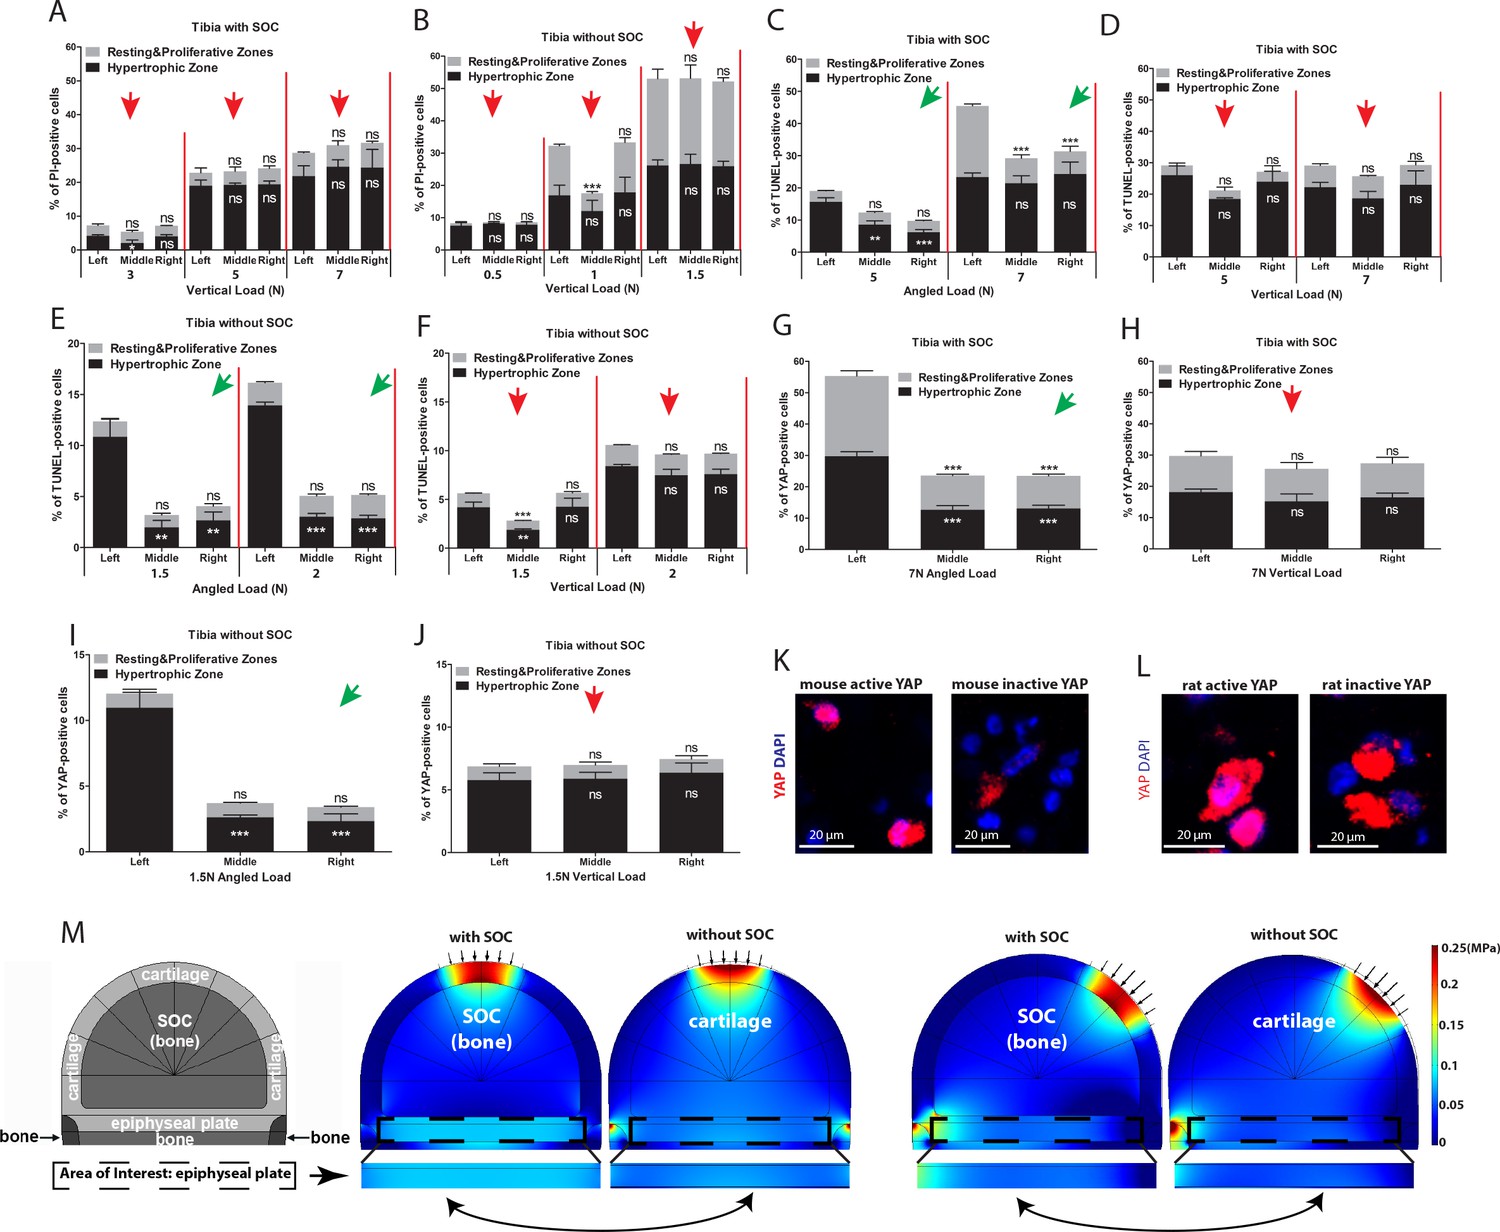
The lateral-medial distribution of cell death upon angular loading.
(A–B) Quantification of PI-positive chondrocytes in relation to the lateral-medial direction of the growth plate of tibia loaded vertically with (A) and without (B) an SOC (see Figure 4A for details). (C–F) Quantification of TUNEL-positive chondrocytes in relation to the lateral-medial direction of the growth plate of the tibia with (C–D) and without (E–F) a SOC subjected to angular (C, E) and vertical (D, F) loading. (G–J) Quantification of the distribution of YAP-positive chondrocytes in relation to the lateral-medial direction within the resting and proliferative and hypertrophic zones of the growth plate of angularly (G, I) and vertically (H, J) loaded tibia with (G–H) and without (I–J) an SOC. Only nuclearized active YAP as demonstrated in k-l was quantified. The red and green arrows indicate the direction of loading (see the legend in Figure 4a for more details). Data are means ± SD, one-way ANOVA. **, p<0.001 and ***, p<0.0001. In (A–J), n = 3. ns, not significant. The black and white asterisks indicate p-values for the resting and proliferative and hypertrophic zones, respectively. (K–L) Immunostaining of active (nuclear) and inactive YAP in mouse (K) and rat (L) chondrocytes. (M) Hydrostatic compressive stress on epiphyseal plates from FEA modeling with physiological loading level. The small arrows indicate the direction of loading and the two-headed curved arrows indicate areas for comparison.
Figure 10 with 2 supplements

Unloading of the hindlimbs in growing rats by either sciatic nerve resection or by tape restriction.
Sciatic nerve resection (A–E) or leg restriction with a kinesiology tape (F–J) was done at 10 days of age and both hindlimbs (manipulated and intact) were analyzed at day 23. For (A–E) sham-operated littermates were used as a control (only right hindlimb was utilized), whereas for (F–J) unmanipulated littermates were used as a control (only right hindlimb was utilized). (A–C, F–H) Representative Safranin O and Fast Green stained images of the knee joint. Black dash lines outline the SOC and solid lines outline the epiphysis area in A and F. Quantification of SOC size (normalized to total epiphysis size) (D, I) and bone mass (within the primary spongiosa region) (E, J). Bars are means ±95% confidential interval and every dot represent an individual animal, two-tailed Student’s t-test. ns, not significant.
Figure 10—figure supplement 1

Footprint analysis revealed a clear difference between the right hindlimb of the sciatic nerve-resected and the sham-operated rats.
Figure 10—figure supplement 2
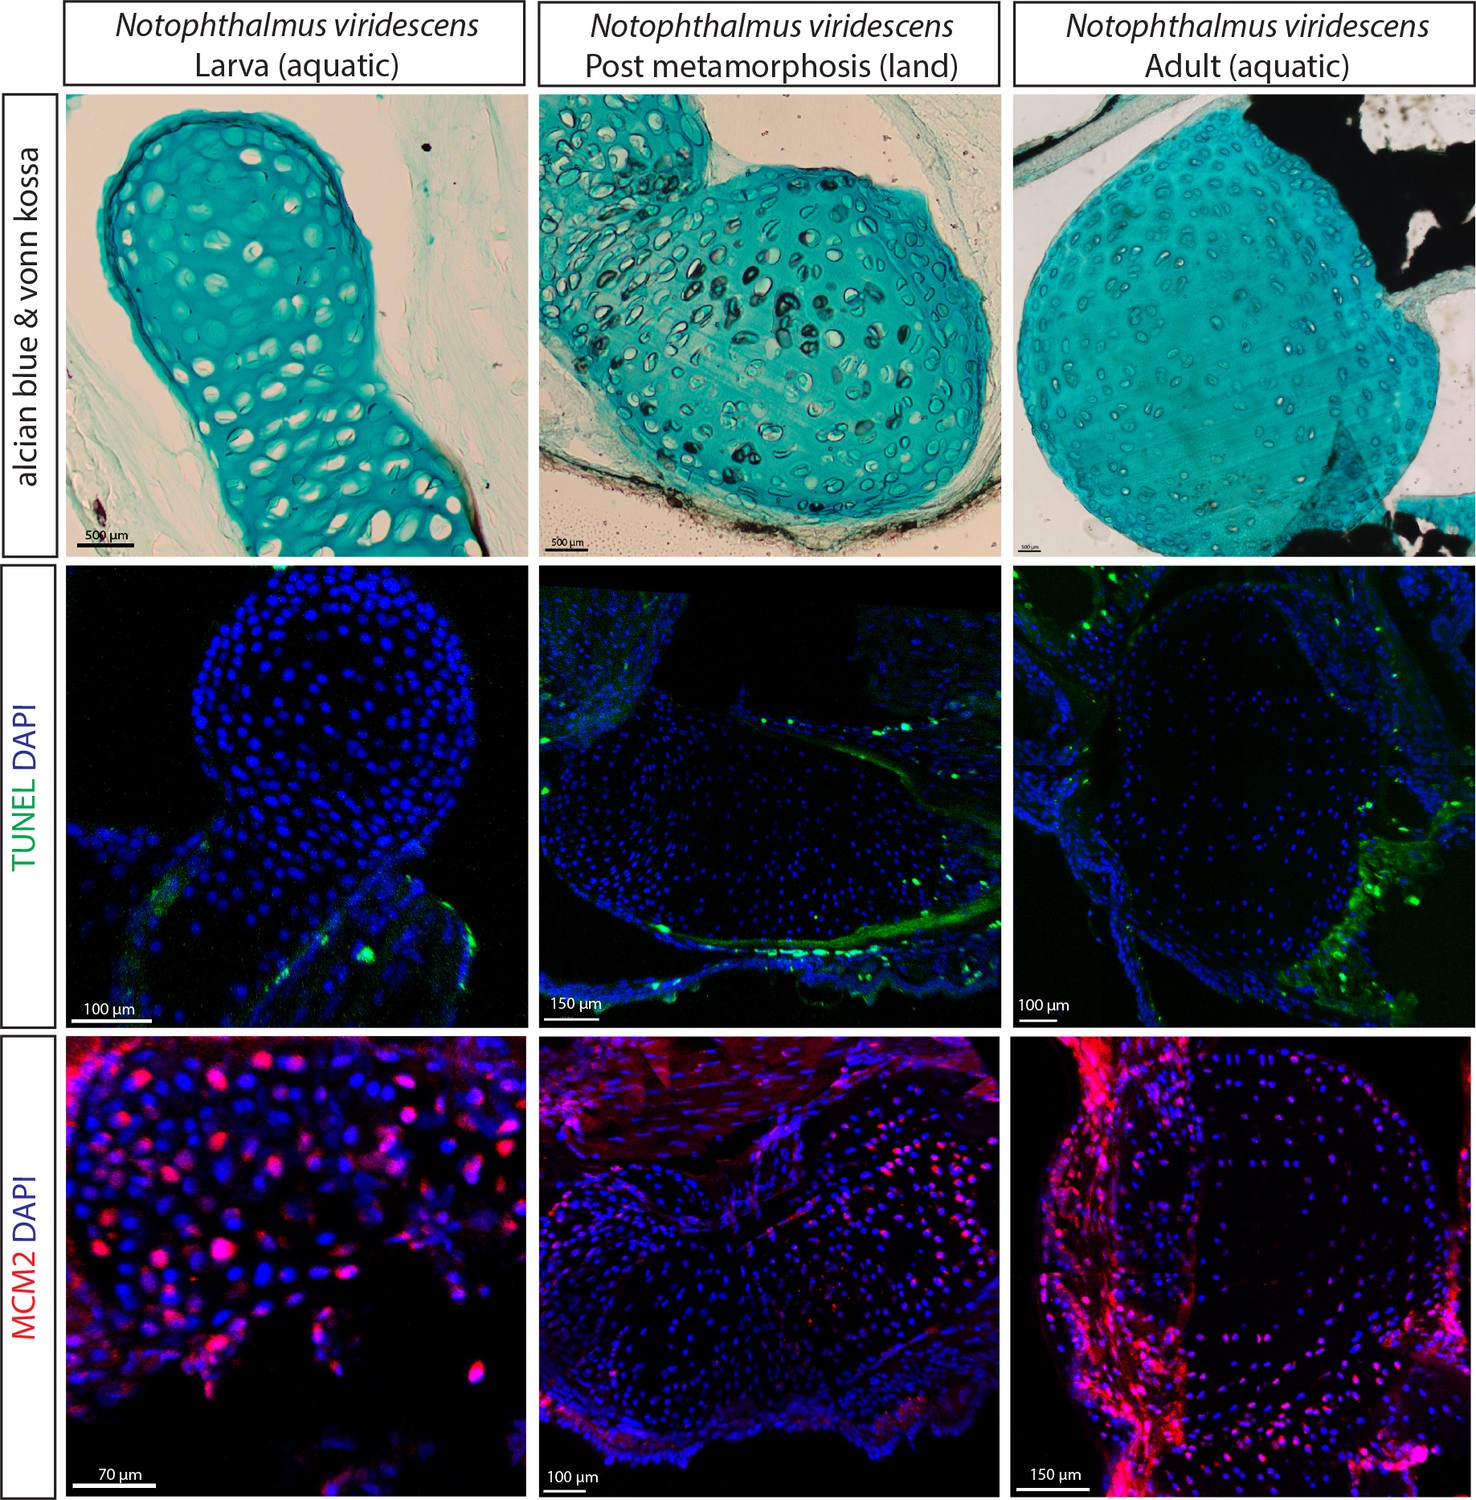
Cartilage calcification but absence of the SOC formation in the newt growing on land.
(A) Alcian blue and von Kossa staining of the humerus of the newt (Notophthalmus viridescens) revealed calcified chondrocytes at the post metamorphosis transient land stage. (B–C) TUNEL (B) and DNA replication licensing factor MCM2 (C) staining of the same salamander species revealed no notiecable differences in apoptotic and proliferating chondrocytes at the three developmental stages.
Tables
Key resources table
| Reagent type (species) or resource | Designation | Source or reference | Identifiers | Additional information |
|---|---|---|---|---|
| Strain, strain background (Mus musculus) | C57BL/6 (mouse strain) | Charles River Laboratories | ||
| Strain, strain background (Rattus norvegicus) | Sprague Dawley (rat strain) | Janvier Labs | ||
| Strain, strain background (Mus musculus) | Col2a1-Cre:Sik3F/F (mouse strain) | Dr. Henry Kronenberg, Massachusetts General Hospital | ||
| Strain, strain background (Mus musculus) | Sik3F/F (mouse strain) | EUCOMM | ||
| Strain, strain background (Mus musculus) | Col2a1-Cre (mouse strain) | Richard R. Behringer, University of Texas MD Anderson Cancer Center | ||
| Strain, strain background (Mus musculus) | Prx-Cre:GnasR201H (mouse strain) | Dr. Murat Bastepe, Massachusetts General Hospital | ||
| Antibody | cleaved caspase 3 (rabbit polyclonal) | Cell Signaling | #9661 | 1:500 |
| Antibody | YAP (mouse monoclonal) | Santa Cruz | sc-101199 | 1:50 |
| Antibody | p73 (rabbit polyclonal) | Abcam | ab137797 | 1:100 |
| Antibody | ki67 (rabbit monoclonal) | Invitrogen | MA5-14520 | 1:20 |
| Antibody | MCM2 (rabbit polyclonal) | Abcam | ab4461 | 1:250 |
Additional files
-
Source data 1
Numerical data for all graphs in the figures.
- https://cdn.elifesciences.org/articles/55212/elife-55212-data1-v2.xlsx
-
Supplementary file 1
Primary data on the level of ossification of the individual bones of all species of Chiroptera analyzed.
- https://cdn.elifesciences.org/articles/55212/elife-55212-supp1-v2.xlsx
-
Transparent reporting form
- https://cdn.elifesciences.org/articles/55212/elife-55212-transrepform-v2.docx
Download links
A two-part list of links to download the article, or parts of the article, in various formats.
Downloads (link to download the article as PDF)
Open citations (links to open the citations from this article in various online reference manager services)
Cite this article (links to download the citations from this article in formats compatible with various reference manager tools)
Secondary ossification center induces and protects growth plate structure
eLife 9:e55212.
https://doi.org/10.7554/eLife.55212


