A critical re-evaluation of fMRI signatures of motor sequence learning
- The Brain and Mind Institute, University of Western Ontario, Canada
- Department of Computer Science, University of Western Ontario, Canada
- Department of Statistical and Actuarial Sciences, University of Western Ontario, Canada
Figures
Figure 1
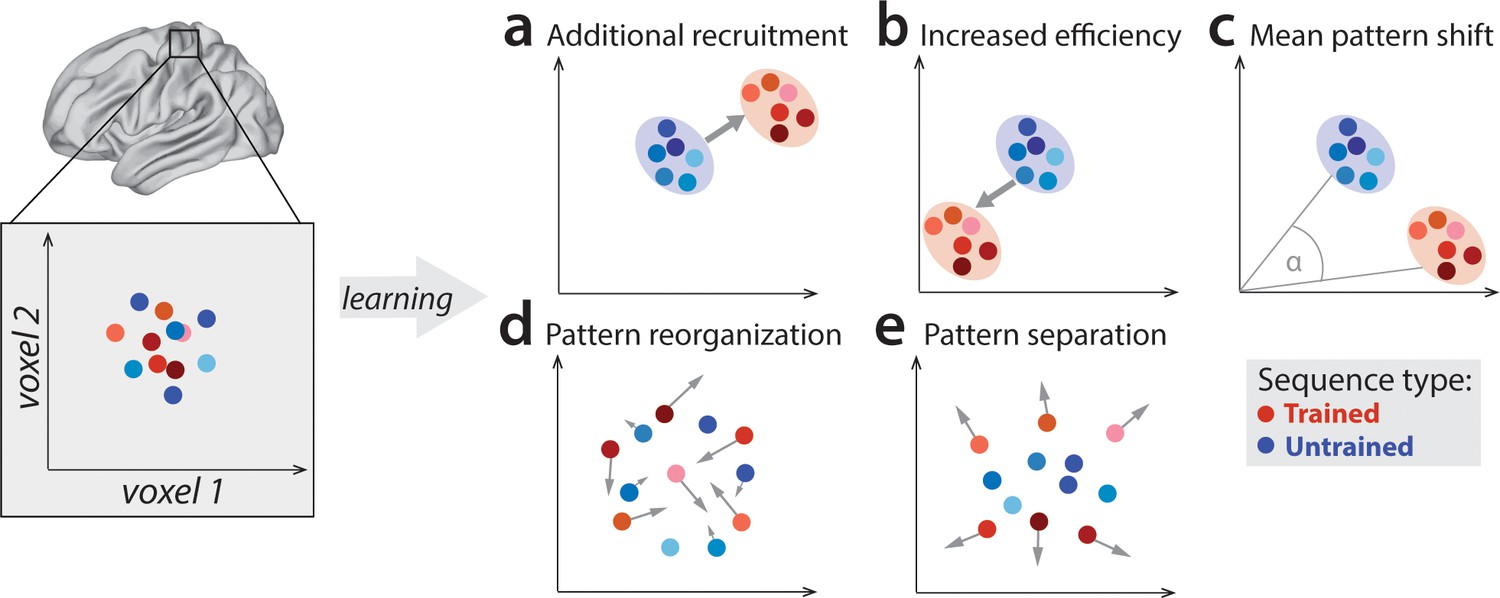
Potential fMRI signatures of learning in a specific brain area.
Each panel shows hypothetical activation for the six trained sequences (red) and the six untrained sequences (blue) in the space of two hypothetical voxels. (a) Activation could increase during learning across voxels, indicating additional recruitment of resources involved in skilled behavior. (b) Activation could decrease across voxels, implying that the region performs its function more efficiently. (c) Some voxels (x-axis) could increase activation with training, while others (y-axis) could decrease. This would lead to a shift of the overall activity pattern in the region without an overall net change in activation. (d) Activation patterns specific to each trained sequence could undergo more change than untrained sequences, reflective of plastic reorganization of the sequence representation. Arrow length in the figure indicates the amount of reorganization. (e) One specific form of such reorganization would be increasing dissimilarities (pattern separation) between activity patterns for individual trained sequences.
Figure 2 with 1 supplement

Experimental design and paradigm.
(a) Apparatus and task. Participants were trained to perform six 9-item sequences on a keyboard device. For each finger press, the corresponding digit on the screen turned green (correct) or red (incorrect). During fMRI scans 1–3, an expanding pink line under the numbers indicated the pace at which participants had to press the keys. See Figure 2—figure supplement 1 for trial structure during scanning sessions. (b) Training protocol lasted for 5 weeks, and included four behavioral test sessions (yellow underlay) and four scans (grey underlay). Scans 1–3 were performed at a paced speed, while scan 4 performance was full speed (fs). (c) Average group performance executing trained sequences across the training sessions, measured in seconds. The average movement time (MT) decreased with learning. Shaded area denotes between-subject standard error. (d) Performance during scanning sessions and behavioral tests, measured in seconds. Performance of trained sequences improved across all subsequent behavioral test sessions. Performance improved also for untrained sequences from week 2 onwards, suggesting some transfer in learning, but performance was still faster for trained sequences, indicating sequence-specific learning. Error bars indicate between-subject standard error. Stars denote significance levels lower than p<0.001.
Figure 2—figure supplement 1
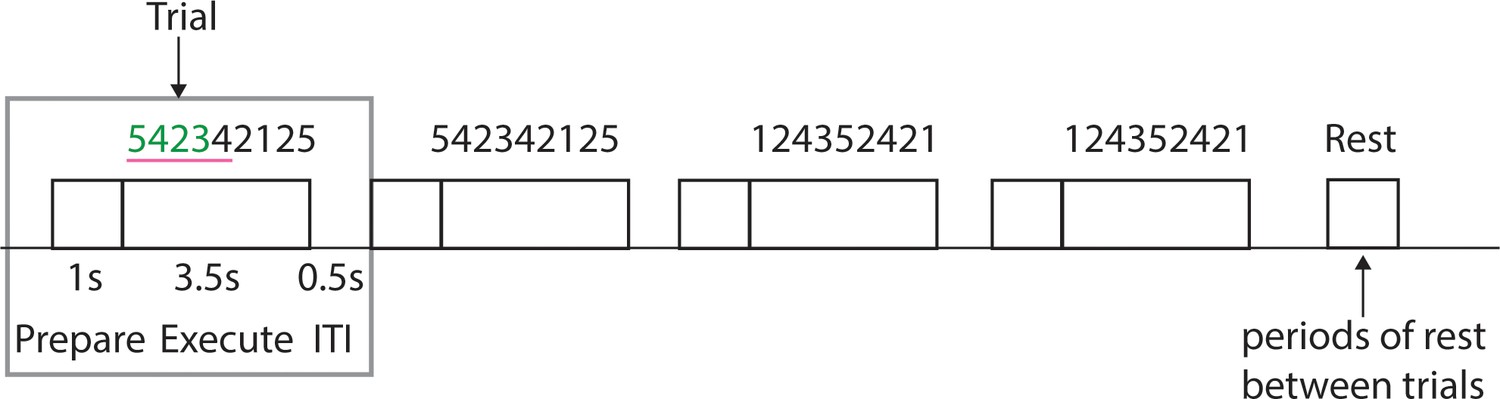
Experimental trial structure during scanning sessions.
Each trial consisted of a preparation period, execution period and inter-trial-interval (ITI), during which the feedback was presented on correctness of the trial. Each sequence was presented twice in a row. Periods of rest were added in-between the trials.
Figure 3 with 1 supplement
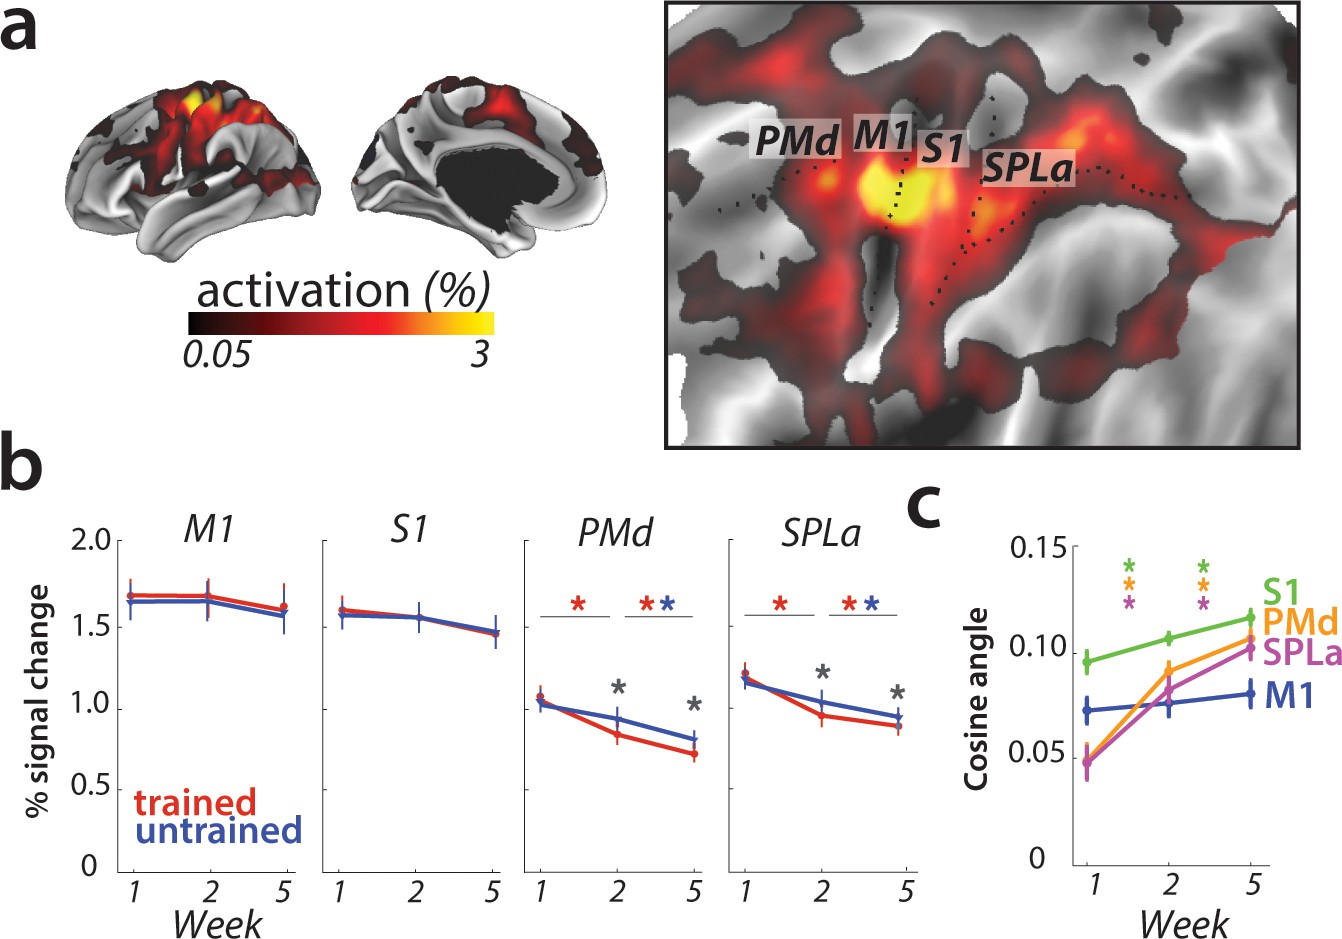
Overall activation and changes with learning in defined regions of interest.
(a) Average activation during production of any sequence in scanning session 1 (prior to learning) in the hemisphere contralateral to the performing hand. Activation was contrasted against resting baseline. On the right, activation map is presented on a flattened surface, corresponding to surface maps in other figures. (b) Changes in activation across predefined areas – primary motor cortex (M1), primary somatosensory cortex (S1), premotor dorsal area (PMd) and superior parietal lobule – anterior (SPLa). No significant changes in activation were observed in M1 or S1 across weeks or between trained and untrained sequences (* indicates p<0.01). Error bars indicate between-subject standard error. See Figure 3—figure supplement 1a for results with error trials excluded. (c) The cosine angle dissimilarity between average trained and untrained sequence across scanning weeks. The cosine angle increased significantly across weeks in PMd, SPLa and S1, but not M1 (* indicates p<0.05). Error bars indicate between-subject standard error. See Figure 3—figure supplement 1b for results with error trials excluded.
Figure 3—figure supplement 1

Changes in activation and mean pattern dissimilarity across predefined areas, estimated only on correct trials.
(a) Changes in activation across predefined areas – primary motor cortex (M1), primary somatosensory cortex (S1), premotor dorsal area (PMd) and superior parietal lobule – anterior (SPLa). As in the analysis with all trials included, no significant changes in activation were observed in M1 or S1 across weeks or between trained and untrained sequences (* indicates p<0.01). Error bars indicate between-subject standard error. (b) The cosine angle dissimilarity between average trained and untrained sequence across scanning weeks. The cosine angle increased significantly across weeks in PMd, and SPLa, but not M1. In S1, average dissimilarity estimated on correct trials only increased significantly across weeks 2–5, but not 1–2 (* indicates p<0.05). Error bars indicate between-subject standard error.
Figure 4 with 1 supplement
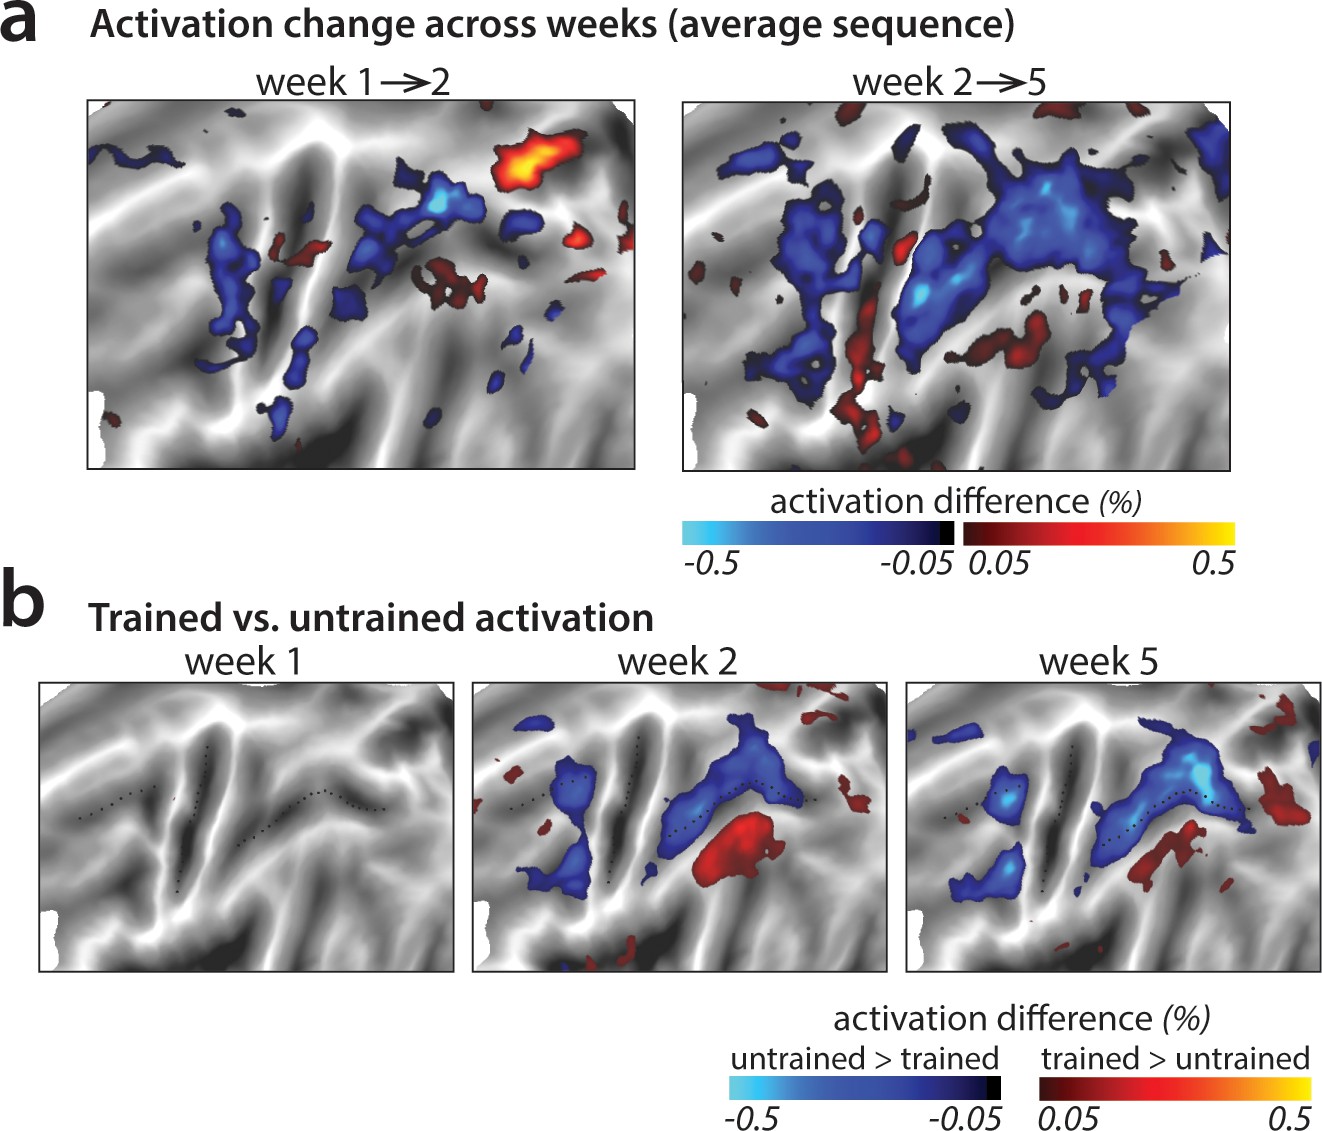
Changes in average activation across the cortical surface.
(a) Average change in activation across subsequent sessions. Activation was measured as difference in percent signal change relative to the resting baseline. Activation decreased (blue shades) in motor-related regions across sessions during sequence execution. (b) Contrast of activation for trained vs. untrained sequences per scanning session. In weeks 2 and 5, trained sequences elicited lower activation in motor-related regions than untrained sequences (blue shades; see Figure 4—figure supplement 1 for t-maps and statistical quantification of activation clusters). Areas with observed increases in activation for trained sequences (red shades) lie in the default mode network that showed on average lower activity during task than rest.
Figure 4—figure supplement 1
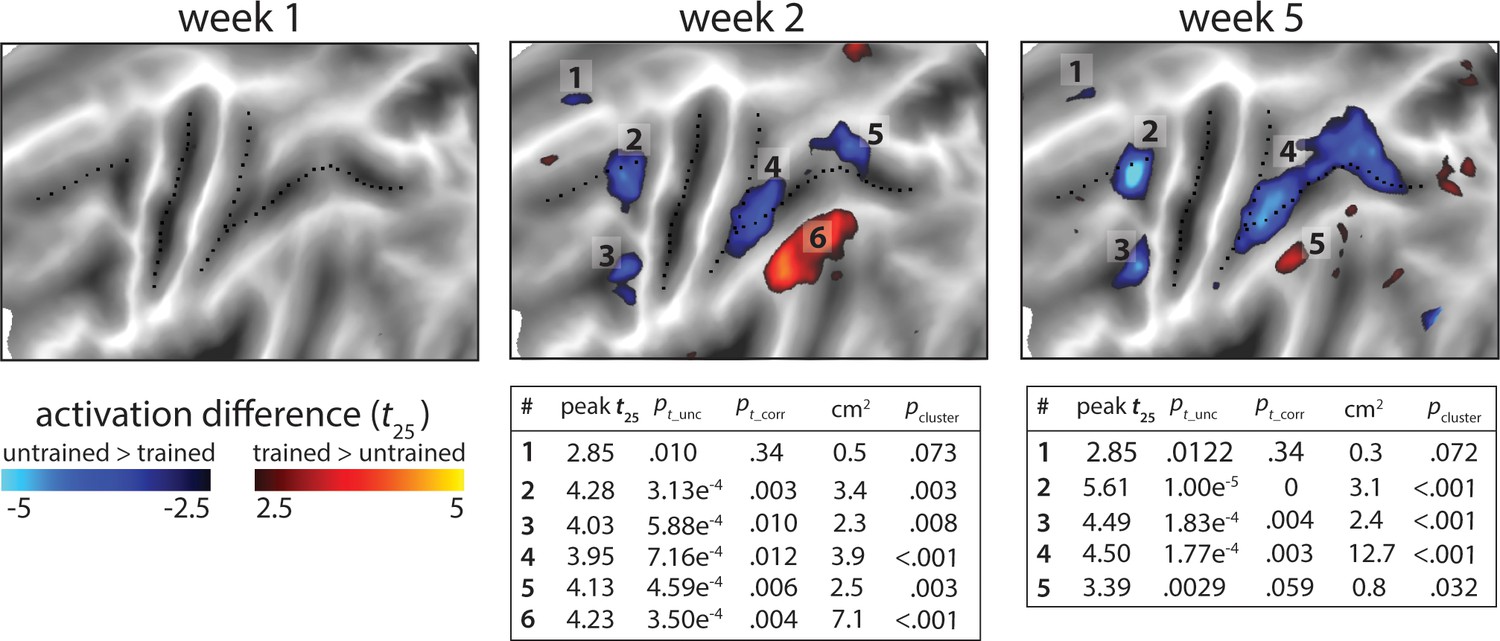
Statistical maps for the trained vs. untrained contrasts on elicited activation in each session.
Trained >untrained is shown in red, untrained >trained in blue. Maps were thresholded at a t25 = ± 2.5, p<0.01 uncorrected for a two-sided t-test. Tables show peak t-value and size (in cm2) for each super-threshold cluster (indicated by numbers) for maps of week 2 and 5. pt_unc is the uncorrected p-value for the peak of each cluster. Family-wise error corrected p-values were determined using permutation testing for the peak t-value (pt_corr) and cluster size (pcluster).
Figure 5
Relative change in evoked activation.
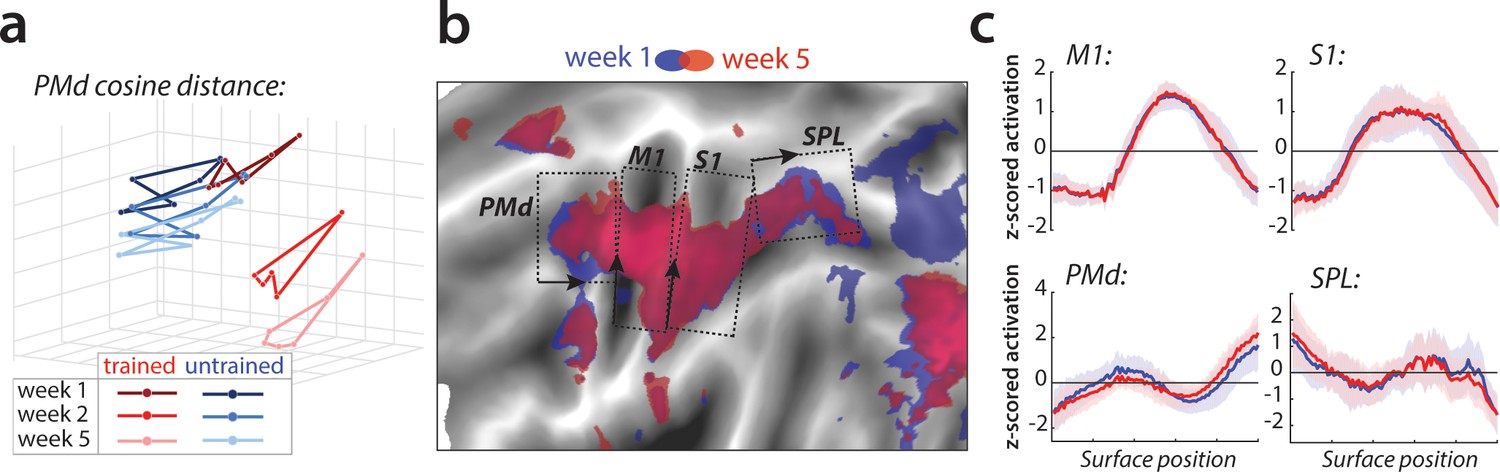
(a) Multidimensional scaling plot of cosine angle dissimilarities for trained and untrained sequences in premotor dorsal area (PMd) across weeks 1–5. Each dot represents a single sequence, and dots are connected for each session and sequence type separately. Trained sequences on average become more distant from untrained sequences with learning. Untrained sequences on average also progress across weeks, but less than trained sequences. (b) Normalized activation plots for trained sequences in week 1 (blue) and 5 (red). The arrows and brackets indicate the direction and range of activation cross-sections presented in c). Areas: dorsal premotor cortex (PMd), primary motor cortex (M1), primary somatosensory cortex (S1), superior parietal lobule (SPL). (c) Cross-section of elicited activation for trained sequences in defined areas, in weeks 1 (blue) and 5 (red).
Figure 6 with 1 supplement
Sequence-specific activity patterns reorganize across sessions.
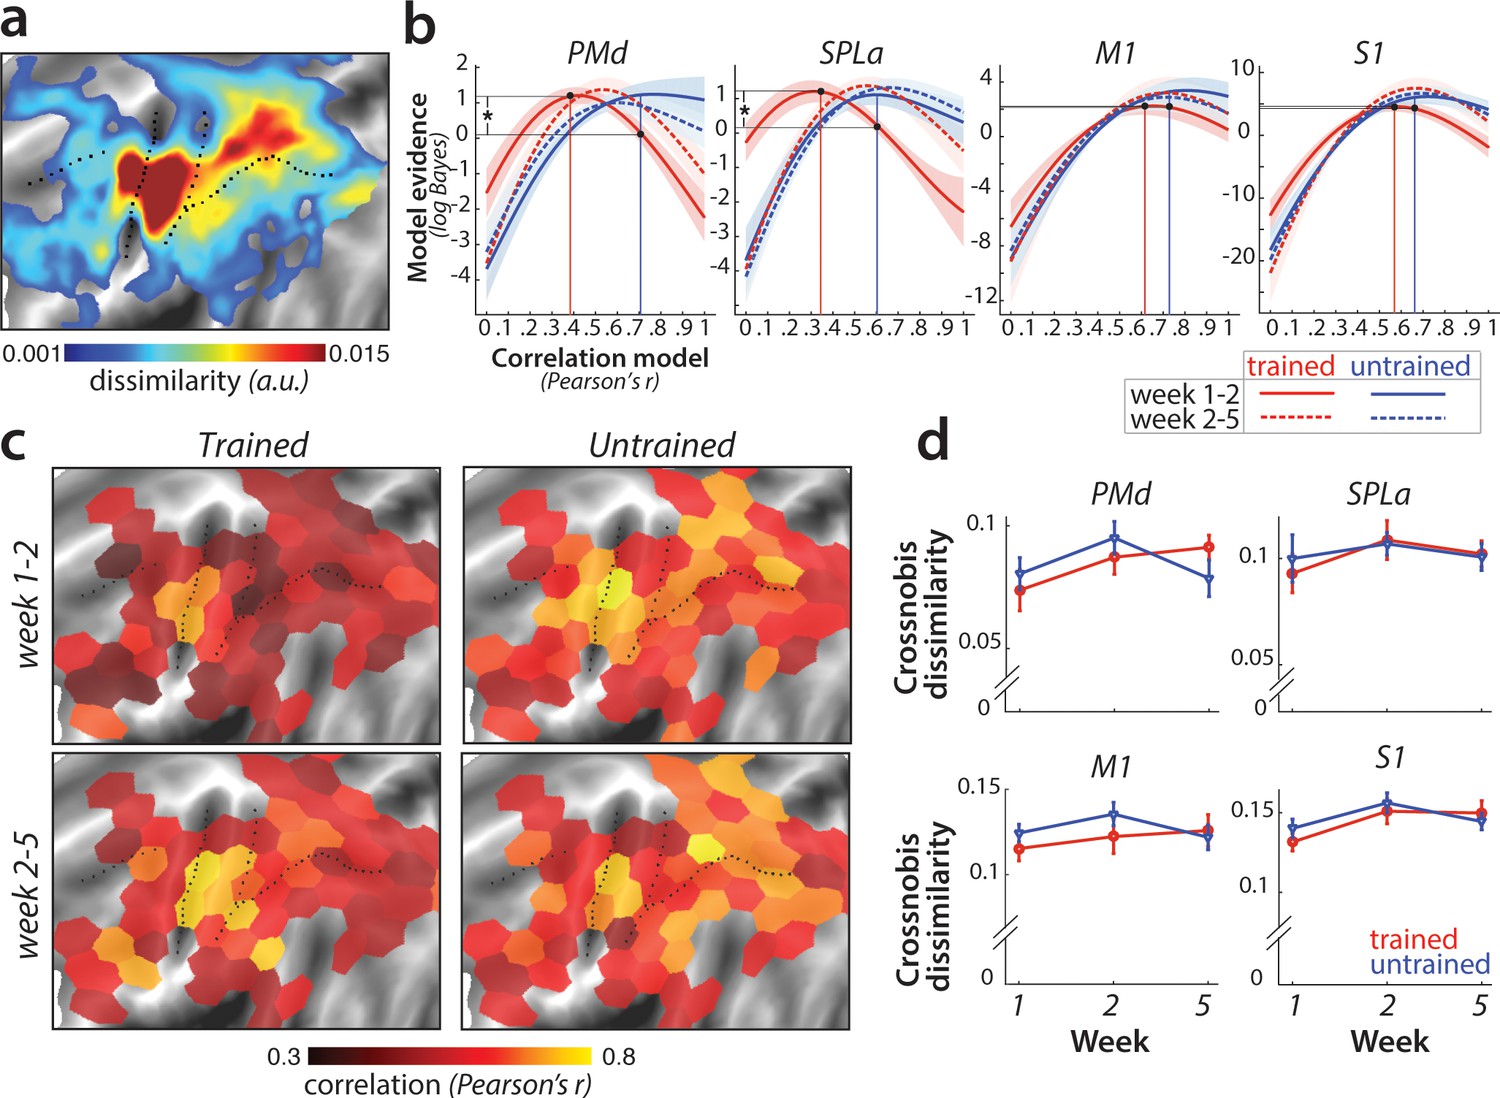
(a) Cortical surface map of crossnobis dissimilarities between activity patterns for different sequences in session 1. These regions encode which sequence is executed by the participant. (b) Evidence of models of correlation values between r = 0 and r = 1 for sequence-specific patterns across weeks 1–2 (solid) and 2–5 (dashed), separately for trained (red) and untrained (blue) sequences. Evidence was assessed with a type-II log-likelihood, relative to the average log-likelihood across models. Shaded areas indicate standard error across participants. Difference between log-likelihoods can be interpreted as a log-Bayes factor, with a difference of 1 indicating positive evidence. Vertical lines indicate the winning correlation model for trained (red) and untrained (blue) patterns across weeks 1–2. Black dots are projections of the two winning models onto the correlation function of trained sequences across weeks 1–2. The horizontal lines from the two black dots indicate the likelihood of the trained data under the two models, which was tested in a crossvalidated t-test. See Figure 6—figure supplement 1a for the same analysis with error trials excluded. (c) Map displaying the correlation of the winning model for trained and untrained sequences across weeks 1–2 and 2–5. The correlation of the winning correlation model is shown in all tessels where the difference between evidence for winning model vs. worst-fitting model exceeds log-Bayes factor of 1 (averaged across participants). See Figure 6—figure supplement 1b for the difference in best model correlation between trained and untrained sequences, and an indication of tessels where the difference is significant, as based on the crossvalidated t-test. (d) Crossnobis dissimilarities between trained and untrained sequence pairs across weeks. No significant effect of week, sequence type or their interaction was observed in any of the regions. Error bars indicate standard error across participants.
Figure 6—figure supplement 1

Changes in pattern correlation across weeks.
(a) Evidence for models of correlation values between r = 0 and r = 1 for sequence-specific patterns across weeks 1–2 (solid) and 2–5 (dashed), estimated only on trials with correct performance. Correlations of trained patterns are in red, untrained in blue. Evidence was assessed with a type-II log-likelihood, relative to the average log-likelihood across models. Shaded areas indicate standard error across participants. Vertical lines indicate the winning correlation model for trained (red) and untrained (blue) patterns across weeks 1–2. Black dots mark the log-likelihood of the trained sequence across weeks 1–2 under the winning models. Horizontal lines from the two black dots indicate the difference in likelihood of the trained data under the two models, tested in a crossvalidated t-test (* indicates p<0.05 for one-sided t-statistics). (b) Difference between correlation of the winner models for trained and untrained sequences, as presented in Figure 6c. Blue indicates a lower correlation across weeks for trained than untrained patterns of activity. The correlation difference values are plotted in tessels where the difference in model evidence was significant, as based on the cross-validated t-test (for two-sided p<0.05).
Figure 7 with 1 supplement

Speed-related changes in activation and dissimilarities.
(a) Overall activation in week 5 in paced and full speed sessions for trained (red) and untrained (blue) sequences. Activation was measured as percent signal change over resting baseline (* indicates p<0.05). Error bars indicate standard error across participants. (b) Increase in activation for full speed compared to paced speed in percent signal change, averaged across trained and untrained sequences. Red colors indicate an increase in activity during full speed performance compared to paced performance. Blue colors indicate higher activation during paced compared to full speed performance. (c) Difference in activation elicited for trained relative to untrained sequences, during the paced and full speed sessions (see Figure 7—figure supplement 1a for statistical maps). Trained > untrained is shown in red, untrained > trained in blue. (d) Average crossnobis dissimilarity between sequence-specific patterns in paced and full speed sessions for trained (red) and untrained (blue) sequences. Dissimilarities are significantly larger for trained, as compared to untrained patterns in PMd during the full-speed session (* indicates p<0.05). Error bars indicate standard error across participants. (e) Difference between crossnobis dissimilarities across full speed and paced sessions, averaged across trained and untrained sequences. Higher dissimilarities for full speed than paced session are shown in red, whereas blue/green hues indicate higher dissimilarities during paced than full speed session. (f) Difference in dissimilarities for trained relative to untrained sequences, during the paced and full speed sessions. Trained > untrained is shown in red, untrained > trained in blue/green. Trained sequences elicited higher dissimilarities than untrained in full speed, but not paced session (see Figure 7—figure supplement 1b for statistical t-maps).
Figure 7—figure supplement 1
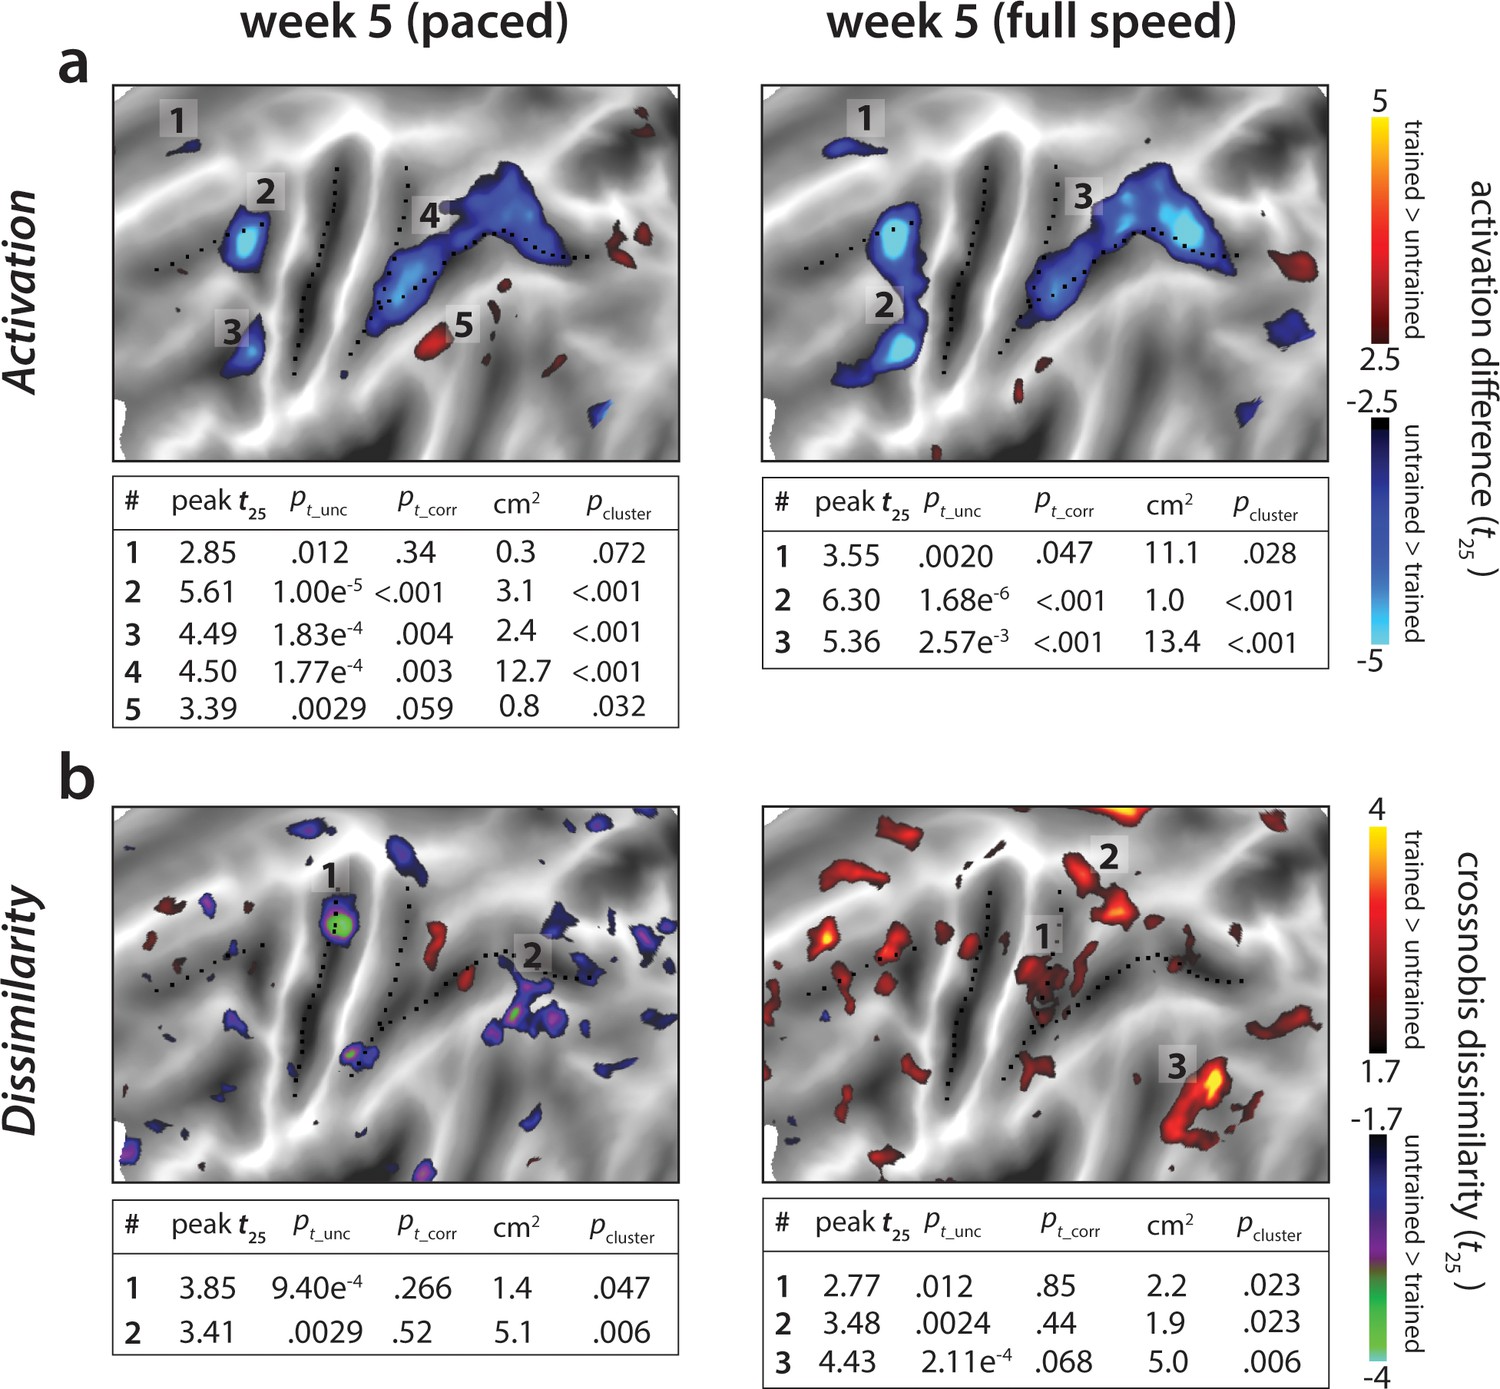
Statistical maps for trained vs. untrained contrasts in week 5 (paced) and 5* (full speed) sessions.
Trained > untrained is shown in red, untrained > trained in blue. (a) Statistical contrast for average activation. Maps were thresholded at a t25 = ± 2.5, p<0.01 uncorrected for a two-sided t-test. Tables show peak t-value and size (in cm2) for each super-threshold cluster. pt_unc is the uncorrected p-value for the peak of each cluster. Family-wise error corrected p-values were determined using permutation testing for the peak t-value (pt_corr) and cluster size (pcluster). (b) Statistical contrast for average dissimilarity of sequence-specific activity pattern. Map was thresholded at t25 = ± 1.7, p<0.05, uncorrected. Statistical quantification using permutation tests is in the table below each map.
Figure 8
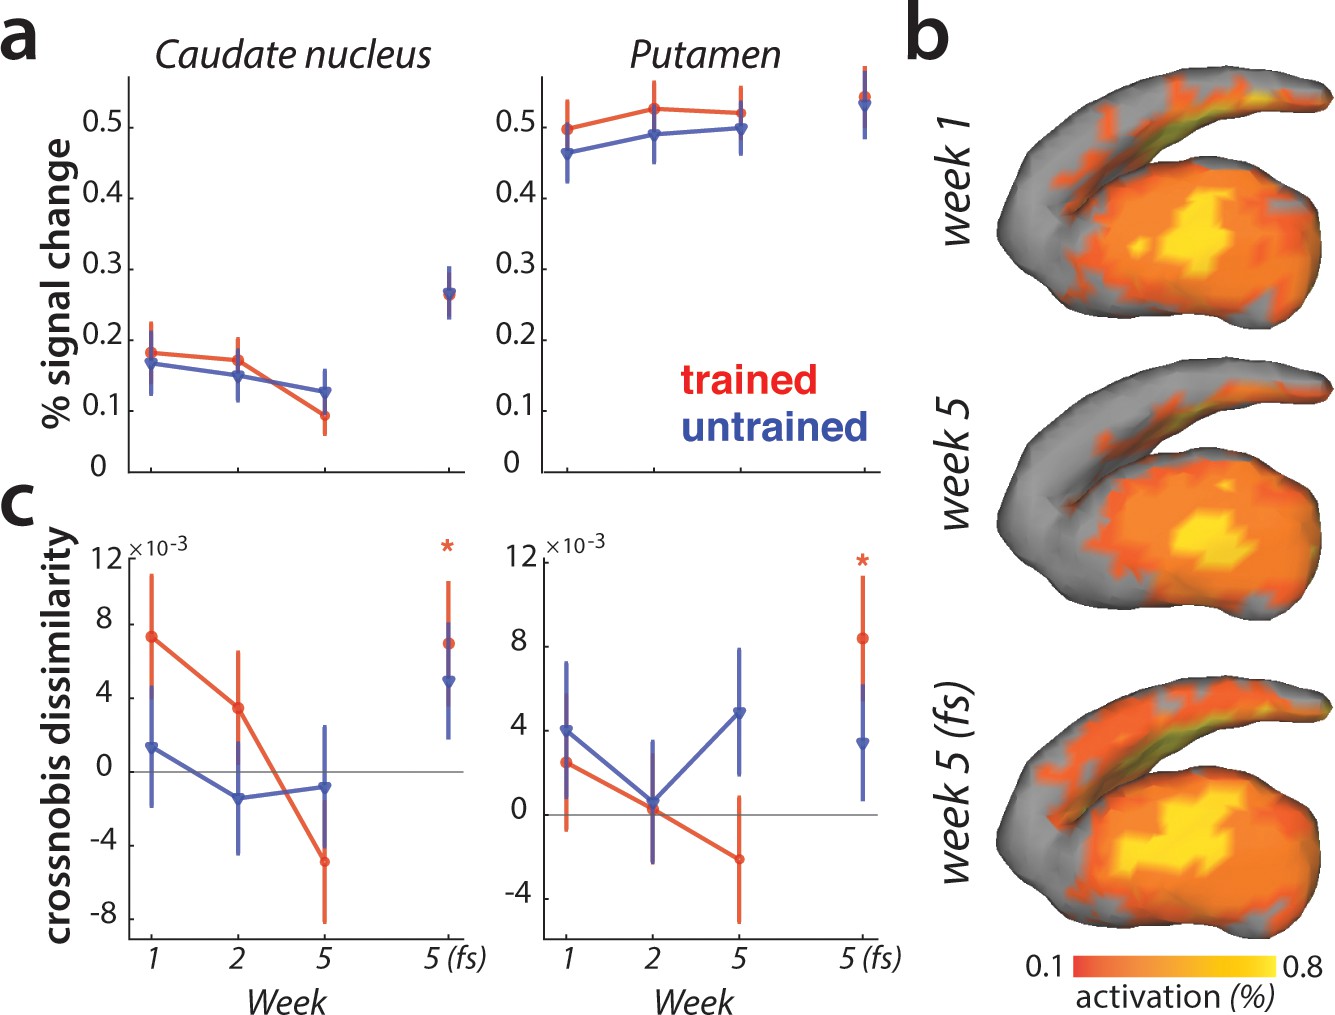
Striatal changes in activation and dissimilarities with learning.
(a) Overall activation (percent signal change over resting baseline), for trained (red) and untrained (blue) sequences. Activation did not differ across sessions, or sequence types in the striatum. Error bars indicate the standard error across participants. (b) Activation during performance of trained sequences in the striatum across weeks 1, 5 (paced speed) and 5 (full speed – fs), averaged across sequences and participants. (c) Crossnobis dissimilarities between activation patterns of sequence pairs, calculated separately for trained and untrained patterns. Dissimilarities were not significantly different for trained or untrained sequences during paced performance. At full speed, sequence-specific activity patterns amongst trained sequences differed significantly in both caudate nucleus and pallidum (* indicates p<0.05). Error bars indicate the standard error across participants.
Author response image 1
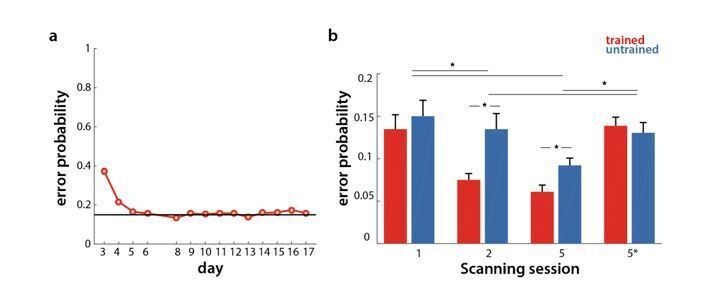
Error rate in behavioral and scanning sessions.
a) Percentage of erroneous trials for trained sequences throughout behavioral training days. b) Percentage of errors for trained (red) and untrained (blue) sequences in the scanning sessions across weeks 1, 2 and 5 (1, 2, 5 at paced speed, 5* at full speed).
Author response image 2

Relative log-evidence (log marginal likelihood) for different correlation models across sessions (week 1-2 in solid lines, week 2-5 in dotted lines) for trained (red) and untrained (blue) activity patterns.
Regions: PMd (dorsal premotor cortex), SPLa (superior parietal lobule – anterior part), M1 (primary motor cortex), S1 (primary somatosensory cortex). Difference between log-likelihoods can be interpreted as log-Bayes factor, with a difference of 1 indicating positive evidence. Vertical lines indicate the winning correlation model for trained (red) and untrained (blue) patterns across weeks 1-2. Black dots are projections of the two winning models onto the correlation function of trained sequences (weeks 1-2). The horizontal lines from the two black dots indicate the likelihood of the trained data under the two models, which was tested in a cross validated t-test. a) Evidence based on preprocessing, reported in manuscript (here just adjusted in y-axis. b) Evidence for correlations after removing error trials from a general linear model estimation.
Author response image 3
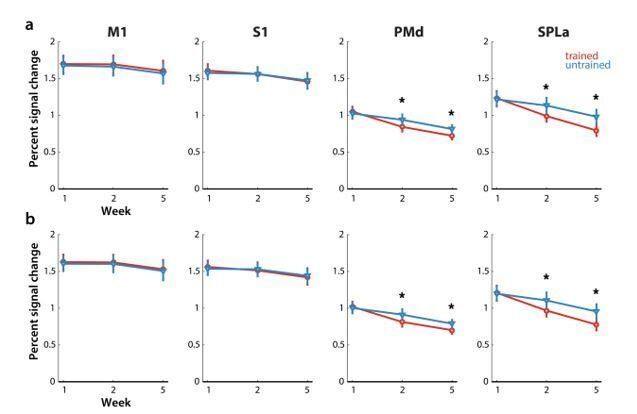
Elicited activation, measured as percent signal change over resting baseline across weeks for trained (red) and untrained (blue) sequences.
Regions: M1 (primary motor cortex), S1 (primary somatosensory cortex), PMd (dorsal premotor cortex), SPLa (superior parietal lobule – anterior part). a) Estimated elicited activation based on preprocessing, reported in manuscript. b) Estimated elicited activation after removing error trials from a general linear model estimation.
Author response image 4
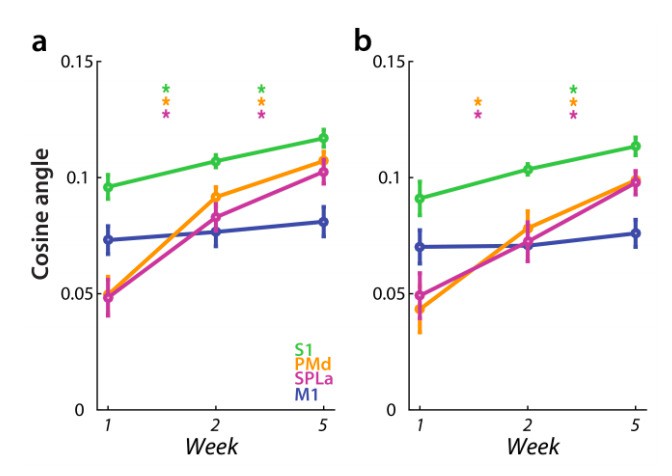
Dissimilarity between average trained and untrained sequence, measured with cosine angle.
Regions: M1 (primary motor cortex), S1 (primary somatosensory cortex), PMd (dorsal premotor cortex), SPLa (superior parietal lobule – anterior part). a) Estimated elicited activation based on preprocessing, reported in manuscript. b) Estimated elicited activation after removing error trials from a general linear model estimation.
Author response image 5

Changes in movement time and error in behavioral training sessions, split between executions 1 and 2.
a) Movement time to execute trained sequences across training days, split between execution 1 – digits presented on the screen, and execution 2 – from memory.
b) Error rate, split between executions 1 and 2 for training days.
Author response image 6
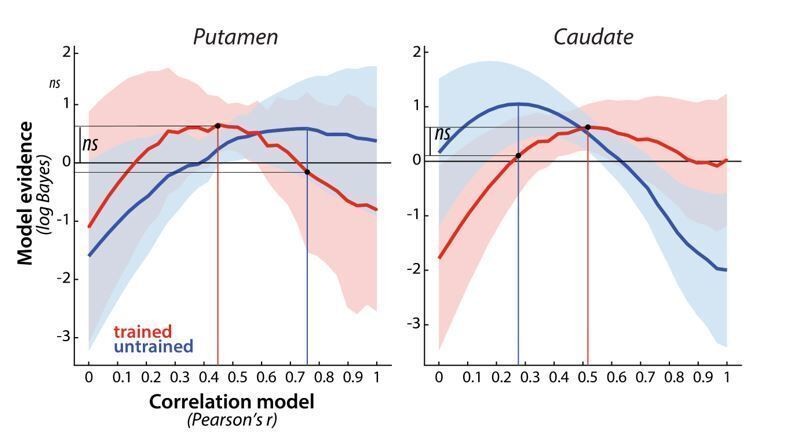
Evidence for different correlation models, across paced and full speed sessions in week 5, for trained (red) and untrained (blue) patterns in putamen and caudate.
Model evidence was measured as a log-Bayes factor relative to the average log-Bayes across all models (horizontal line at 0). The red and blue lines are drawn for correlation model with highest evidence for trained and untrained patterns, respectively. Vertical lines indicate winning model for trained and untrained sequences. Horizontal lines indicate the difference in log-likelihood of the trained data under these two model, which was evaluated in a cross validated fashion.
Additional files
Download links
A two-part list of links to download the article, or parts of the article, in various formats.
Downloads (link to download the article as PDF)
Open citations (links to open the citations from this article in various online reference manager services)
Cite this article (links to download the citations from this article in formats compatible with various reference manager tools)
A critical re-evaluation of fMRI signatures of motor sequence learning
eLife 9:e55241.
https://doi.org/10.7554/eLife.55241


