Genomic and phenotypic evolution of Escherichia coli in a novel citrate-only resource environment
- Department of Microbiology and Molecular Genetics, Michigan State University, United States
- The BEACON Center for the Study of Evolution in Action, United States
- Department of Biomedical Engineering, Duke University, United States
- Department of Biology, Kenyon College, United States
- Program for Systems, Synthetic, and Quantitative Biology, Harvard University, United States
- Department of Molecular Biosciences, The University of Texas, United States
Figures
Figure 1
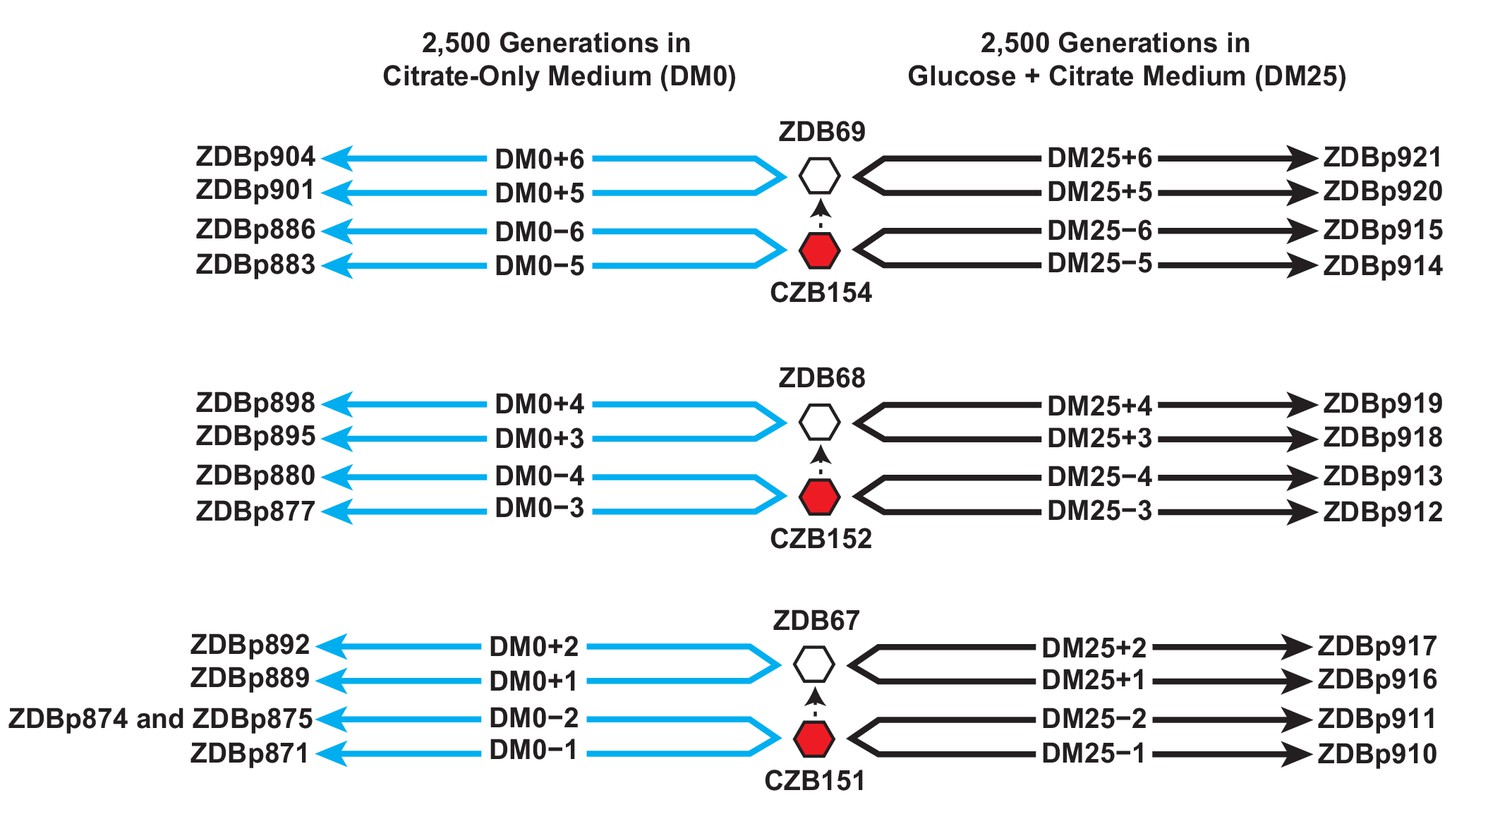
Experimental design and sequenced clone derivations.
We isolated three Cit+ clones (red hexagons) from generation 33,000 of LTEE population Ara−3. We then derived Ara+ mutants (white hexagons) from those three LTEE clones. We used these six clones to found 24 populations. Twelve populations evolved for 2500 generations in citrate-only medium, DM0 (cyan lines). The remaining 12 evolved for 2500 generations in glucose and citrate medium, DM25 (black lines). The evolved clones we isolated after 2500 generations for genomic and phenotypic analysis are shown for each population.
Figure 2
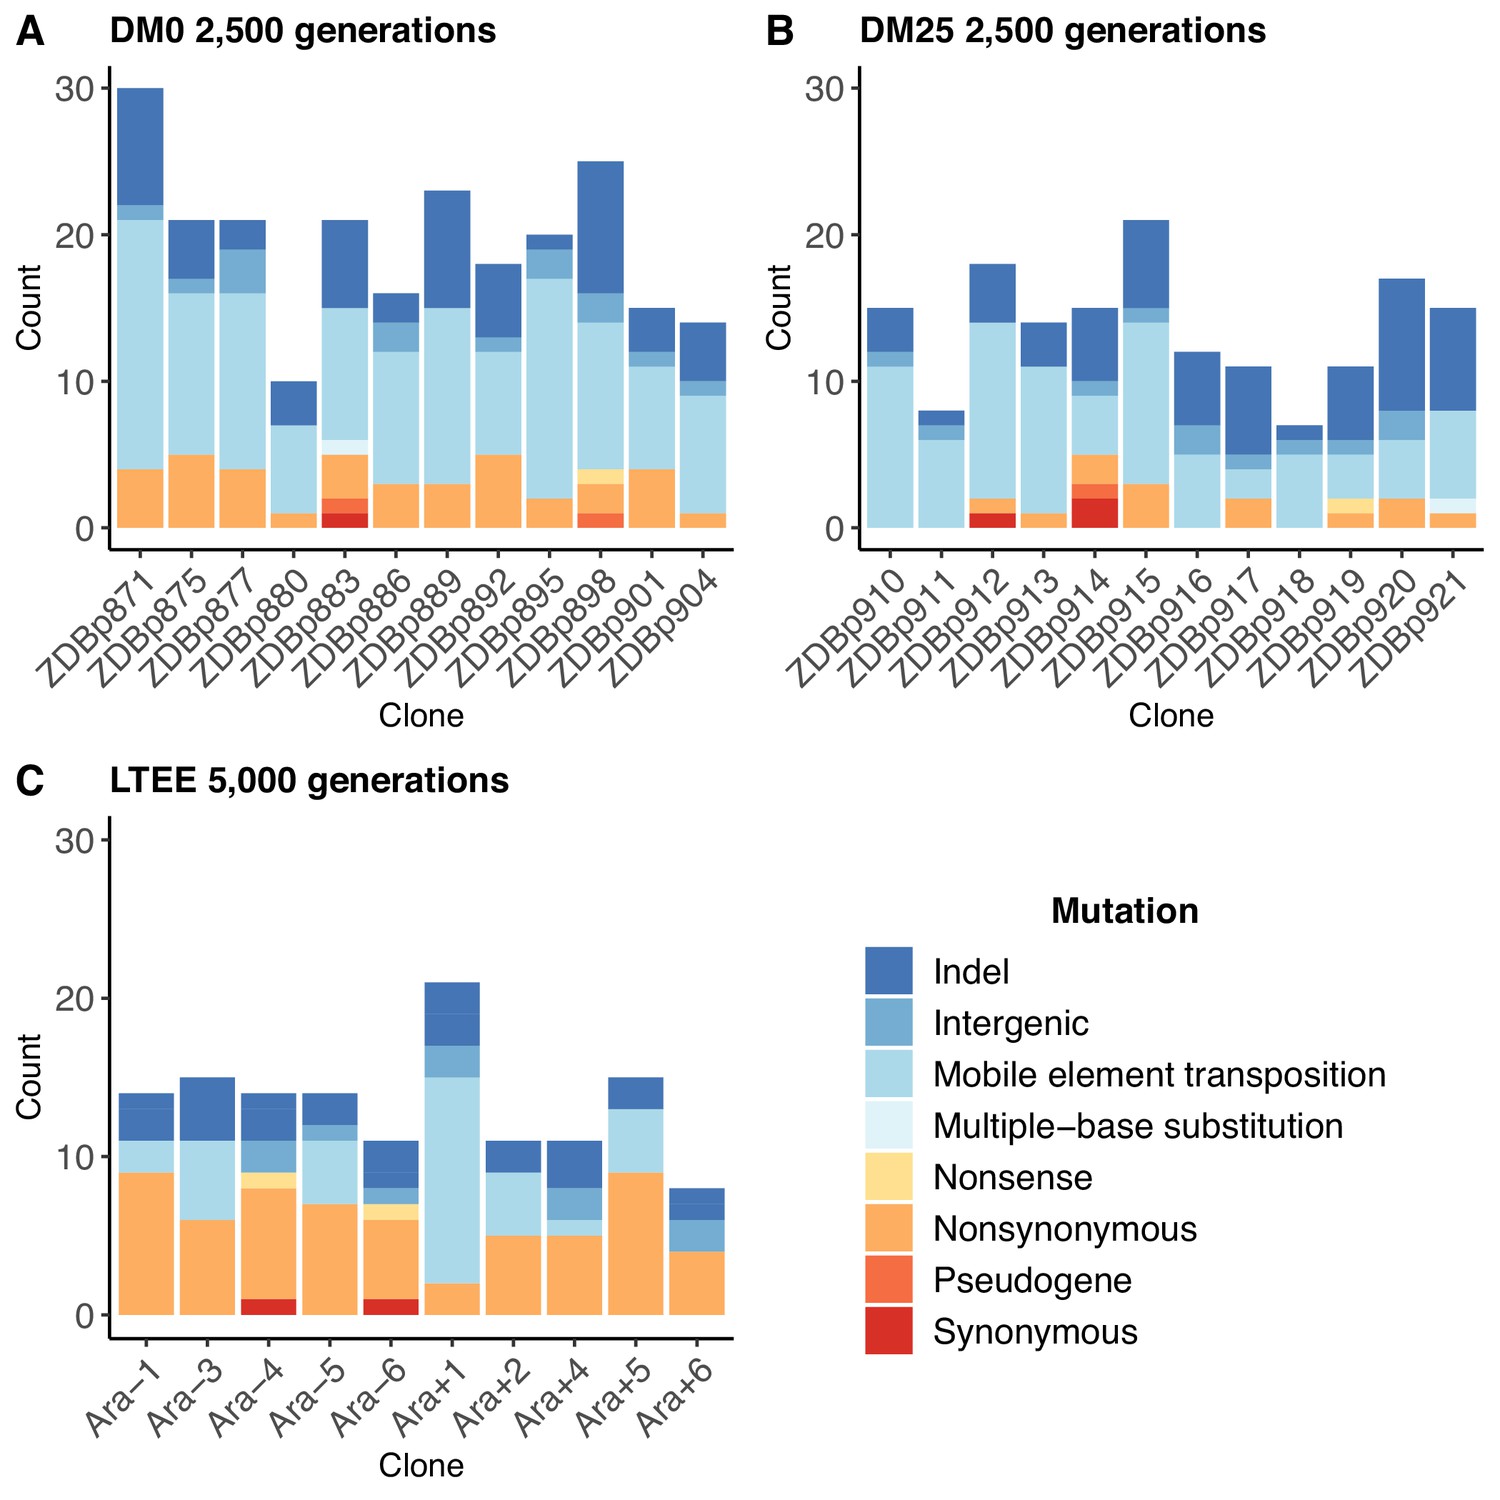
Numbers and types of mutations in evolved genomes.
(A) Evolved genomes from the DM0 treatment after 2500 generations. (B) Evolved genomes from the DM25 treatment after 2500 generations. (C) Evolved genomes in the 10 non-hypermutable LTEE populations after 5000 generations. Mutations are color-coded according to the key: indel, insertions and deletions (excluding large duplications and amplifications); intergenic, intergenic point mutations; mobile-element transpositions; multiple-base substitution, consecutive point mutations (including adjacent to and in conjunction with indels); nonsense, nonsynonymous, and synonymous point mutations in protein-coding genes; pseudogene, mutations in pseudogenes.
-
Figure 2—source data 1
All evolved mutations found in the DM0-treatment and DM25-treatment clones.
- https://cdn.elifesciences.org/articles/55414/elife-55414-fig2-data1-v2.csv
-
Figure 2—source data 2
Classification and counts of mutations in the 264 LTEE genomes, originally published as Supplementary Table 4 of Tenaillon et al., 2016.
- https://cdn.elifesciences.org/articles/55414/elife-55414-fig2-data2-v2.xlsx
Figure 3
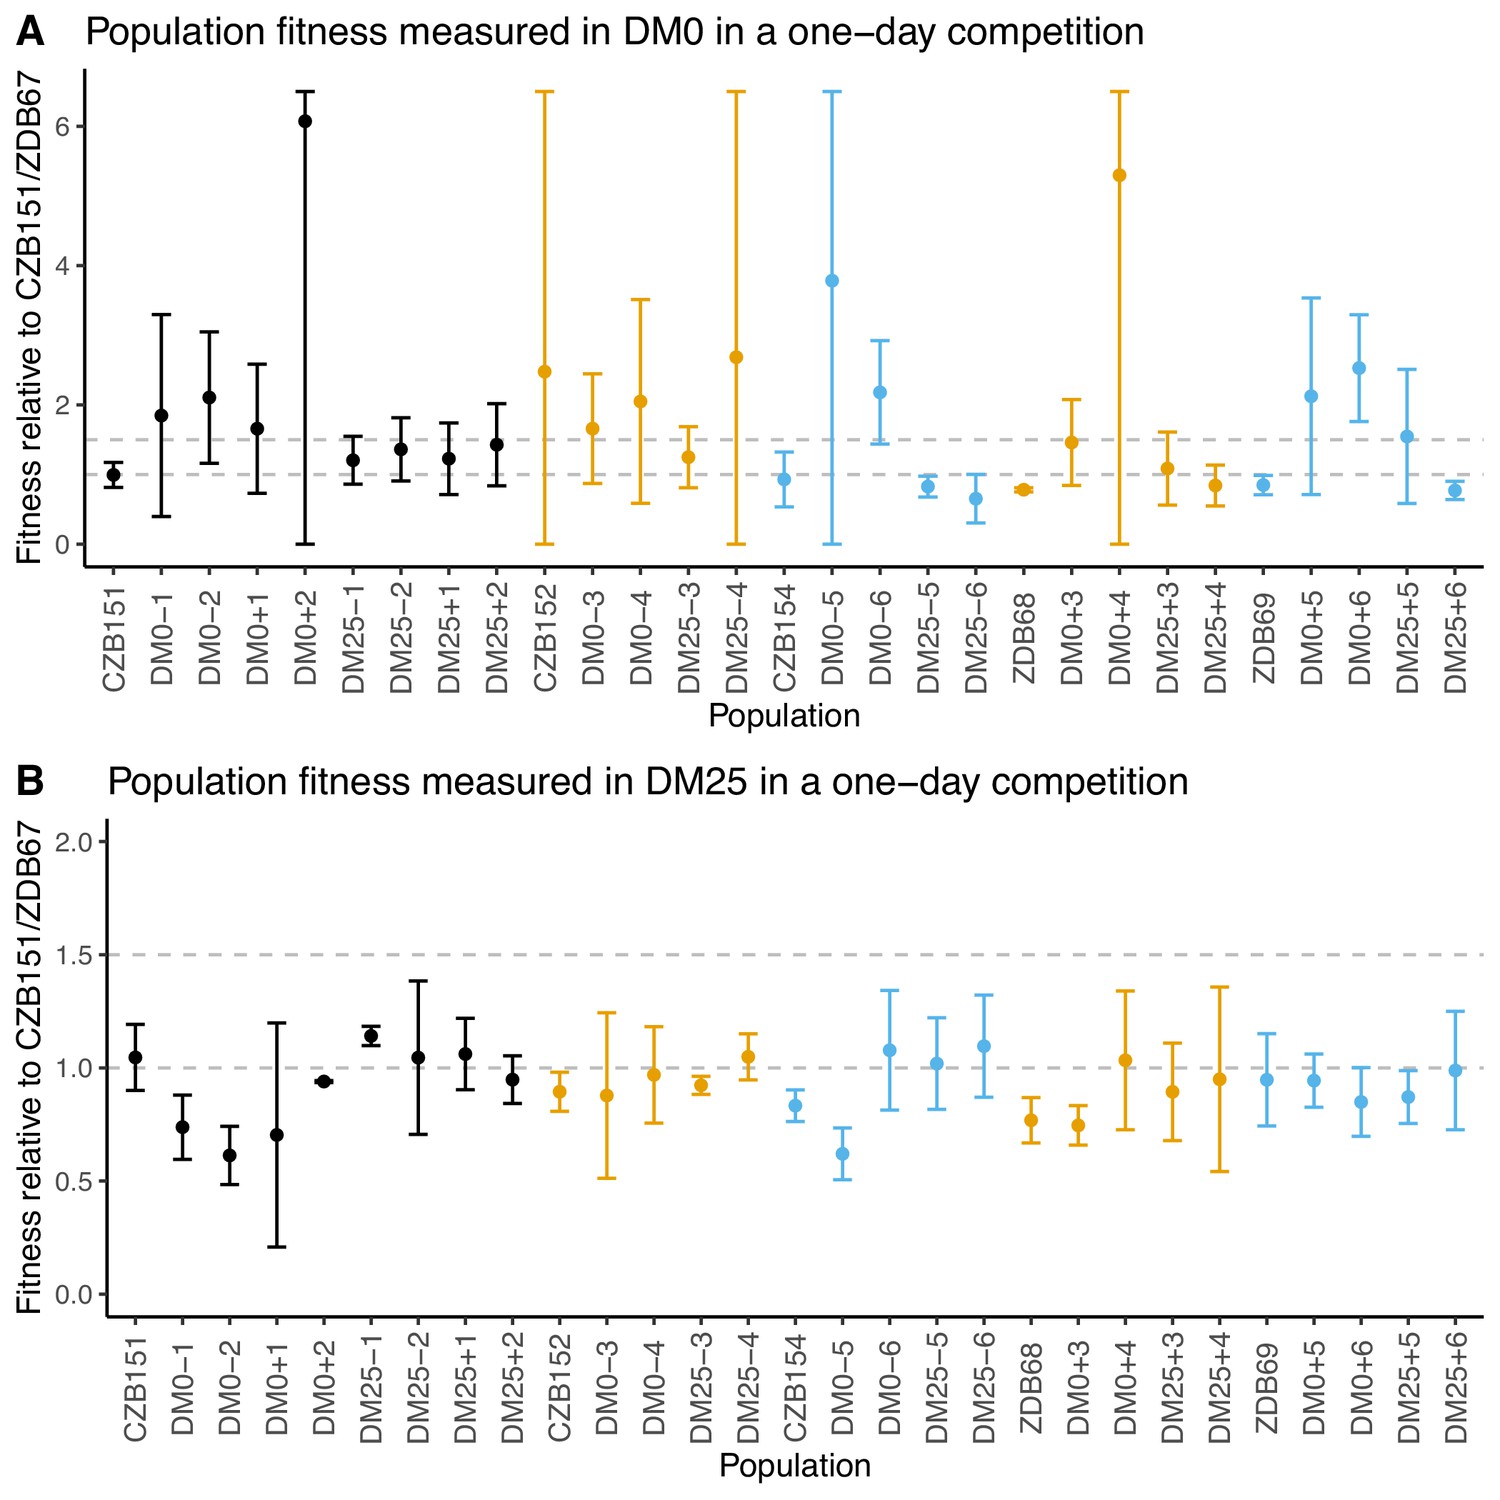
Fitness of evolved populations and their Cit+ ancestors relative to Cit+ ancestral clones CZB151 and ZDB67 in DM0 and DM25.
To show the difference in scale across panels, dashed gray lines are drawn at 1.0 (neutrality) and 1.5 on the y-axis. Ancestral strain CZB151 and its descendants are shown in black, CZB152 and its descendants are in orange, and CZB154 and its descendants are in blue. (A) Fitness of evolved and ancestral populations relative to CZB151 and ZDB67 in DM0, as measured in one-day competition assays. Some confidence limits extend beyond the range shown on the y-axis. (B) One-day fitness of evolved and ancestral populations relative to CZB151 and ZDB67 in DM25, as measured in one-day competition assays. Error bars are 95% confidence intervals.
-
Figure 3—source data 1
Colony counts for fitness competitions of evolved populations in DM0 growth medium (Panel A).
- https://cdn.elifesciences.org/articles/55414/elife-55414-fig3-data1-v2.csv
-
Figure 3—source data 2
Colony counts for fitness competitions of evolved populations in DM25 growth medium (Panel B).
- https://cdn.elifesciences.org/articles/55414/elife-55414-fig3-data2-v2.csv
Figure 4

Fitness of select evolved clones against their direct ancestors in DM0 and DM25.
The dashed grey line shows neutrality. Ancestral strain CZB151 and its descendants are shown in black, CZB152 and its descendants are in orange, and CZB154 and its descendants are in blue. (A) Fitness of evolved clones relative to their direct ancestors in DM0 in a three-day competition assay. (B) Fitness of evolved clones relative to their direct ancestors in DM25 in a three-day competition assay. Error bars are 95% confidence intervals. We selected clones for fitness assays based only on the availability of ancestral genotypes with confirmed, neutral, opposing Ara marker states.
-
Figure 4—source data 1
Colony counts for fitness competitions of evolved clones in DM0 growth medium (Panel A).
- https://cdn.elifesciences.org/articles/55414/elife-55414-fig4-data1-v2.csv
-
Figure 4—source data 2
Colony counts for fitness competitions of evolved clones in DM25 growth medium (Panel B).
- https://cdn.elifesciences.org/articles/55414/elife-55414-fig4-data2-v2.csv
Figure 5 with 1 supplement

Schematic of the log-slope method to calculate growth rates.
We loge-transformed optical densities, and used the slope of the curve in the interval OD420 nm = [0.01, 0.02] to calculate the exponential growth rate on glucose (h−1), rglucose. We used the slope of the curve in the interval OD420 nm = [0.05, 0.1] to calculate the exponential growth rate on citrate (h−1) rcitrate. In making this interpretation, we assumed a diauxic shift between growth on glucose and citrate, rather than simultaneous growth on both substrates. In any case, growth rates during these intervals are relevant phenotypes even without assuming diauxie. We estimated lag time (τ) as the time (h) until OD420 nm = 0.01 was reached.
Figure 5—figure supplement 1

Growth curves for REL606 in DM25.
We used these data to choose the interval for estimating the exponential growth rate on glucose. (A) Replicated growth curves in DM25. (B) The same data as in panel A except loge-transformed. Dashed black lines indicate the interval used to calculate growth rates on glucose; the dashed red line shows the lower bound of the interval in which the growth rate on citrate would be estimated.
-
Figure 5—figure supplement 1—source data 1
Optical density (420 nm) timeseries for REL606 growth in DM25 medium over more than 24 hr.
- https://cdn.elifesciences.org/articles/55414/elife-55414-fig5-figsupp1-data1-v2.csv
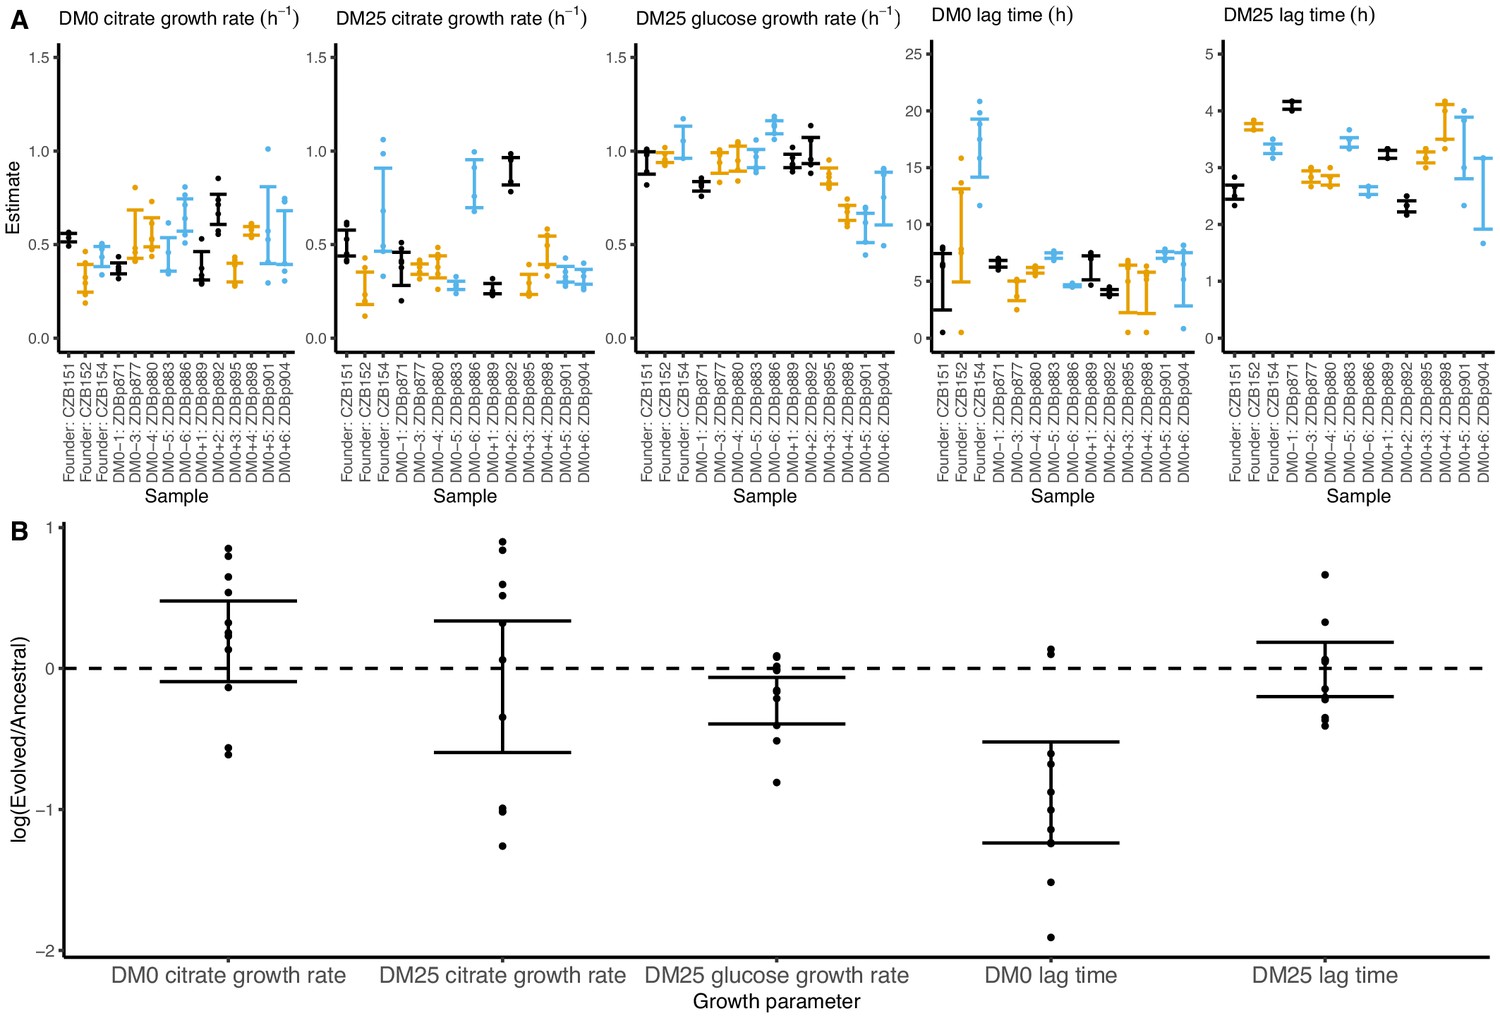
Figure 6 with 2 supplements
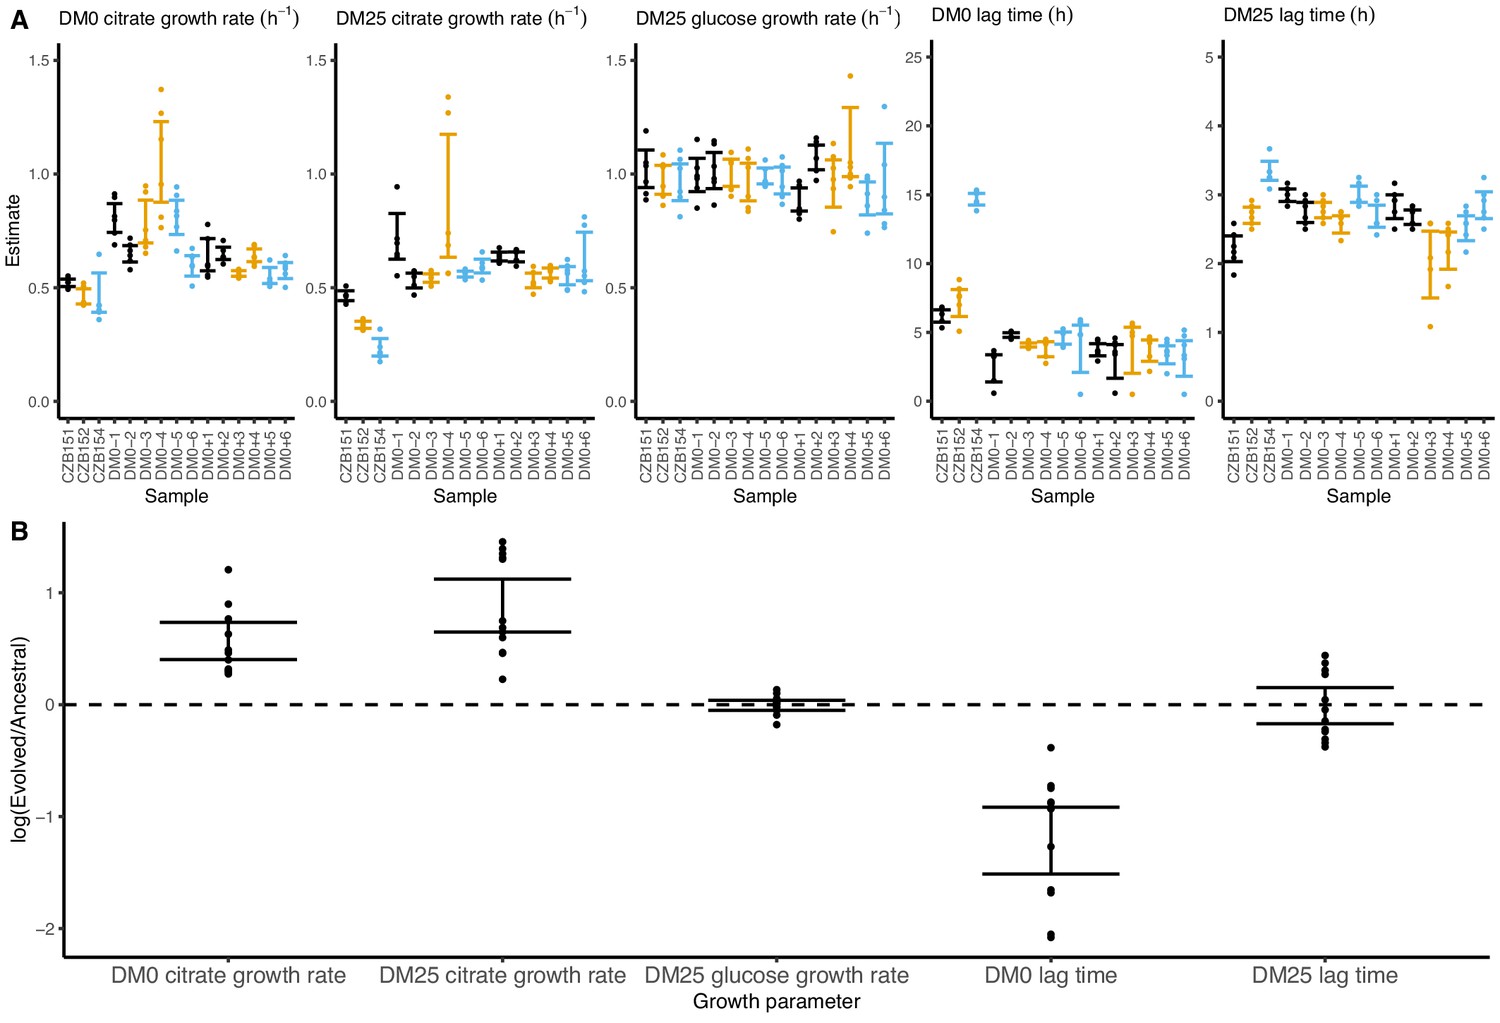
Growth parameters for whole-population samples that evolved in DM0 and their Cit+ ancestors.
(A) Estimates of various growth parameters for the ancestral strains and DM0-evolved populations at 2500 generations, using the log-slope method. Ancestral strain CZB151 and its descendants are shown in black, CZB152 and its descendants are in orange, and CZB154 and its descendants are in blue. Units for growth rates are h−1, and units for lag times are h. Bias-corrected and accelerated (BCa) bootstrap 95% confidence intervals around parameter estimates were calculated using 10,000 bootstraps. (B) Estimates of log2-transformed ratios of growth parameters for the evolved populations and their ancestors. The growth curves we used to estimate these parameters are shown in Figure 6—figure supplements 1 and 2.
-
Figure 6—source data 1
Optical density (420 nm) timeseries for DM0-evolved populations and their ancestors in DM0 and DM25 growth media.
- https://cdn.elifesciences.org/articles/55414/elife-55414-fig6-data1-v2.csv
Figure 6—figure supplement 1
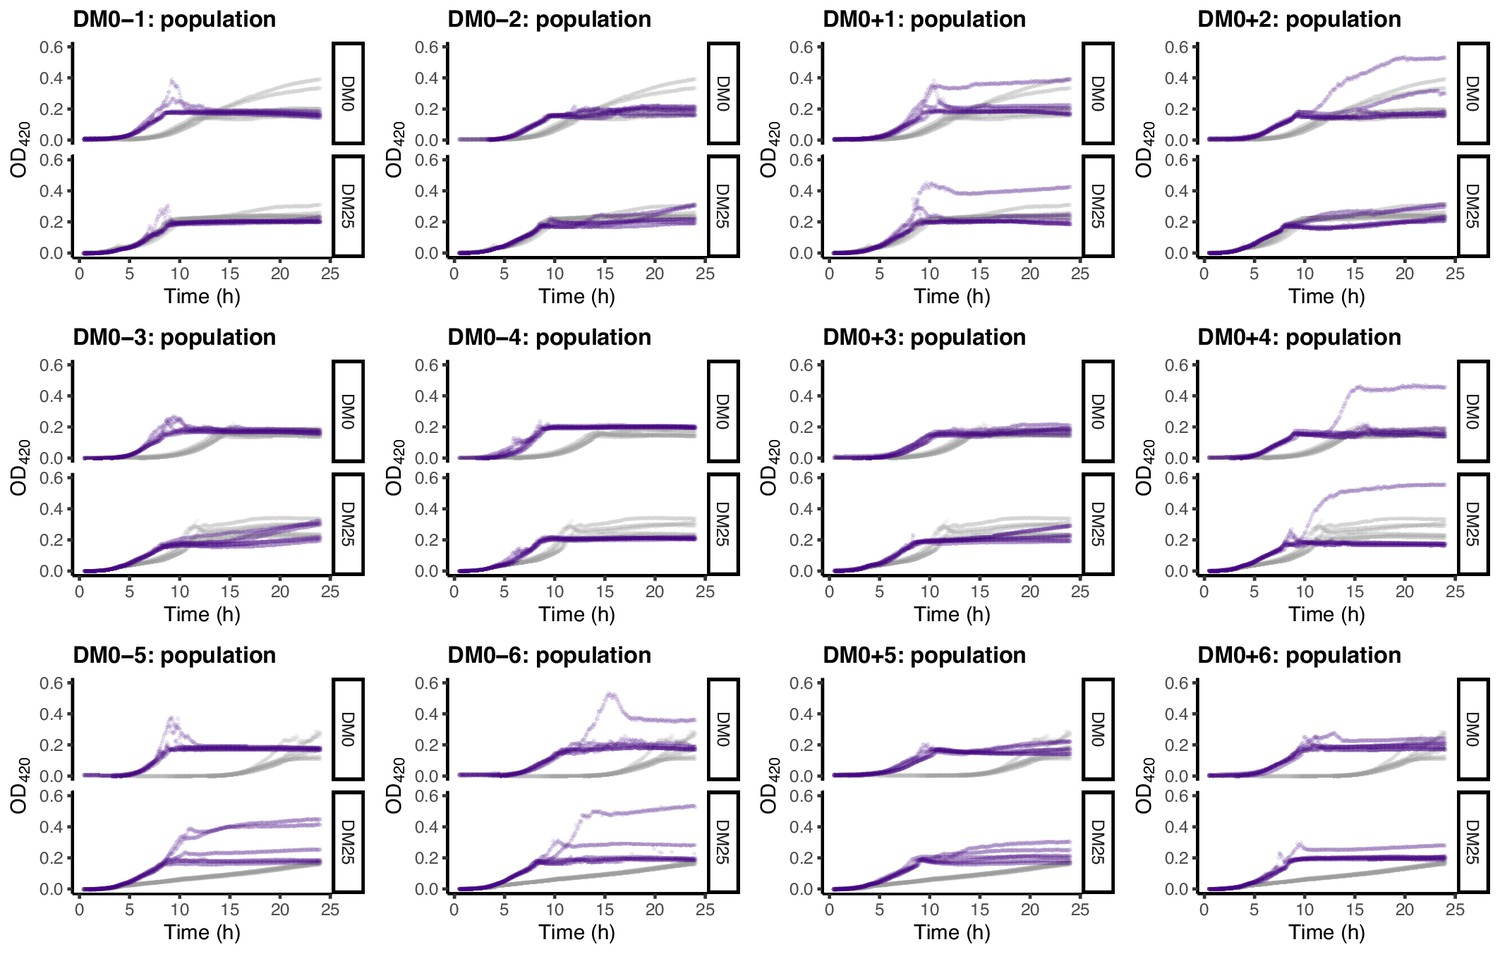
Growth curves of the 12 DM0-evolved whole-population samples, measured in DM0 and DM25.
For comparison, growth curves of the evolved populations are paired with those of their ancestors: CZB151 (top row), CZB152 (middle row), and CZB154 (bottom row). The evolved and ancestral curves are shown in purple and gray, respectively.
Figure 6—figure supplement 2

Loge-transformed growth curves of the 12 DM0-evolved whole-population samples, measured in DM0 and DM25.
Dashed black and red lines indicate the intervals we used to calculate growth rates on glucose and citrate, respectively (Figure 5).
Figure 7 with 2 supplements
Growth parameters for clones from populations that evolved in DM0 and their Cit+ ancestors.
(A) Estimates of growth parameters for the ancestral strains and DM0-evolved clones sampled at 2500 generations, using the log-slope method. CZB151 and its descendants are in black, CZB152 and its descendants are in orange, and CZB154 and its descendants are in blue. (B) Estimates of log2-transformed ratios of growth parameters for the evolved clones and their ancestors. The growth curves we used to estimate parameters are shown in Figure 7—figure supplements 1 and 2. We excluded the anomalous evolved Cit− clone. See Figure 6 for additional details.
-
Figure 7—source data 1
Optical density (420 nm) timeseries for DM0-evolved clones and their ancestors in DM0 and DM25 growth media.
- https://cdn.elifesciences.org/articles/55414/elife-55414-fig7-data1-v2.csv
Figure 7—figure supplement 1
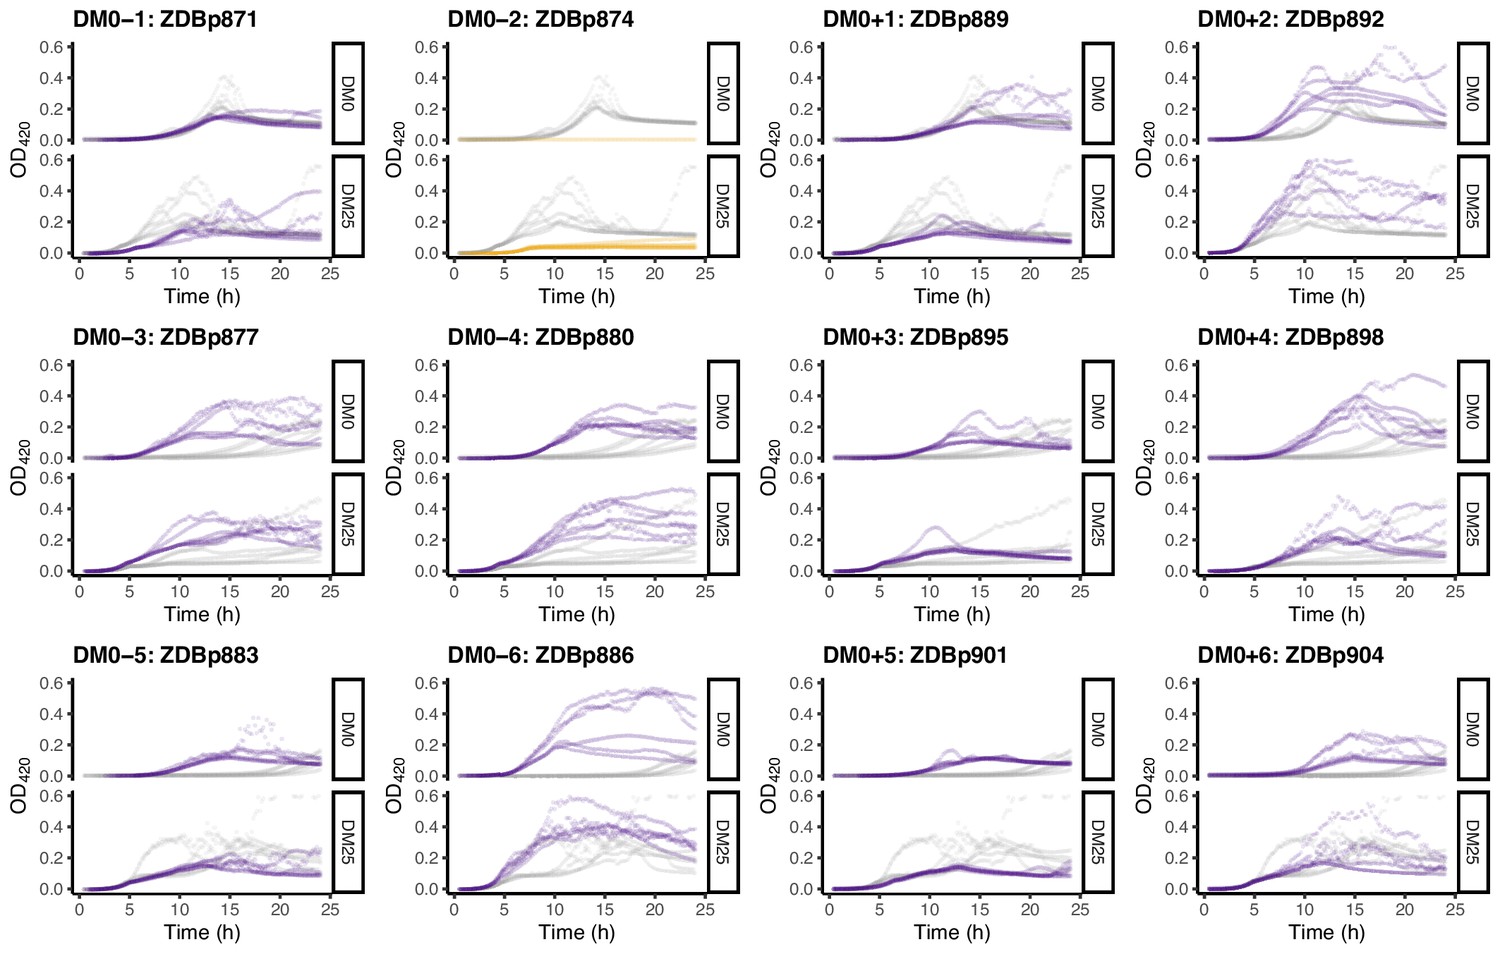
Growth curves of the 12 DM0-evolved clones, measured in DM0 and DM25.
For comparison, growth curves of the evolved clones are paired with those of their ancestors: CZB151 (top row), CZB152 (middle row), and CZB154 (bottom row). The evolved and ancestral curves are shown in purple and gray, respectively, except the anomalous Cit− evolved clone shown in orange.
Figure 7—figure supplement 2

Loge-transformed growth curves of the 12 DM0-evolved clones, measured in DM0 and DM25.
Dashed black and red lines indicate the intervals we used to calculate growth rates on glucose and citrate, respectively (Figure 2).
Figure 8 with 2 supplements

Growth parameters of the 12 DM25-evolved clones and their 3 Cit+ ancestors.
(A) Estimates of growth parameters for each ancestral and DM25-evolved clone, using the log-slope method (Figure 2). Estimates for ancestral strain CZB151 and its descendants are shown in black, estimates for CZB152 and its descendants are in orange, and estimates for CZB154 and its descendants are in blue. Units for growth rates r are h−1, and units for lag times are h. Bias-corrected and accelerated (BCa) bootstrap 95% confidence intervals around parameter estimates were calculated using 10,000 bootstraps; no confidence interval is shown if a parameter could not be estimated accurately from the available data. Aberrant estimates that fall outside of these ranges are not shown. (B) Estimates of log2-transformed ratios of growth parameters for the evolved clones and their ancestors. The growth curves used to estimate these parameters are shown in Figure 8—figure supplements 1 and 2.
-
Figure 8—source data 1
Optical density (420 nm) timeseries for DM25-evolved clones and their ancestors in DM25 growth medium.
- https://cdn.elifesciences.org/articles/55414/elife-55414-fig8-data1-v2.csv
Figure 8—figure supplement 1
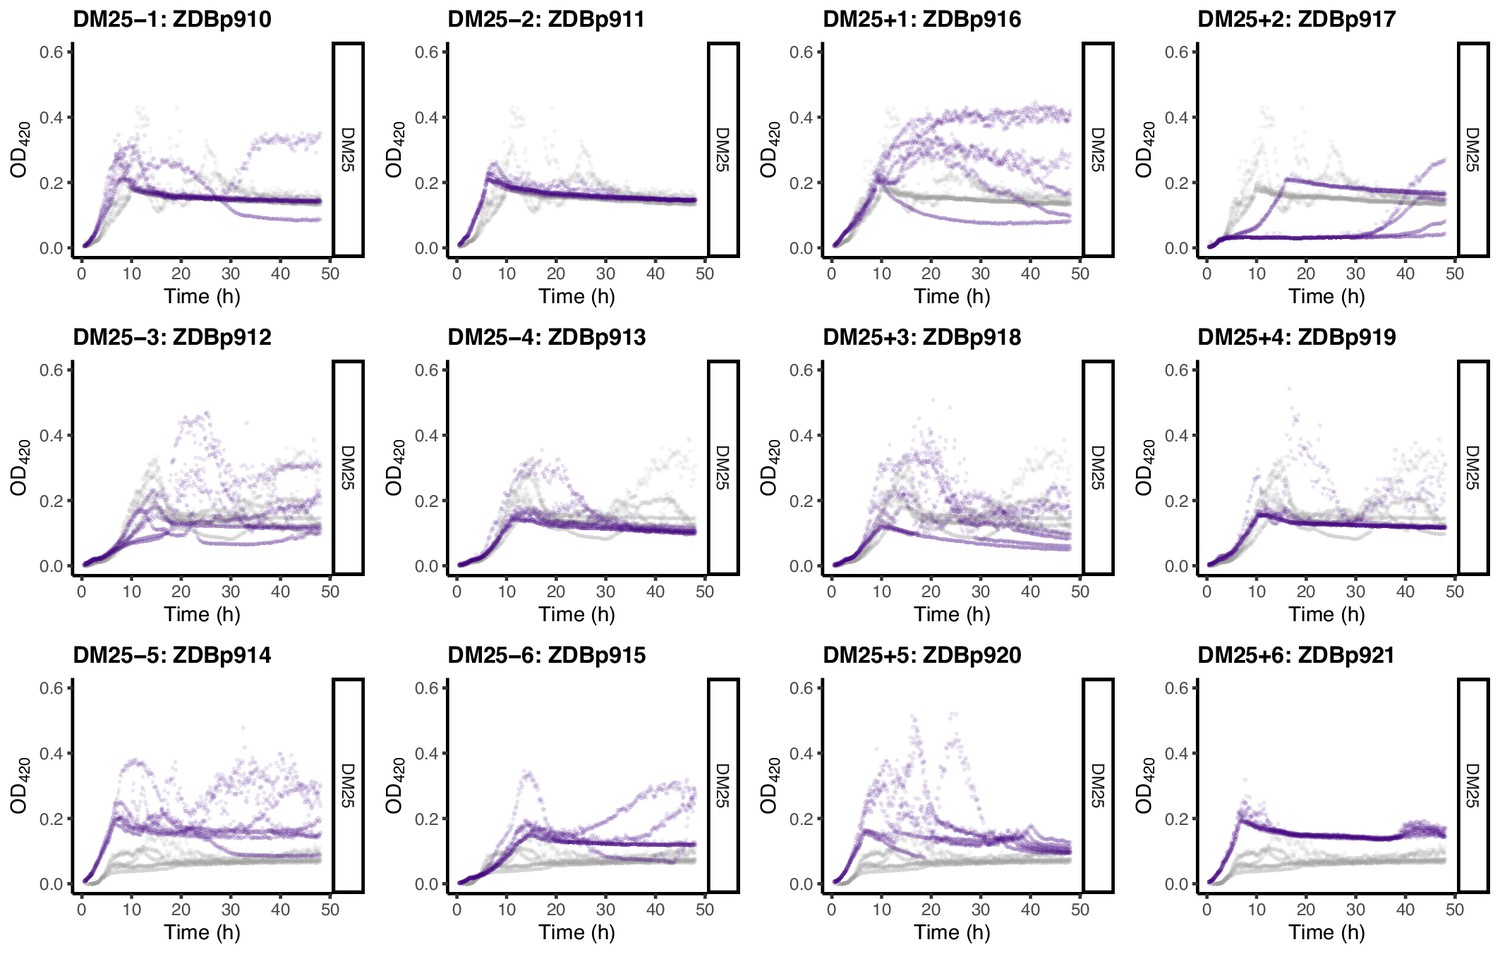
Growth curves of the 12 DM25-evolved clones, measured in DM25 only.
(Many DM25-evolved clones grew inconsistently in DM0.) For comparison, growth curves of the evolved clones are paired with those of their founders: CZB151 (top row), CZB152 (middle row), and CZB154 (bottom row). The evolved and ancestral curves are shown in purple and gray, respectively.
Figure 8—figure supplement 2
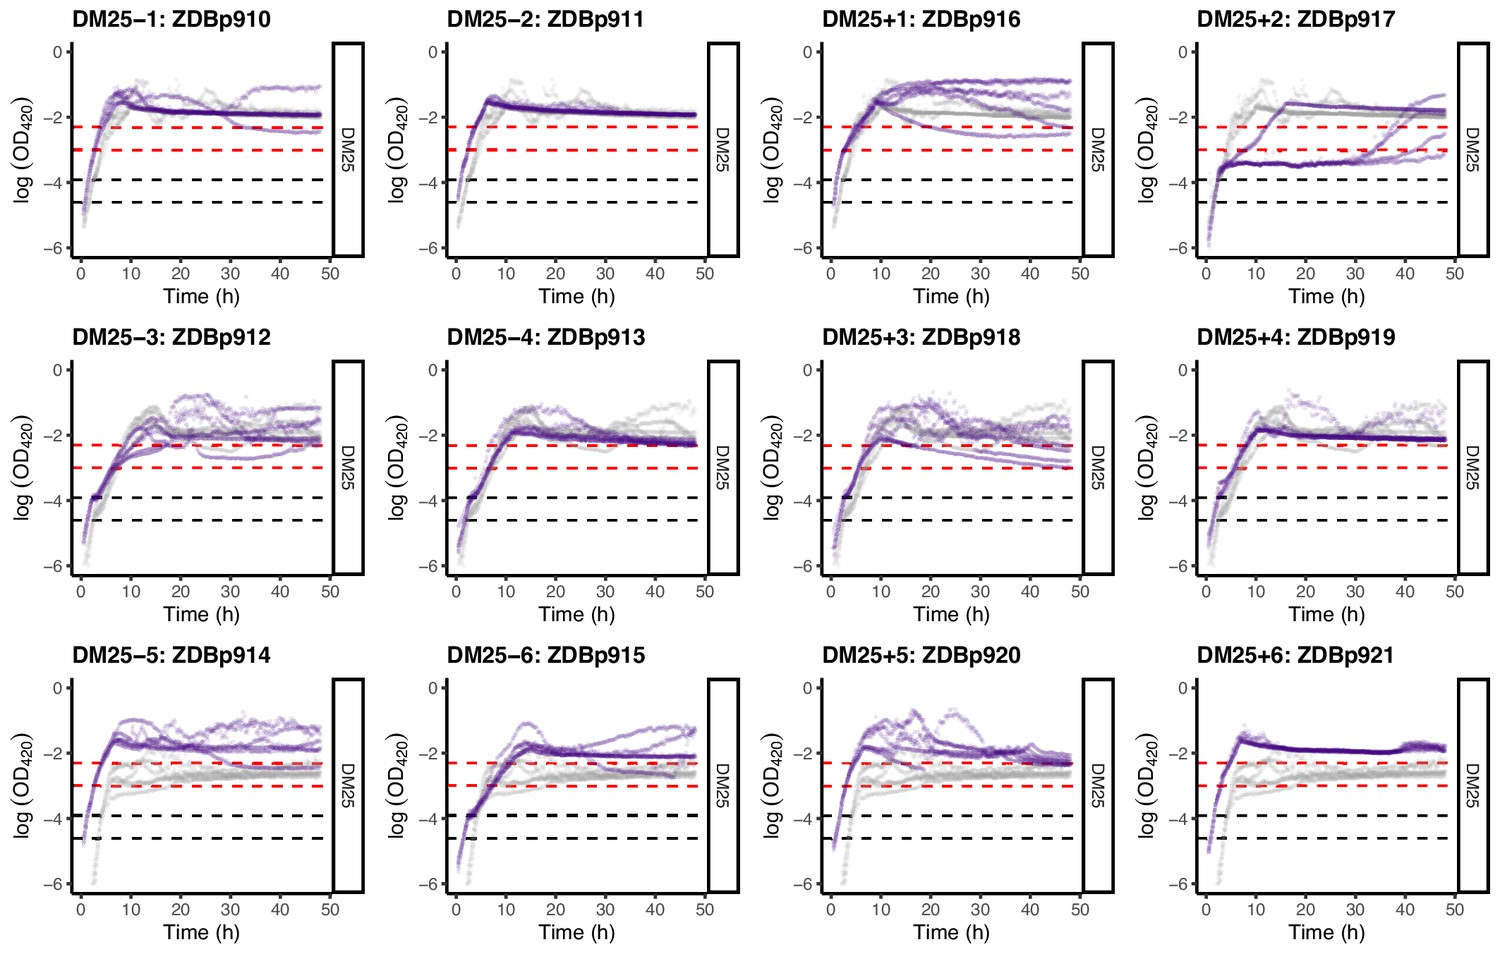
Loge-transformed growth curves of the 12 DM25-evolved clones, measured in DM25.
Dashed black and red lines indicate the intervals we used to calculate growth rates on glucose and citrate, respectively (Figure 2). See Figure 8—figure supplement 1 for additional details.
Figure 9
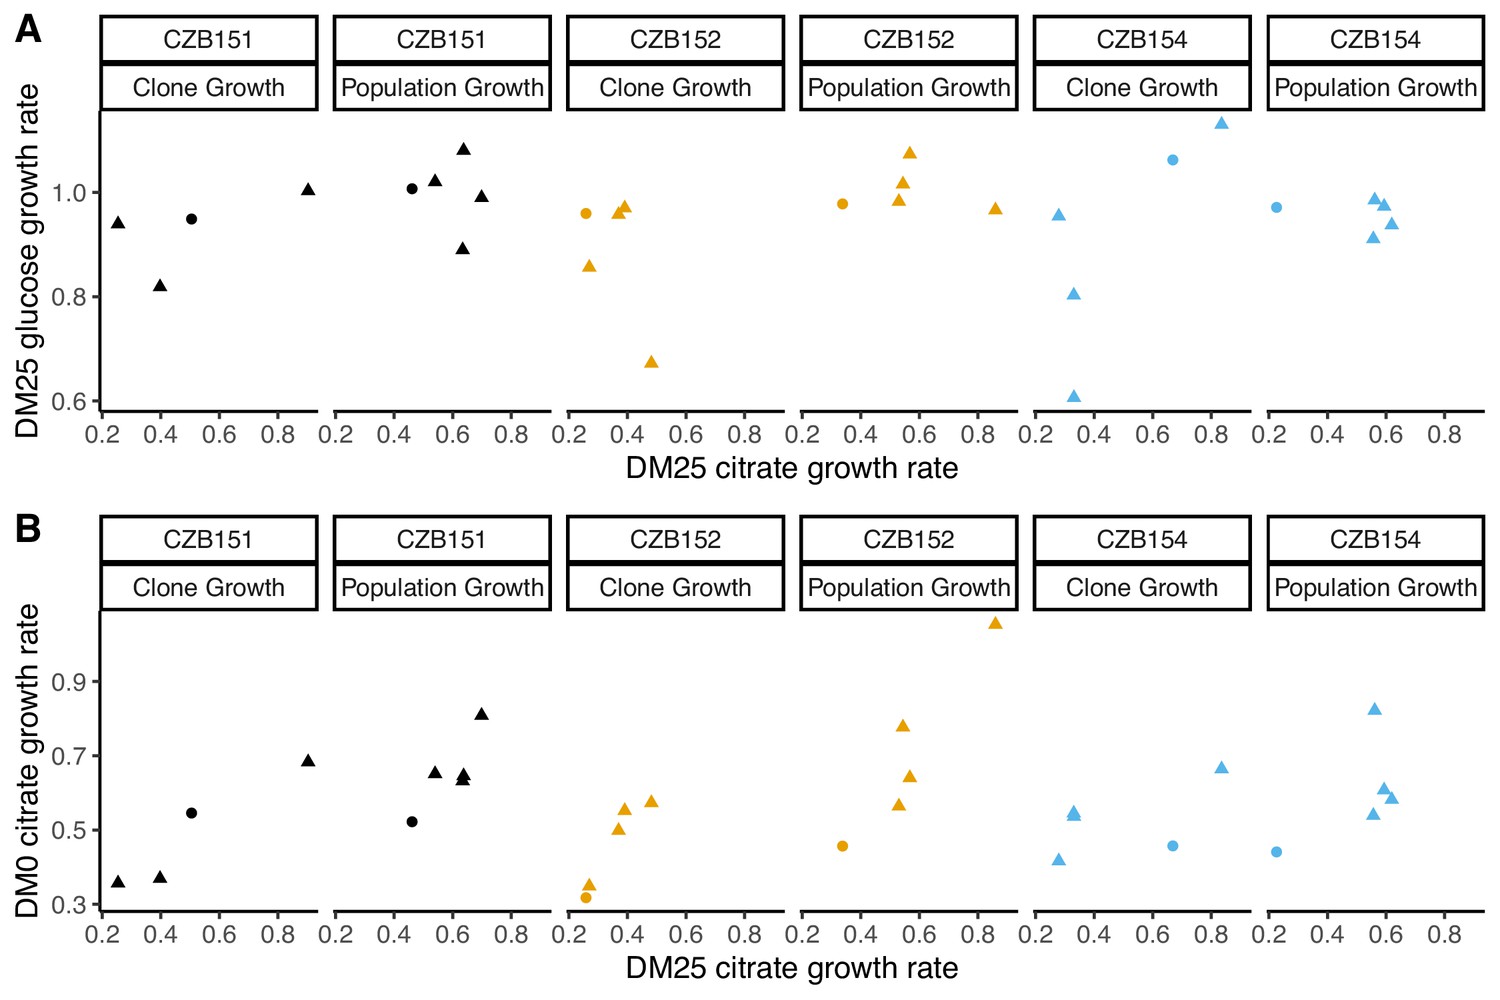
Correlations between estimated growth rates across substrates and media for DM0-evolved clones and populations.
All tests are two-tailed, because growth rates across substrates and media might, in principle, exhibit tradeoffs. (A) Correlations between rglucose and rcitrate in DM25 are not significant (Pearson’s r = 0.4788, d.f. = 12, p=0.0833 for clones; r = –0.0392, d.f. = 13, p=0.8897 for populations). (B) Correlations between rcitrate in DM0 and rcitrate in DM25 are highly significant (r = 0.7513, d.f. = 12, p=0.0020 for clones; r = 0.8041, d.f. = 13, p=0.0003 for populations). Circles and triangles indicate ancestral and evolved samples, respectively. Colors distinguish the different Cit+ ancestors and their evolved descendants.
-
Figure 9—source data 1
Optical density (420 nm) timeseries for DM0-evolved populations and their ancestors in DM0 and DM25 growth media.
- https://cdn.elifesciences.org/articles/55414/elife-55414-fig9-data1-v2.csv
-
Figure 9—source data 2
Optical density (420 nm) timeseries for DM0-evolved clones and their ancestors in DM0 and DM25 growth media.
- https://cdn.elifesciences.org/articles/55414/elife-55414-fig9-data2-v2.csv
Figure 10

Elevated mortality in Cit+ strains.
The Cit+ strains exhibit substantially elevated mortality in the citrate-only DM0 medium; some also show high mortality in DM25 as well. REL606 is Cit− and cannot grow in DM0. CZB151 was isolated from LTEE population Ara−3 at generation 33,000, and its descendants, ZDBp871 and ZDBp910, had evolved for 2500 generations in DM0 and DM25 media, respectively. REL11364 was isolated from LTEE population Ara−3 at generation 50,000. (A) Representative micrographs of the five clones in the two media. We stained cells using the BacLight Viability Kit, and we scored them as dead if their red fluorescence exceeded their green fluorescence (see Materials and methods). Scale bars (lower right corner) represent 5 μm. (B) Proportion of dead cells in five replicate cultures of each strain grown in DM0 and DM25 medium each (except for ZDBp910, with only one replicate). The wider symbols show estimated overall proportions weighted by the number of cells analyzed in each replicate culture. We calculated bias-corrected and accelerated (BCa) bootstrap 95% confidence intervals using 10,000 bootstraps (except for ZDBp910), and we weighted by the number of cells analyzed in each replicate.
-
Figure 10—source data 1
Cell death estimates.
- https://cdn.elifesciences.org/articles/55414/elife-55414-fig10-data1-v2.csv
-
Figure 10—source data 2
Micrograph image segmentation and classification by SuperSegger software, part 1.
- https://cdn.elifesciences.org/articles/55414/elife-55414-fig10-data2-v2.zip
-
Figure 10—source data 3
Micrograph image segmentation and classification by SuperSegger software, part 2.
- https://cdn.elifesciences.org/articles/55414/elife-55414-fig10-data3-v2.zip
Figure 11 with 1 supplement
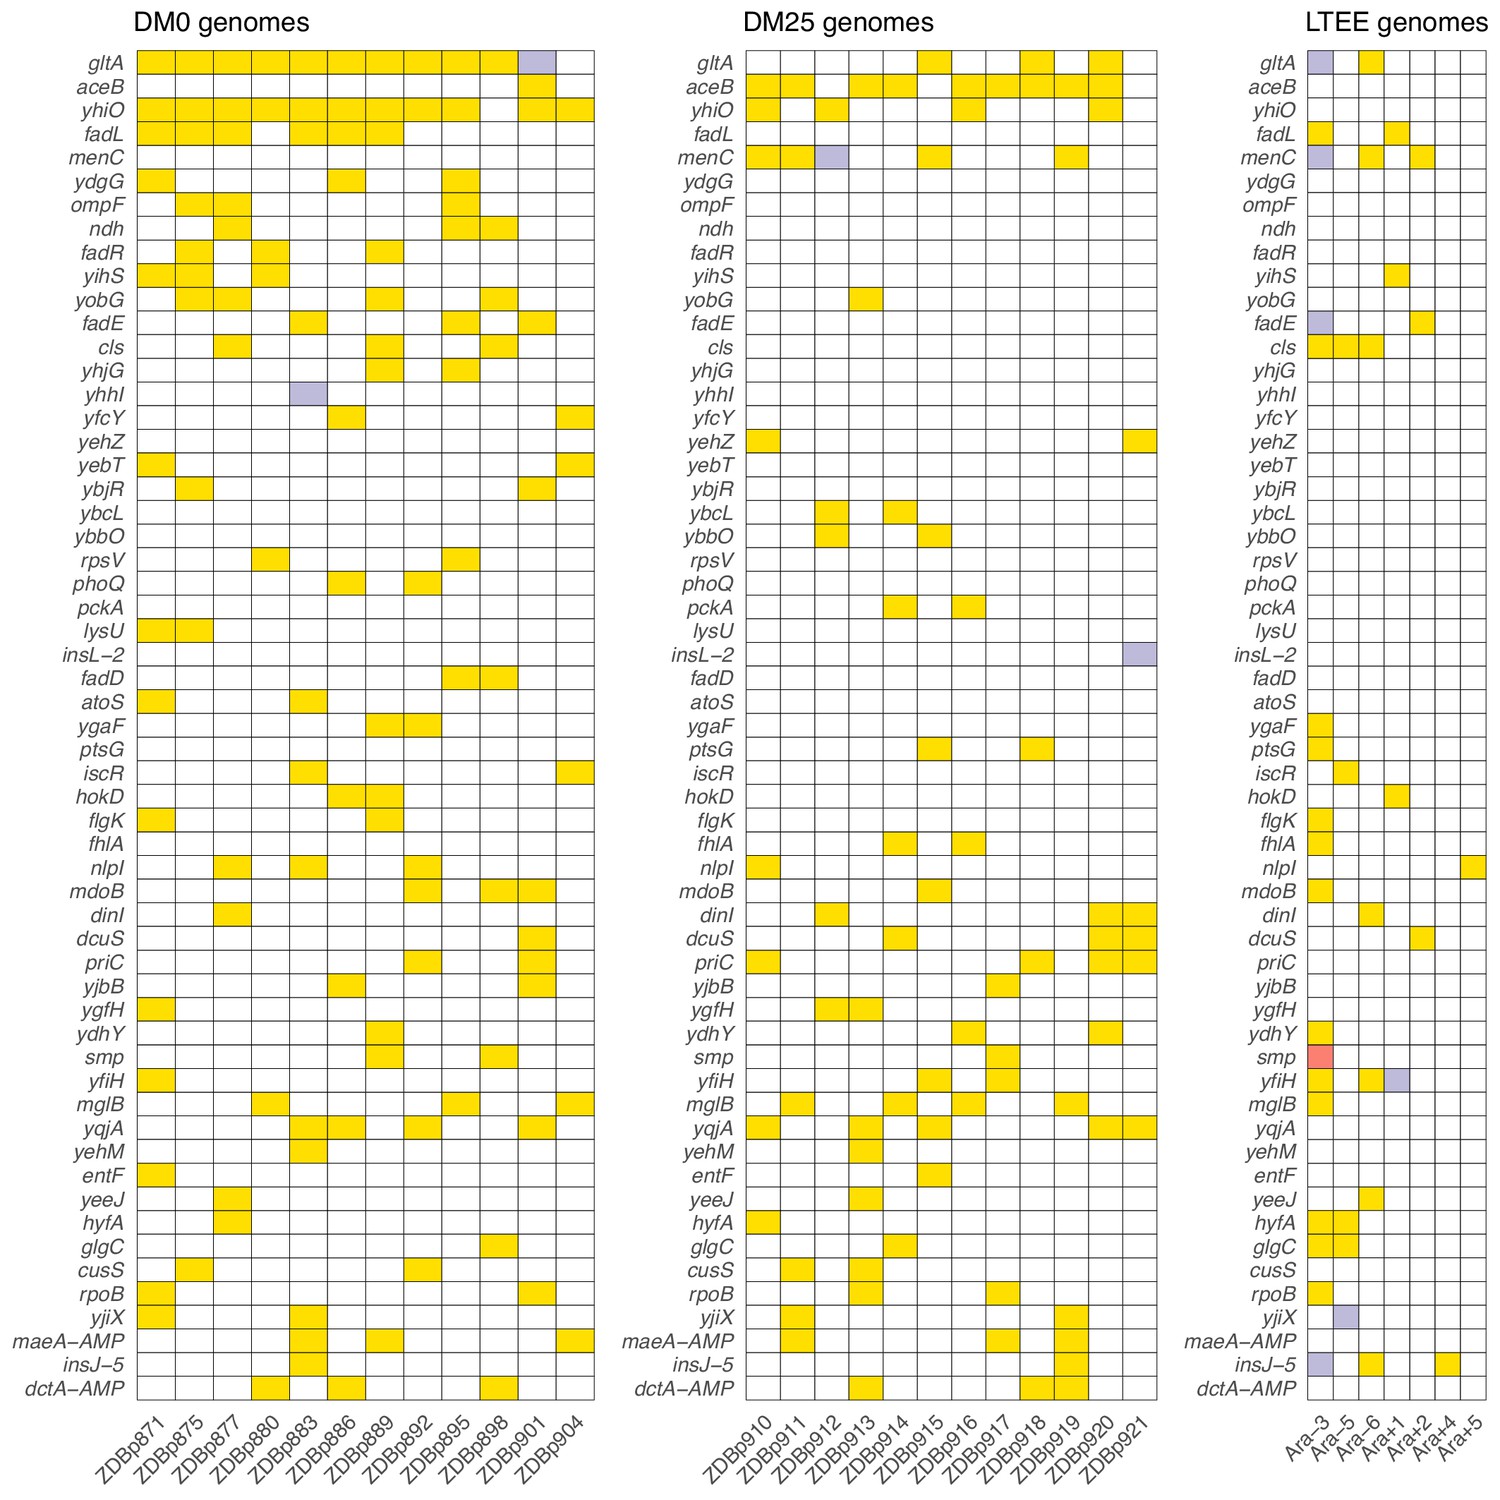
Parallel genetic evolution.
Genes with mutations in two or more sequenced genomes from the DM0- and DM25-evolved populations, ranked by the absolute value of the difference in the number of qualifying mutations (see main text) between DM0 and DM25. Mutations in the same genes in the six non-mutator LTEE lineages and in a Cit+ clone from LTEE population Ara−3 (which evolved hypermutability), all at 50,000 generations, are shown for comparison. Yellow, violet, or red fill indicates the presence of one, two, or three qualifying mutations, respectively. Mutation details are provided in Supplementary file 5.
-
Figure 11—source data 1
Counts of qualifying mutations in evolved clones.
- https://cdn.elifesciences.org/articles/55414/elife-55414-fig11-data1-v2.csv
-
Figure 11—source data 2
Presence/absence of dctA and maeA amplifications in evolved clones.
- https://cdn.elifesciences.org/articles/55414/elife-55414-fig11-data2-v2.csv
-
Figure 11—source data 3
Counts of qualifying mutations in non-mutator LTEE 50,000 generation clones.
- https://cdn.elifesciences.org/articles/55414/elife-55414-fig11-data3-v2.csv
Figure 11—figure supplement 1

Parallel substitutions at the amino-acid level in citrate synthase, GltA.
All of the evolved substitutions occur at the allosteric protein-ligand interface with NADH. GltA is shown in its dimeric, NADH-bound conformation (1NXG crystal structure in the Protein DataBank). The M172I, A162T, I114F substitutions are shown in purple. NADH is shown in orange.
-
Figure 11—figure supplement 1—source data 1
Annotation of evolved GltA residues on PDB structure 1NXG.
- https://cdn.elifesciences.org/articles/55414/elife-55414-fig11-figsupp1-data1-v2.zip
Figure 12
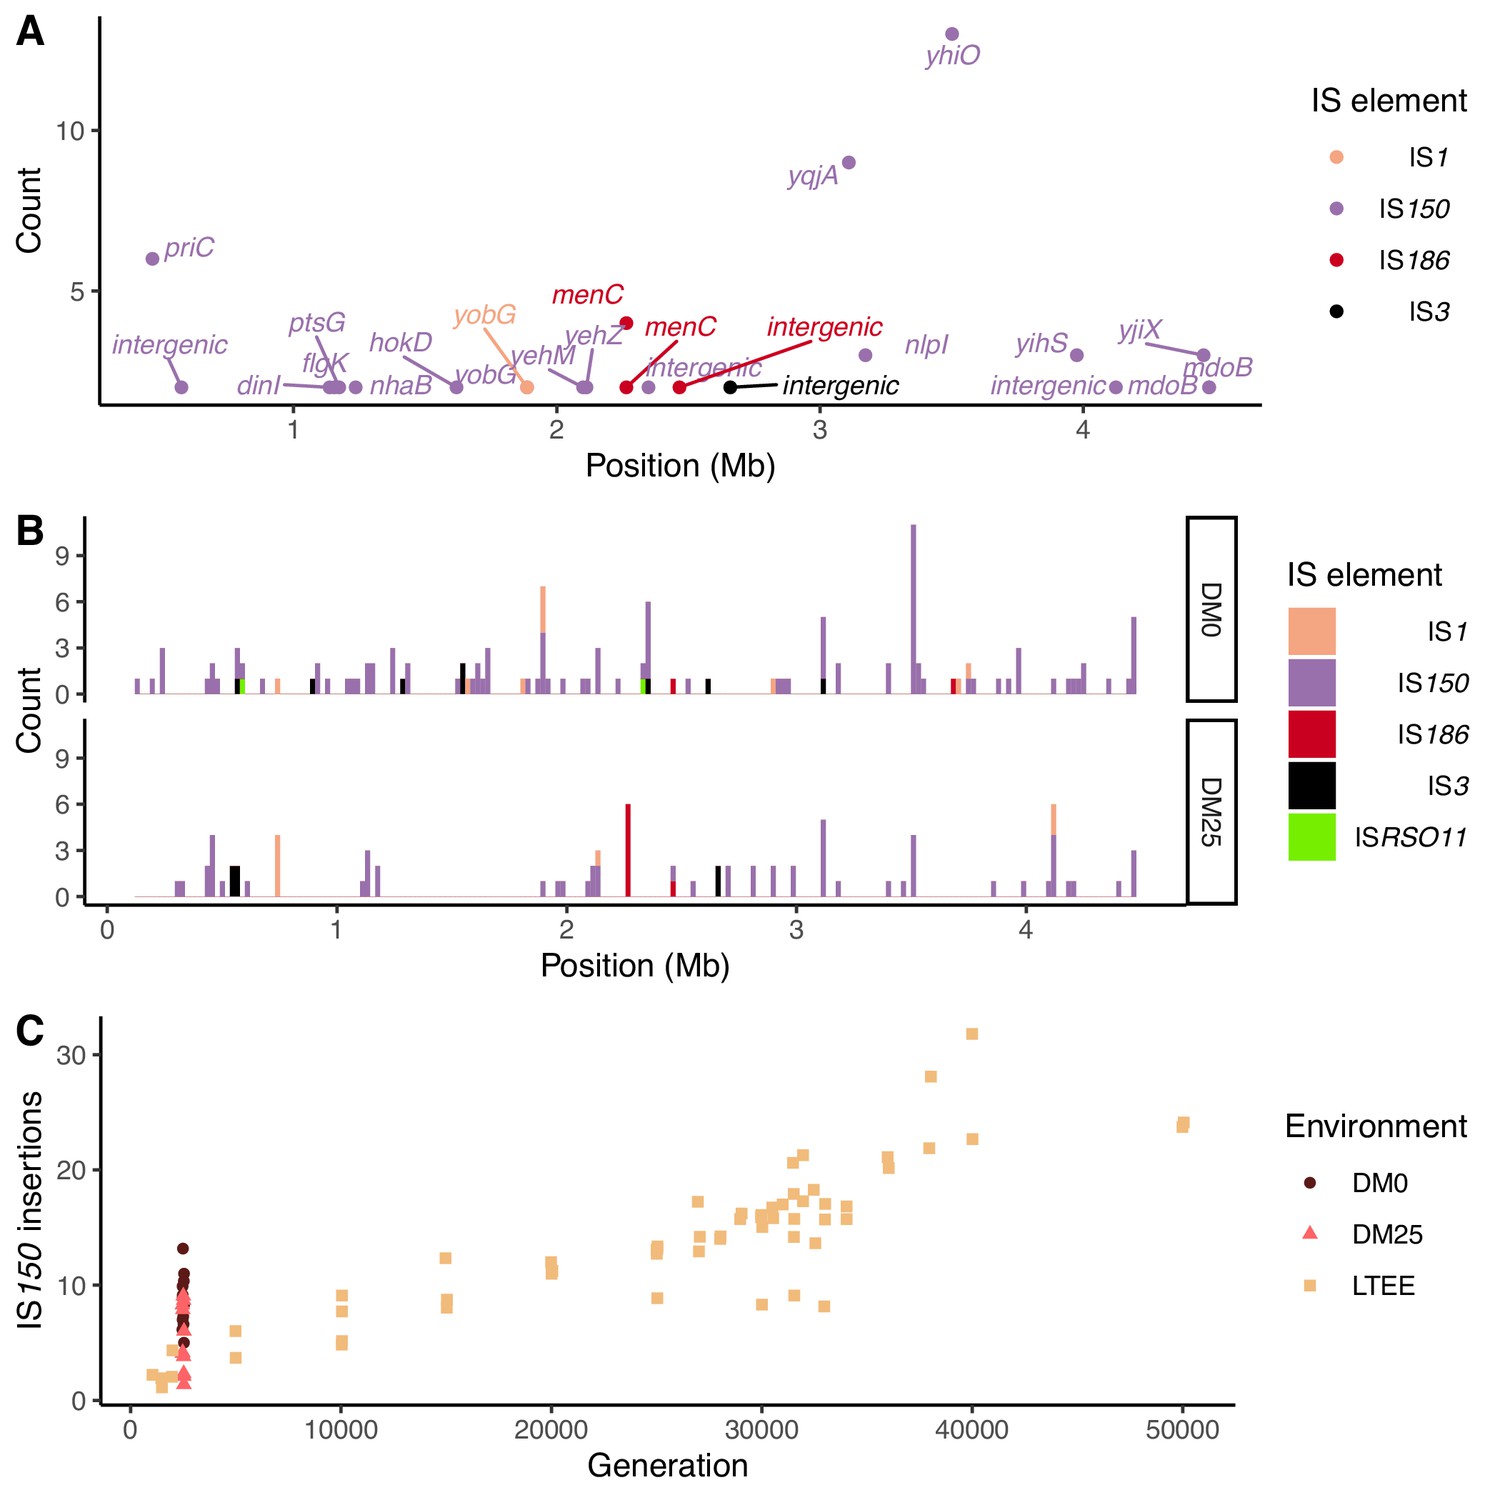
Parallel IS-element insertions.
(A) Counts of parallel IS-element insertions in labeled genes (including promoter and coding regions) summed across sequenced DM0- and DM25-evolved genomes, and arranged by position on the E. coli chromosome, relative to the inferred last common ancestor of all strains (Materials and methods). IS1 insertions are shown in pink, IS150 in lavender, IS186 in red, IS3 in black, and ISRSO11 in green. Some genes contain multiple sites with parallel IS-element insertions. (B) Location of insertions, shown separately for the DM0- and DM25-evolved genomes. Colors are the same as in panel A. (C) Total number of IS150 insertions in the DM0- and DM25-evolved genomes after 2500 generations. The corresponding numbers of IS-element insertions in clones isolated from LTEE population Ara−3 at time points over 50,000 generations of evolution are shown for comparison. DM0 clones are labeled as brown circles, DM25 clones as pink triangles, and LTEE Ara−3 clones as tan squares.
-
Figure 12—source data 1
Table of IS-element insertions in evolved genomes.
- https://cdn.elifesciences.org/articles/55414/elife-55414-fig12-data1-v2.csv
-
Figure 12—source data 2
Table of IS-element insertions in LTEE and Mutation Accumulation Experiment (MAE) genomes, originally published in Tenaillon et al., 2016.
- https://cdn.elifesciences.org/articles/55414/elife-55414-fig12-data2-v2.csv
Figure 13
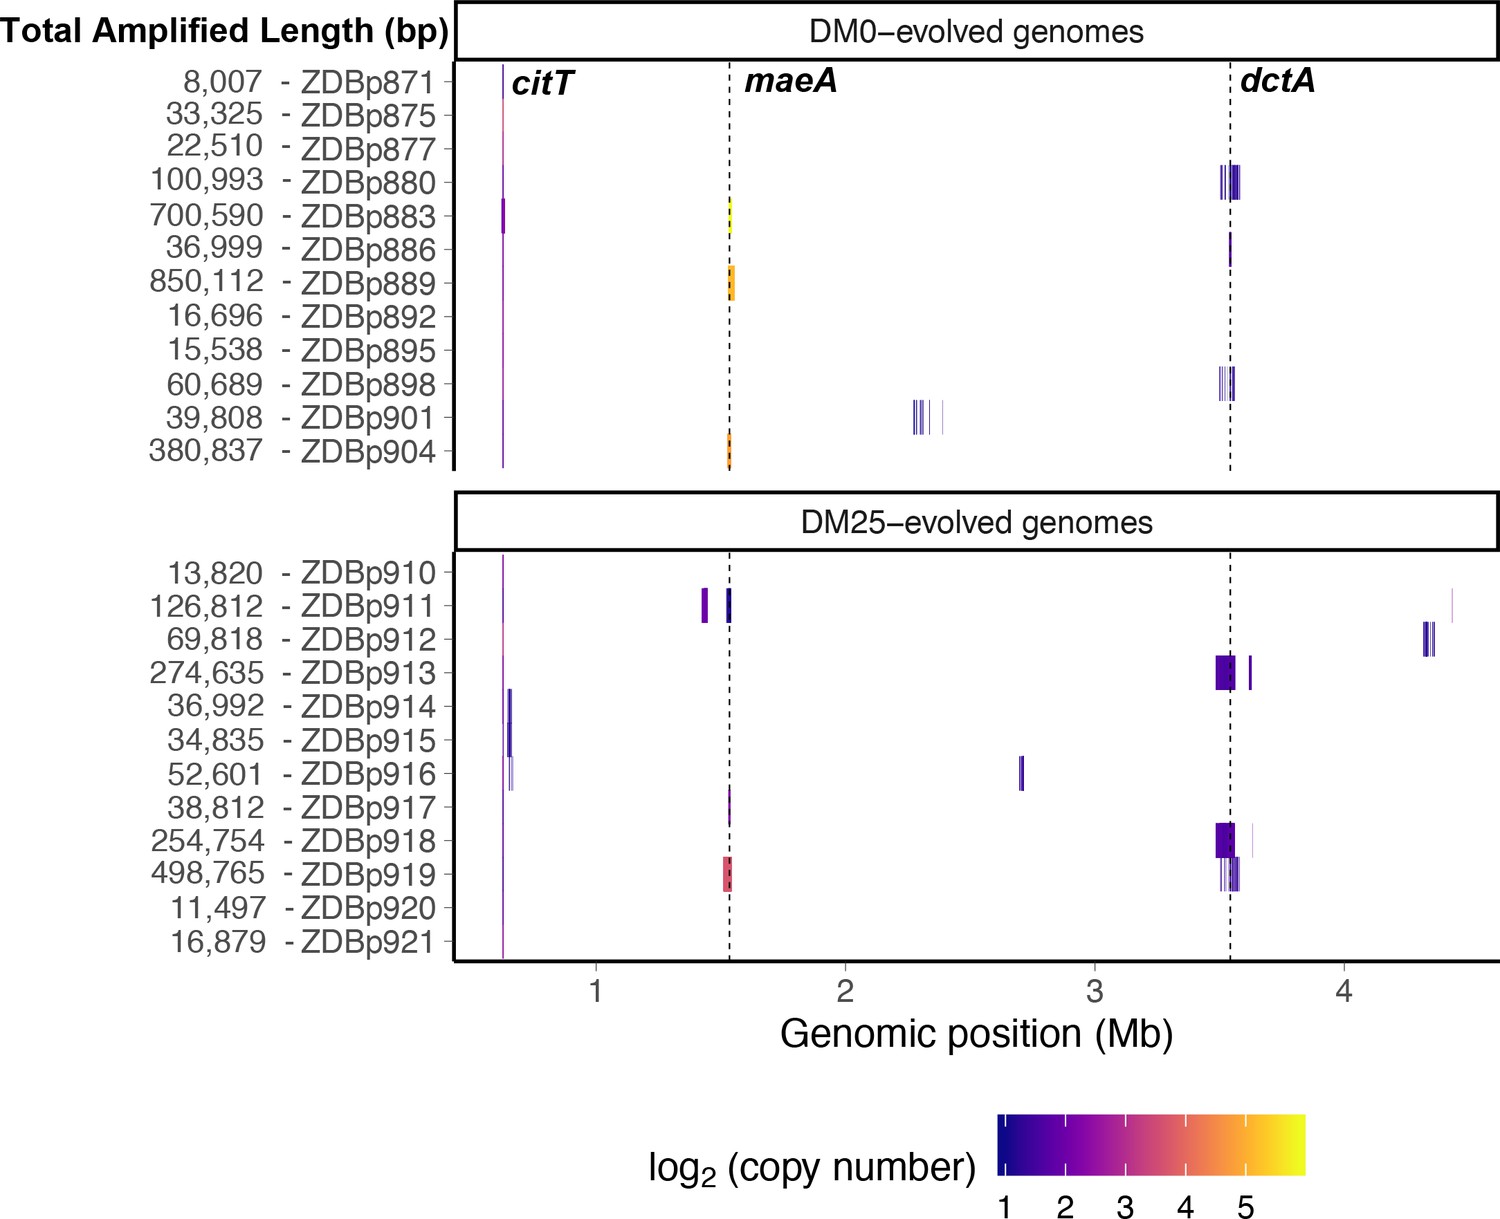
Genetic amplifications in evolved clones.
Genomic regions with significant amplifications in DM0- and DM25-evolved clones, arranged by chromosomal position. The evolved clones from DM0 (top half) and DM25 (bottom half) are indicated at the near left, with the total amplified length shown at the far left. Dashed vertical lines mark the maeA and dctA loci. The boundaries vary among the subset of genomes with amplifications that encompass these genes; by contrast, the citT locus is amplified in all of these genomes, and with nearly uniform boundaries. Colors denote amplification copy-number on a log2 scale from dark (low copy-number) to light (high copy-number).
-
Figure 13—source data 1
Table of amplifications discovered by examining sequencing coverage in evolved genomes.
- https://cdn.elifesciences.org/articles/55414/elife-55414-fig13-data1-v2.csv
Figure 14
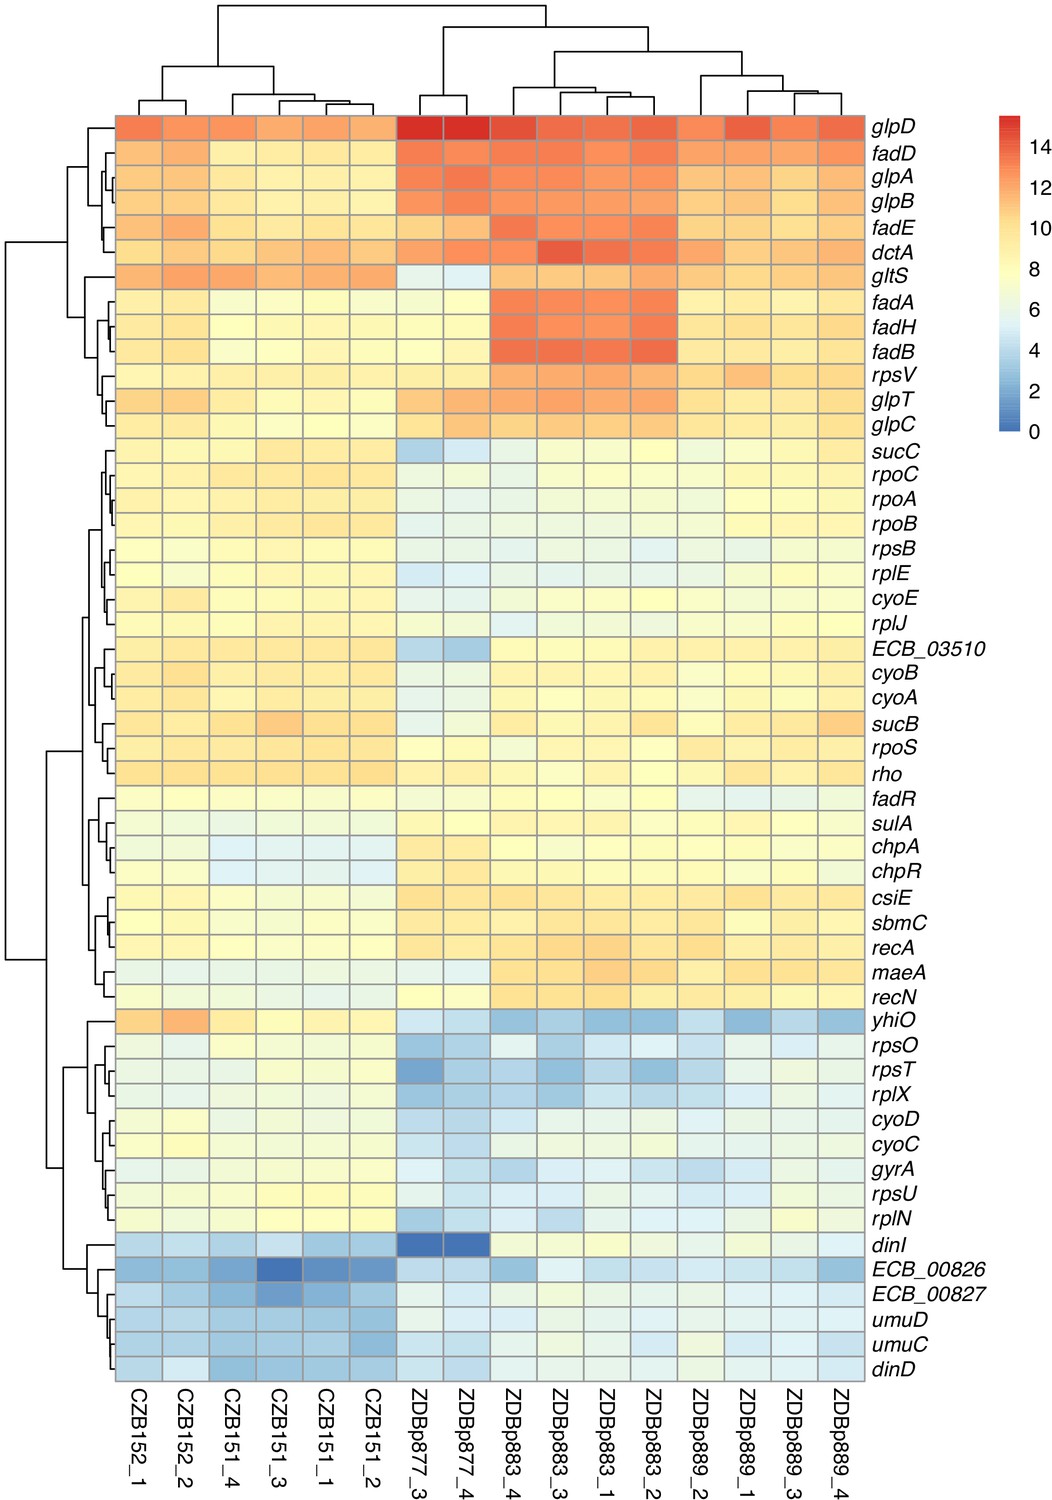
Transcriptomic analysis of ancestral and evolved clones.
Differential expression analysis comparing two ancestral (CZB151 and CZB152) and three evolved clones (ZDBp877, ZDBp883, ZDBp889), produced by sleuth (Pimentel et al., 2017). The colored bar (at right) shows the level of RNA expression based on estimated counts and transformed as log2(1 + est_counts). The differentially expressed genes discussed in the main text are shown here. The numeric labels after the strain identifiers indicate the two or four biological replicates for each clone (i.e., RNA samples prepared from independently revived cultures of that clone).
-
Figure 14—source data 1
RNA transcript quantification using kallisto software.
- https://cdn.elifesciences.org/articles/55414/elife-55414-fig14-data1-v2.zip
Tables
Table 1
Copy number of amplified maeA and dctA genes in sequenced clones from populations that evolved for 2500 generations in either DM0 or DM25 environments.
| Genome | Medium | Gene | Mean copy number | Minimum number* | Maximum number* | Adjusted p-value† |
|---|---|---|---|---|---|---|
| ZDBp880 | DM0 | dctA | 2.33 | 1.67 | 3.26 | <0.0001 |
| ZDBp886 | DM0 | dctA | 3.20 | 1.88 | 4.25 | <0.0001 |
| ZDBp898 | DM0 | dctA‡ | 2.09 | 1.71 | 2.76 | 0.0023 |
| ZDBp913 | DM25 | dctA | 3.17 | 1.91 | 4.68 | <0.0001 |
| ZDBp918 | DM25 | dctA | 3.41 | 1.80 | 5.19 | <0.0001 |
| ZDBp919 | DM25 | dctA | 2.60 | 2.06 | 3.29 | <0.0001 |
| ZDBp883 | DM0 | maeA | 58.47 | 22.61 | 95.46 | <0.0001 |
| ZDBp889 | DM0 | maeA | 34.71 | 2.35 | 55.39 | <0.0001 |
| ZDBp904 | DM0 | maeA | 28.08 | 15.30 | 44.72 | <0.0001 |
| ZDBp911 | DM25 | maeA | 2.22 | 1.54 | 3.39 | <0.0001 |
| ZDBp917 | DM25 | maeA | 4.72 | 3.56 | 6.18 | <0.0001 |
| ZDBp919 | DM25 | maeA | 12.81 | 2.16 | 18.00 | <0.0001 |
-
*These bounds indicate the ratio of the minimum and maximum sequencing coverage measured at the indicated locus to the mean sequencing coverage over the genome.
†Significance levels are shown after Bonferroni corrections for multiple tests of the same hypothesis.
-
‡There may be two discontinuous amplifications of dctA in this genome, or there may be a single continuous amplification with a short region of low coverage within the gene. The second region of amplification has a similar copy number. We present data for only one region, which provides a conservative estimate of the overall statistical significance in this case.
-
Table 1—source data 1
Copy number of amplifications affecting citT, dctA, and maeA in the ancestral and evolved clones.
- https://cdn.elifesciences.org/articles/55414/elife-55414-table1-data1-v2.csv
Table 2
Copy number of amplified citT genes in sequenced clones.
| Genome | Medium | Mean copy number | Minimum copy number* | Maximum copy number* |
|---|---|---|---|---|
| CZB151 | DM25 | 4.21 | 3.39 | 5.47 |
| CZB152 | DM25 | 8.23 | 5.17 | 11.46 |
| CZB154 | DM25 | 4.14 | 1.72 | 9.83 |
| ZDBp871 | DM0 | 2.82 | 1.70 | 4.26 |
| ZDBp875 | DM0 | 11.37 | 8.05 | 14.93 |
| ZDBp877 | DM0 | 7.68 | 3.66 | 11.33 |
| ZDBp880 | DM0 | 3.82 | 1.79 | 5.93 |
| ZDBp883 | DM0 | 5.08 | 1.88 | 12.81 |
| ZDBp886 | DM0 | 4.76 | 2.27 | 6.88 |
| ZDBp889 | DM0 | 4.66 | 2.90 | 7.11 |
| ZDBp892 | DM0 | 5.69 | 2.21 | 8.76 |
| ZDBp895 | DM0 | 5.30 | 2.13 | 8.51 |
| ZDBp898 | DM0 | 6.14 | 2.77 | 9.73 |
| ZDBp901 | DM0 | 3.91 | 1.83 | 5.64 |
| ZDBp904 | DM0 | 3.84 | 1.78 | 5.68 |
| ZDBp910 | DM25 | 4.71 | 2.40 | 6.47 |
| ZDBp911 | DM25 | 3.13 | 1.58 | 5.01 |
| ZDBp912 | DM25 | 8.93 | 4.51 | 13.41 |
| ZDBp913 | DM25 | 4.83 | 2.68 | 6.94 |
| ZDBp914 | DM25 | 4.11 | 2.03 | 6.17 |
| ZDBp915 | DM25 | 3.31 | 1.78 | 5.19 |
| ZDBp916 | DM25 | 4.87 | 2.67 | 6.95 |
| ZDBp917 | DM25 | 3.20 | 1.77 | 4.63 |
| ZDBp918 | DM25 | 3.66 | 1.88 | 5.18 |
| ZDBp919 | DM25 | 2.91 | 2.06 | 3.81 |
| ZDBp920 | DM25 | 3.92 | 2.08 | 5.49 |
| ZDBp921 | DM25 | 5.76 | 2.93 | 9.15 |
-
*These bounds indicate the ratio of the minimum and maximum sequencing coverage measured at the citT locus to the mean coverage over the genome. In all cases, the estimated copy number is significantly greater than one at p<0.0001, even after Bonferroni corrections for multiple tests of the same hypothesis.
-
Table 2—source data 1
Copy number of amplifications affecting citT, dctA, and maeA in the ancestral and evolved clones.
- https://cdn.elifesciences.org/articles/55414/elife-55414-table2-data1-v2.csv
Additional files
-
Supplementary file 1
Key resources table.
- https://cdn.elifesciences.org/articles/55414/elife-55414-supp1-v2.docx
-
Supplementary file 2
Full results for gene amplifications in the DM0- and DM25-evolved genomes.
- https://cdn.elifesciences.org/articles/55414/elife-55414-supp2-v2.csv
-
Supplementary file 3
Full results of differential expression analysis between ancestral (CZB151 and CZB152) and evolved strains (ZDBp877, ZDBp883, ZDBp889), calculated using the Wald test implemented in sleuth (Pimentel et al., 2017).
- https://cdn.elifesciences.org/articles/55414/elife-55414-supp3-v2.csv
-
Supplementary file 4
Details of populations, clones, and genome sequencing datasets described in this study.
- https://cdn.elifesciences.org/articles/55414/elife-55414-supp4-v2.xlsx
-
Supplementary file 5
Details of the mutations found in the DM0- and DM25-evolved clones, as shown in Figure 11.
- https://cdn.elifesciences.org/articles/55414/elife-55414-supp5-v2.zip
-
Transparent reporting form
- https://cdn.elifesciences.org/articles/55414/elife-55414-transrepform-v2.docx
Download links
A two-part list of links to download the article, or parts of the article, in various formats.
Downloads (link to download the article as PDF)
Open citations (links to open the citations from this article in various online reference manager services)
Cite this article (links to download the citations from this article in formats compatible with various reference manager tools)
Genomic and phenotypic evolution of Escherichia coli in a novel citrate-only resource environment
eLife 9:e55414.
https://doi.org/10.7554/eLife.55414


