Serine phosphorylation regulates the P-type potassium pump KdpFABC
- Skirball Institute, Dept. of Cell Biology, New York University School of Medicine, United States
- PHYLIFE, Physical Life Science, Department of Physics, Chemistry and Pharmacy, University of Southern Denmark, Denmark
- Department of Molecular Biology and Genetics, Aarhus University, Denmark
Figures
Figure 1
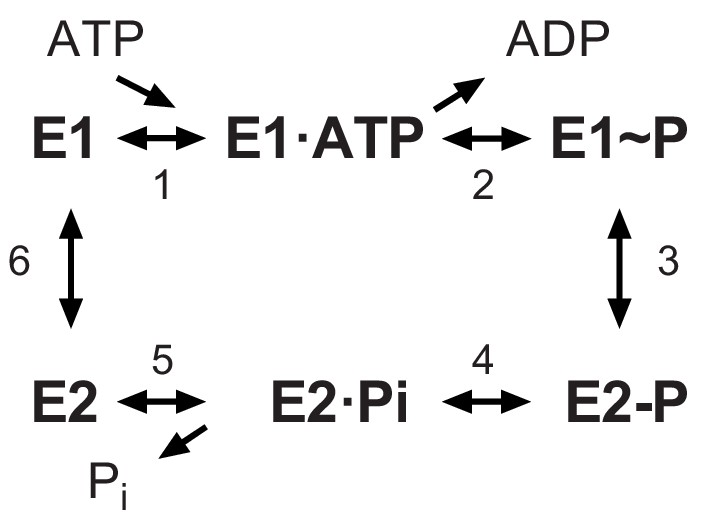
The Post-Albers scheme for the reaction cycle of P-type ATPases.
The cycle alternates between two major conformations denoted E1 and E2. The E1 state binds ATP and produces the high-energy aspartyl phosphoenzyme intermediate (E1~P), which remains reactive with ADP. A spontaneous transition produces the low-energy E2-P intermediate, which no longer reacts with ADP but instead undergoes hydrolysis to produce the E2 species.
Figure 2
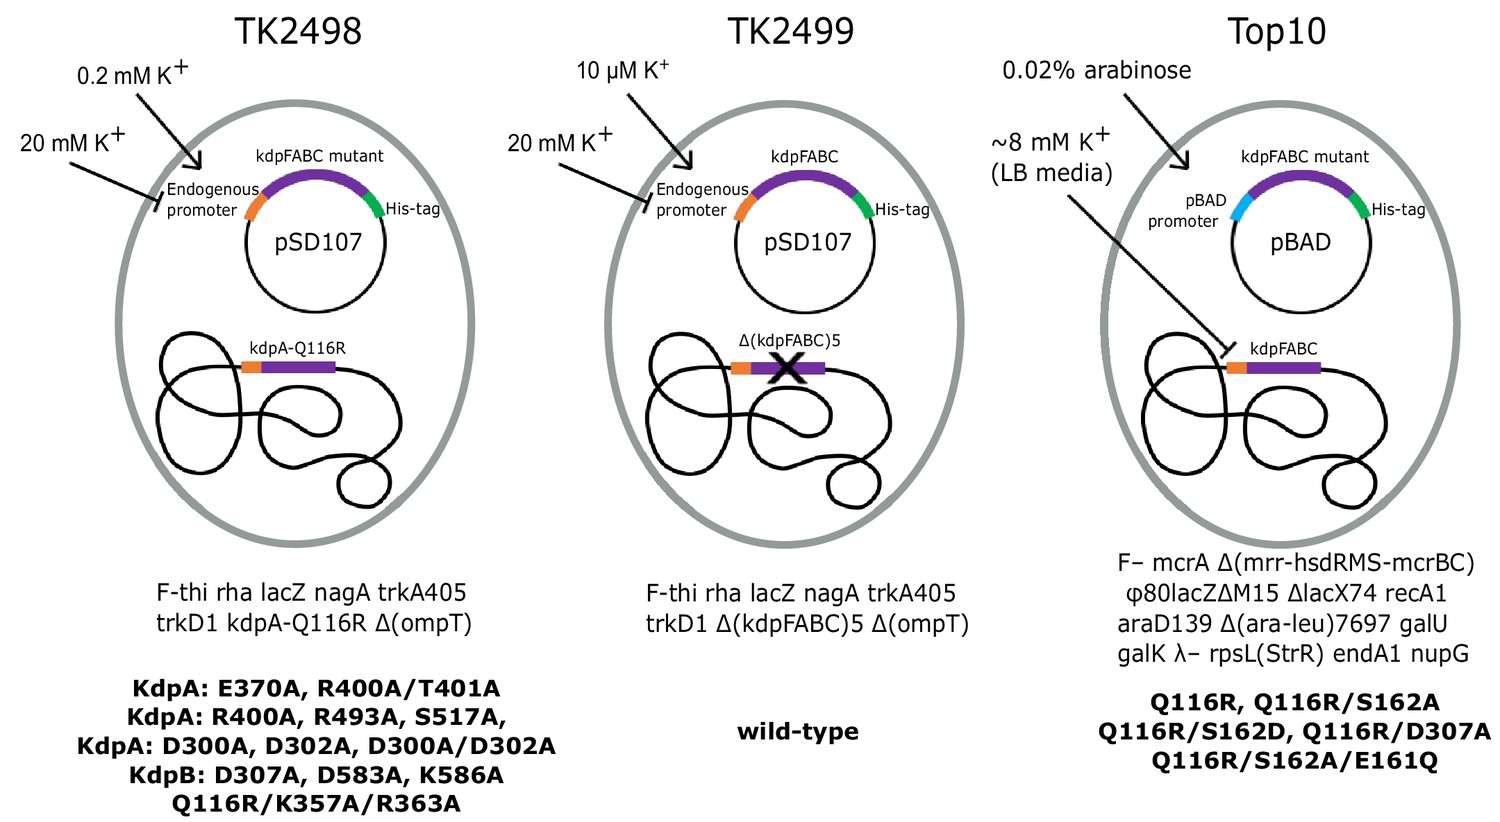
Bacterial strains used to express various KdpFABC mutants.
The TK2498 strain contains a chromosomal copy of kdpFABC that carries the KdpA-Q116R mutation behind the native promotor. This gene rescues the cells in K+-deficient media (0.2 mM), which also serves to induce expression not only of the chromosomal copy, but also of His-tagged mutants on plasmids derived from pSD107, which carries the same native promoter. The genotype is shown below together with mutants expressed from this strain. The TK2499 strain has the same genotype as TK2498, except that it lacks the chromosomal copy of kdpFABC. It was used for expression of the His-tagged WT protein, which is induced at μM K+ concentrations. This strain was used for K+ shock experiments. The Top10 strain was used for expression of several His-tagged mutants behind the pBAD promoter grown in standard LB media and induced with arabinose. This strain was used for expression of proteins for biochemical assays of aspartyl phosphate formation. The mutants and their expression conditions are summarized in Table 1.
Figure 3 with 1 supplement
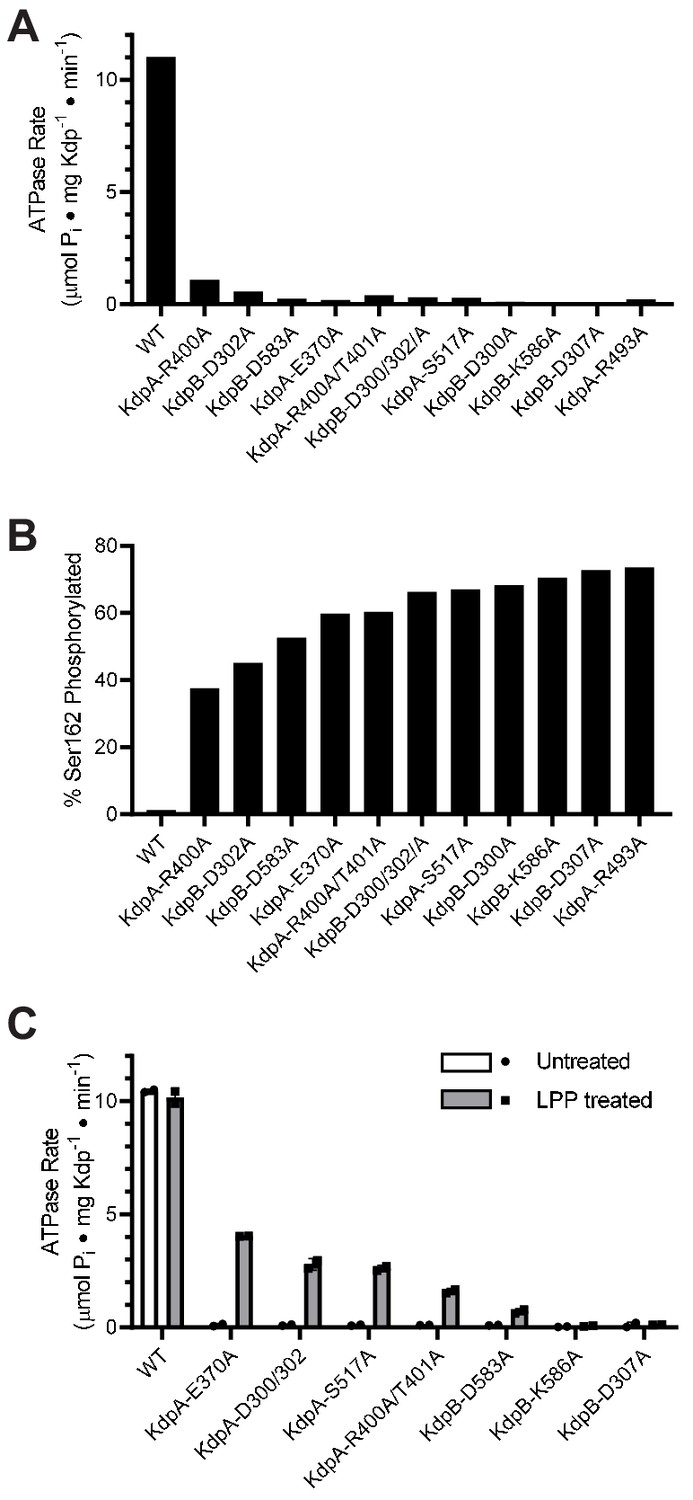
Survey of alanine substitution mutants reveals inhibition and serine phosphorylation of KdpB.
(A) Very low levels of ATPase activity were obtained from a series of Ala substitution mutants. As indicated in Table 1, WT protein has been expressed in TK2499 at very low levels of K+, whereas the other constructs were expressed in TK2498 at 200 μM K+. (B) Mass spectrometry of these Ala mutants revealed high levels of phosphorylation of Ser162 on KdpB. (C) Treatment of several of these mutants with LPP to remove serine phosphorylation resulted in significant stimulation of ATPase activity, supporting the notion that serine phosphorylation is inhibitory. Data in panels A and B are single measurements, whereas data in panel C were collected in duplicate.
-
Figure 3—source data 1
Survey of alanine substitution mutants.
- https://cdn.elifesciences.org/articles/55480/elife-55480-fig3-data1-v2.txt.zip
Figure 3—figure supplement 1
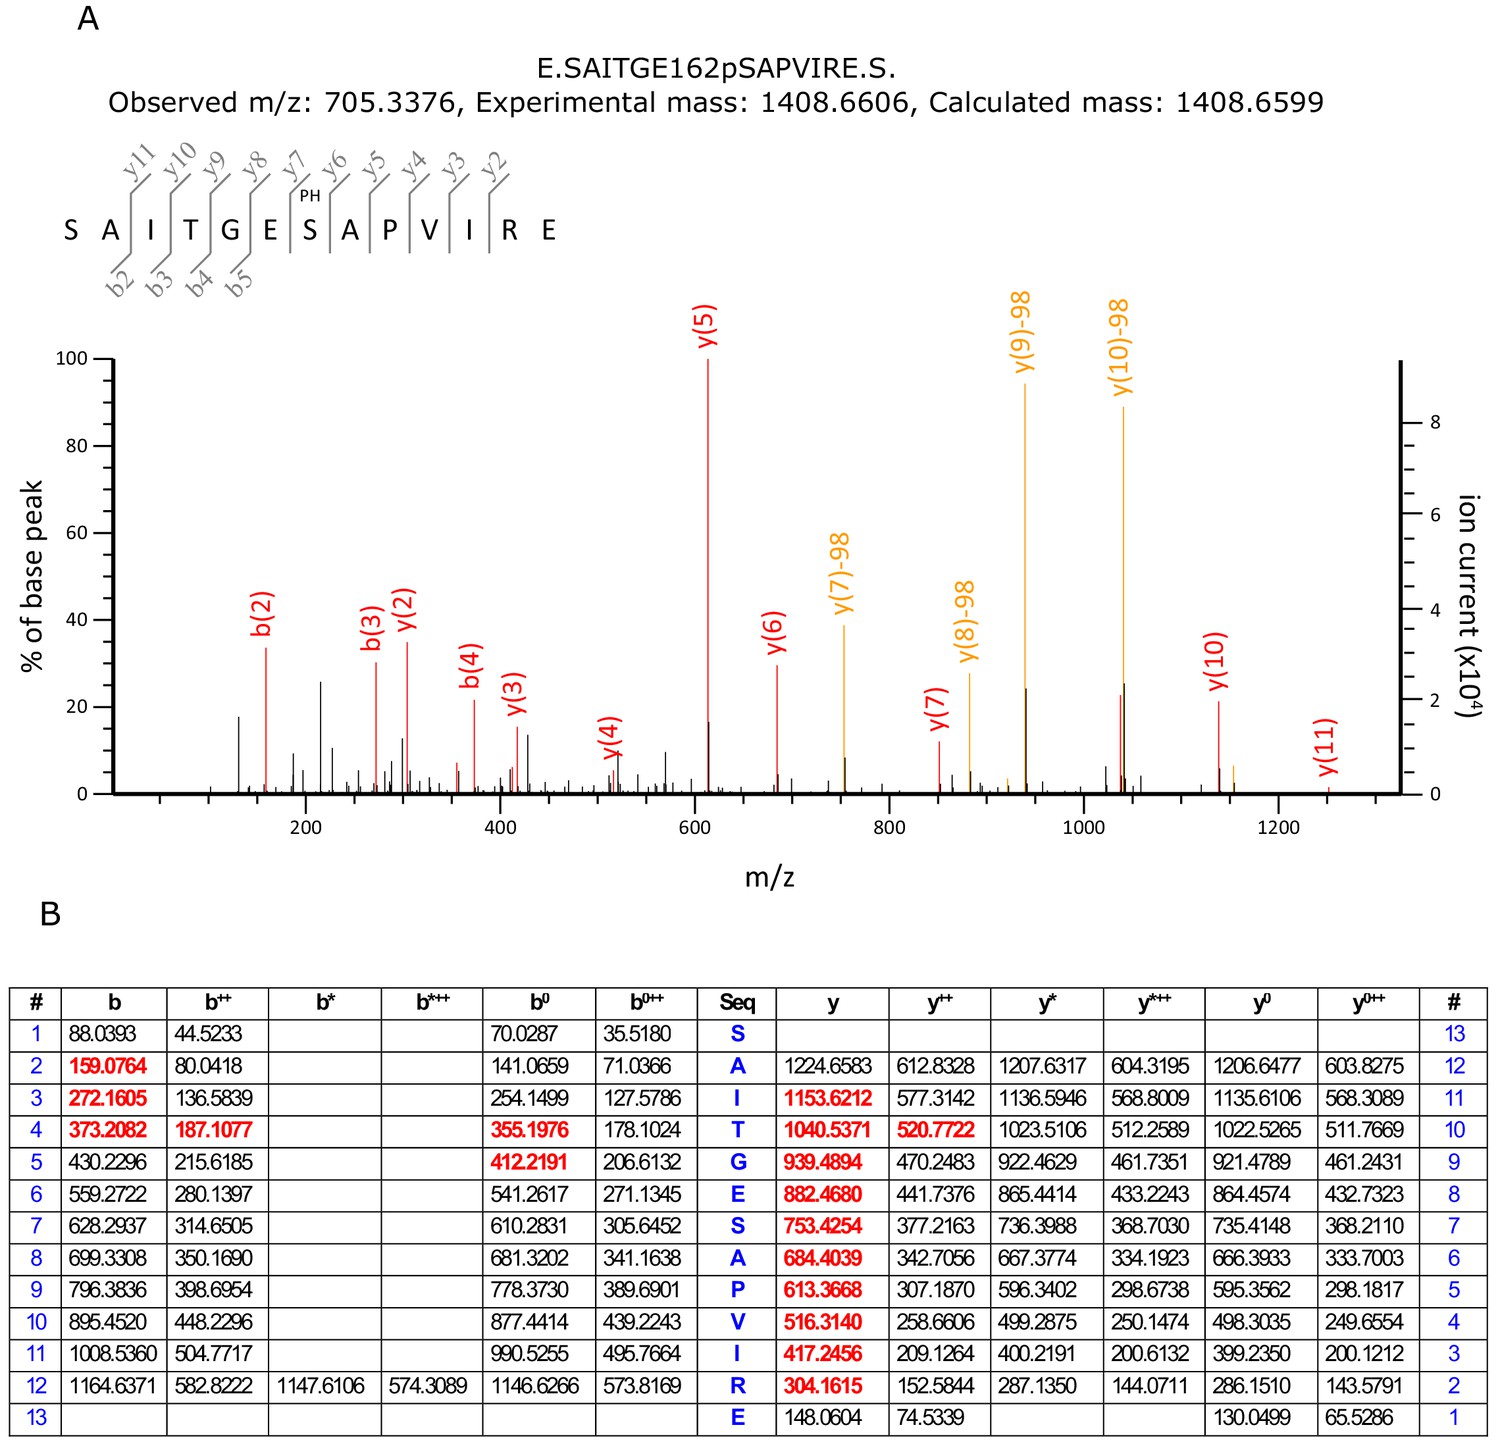
Detection of Ser162 phosphorylation by mass spectrometry.
(A) MS/MS spectrum of phosphopeptide from KdpFABC with m/z 705.3376 and sequence SAITGE162pSAPVIRE. The observed fragment ions were used to confirm that Ser162 is the site of phosphorylation. (B) Predicted MS/MS fragment ions for the phosphopeptide SAITGE162pSAPVIRE. Fragment ions in red were detected in the spectrum in panel A. The data analysis was generated by the Mascot search engine which reported a 99.7% probability that the site of phosphorylation was on Ser162 and a combined probability of 0.3% for Ser156 and Thr159.
Figure 4 with 1 supplement
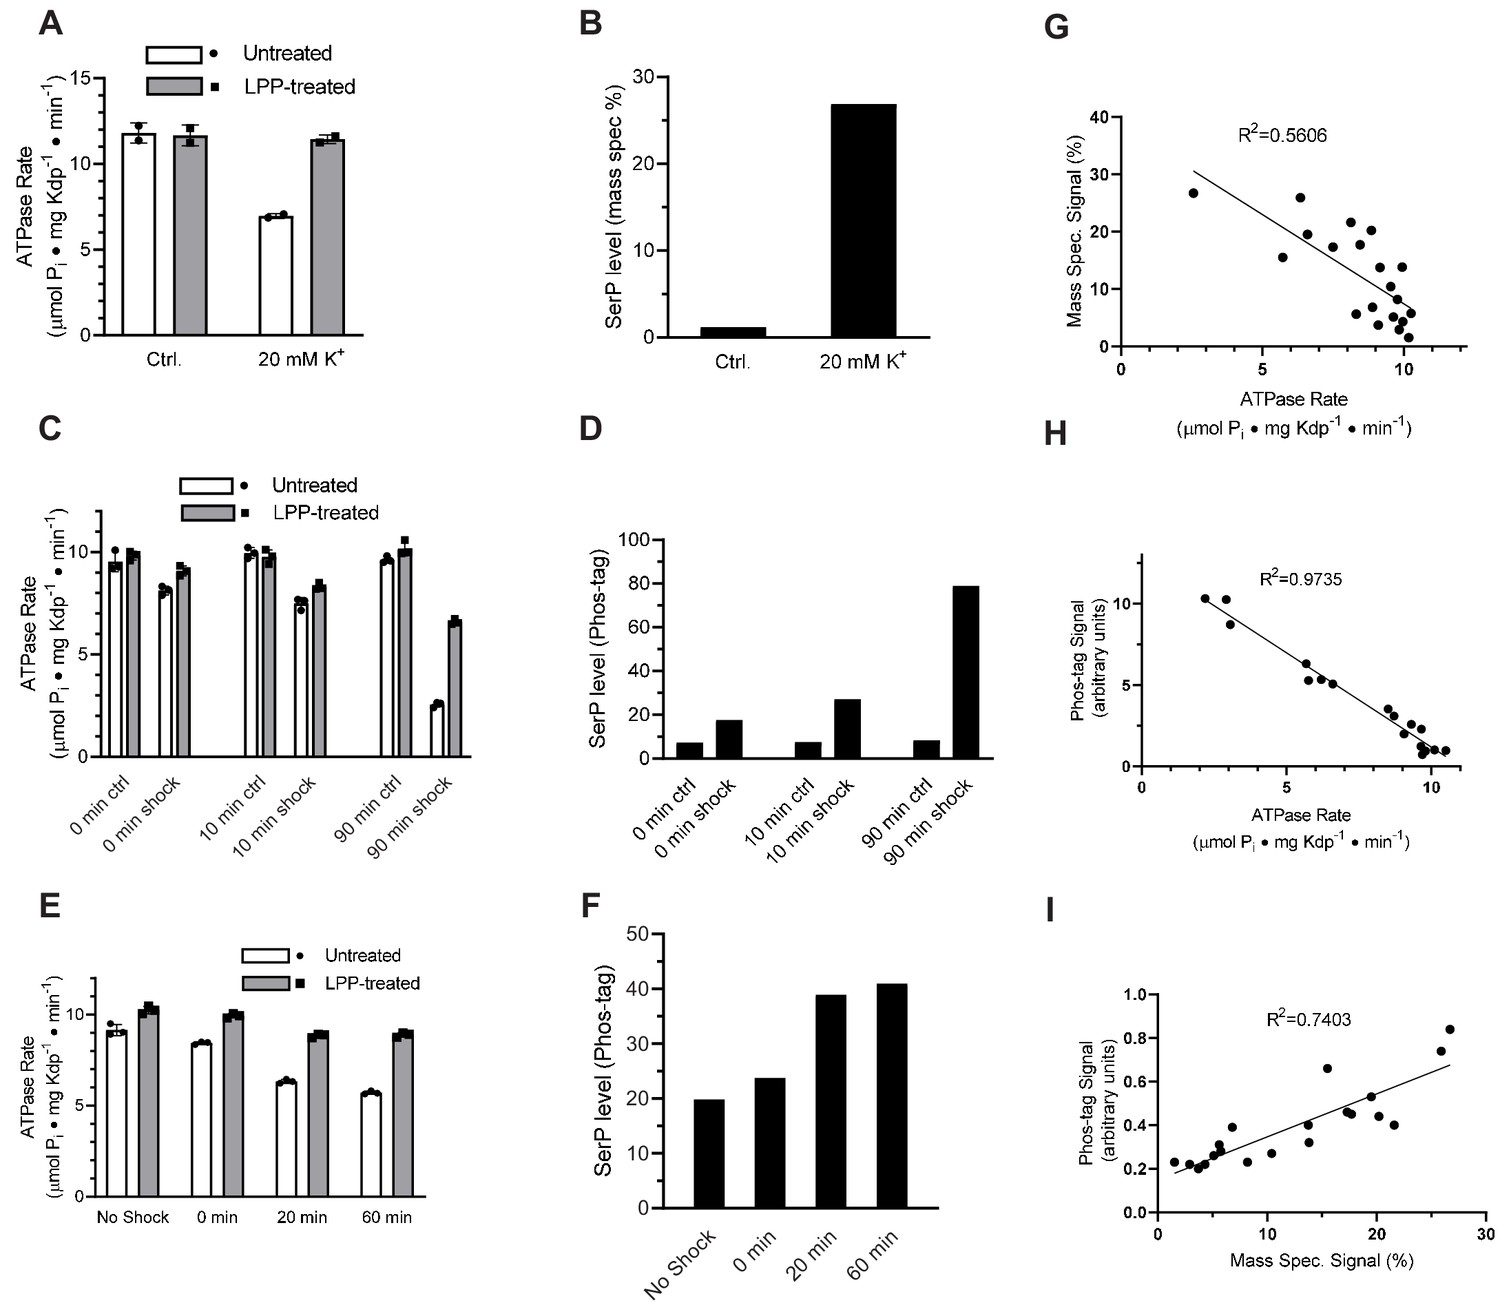
K+ shock leads to serine phosphorylation of KdpB and inhibition of ATPase activity.
For these experiments, TK2499 cells were cultured at low K+ concentrations to induce expression of WT kdpFABC; thereafter, the culture was split and one half was subjected to 20 mM K+ for varying periods of time. (A) A 20 min K+ shock resulted in loss of ~40% of ATPase activity, which was fully recovered by LPP treatment. (B) Serine phosphorylation levels for samples from panel A determined by mass spectrometry were much higher after K+ shock. (C) ATPase rates from additional individual experiments with varying periods of K+ shock. The time periods are nominal because harvest of cells required a 20-min centrifugation in their respective media. (D) Serine phosphorylation levels for samples in panel C determined by Phos-tag staining of SDS gels show an increase in serine phosphorylation levels that is proportional to the observed inhibition of ATPase activity. (E) ATPase activities from a single culture split into four batches and treated with K+ for variable times show a graded inhibitory response. (F) Levels of serine phosphorylation for the cultures in panel E were determined by Phos-tag staining. (G) Data from all experiments were combined and show a reasonable correlation (R = 0.56) between ATPase activity and levels of serine phosphorylation determined by mass spectrometry. (H) Correlation of ATPase activities from all the experiments with levels of serine phosphorylation determined by Phos-tag staining produces a much better correlation (R = 0.97). (I) Correlation of serine phosphorylation levels from mass spectrometry and Phos-tag staining. ATPase measurements were performed in triplicate and shown as mean plus SEM; phosphoserine levels represent single measurements.
-
Figure 4—source data 1
K+shock leads to serine phosphorylation of KdpB and inhibition of ATPase activity.
- https://cdn.elifesciences.org/articles/55480/elife-55480-fig4-data1-v2.txt.zip
Figure 4—figure supplement 1
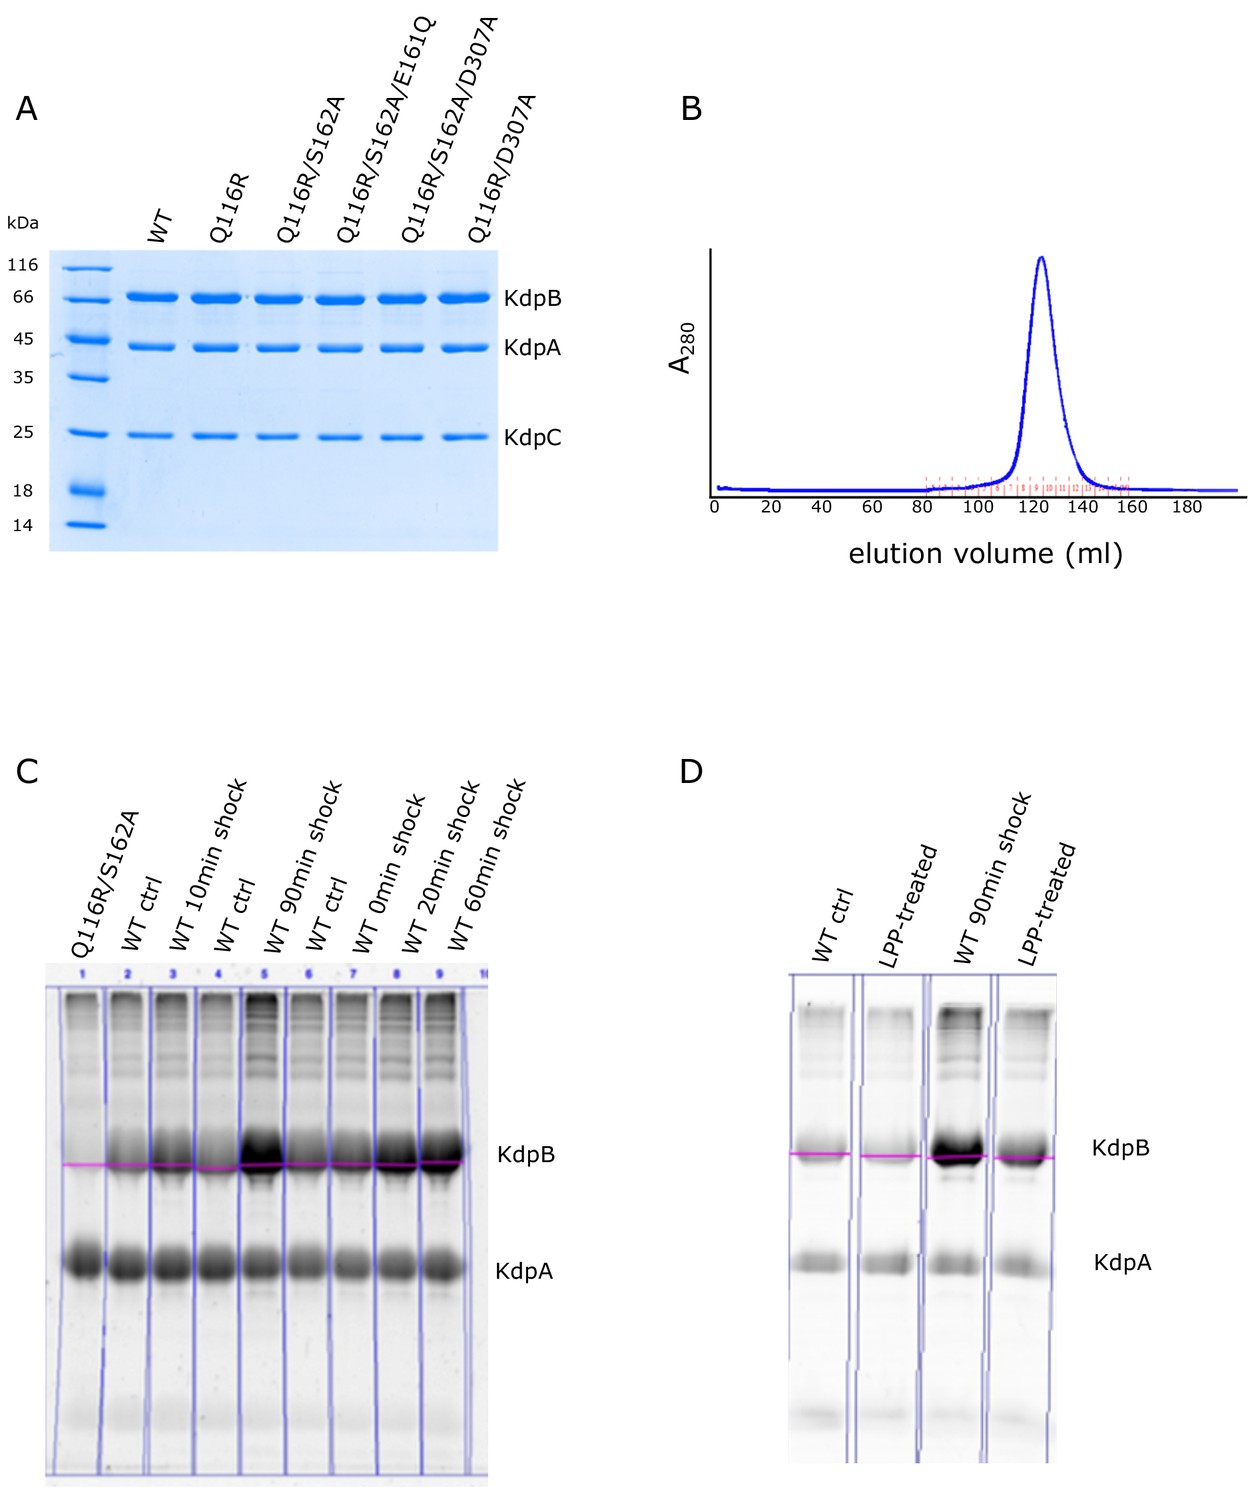
Preparation of KdpFABC and analysis of serine phosphorylation using Phos-tag stain.
(A) Coomassie-stained SDS-PAGE of purified preparations used for EP measurements. Although KdpA, KdpB and KdpC are readily visible, KdpF has run off the bottom of the gel due to its small mass. (B) Elution profile from the size-exclusion column shows that the purified protein is monodisperse. (C) Phos-tag staining of various preparations of KdpFABC before and after K+ shock for the indicated periods of time. KdpB has varying levels of Ser162 phosphorylation, which has been quantified and plotted in Figure 4. Unexpectedly, we also observed a constant level of staining of KdpA, which could reflect a tightly bound lipid. This idea is supported by data in panel (D), which shows that LPP treatment reduced the staining associated with KdpB, but did not affect the staining of KdpA.
Figure 5 with 2 supplements
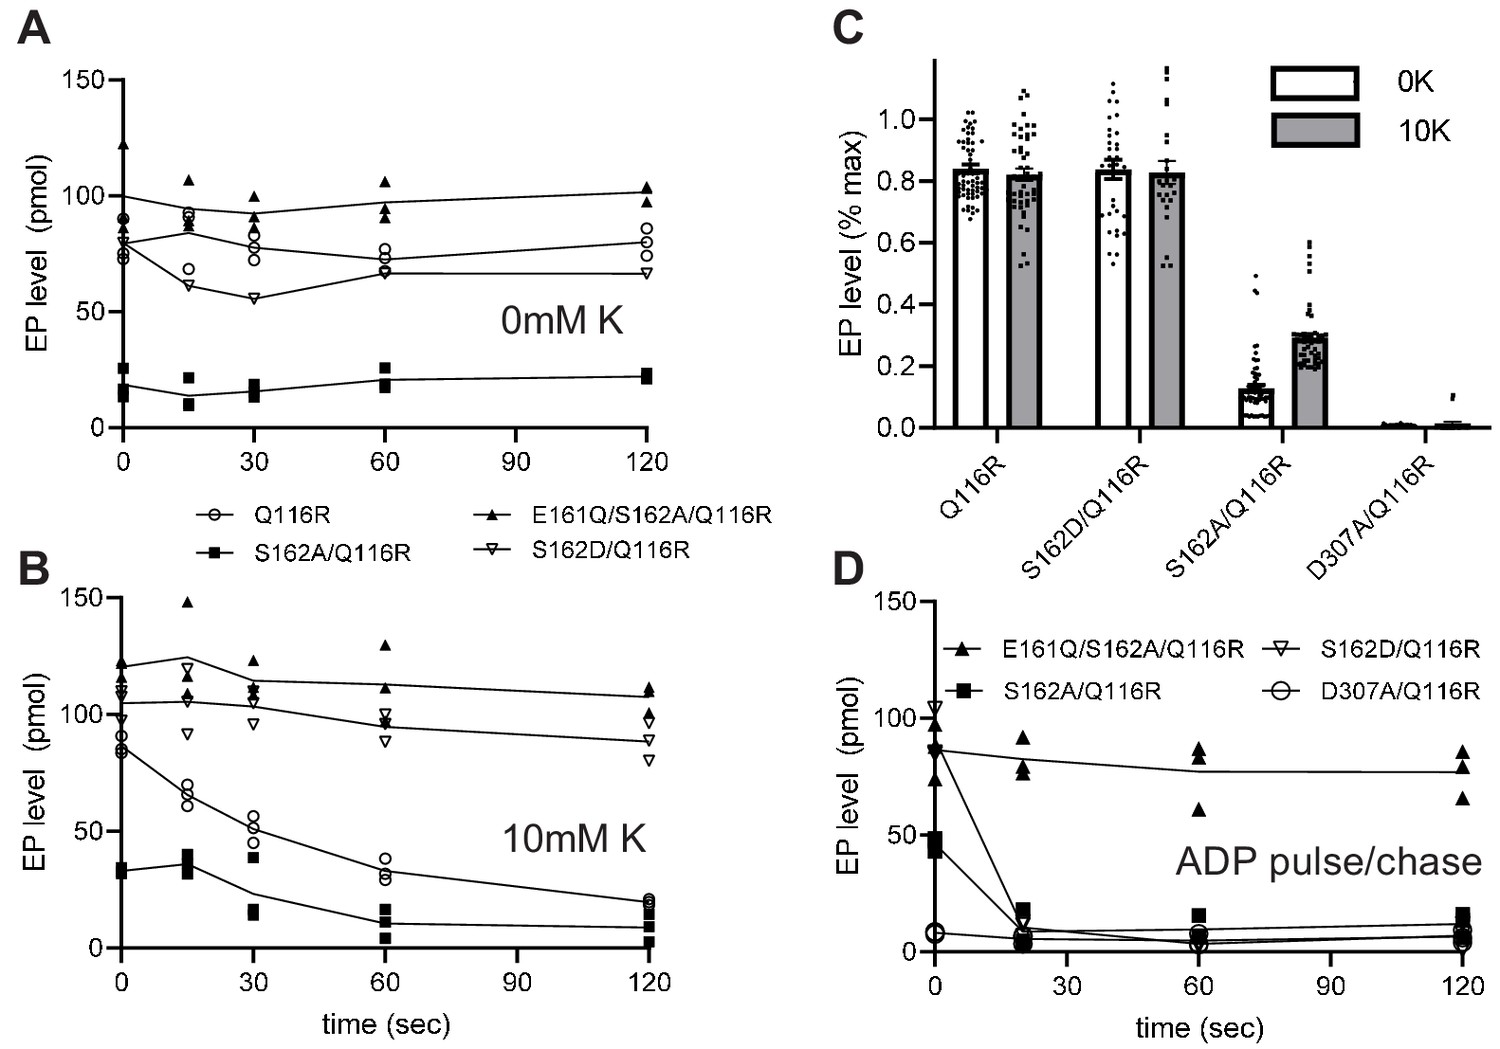
Steady-state levels of aspartyl phosphate (EP).
(A–B) Individual experiments comparing time-dependence of EP formation at room temperature of several different constructs in the absence (A) or presence (B) of 10 mM K+. EP formation was initiated by addition of [γ32-P]-ATP and aliquots were taken at various time intervals and quenched with TCA. The constructs are indicated in the legend. (C) Aggregated data from 15 individual experiments that have been normalized relative to levels for the E161Q construct. (D) Pulse-chase experiment in which samples have been incubated for 15 s with [γ32-P]-ATP at 4°C to achieve maximal levels of EP (plotted at time zero) followed by addition of 10 mM ADP and 10 mM EDTA for the indicated time periods. Data was collected in triplicate and lines are drawn through mean values at each time point. Error bars in panel C correspond to SEM.
-
Figure 5—source data 1
Steady-state levels of aspartyl phosphate (EP).
- https://cdn.elifesciences.org/articles/55480/elife-55480-fig5-data1-v2.txt.zip
Figure 5—figure supplement 1
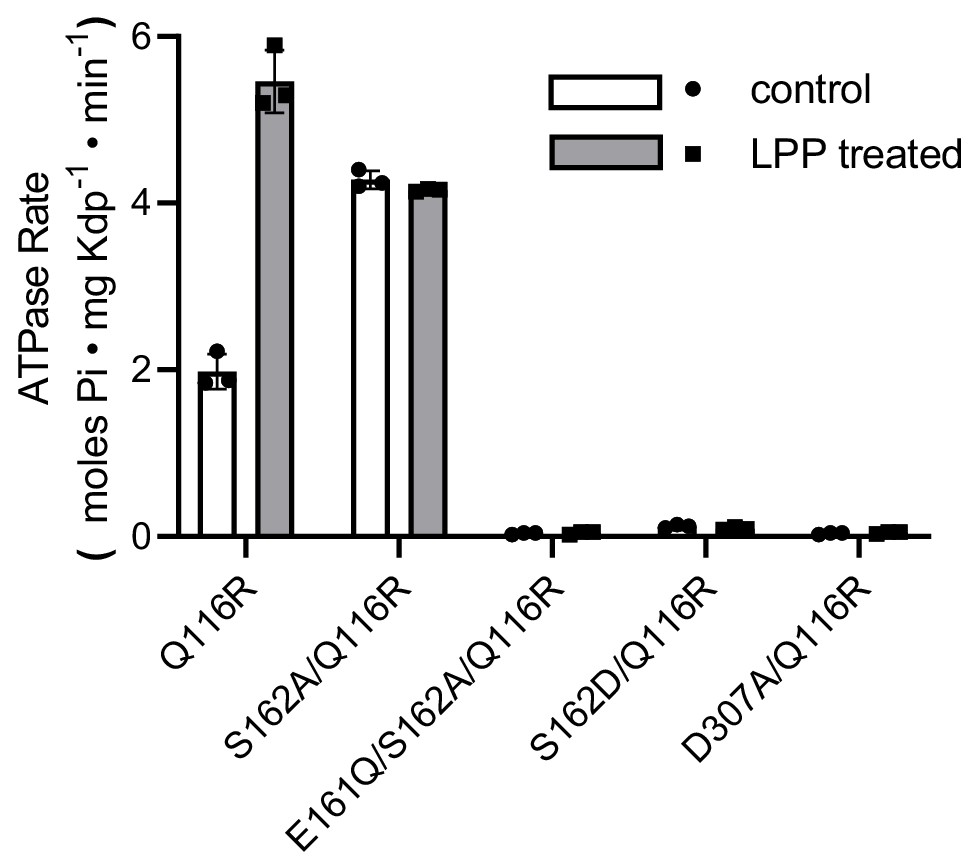
Preparations used for EP measurements.
ATPase activities of the various mutants before and after LPP treatment to remove serine phosphorylation. Triplicate measurements were made from each preparation, which are plotted as mean and SEM.
-
Figure 5—figure supplement 1—source data 1
Preparations used for EP measurements.
- https://cdn.elifesciences.org/articles/55480/elife-55480-fig5-figsupp1-data1-v2.txt.zip
Figure 5—figure supplement 2

Steady-state levels of aspartyl phosphate (EP) are constant at 4°C.
(A) Individual experiments comparing time-dependence of EP formation in the absence of K+. (B) Data from the same constructs in the presence of 10 mM K+. EP formation was initiated by addition of [γ32P]-ATP and aliquots were taken at various time intervals and quenched with TCA. Data was collected in triplicate and the specific constructs are indicated in the legend.
-
Figure 5—figure supplement 2—source data 1
Steady-state levels of aspartyl phosphate (EP) at4°C.
- https://cdn.elifesciences.org/articles/55480/elife-55480-fig5-figsupp2-data1-v2.txt.zip
Figure 6 with 2 supplements
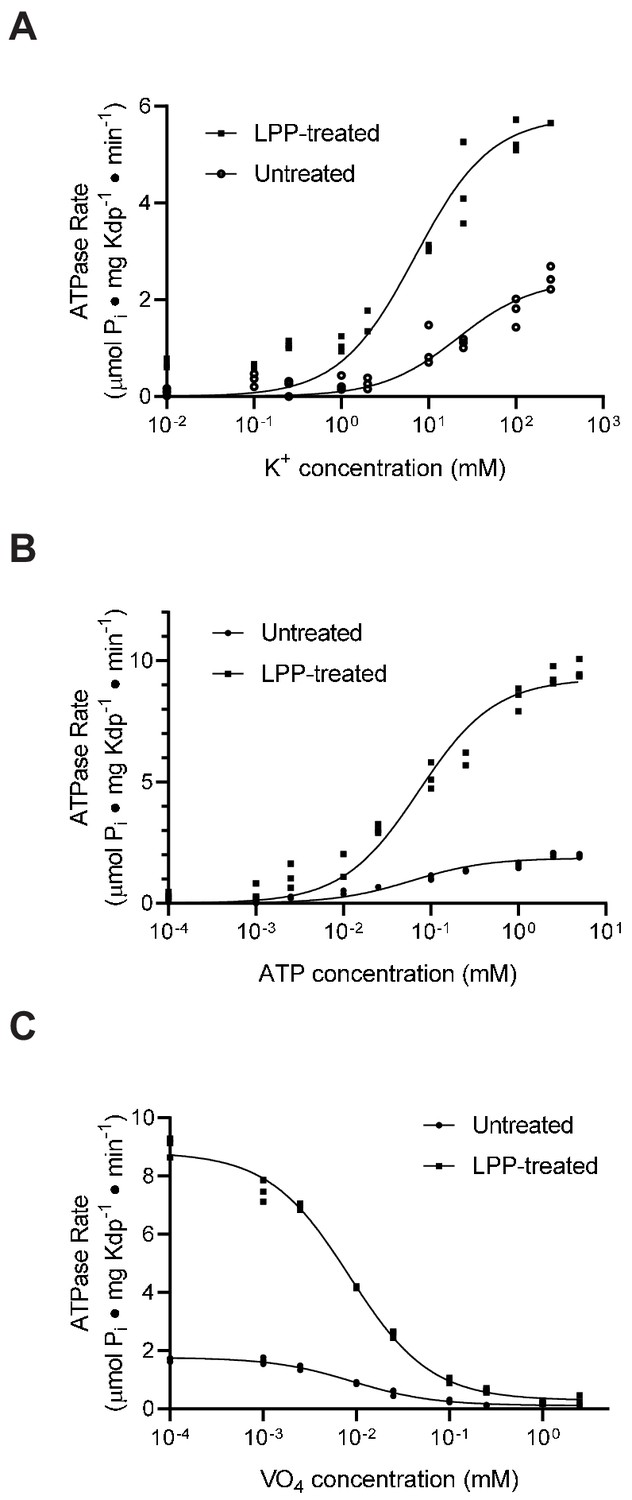
Substrate affinities are not affected by serine phosphorylation.
(A) For K+ titrations, the KdpA-Q116R mutant was expressed with the pBAD system, which produced high levels of serine phosphorylation (see Figure 5—figure supplement 1). K+-dependence curves show that TPP treatment increased Vmax significantly from 2.4 to 5.8 μmoles/mg/min, but that differences in KM (21.5 mM vs. 7.0 mM) where not statistically significant at the 95% confidence level. (B) ATP dependence of WT protein was fitted with Vmax = 1.9 and 9.3 μmoles/mg/min for untreated and treated samples respectively with insignificant change in KM (60 vs 73 μM). (C) Titrations of WT protein with orthovanadate produced maximal activities of 1.7 and 8.7 μmoles/mg/min for untreated and treated samples and IC50 values of 9.2 and 8.4 μM, respectively. Data were collected in triplicate and fitted with the Michaelis Menton equation (A,B) and inhibitor-response equation (C) in Prism8.
-
Figure 6—source data 1
Substrate affinities are not affected by serine phosphorylation.
- https://cdn.elifesciences.org/articles/55480/elife-55480-fig6-data1-v2.txt.zip
Figure 6—figure supplement 1
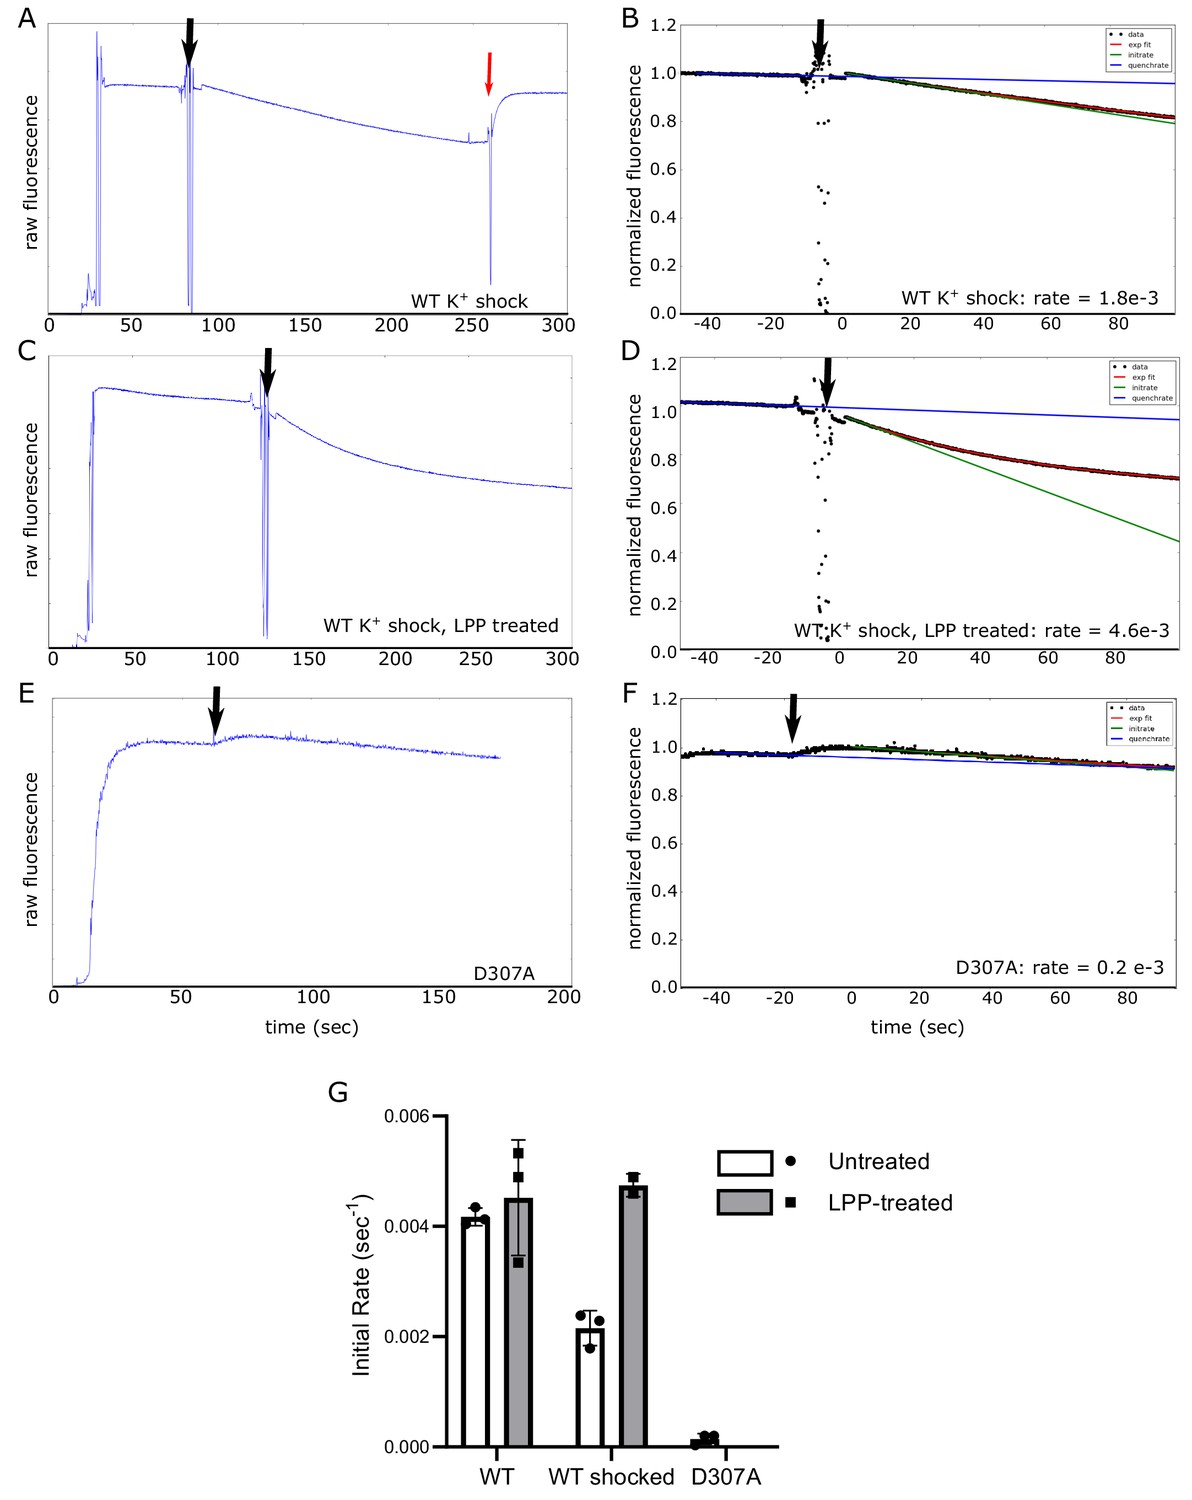
Electrogenic transport of K+ by KdpFABC.
Transport was initiated by addition of ATP (black arrow), which generates a decrease in fluorescence as the membrane voltage builds up. (A, C, E) Raw data from DiSC3 fluorescence generated by reconstituted proteoliposomes. In panel A, the red arrow indicate an addition of valinomycin, which abolished the membrane voltage. (B, D, F) Analysis of these data to determine the initial rate, which involved normalizing the signal, determining the rate of quenching and fitting the curve with an exponential. The exponential fit is indicated as a red line, the quench rate as a blue line and the initial slope as a green line. These data come from WT protein subjected to K+ shock before (A,B) and after (C,D) LPP treatment as well as from the D307A mutant (E,F), which serves as a negative control (indicated at the bottom of each plot). (G) Comparison of transport rates from five different preparations based on the initial slopes from three independent experiments. Inhibition of transport by K+-shock and recovery with LPP treatment is consistent with results from ATPase activity measurements in Figure 4, indicating that ATP hydrolysis and K+ transport remain coupled in these preparations. Measurements were performed in triplicate and plotted as mean plus SEM.
-
Figure 6—figure supplement 1—source data 1
Electrogenic transport of K+by KdpFABC.
- https://cdn.elifesciences.org/articles/55480/elife-55480-fig6-figsupp1-data1-v2.txt.zip
Figure 6—figure supplement 2
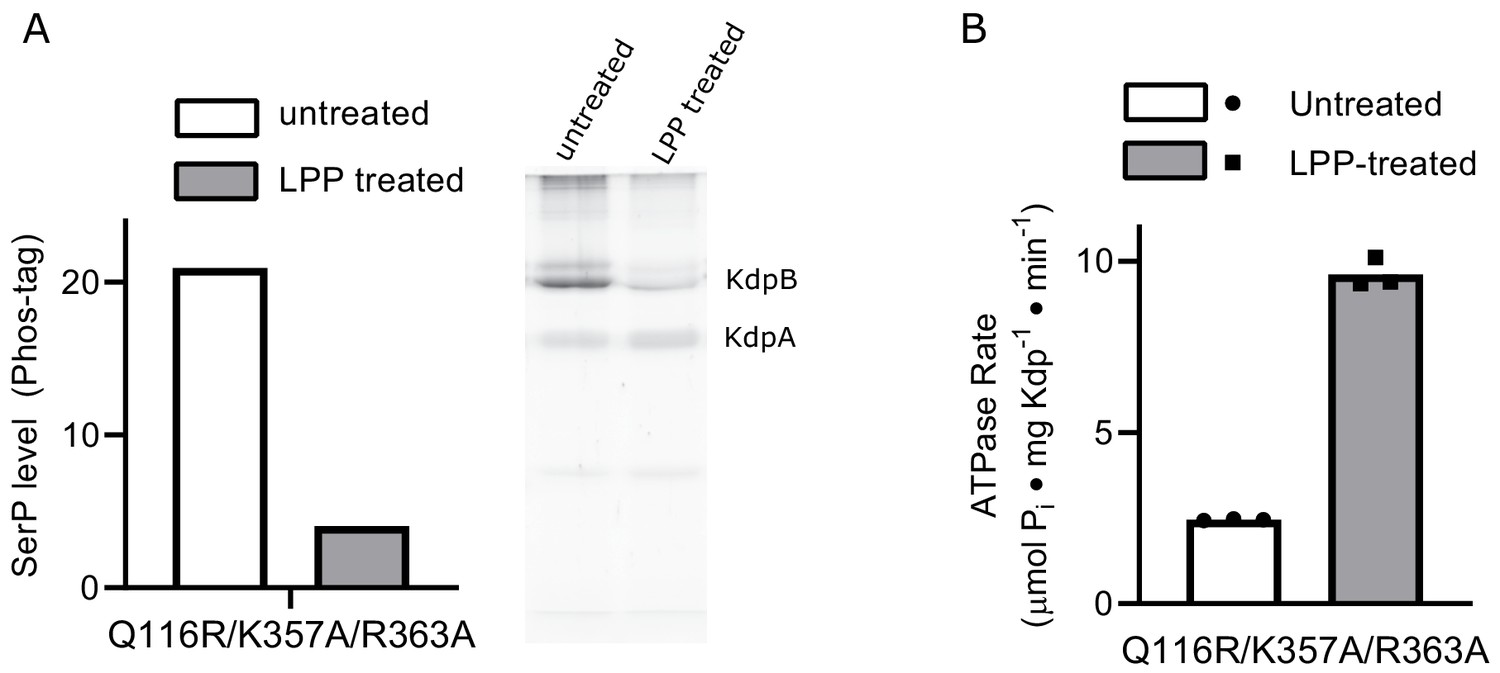
Interactions between A- and N-domains are not responsible for the inhibitory effects of serine phosphorylation.
(A) SDS-PAGE with Phos-tag statining of the K357A/R363A/Q116R mutant expressed in TK2498 shows robust serine phosphorylation of KdpB that is substantially reduced by LPP treatment. (B) ATPase activities from the K357A/R363A/Q116R mutant show an ~4-fold stimulation resulting from LPP treatment, thus producing ATPase levels comparable to WT. The ability of serine phosphorylation to inhibit this mutant indicates that salt bridges between the A-domain and the basic residues in the N-domain are not required for regulation of KdpFABC.
-
Figure 6—figure supplement 2—source data 1
Mutation of K357 and R363 in KdpB has no effect on the inhibitory effects of serine phosphorylation.
- https://cdn.elifesciences.org/articles/55480/elife-55480-fig6-figsupp2-data1-v2.txt.zip
Tables
Table 1
KdpFABC mutants.
| Annotation | Mutations | Strain | Promoter | Condition | Figures |
|---|---|---|---|---|---|
| WT | - | TK2499 | KdpE | μM K+ | 3,4,4-s1,6,6-s1 |
| KdpA-E370A | KdpA-E370A | TK2498 | KdpE | 0.2 mM K+ | 3 |
| KdpA-R400A/T401A | KdpA-R400A KdpA-T401A | TK2498 | KdpE | 0.2 mM K+ | 3 |
| KdpA-S517A | KdpA-S517A | TK2498 | KdpE | 0.2 mM K+ | 3 |
| KdpA-R400A | KdpA-R400A | TK2498 | KdpE | 0.2 mM K+ | 3 |
| KdpA-R493A | KdpA-R493A | TK2498 | KdpE | 0.2 mM K+ | 3 |
| KdpB-D300A | KdpB-D300A | TK2498 | KdpE | 0.2 mM K+ | 3 |
| KdpB-D302A | KdpB-D302A | TK2498 | KdpE | 0.2 mM K+ | 3 |
| KdpB-D300A/D302A | KdpB-D300A/ KdpB-D302A | TK2498 | KdpE | 0.2 mM K+ | 3 |
| KdpB-D307A | KdpB-D307A | TK2498 | KdpE | 0.2 mM K+ | 3,6-s1 |
| KdpB-D583A | KdpB-D583A | TK2498 | KdpE | 0.2 mM K+ | 3 |
| KdpB-K586A | KdpB-K586A | TK2498 | KdpE | 0.2 mM K+ | 3 |
| Q116R/K357A/R363A | KdpA-Q116R/ KdpB-K357A/ KdpB-R363A | TK2498 | KdpE | 0.2 mM K+ | 6-s2 |
| Q116R | KdpA-Q116R | Top10 | pBAD | LB media* | 5,5-s1,s2,6 |
| S162A/Q116R | KdpA-Q116R/ KdpB-S162A | Top10 | pBAD | LB media* | 5,5-s1,s2 |
| S162D/Q116R | KdpA-Q116R/ KdpB-S162D | Top10 | pBAD | LB media* | 5,5-s1 |
| D307A/Q116R | KdpA-Q116R/ KdpB-D307A | Top10 | pBAD | LB media* | 5,5-s1,s2 |
| S162A/E161Q/ Q116R | KdpA-Q116R/ KdpB-S162A/ KdpB-E161Q | Top10 | pBAD | LB media* | 5,5-s1,s2 |
-
*LB media has been reported to contain 8 mM K+ (Su et al., 2009).
Additional files
Download links
A two-part list of links to download the article, or parts of the article, in various formats.
Downloads (link to download the article as PDF)
Open citations (links to open the citations from this article in various online reference manager services)
Cite this article (links to download the citations from this article in formats compatible with various reference manager tools)
Serine phosphorylation regulates the P-type potassium pump KdpFABC
eLife 9:e55480.
https://doi.org/10.7554/eLife.55480


