A sensorimotor model shows why a spectral jamming avoidance response does not help bats deal with jamming
- Sagol School of Neuroscience, Tel Aviv University, Israel
- Department of Zoology, Tel Aviv University, Israel
Figures
Figure 1 with 4 supplements
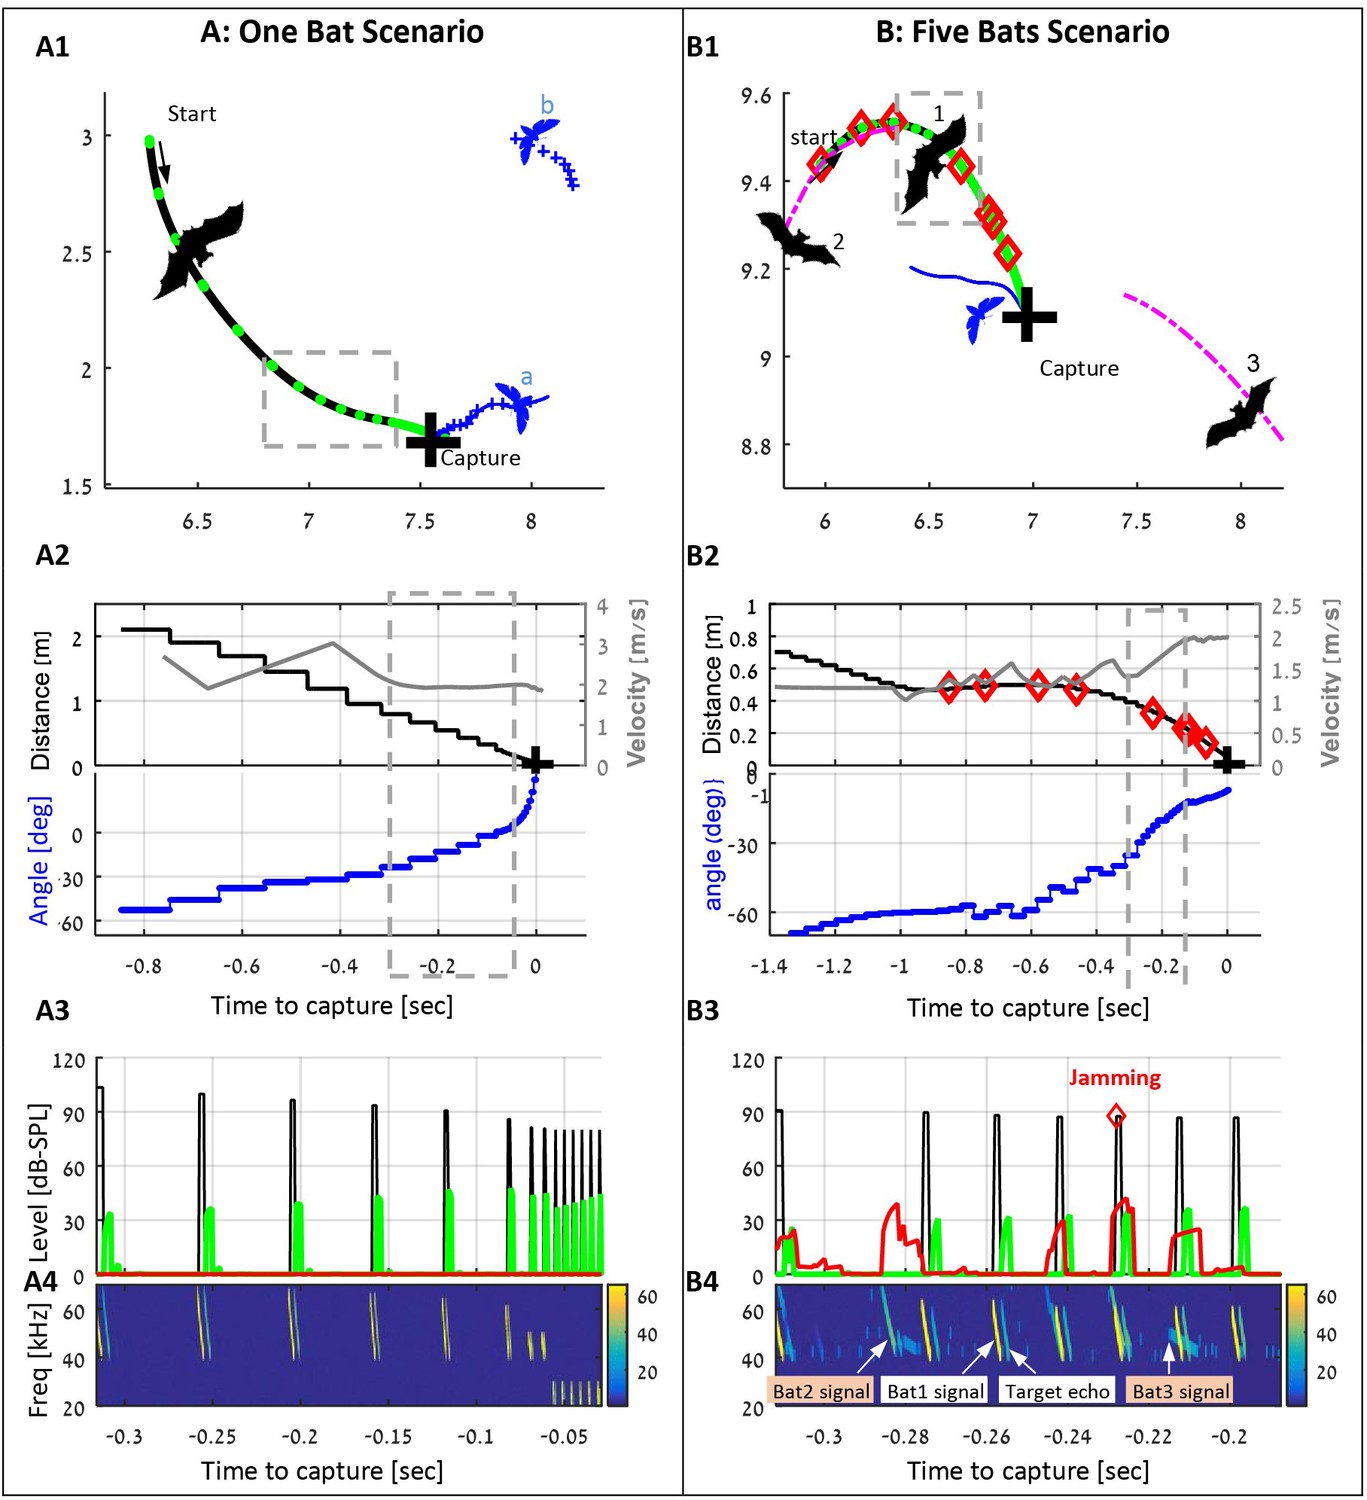
examples of individual and group hunting of the simulated bats (also see the Videos 1 and 2).
(A) A single simulated bat flying in the arena with five prey items. The bat detects two prey items and decides to pursue the closest one (moth a). Panel A1 shows the trajectories of the bat (black) and the moths (blue), the positions of each emitted call (green dots), and the location of the capture (black cross). Panel A2 shows the bat’s velocity (gray), the distance to the prey (black) and relative angle (blue) to it. Panel A3 shows the level of the following signals (while the bat is in the gray-bounded area in panel A1): the transmitted calls (black), the received echoes reflecting off the prey items (green), and the received masking signals (red). Panel A4 shows a spectrogram of the same segment as in panel 3. Note how the frequency drops at the final terminal buzz. (B) Three bats (out of five in the arena) hunting in an environment with 10 prey items. Bat one detects and pursues a moth, while conspecifics (bats 2 and 3) are flying nearby and emitting echolocation calls. Some of the conspecifics' calls mask (or jam) the echoes received by bat 1. Instances of jamming are marked by red diamonds in panels B1-B4. All colors and symbols in B1-B4 are the same as in A1-A4. Magenta lines depict trajectories of conspecifics. Panel B4 also demonstrates the variations between the calls of each bat due to the different behavioral phases. Note that bat two detects and pursues the same prey item and thus emits 'approach' calls. From the detection to the successful capture, bat 1 emitted 64 echolocation calls, 8 of which were jammed.
Figure 1—figure supplement 1

Simulated and real bats flight characteristics.
(A) A typical example of one real bat flying with two conspecifics in a closed flight room (5.5 × 4.5×2.5 m3) and with a feeding platform. A1 illustrates the flight trajectory (two dimensional) of the bat in 10 s. A2 illustrates the linear velocity of the bat as a function of time. (B) The flight-path and velocity of one simulated bat flying in a group of three bats with a static target in a 5 × 5 m 2D arena. (C) Boxplots (median, q1, q3 and outliers) of the linear-velocities and angular-velocities of the real bat (black) and simulated bat (gray). Note that both linear velocity and angular velocities of the model are in the range of natural velocities in similar conditions. Additionally, the acceleration of the model was bounded to 4 m/s2 while real bats’ acceleration was below 5 m/s2 during 95% of the time.
Figure 1—figure supplement 2
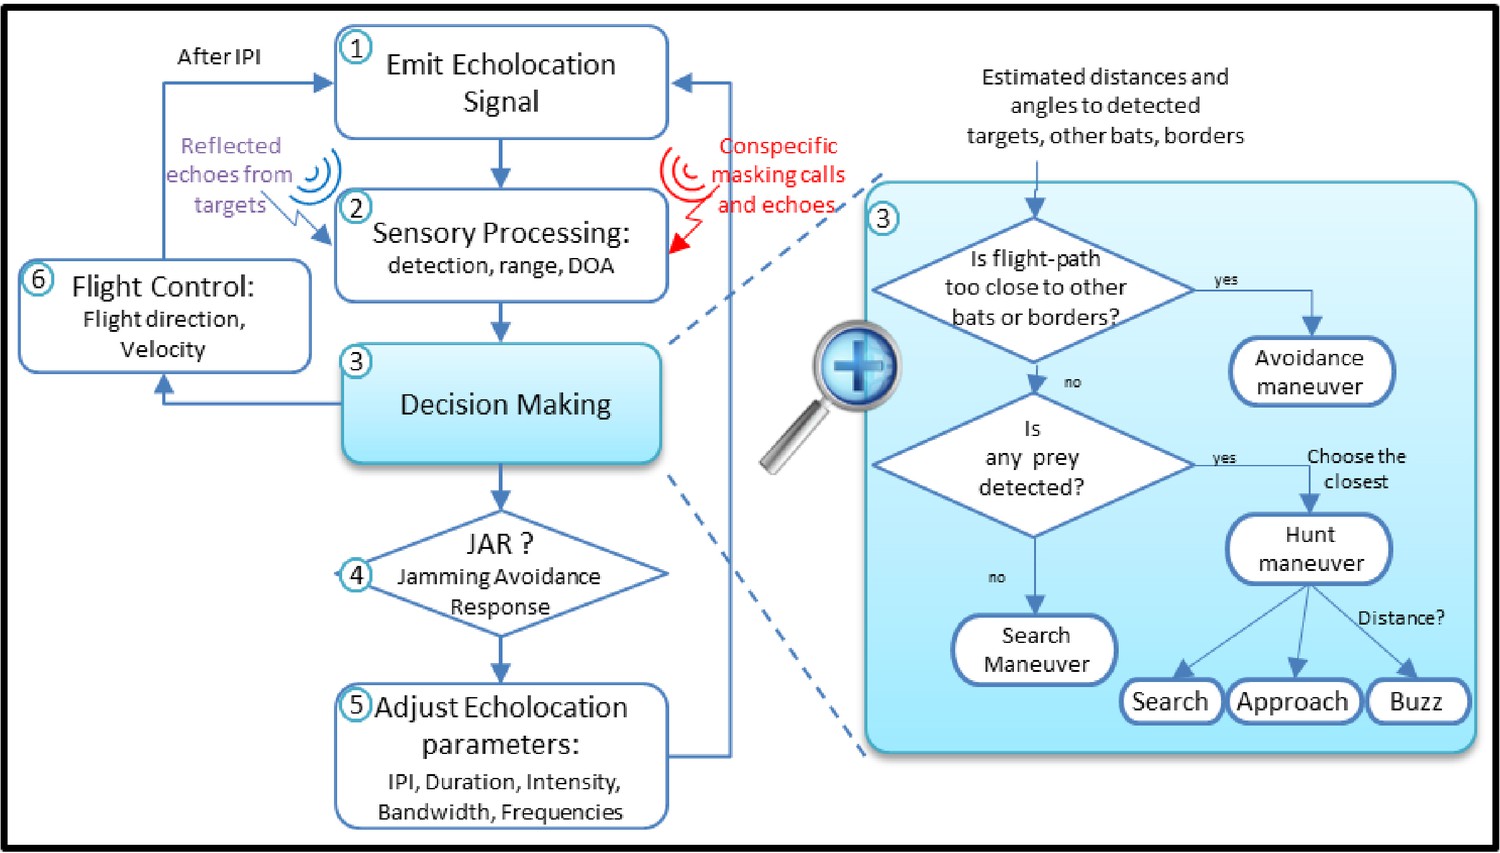
The Bat Module streamlines.
(1) The bat emits an echolocation call. (2) Based on the received signals (echoes from objects and masking signals from conspecifics) the bat detects the targets and estimates their relative locations. (3) According to the sensory output, it decides its next maneuver: keep searching, pursue prey or avoid obstacles, and determines its next phase: Search, Approach or Buzz. (4) If the bat experiences masking and if a JAR is applied, it modifies its echolocation calls. Depending on its decision, the bat adjusts the echolocation parameters (5), and its flight speed and direction (6), and after an inter-pulse-interval, emits another echolocation call (1).
Figure 1—figure supplement 3
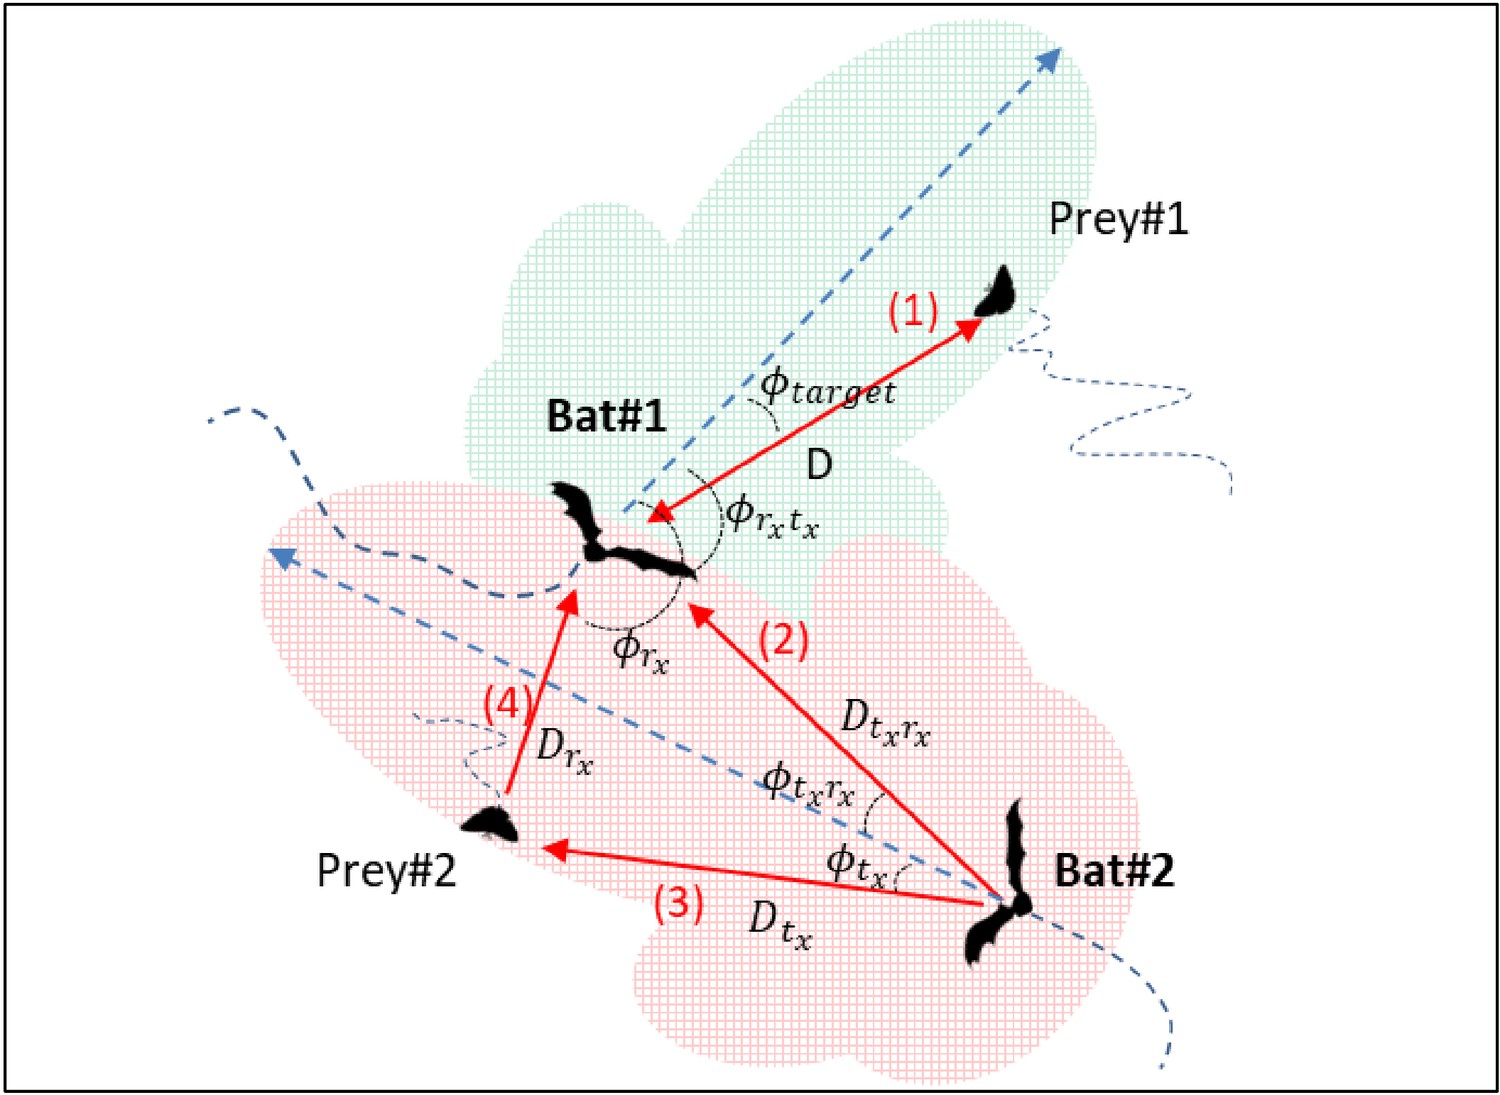
Angles and distances for two bats and two prey items.
Bat1 receives an echo reflecting off prey1 located at a distance of D from it, and an angle of relative to its flight direction (red arrow 1). Prey1 is within the detection range of Bat1, depicted by the green shaded piston area. Bat1 also receives masking signals: the calls emitted by Bat2, arrive at the ear of Bat1 at an angle relative to its flight direction and from a distance of (red arrow 2). The echolocation calls of Bat2 are reflected off Prey#2, and received by Bat#1, as masking signals at a relative angle of angle , and from a distance of Drx from Bat1.
Figure 1—figure supplement 4
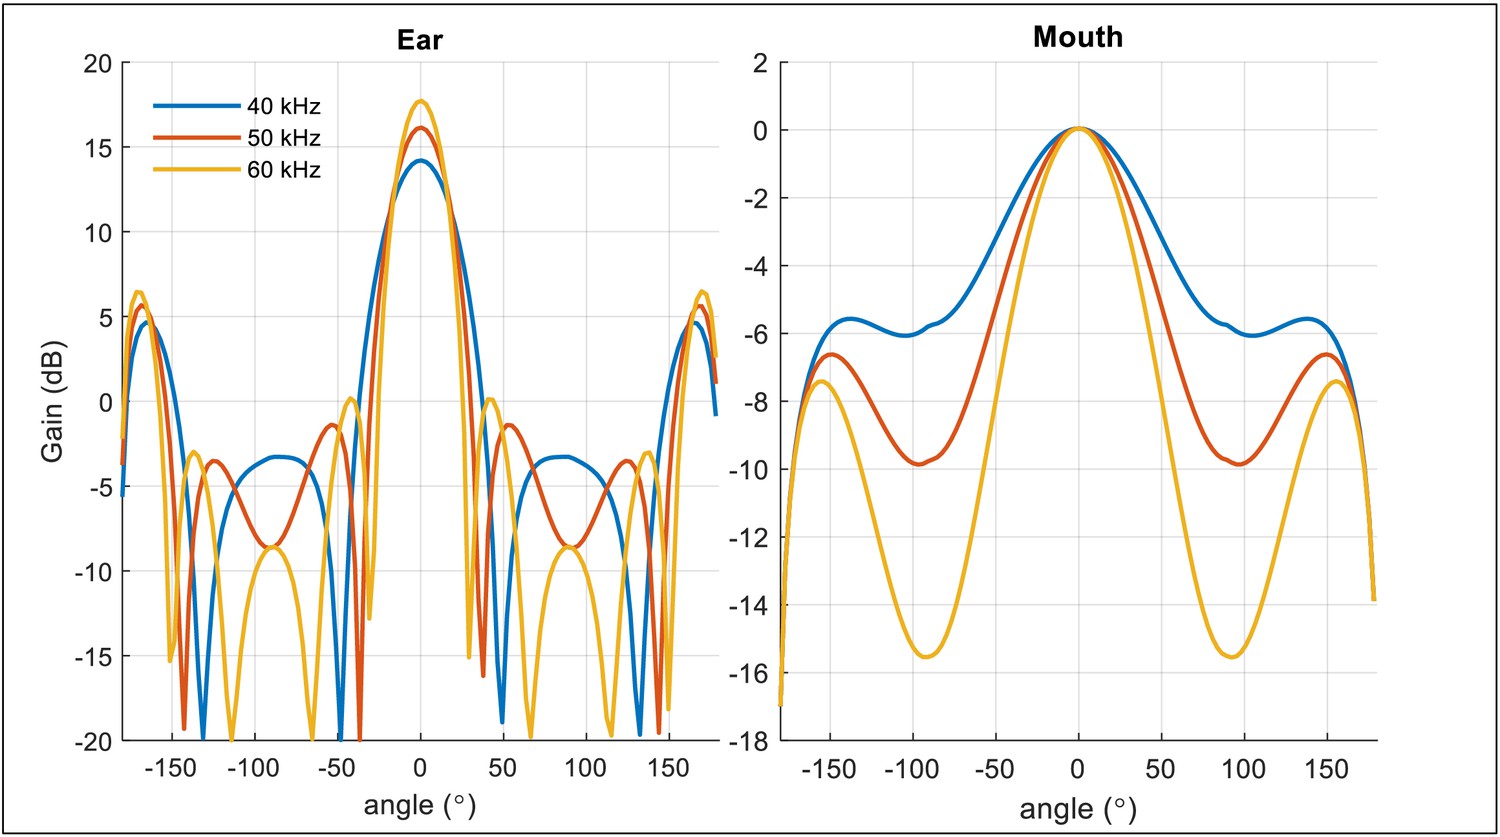
The modified piston model for the directivity of ear and mouth of the bat.
Figure 2 with 6 supplements
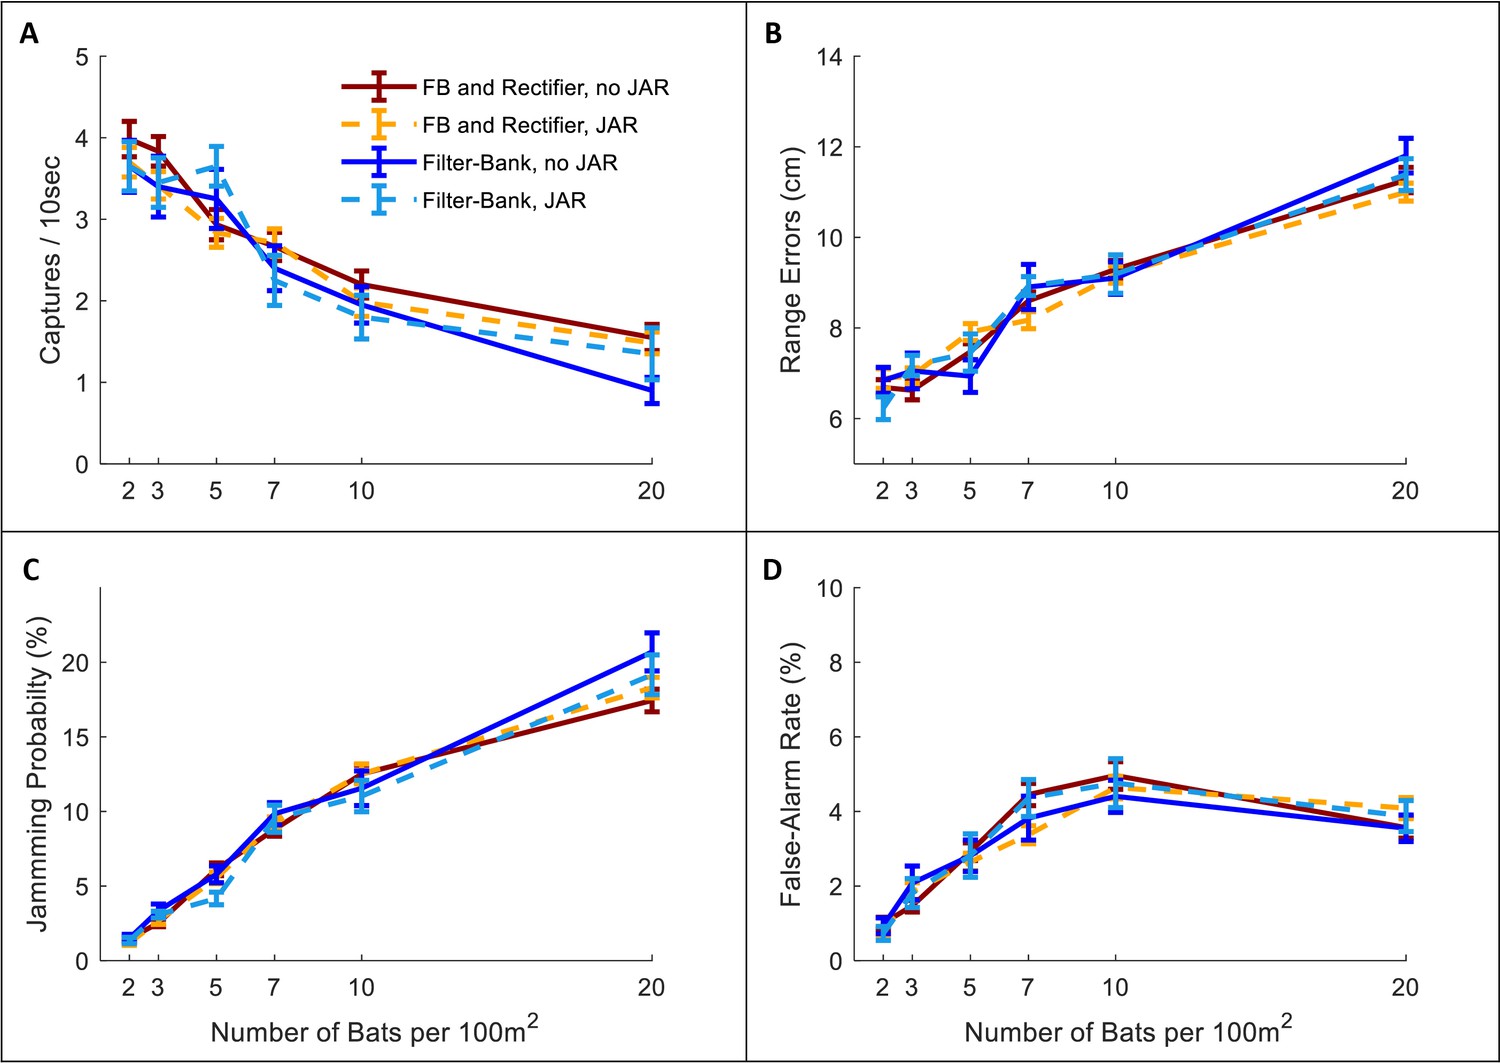
The effect of JAR on the receiver.
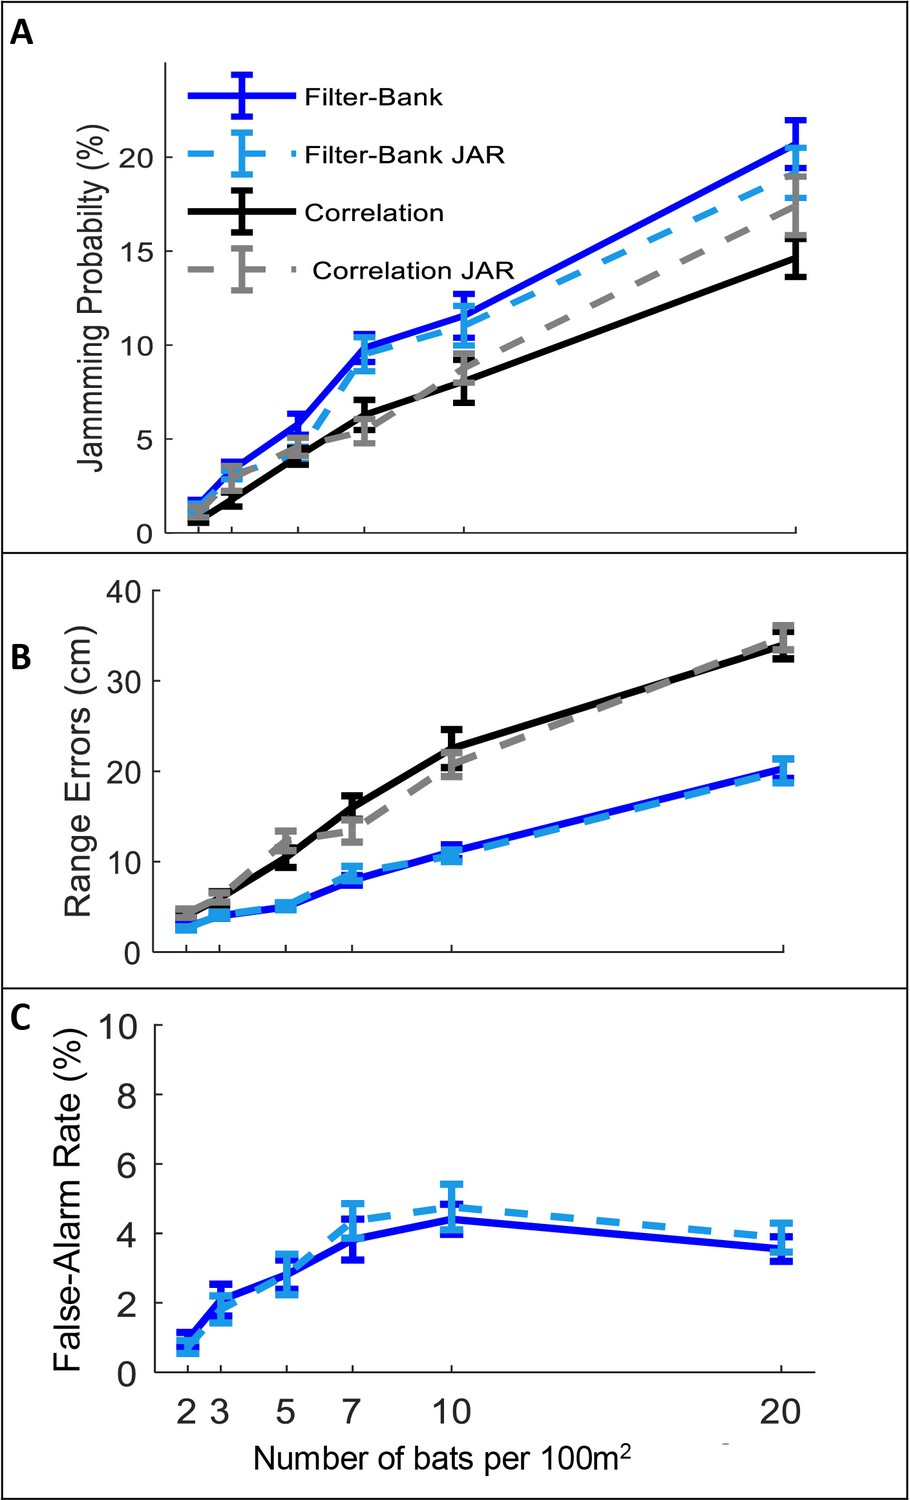
Panels A-C depict three reception criteria as a function of bat density for a correlation-receiver (solid black), and a filter-bank receiver (solid blue) with and without a JAR (dashed gray and dashed turquoise, respectively). The prey density was constant with 20 prey items per 100 m2. (A) Jamming Probability. (B) Range errors. Note that the range-errors are high because they are calculated for all detected prey. The errors for the pursued prey (i.e. the prey items that bats attacked) are substantially lower, since, as the bats approach their targets echoes have higher SNR and the errors decrease. For the correlation receiver, the range errors are calculated as a function of the SNR (see equation 9). For the filter bank receiver, the range errors are derived from the time difference between the estimated time of the detected peak and the arrival time of the desired echo. (C) False-alarm rate, which is measured only for the filter-bank model (Materials and methods). Error-bars depict standard-errors in all panels. Each data point represents 60–80 individual bats in each scenario.
-
Figure 2—source code 1
The source data used to produce Figure 2.
- https://cdn.elifesciences.org/articles/55539/elife-55539-fig2-code1-v2.zip
-
Figure 2—source data 1
The data for Figure 2 and Figure 2—figure supplement 2, correlation receiver.
- https://cdn.elifesciences.org/articles/55539/elife-55539-fig2-data1-v2.txt
-
Figure 2—source data 2
The data for Figure 2; Figure 2—figure supplement 2, filter-bank receiver.
- https://cdn.elifesciences.org/articles/55539/elife-55539-fig2-data2-v2.txt
Figure 2—figure supplement 1
Analysis of correlation gains between signals of search (A), approach (B–C) and buzz (D) phases.
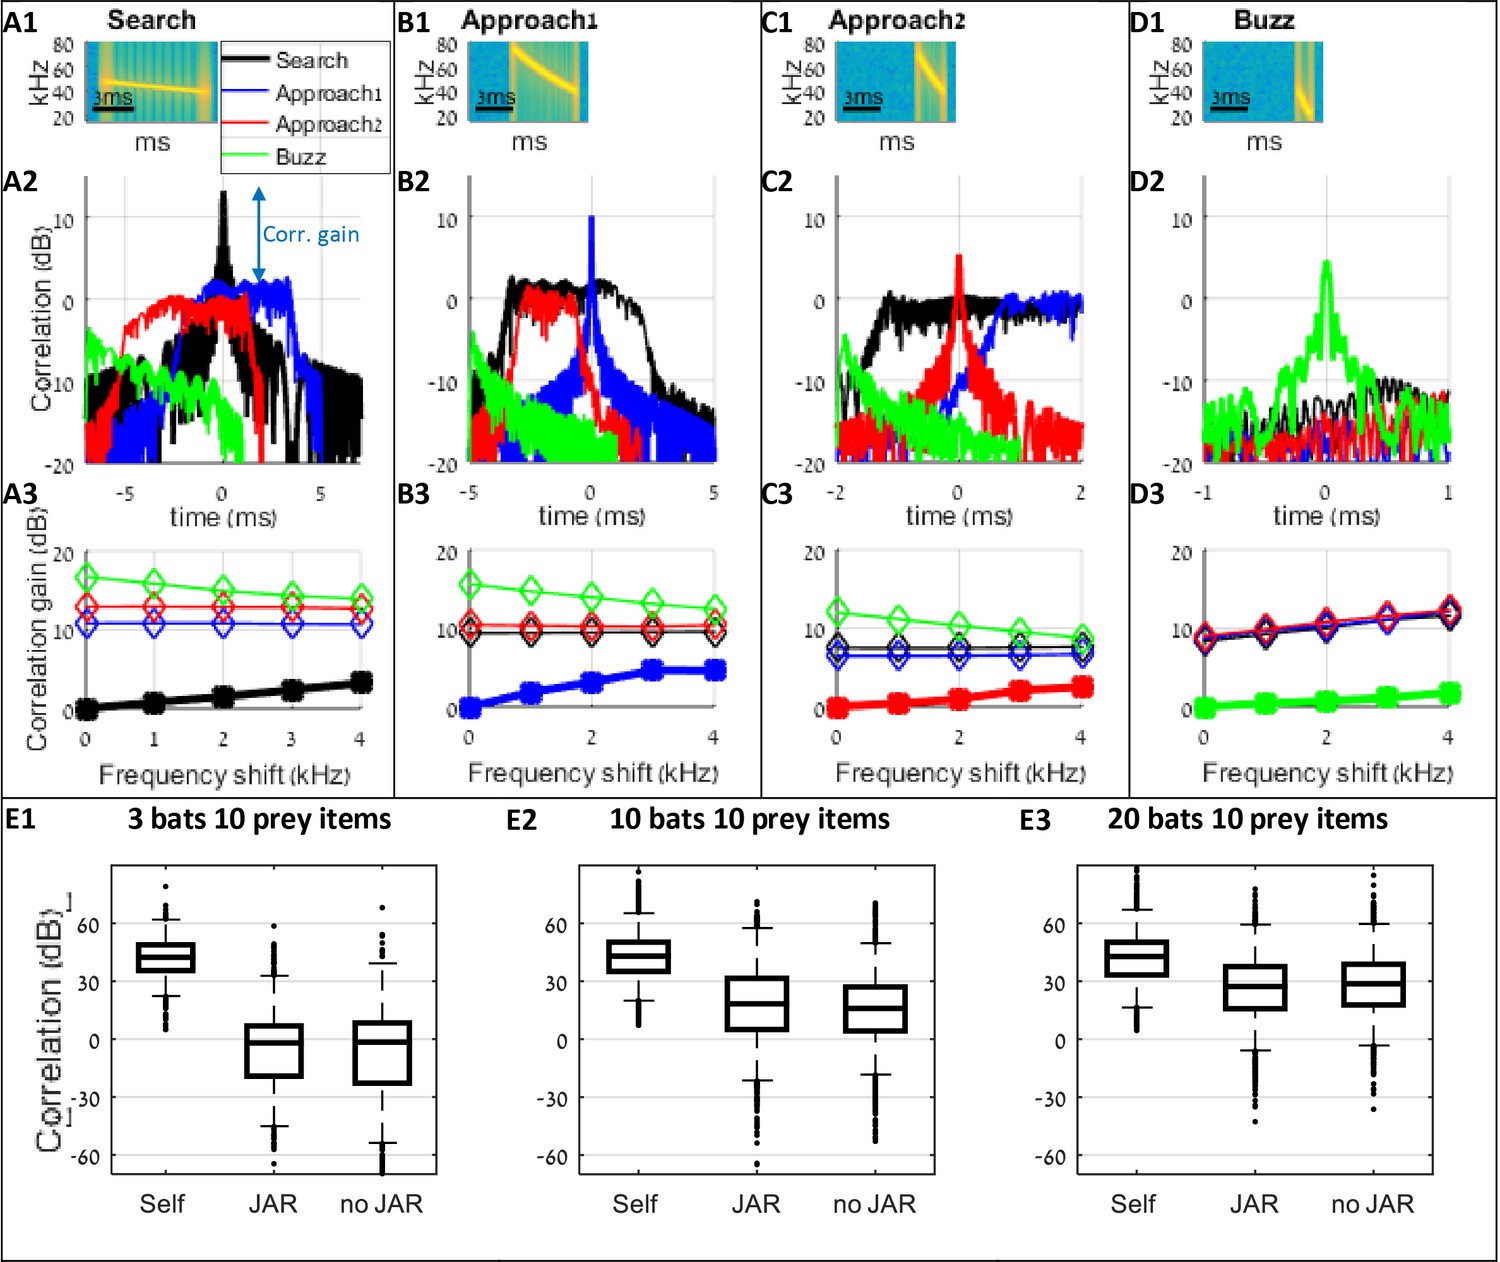
The effect of JAR behavior can be quantified by examining the similarity between the desired prey echoes and the masking signals. Panel A demonstrates the analysis of the search phase: A1 depicts the spectrogram of a transmitted search call with a duration of 7 ms and bandwidth of 8 kHz (see Table 1). A2 illustrates the correlation function between the transmitted call and possible masking signals of bats at different behavioral phases (black - the correlation with another search call, blue and red- the correlation with two different approach calls, and green – the correlation with a buzz call). The correlation gain is defined as the difference between the peak of the auto-correlation and the maximum of the cross-correlation function (blue arrow denotes the correlation gain for the search call relative to the approach1 call). The correlation gain of the transmitted call with a search call is 0 dB by definition. To examine the effect of a JAR response, we gradually shifted the terminal frequencies of the masking signals and calculated the correlation gain for each frequency shift. A3 describes the correlation gain as a function of the frequency shift. The gain improvement due to a JAR response for signals from the same phase (black –'search') is ca. 2 dB per 2 kHz shift. There is no increase in the correlation gain for signals at other phases (red, blue and green). In this analysis, the received level of all signals were equal. Panels B-D depict the same analysis as panel A for additional calls: (B) approach1 ('the first approach call') with a duration of 3 ms and bandwidth of 35 kHz, (C) approach2 (duration: 2 ms, bandwidth: 30 kHz), and (D) buzz calls (duration: 1 ms, bandwidth: 20 kHz). Panels E1-E3 present the results from the performed simulations of the received signals after correlation with the emitted calls across the different stages of the hunt (i.e. search, approach and buzz). Three conditions are shown: 'Self' depicts the correlation between the transmitted call and the desired echoes reflecting off the target. 'JAR' depicts the cross-correlation with the received masking signals (conspecific’s calls and their reflections off prey items, when bats applied spectral JAR. 'No JAR' is the correlation with the masking signals without JAR. Spectral JAR did not significantly reduced the masking signals in comparison to the no-JAR scenarios (permutation test, effect-size = −5.8 dB /−1.8 dB / 0.7 dB, p=0.03*/0.49/0.41, for 3, 10, 20 bats in 100m2, sample-size = 150, 10000 permutations, 100 repetitions). Negative effect-size means that the no-JAR bats had a better correlation than the JAR bats; an asterisk (*) indicates a significant difference (p<0.05). The permutation test was executed as follows: (1) we randomly sampled 150 points from each data-set (i.e., the received level of 'JAR' and 'no JAR'). (2) We defined the sampled effect-size as the difference between the medians of the samples. (3) We randomly distributed the samples between two groups and calculated the effect-size between the two groups. (4) We repeated step 3 for 10,000 times. (5) The p-value of this sample was the proportion of times the effect-size of the permutations was higher than the sampled effect size (in absolute values). (6) We repeated steps 1–5, for 100 times. The p-value is the median of p-values from all the random samples.
-
Figure 2—figure supplement 1—source data 1
The data for Figure 2—figure supplement 1.
- https://cdn.elifesciences.org/articles/55539/elife-55539-fig2-figsupp1-data1-v2.txt
Figure 2—figure supplement 2
Number of prey detection events.
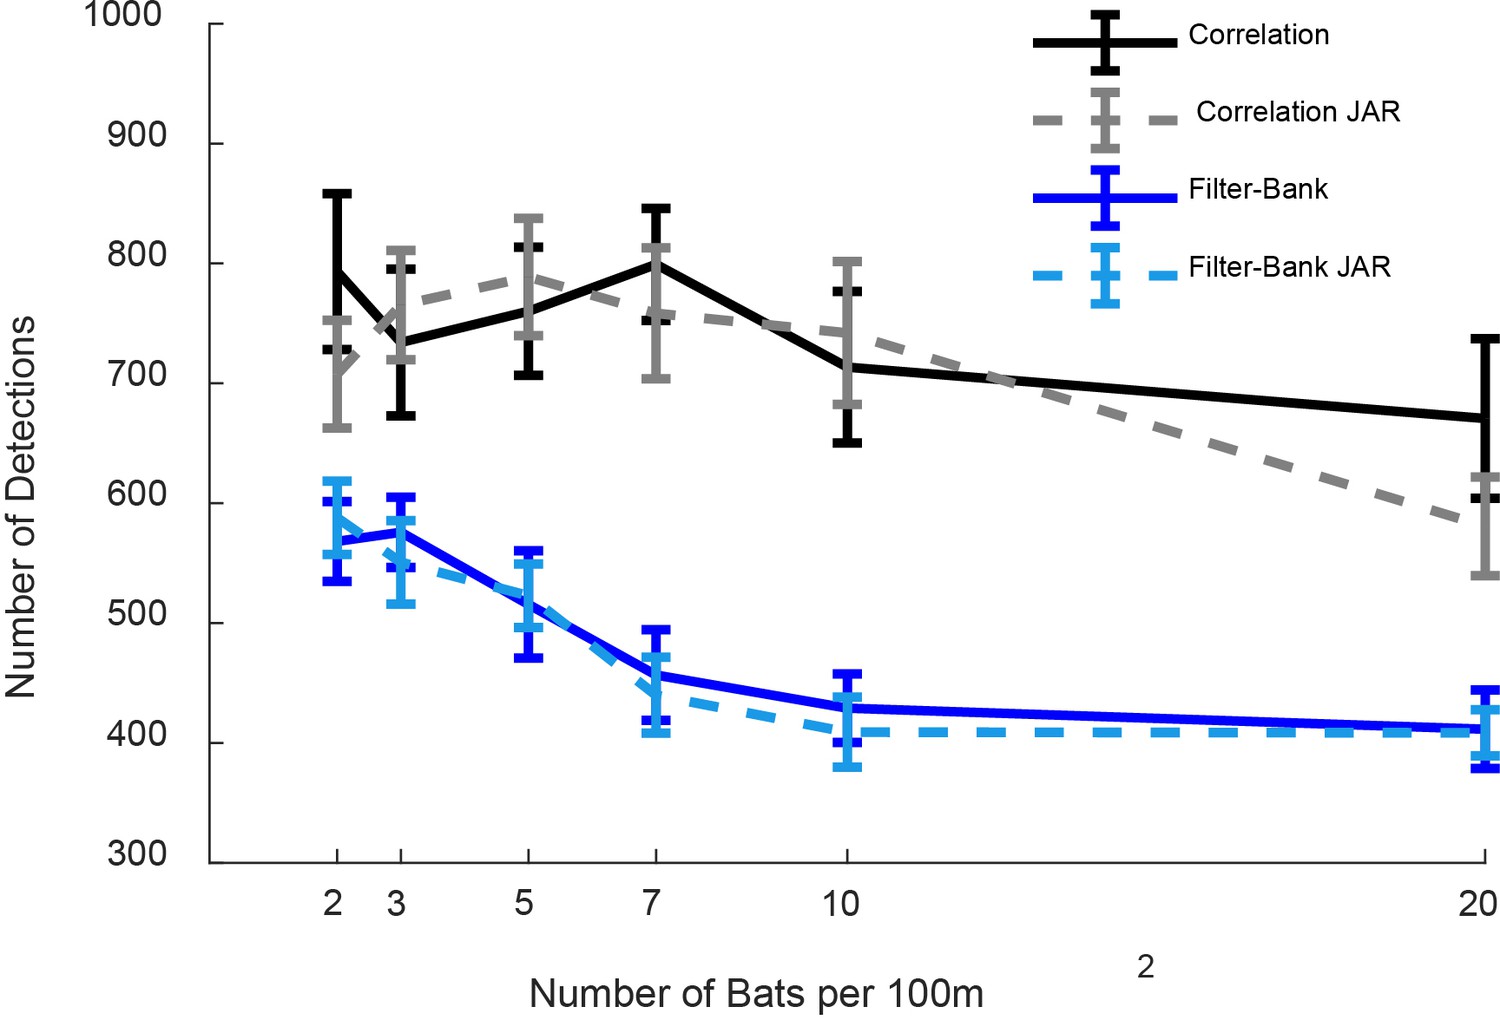
The figure depicts the total number of prey detections per 10 s for the correlation-receiver with no-JAR (solid black), the correlation-receiver with JAR (dashed gray), the filter-bank receiver with no JAR (solid blue) and the filter-bank receiver with JAR (dashed turquoise). A JAR had no significant effect on both correlation-receiver and filter-bank receiver: One Way ANOVA: F1,237 = 0.46, p=0.50; F1,237=0.11, p=0.74, respectively. The number of detections with the correlation-receiver is significantly higher than with a filter-bank receiver: One Way ANOVA: F1,481=205, p<1e-10.
Figure 2—figure supplement 3

Forward and Backward Masking Criteria.
(A) The bat emits an echolocation call and receives an echo from a target (green). The figure illustrates the correlation receiver's output. The reception window (blue) is composed of two periods: the 'forward masking time' that starts 3 ms before the arrival time of the desired echo, and the 'backward masking time' that starts at the arrival time and lasts 1 ms. The 'forward masking threshold' is set to 5 dB below the maximum of the received echo, and the 'backward masking threshold' is equal to that maximum. Any signal (even below the two thresholds) that arrives within the reception window will mask the target’s echo and will reduce its localization accuracy, as a function of the SNR. If a masking signal’s level is above one of the two relevant thresholds, the echo is jammed, and the bat does not detect the target. Panel B illustrates an example of a received echo with three potentially masking signals (red). Masker one is outside the 'reception window' and, therefore, does not affect the detection. Masker two is above the forward masking threshold, thus it jams the echo and the prey is not detected at all. Masker three is received within the reception window but is below the backward threshold, and, consequently, the echo is detected but the localization errors increase, according to the SNR (Equation 9, Equation 10).
Figure 2—figure supplement 4
Filter-Bank Receiver.
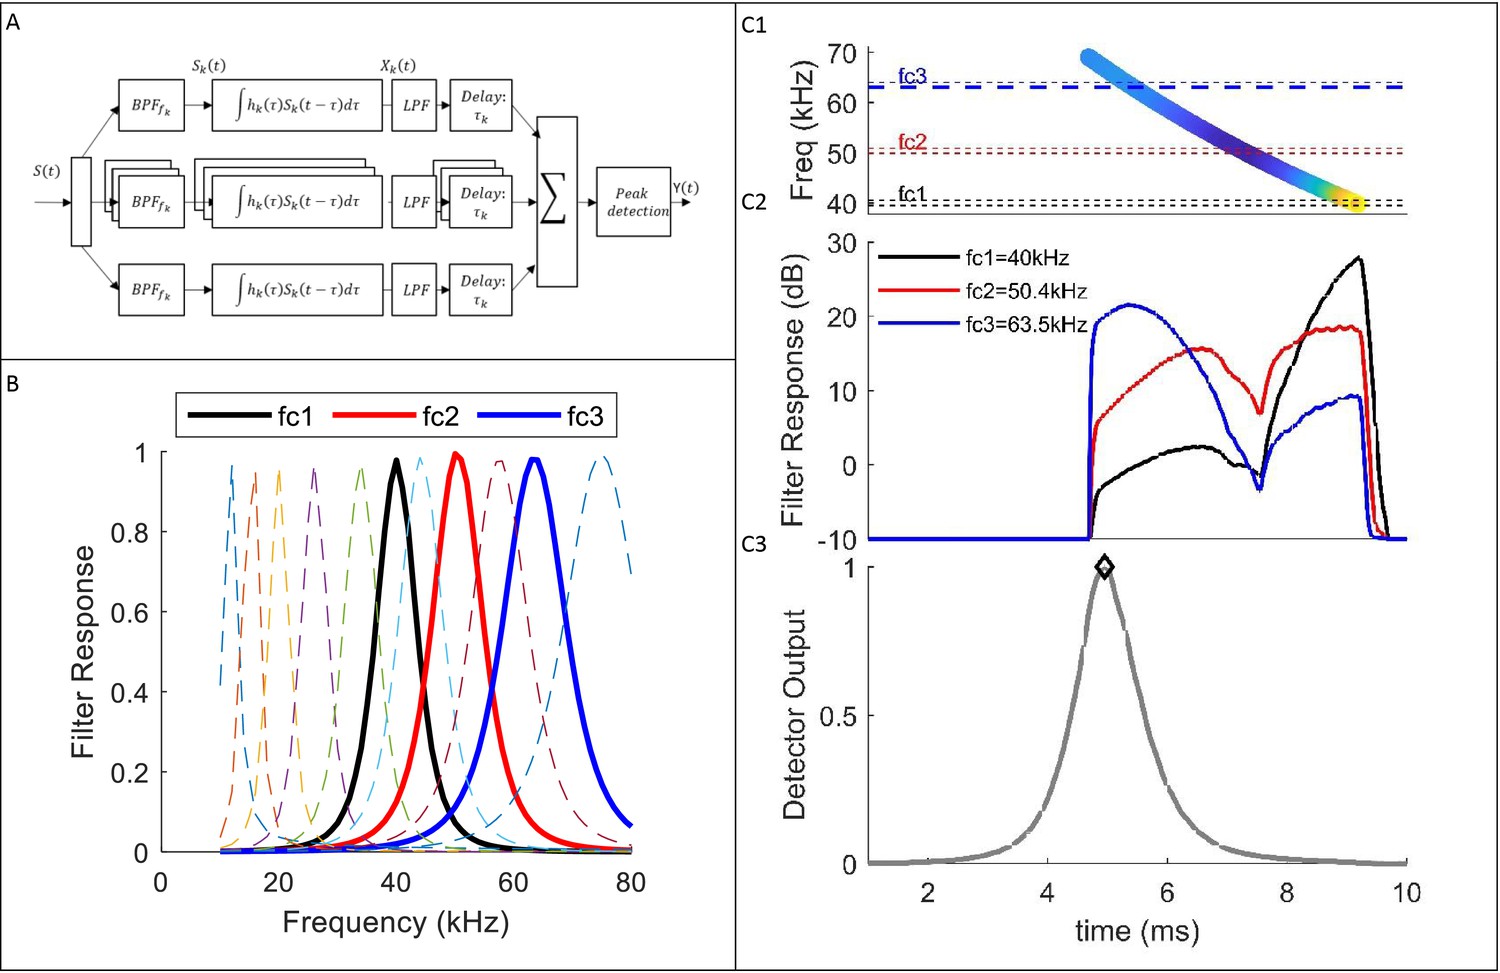
(A) Receiver Scheme: the received signal, s(t), is split to n- channels of gammatone filters. In each channel, the signal is filtered by a band-pass filter, with center frequency fck, and input response hk. The signal passes through a low-pass filter (‘envelope detector’) that removes phase information. Then, each signal is shifted in time (τk) to compensate for the chirp slope (i.e. τk is equal to the time difference between the start of the transmitted chirp, and the response in each channel). The receiver integrates the channels and detects the local maxima (i.e. peaks). Then, it estimates the intensities and delays of the detected peaks’ that cross the detection threshold (see text). Panel B depicts the frequency responses of several gammatone filters (11 out of 80). Panel C illustrates the signals in several points at the process: (C1) Spectrogram of a reflected echo from prey (S(t)); (C2) The response of three gammatone filters (fc1,fc2,fc3), before the time shift; (C3) The receiver’s output (Y(t)) after the integration and peak-detection processes.
Figure 2—figure supplement 5
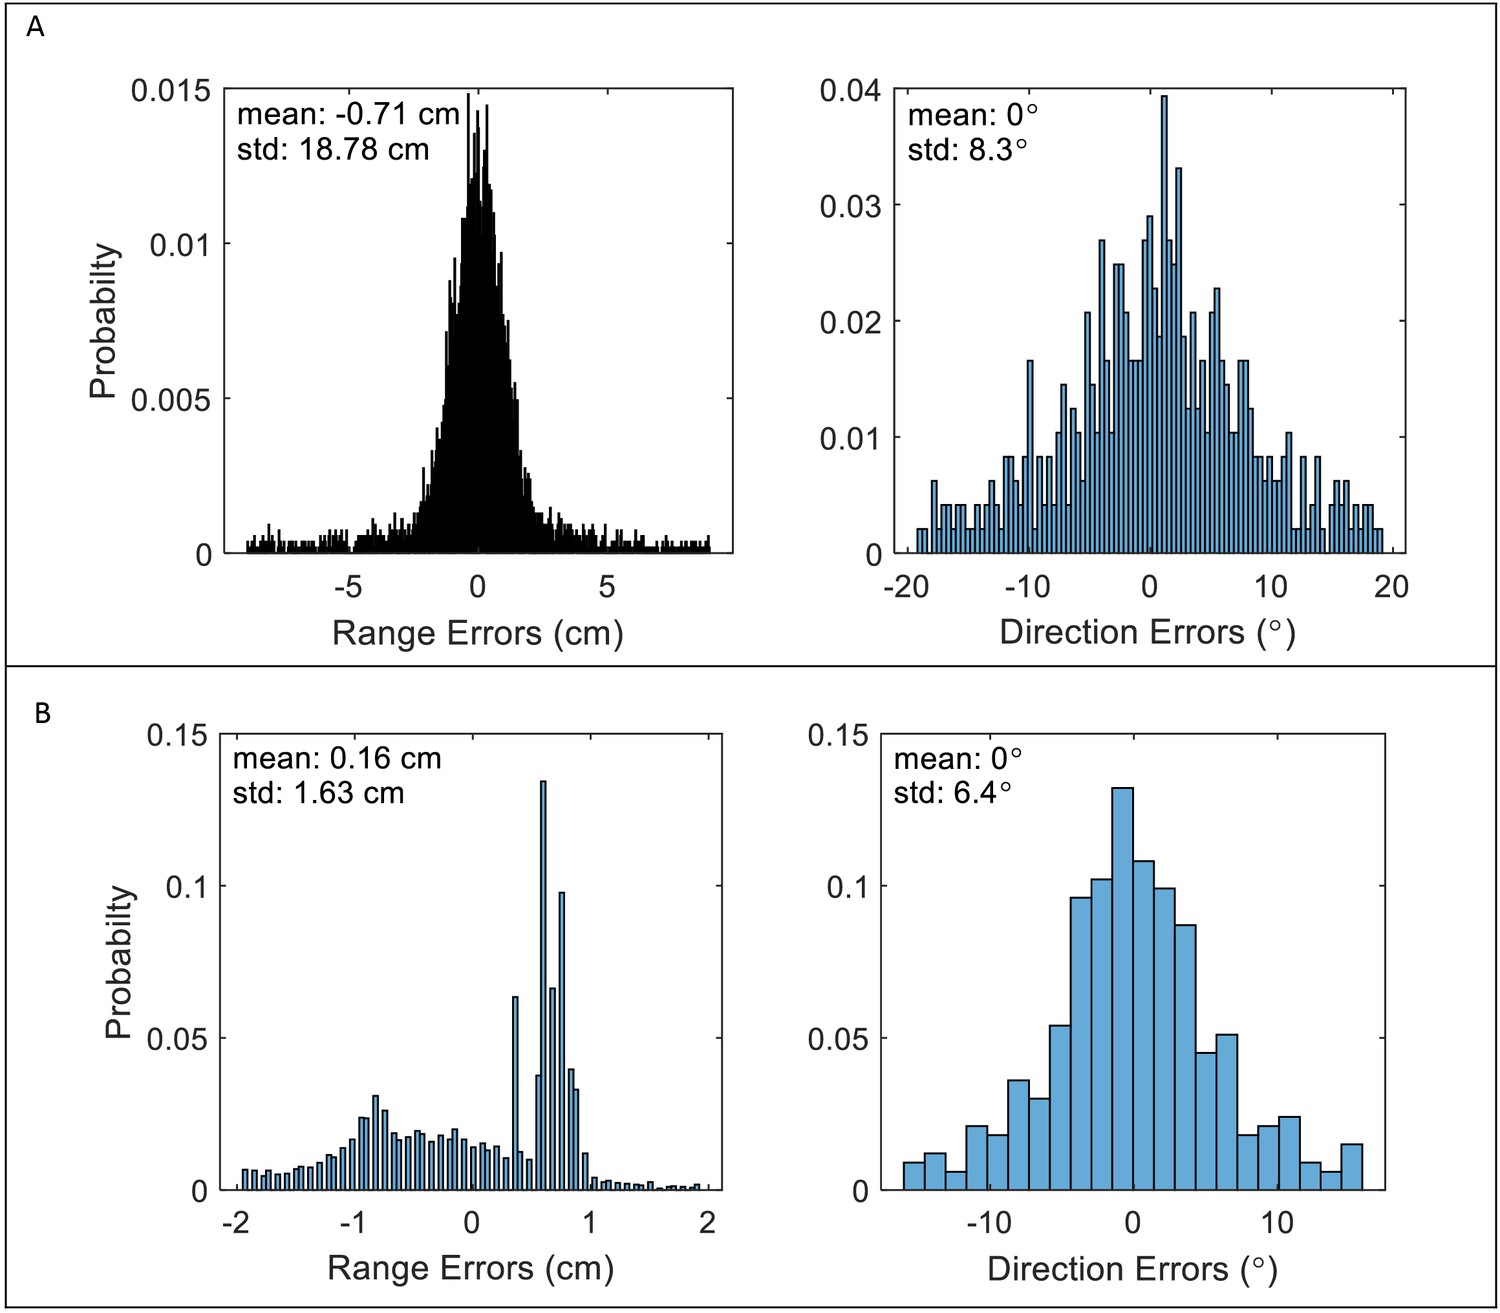
Localization errors of the Correlation and Filter-Bank receivers.
Errors are defined as the difference between the estimated location and the actual location (range and direction) of all detected prey. (A) Correlation-receiver: the range errors (left panel) and direction errors (right panel) are calculated according to Equation 9: and Equation 10, respectively. Detections with SNR of 10 dB or higher (detections of nearby prey) have standard errors of ca. 1 cm and 2o for range and direction estimations, respectively. Further objects have lower SNR’s, and, hence, higher estimation errors. The averages of the absolute errors for all detections are 10.4 cm and 9o. (B) Filter-bank receiver: the range errors (left panel) are derived from the timing estimations of the peaks of the detected signals (see Materials and methods). Direction errors right panel) are calculated by Equation 10, as for the correlation-receiver. The average of the absolute errors is 1.1 cm, and 5.20, respectively. The error is lower in comparison to the correlation-receiver because the filter-bank receiver only detects higher SNR objects. Apparently, this difference has little effect on the hunting rate. The figure depicts errors for scenarios with 5 bats and 10 prey items.
Figure 2—figure supplement 6
Implementation of a half-wave rectifier a with 10 kHz LPF (iir filter of order 3 [Sanderson et al., 2003]) in the Filter-Bank receiver model did not influence our results: (A) Hunting Performance, (B) Jamming Probability, (C) Ranging Errors, (D) False Alarms.
We tested the performance of a Filter-Bank model including half-wave rectifier and low-pass filtering without JAR (solid dark red) and with JAR (dashed orange), and compared them with our previous results for the Filter-Bank with an envelope detector (solid blue and dashed turquoise). See Figure 2, Figure 3. Note that we chose a relatively high cutoff frequency and a moderate slope for this model in order to distinguish it from our previous results. Again, in all scenarios with the half-wave rectifier model, the jamming avoidance response did not decrease spectral masking and did not improve performance according to any of the four criteria. One-way ANOVA statistics for the half-wave rectifier filter-bank: hunting performance: F1, 723 = 2.76, p=0.10; jamming-probability: F1,723 = 0.1, p=0.74; ranging errors: F1,723 = 0.03, p=0.86; false-alarm: F1,723 = 1.07, p=0.3.
-
Figure 2—figure supplement 6—source data 1
The data for Figure 2—figure supplement 6, correlation receiver.
- https://cdn.elifesciences.org/articles/55539/elife-55539-fig2-figsupp6-data1-v2.txt
-
Figure 2—figure supplement 6—source data 2
The data for Figure 2—figure supplement 6, filter-bank receiver.
- https://cdn.elifesciences.org/articles/55539/elife-55539-fig2-figsupp6-data2-v2.txt
Figure 3 with 3 supplements
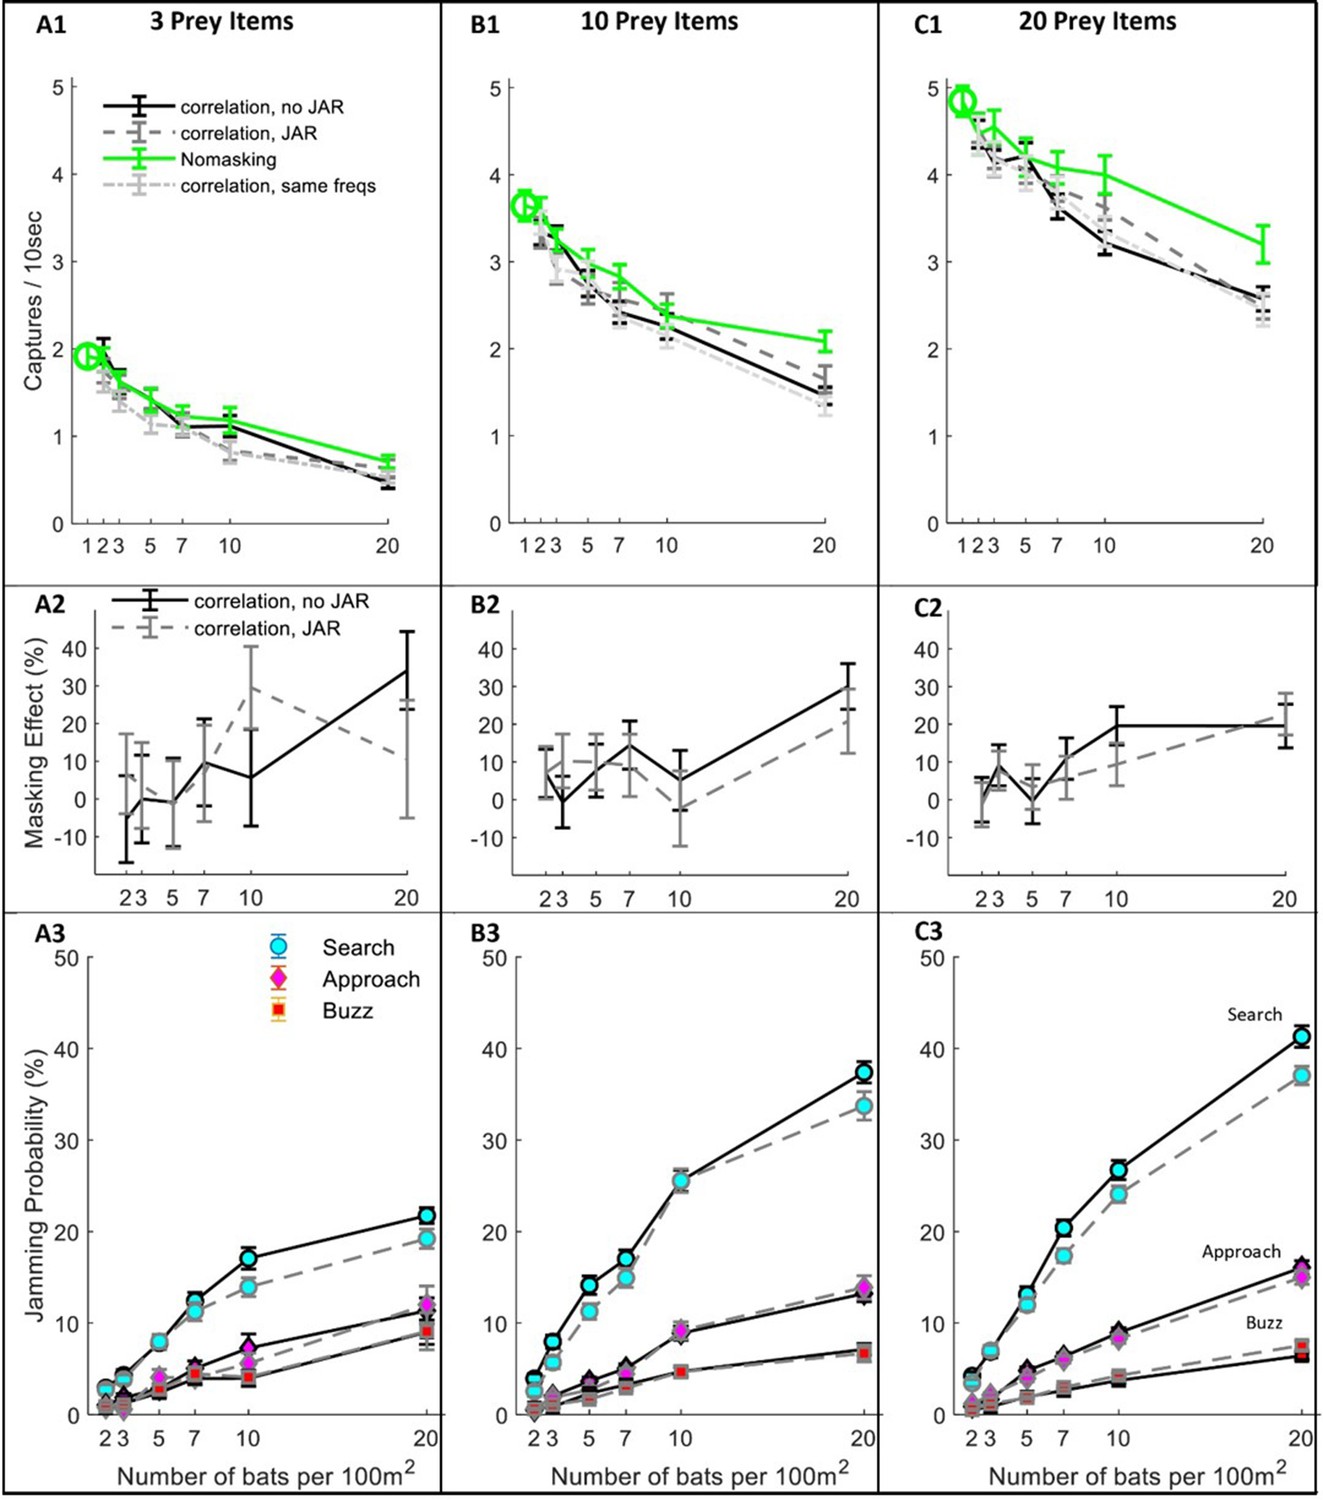
Hunting Performance for different receiving models.
The hunting success rate (A1–C1), masking effect (A2–C2) and jamming probability (A3–C3) are presented for three prey densities per 100 m2: three prey items, 10 prey items, 20 prey items. Panels A1-C1 depict the performance as a function of bat density; a green circle shows the performance of a single bat. Line colors and styles depict the performance of different receiver models: solid green - no-masking; solid black - correlation-detector with random frequency variability and without JAR; dashed dark gray - correlation-detector and random frequency with JAR response; dash-dotted light gray - correlation-detector without frequency variability. The regression slopes of no masking condition (green lines) are (mean ± SD): 0.06 ± 0.0065 0.08 ± 0.0084, 0.079 ± 0.013 captures per bat per ten seconds, at the prey densities above, respectively (ANCOVA: F1, 564 = 84.3, p<0.0001; F1, 679 = 90.4, p<0.0001; F1, 431 = 37.8, p<0.0001). There was no significant difference in performance when applying or not applying spectral JAR - see main text and compare gray and black lines. Panels A2-C2 show the masking-effect on hunting, that is the relative decrease in hunting relative to the 'no-masking' condition. Panels A3-C3 present the probability of jamming during the behavioral phases: search (turquoise marker), approach (magenta marker) and buzz (red markers). Jamming probabilities during the search phase were significantly lower by at most 4.5% when using a JAR (ANCOVA, F1, 2422 = 23.42, p<0.0001). However, in the approach and buzz phases (which are more critical for foraging), there was no significant difference between the two models (ANCOVA, F1,2388 = 0.11, p=0.74; F1, 2347 = 0.11, p=0.73, respectively). Error bars show means and standard-errors for 70–120 simulated bats in each data-point.
-
Figure 3—source code 1
the source data used to produce Figure 3, panels A1-C1.
- https://cdn.elifesciences.org/articles/55539/elife-55539-fig3-code1-v2.zip
-
Figure 3—source code 2
the source data used to produce Figure 3, panels A2-C2.
- https://cdn.elifesciences.org/articles/55539/elife-55539-fig3-code2-v2.zip
-
Figure 3—source code 3
the source data used to produce Figure 3, panels A2-C2.
- https://cdn.elifesciences.org/articles/55539/elife-55539-fig3-code3-v2.zip
-
Figure 3—source data 1
The data for Figure 3, panels A1-A3.
- https://cdn.elifesciences.org/articles/55539/elife-55539-fig3-data1-v2.txt
-
Figure 3—source data 2
The data for Figure 3, panels B1-B3.
- https://cdn.elifesciences.org/articles/55539/elife-55539-fig3-data2-v2.txt
-
Figure 3—source data 3
The data for Figure 3, panels C1-C3.
- https://cdn.elifesciences.org/articles/55539/elife-55539-fig3-data3-v2.txt
Figure 3—figure supplement 1
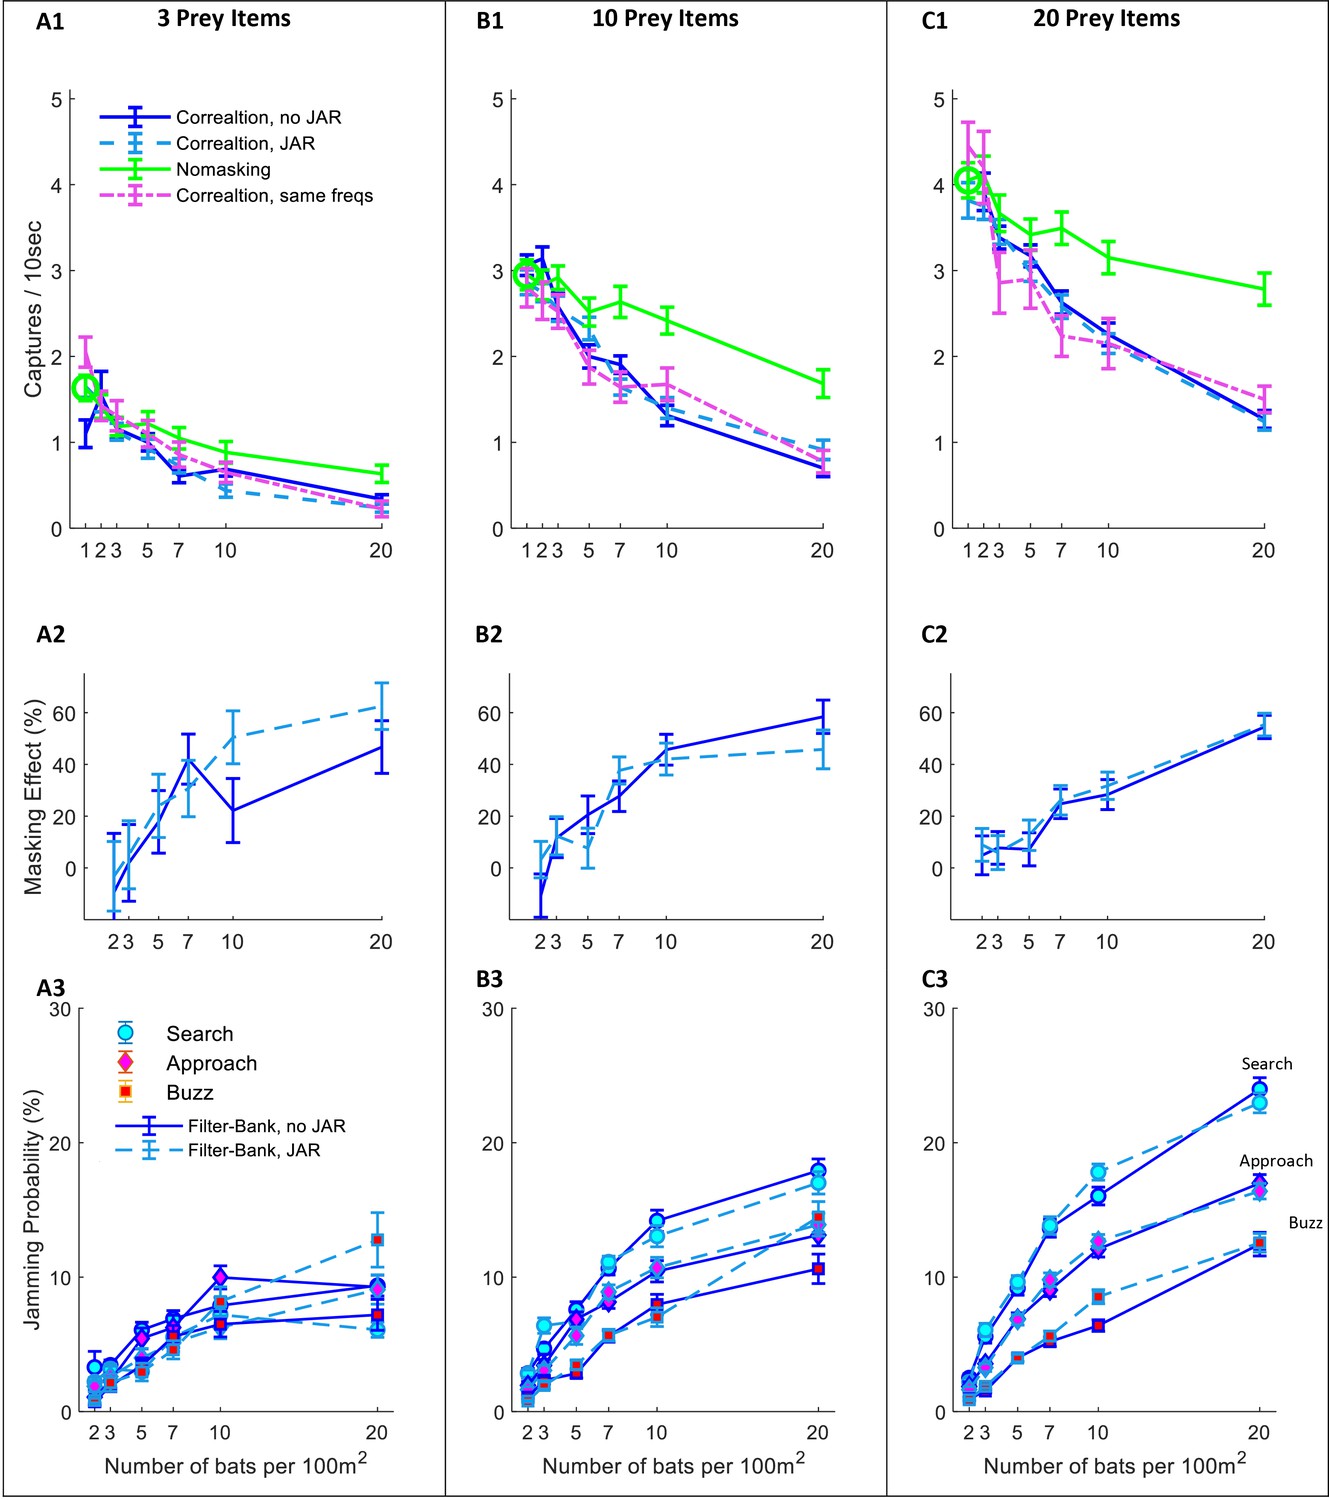
Hunting performance for the filter-bank receiver.
The hunting success rate is presented for three prey densities per 100 m2: (A) three prey items; (B) 10 prey items; (C) 20 prey items. Panels A1-C1 depict the performance as a function of bat density; a green circle shows the performance of a single bat. Line colors and styles depict the performance of different receiver models: green- no-masking; solid blue – filter-bank receiver with random call variability; dashed turquoise - filter-bank receiver with JAR response; dash-dotted magenta– filter-bank receiver without call variability. In the no-masking condition (green lines) there is a significant degradation in performance as the bat’s density rises from 1, and it reaches to maxima of ca.: 60%, 43%, 32% where, for 20 bats and 3, 10, 20 prey items per 100 m2, respectively. There was no significant difference in performance when applying or not applying spectral JAR- compare turquoise and blue lines (One -way ANOVA: F2,1007=0.467, p=0.529; F2,1355=0.651, p=0.42; F2,1529=0.207, p=0.645. Panels A2-C2 show the masking-effect on hunting, that is the relative decrease in hunting relative to the 'no-masking' condition. The masking effect for 10 and 20 bats per 100 m2 was between 40%, and 60%, respectively. (A3-C3) The probability of jamming at different behavioral phases: search (turquoise marker), approach (magenta marker) and buzz (red markers). For prey densities of 10 and 20 prey items per 100 m2, there was no significant difference between JAR and no JAR scenarios, in all flight-phases (One-way ANOVA). In scenarios including low prey density (i.e., three prey items per 100 m2), the probability of jamming was low, with a maximum of ca. 10%.
-
Figure 3—figure supplement 1—source data 1
The data for Figure 3—figure supplement 1, panels A1-A3.
- https://cdn.elifesciences.org/articles/55539/elife-55539-fig3-figsupp1-data1-v2.txt
-
Figure 3—figure supplement 1—source data 2
The data for Figure 3—figure supplement 1, panels B1-B3.
- https://cdn.elifesciences.org/articles/55539/elife-55539-fig3-figsupp1-data2-v2.txt
-
Figure 3—figure supplement 1—source data 3
The data for Figure 3—figure supplement 1, panels C1-C3.
- https://cdn.elifesciences.org/articles/55539/elife-55539-fig3-figsupp1-data3-v2.txt
Figure 3—figure supplement 2
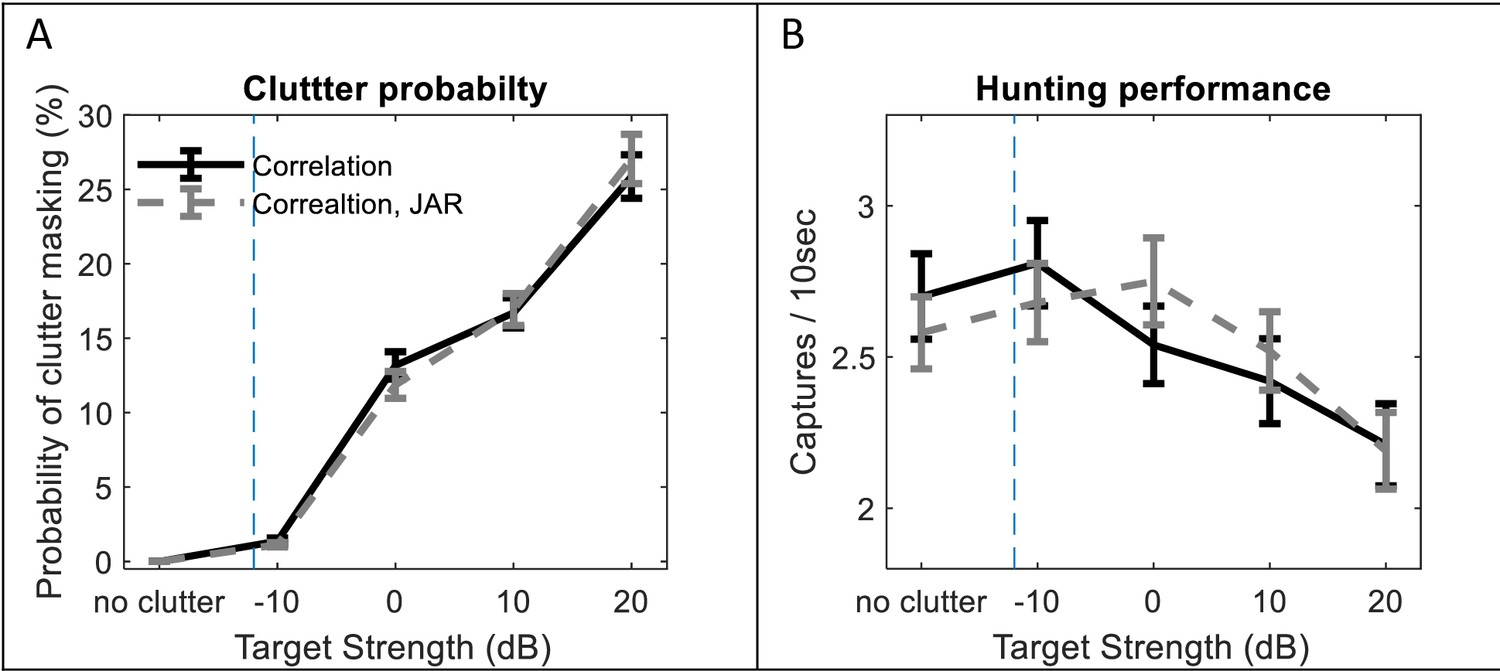
The influence of background clutter echoes.
We analyzed the effect of the echoes reflected off the borders of the arena (10 × 10 m) on (A) the detection of prey items and (B) the hunting performance. Different target strengths (the x-axis) can represent the size, shape, and orientation of the background reflectors. For example, if these are round leaves, this range of targets strengths is equivalent to a radii range between 3 cm and 16 cm (at a frequency of 40 kHz). The data-points located left to the dashed lines represent trials without the effect of background clutter. (A) The clutter probability is the probability that the echoes which are reflected off the borders are received by the bat with higher intensities than the echoes reflected off the prey items at the same time (see Materials and methods). The probability increases as the clutter echoes raise. There is no significant difference between the JAR and no-JAR trials (ANCOVA, F1, 997 = 0.002, p=0.96). (B) Hunting performance decreases as a function of clutter gain, without any significant effect of JAR (ANCOVA, F1, 997 = 0.009, p=0.92). 5 Bats and 10 prey items are simulated in each trial. Each data-point represents 100 bats, error bars indicate standard errors.
-
Figure 3—figure supplement 2—source data 1
The influence of background clutter echoes.
- https://cdn.elifesciences.org/articles/55539/elife-55539-fig3-figsupp2-data1-v2.txt
Figure 3—figure supplement 3

The causes of hunting failures.
(A–D) Pie charts display the proportions of successful and unsuccessful attacks indicating different failure reasons for groups of 1 to 20 bats, with masking ('correlation-detector') and without masking. Each chart is divided into the following categories: (i) captures - maneuvers that ended with a successful capture; (ii) misses - maneuvers in which the bats failed to capture the target because of insufficient maneuvering and/or masking; (iii) avoid obs (obstacles) – flight paths that came too close to the borders of the arena and the bat seized hunting; (iv) avoid cons (conspecifics) – hunting maneuvers that were ended to avoid collision with another bat; (v) lost to cons –hunting attempts that were terminated because the prey was caught by a conspecific. Each panel includes 100 simulated bats. The absolute rates for each category are presented on the left of each pie chart. In all bat densities the proportion of missing the prey increased when adding sensory masking (One-way ANOVA: effect-size = 3%, F1, 198 = 3.21, p=0.075; effect-size = 11%, F1, 198 = 20.7, p*<0.0001; effect-size = 23%, F1, 198 = 68.8, p*<0.0001, for 5, 10 and 20 bats per 100m2).
Figure 4 with 1 supplement
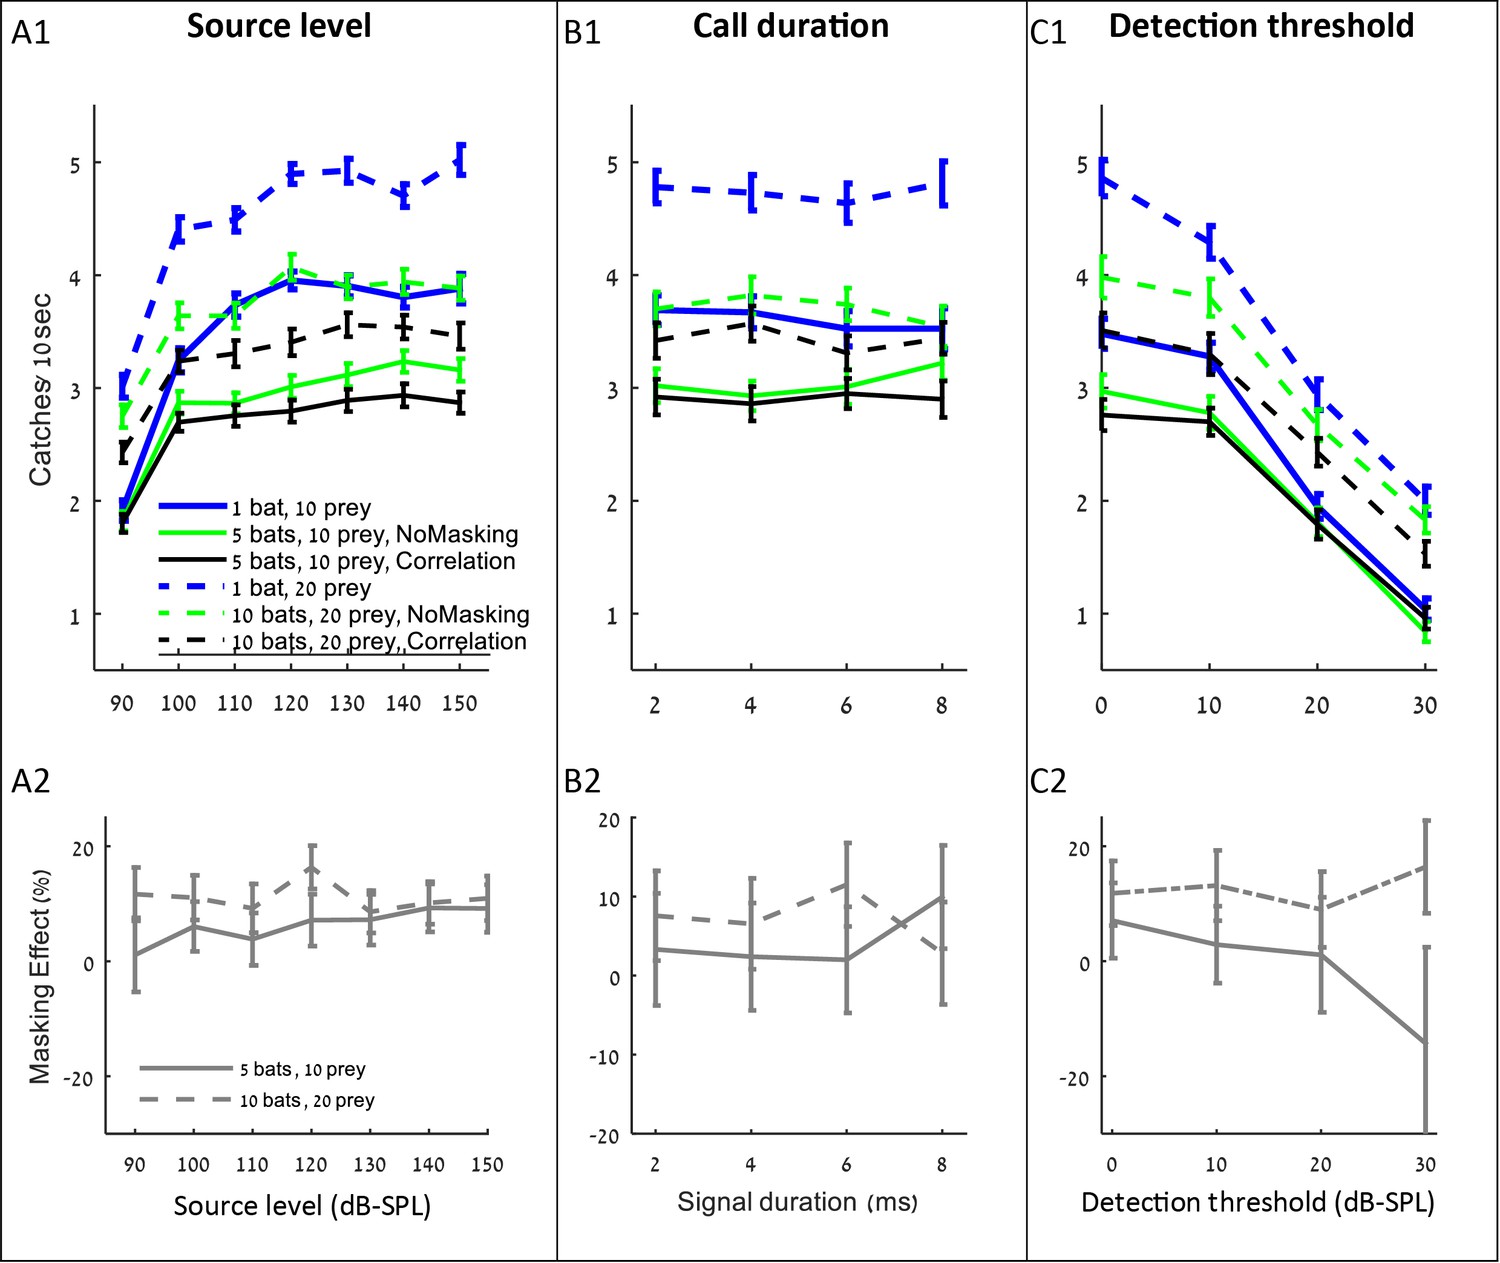
The influence of source level, call duration and detection threshold on the performance (A1–C1), and masking effect (A2–C2).
The panels include the following conditions: the correlation-detector with frequencies normally distributed (black), no-masking (green), and one bat (blue). Solid lines indicate a density of 10 prey items while dashed lines represent scenarios with 20 prey.
-
Figure 4—source code 1
The source data used to produce Figure 3, panel A1.
- https://cdn.elifesciences.org/articles/55539/elife-55539-fig4-code1-v2.zip
-
Figure 4—source code 2
The source data used to produce Figure 3, panel B1.
- https://cdn.elifesciences.org/articles/55539/elife-55539-fig4-code2-v2.zip
-
Figure 4—source code 3
The source data used to produce Figure 3, panel C1.
- https://cdn.elifesciences.org/articles/55539/elife-55539-fig4-code3-v2.zip
-
Figure 4—source data 1
The data for Figure 4 panels A1-A2.
- https://cdn.elifesciences.org/articles/55539/elife-55539-fig4-data1-v2.txt
-
Figure 4—source data 2
The data for Figure 4 panels B1-B2.
- https://cdn.elifesciences.org/articles/55539/elife-55539-fig4-data2-v2.txt
-
Figure 4—source data 3
The data for Figure 4 panels C1-C2.
- https://cdn.elifesciences.org/articles/55539/elife-55539-fig4-data3-v2.txt
Figure 4—figure supplement 1
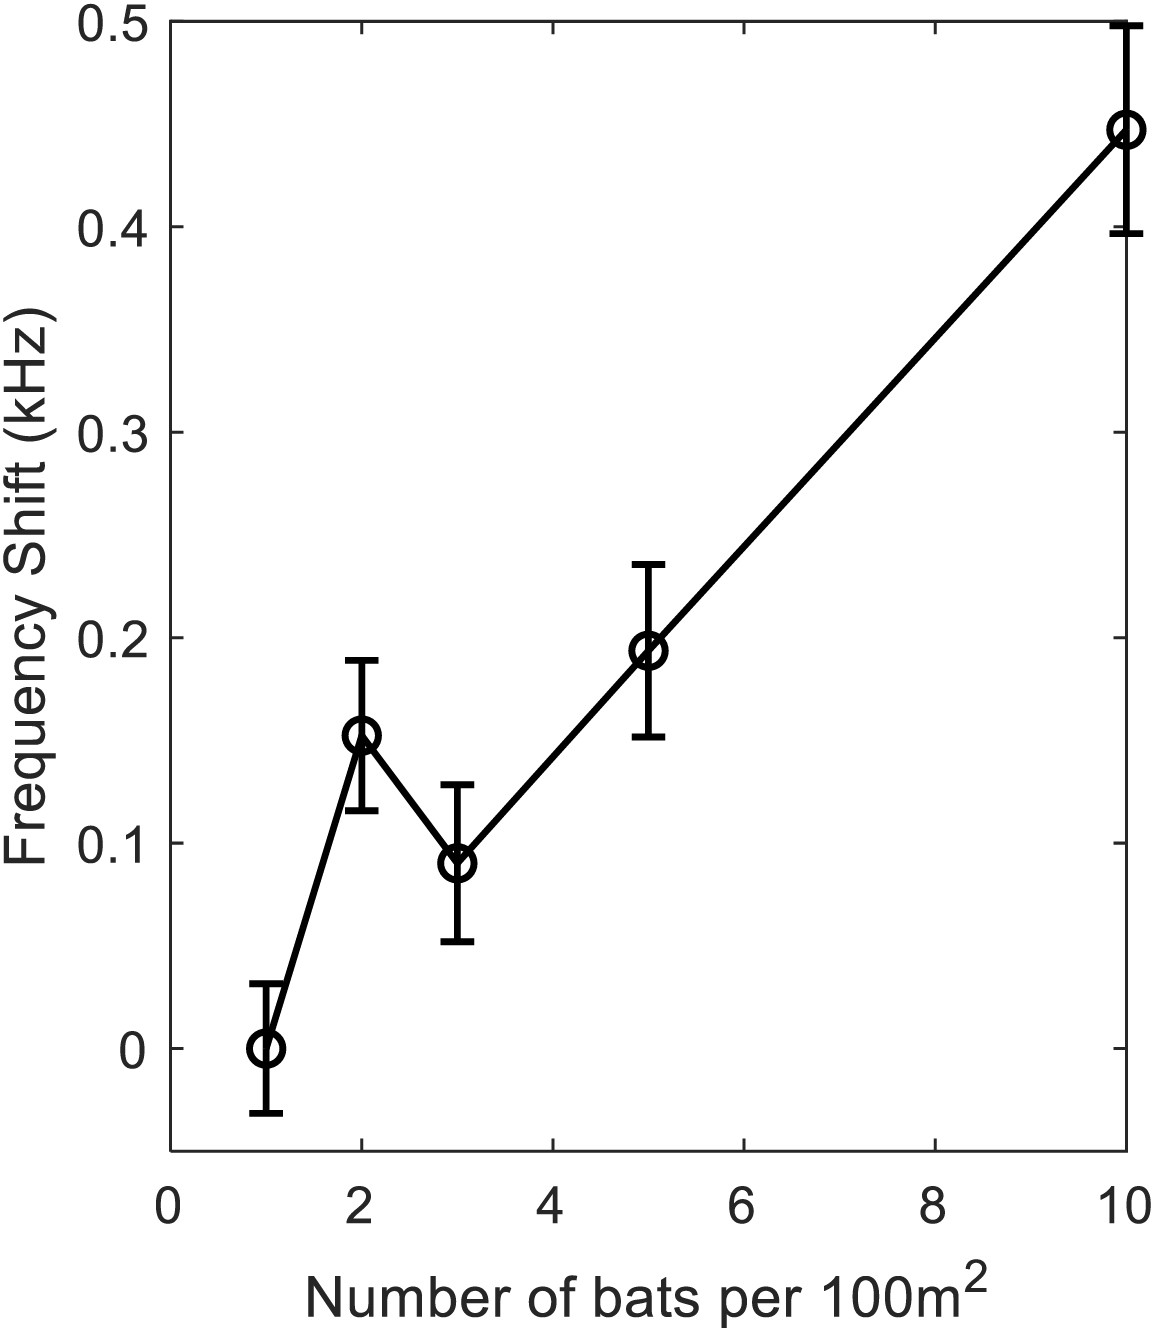
Frequency- shift with no JAR.
The shift in the average frequency of the emitted calls, as a function of bat density. All simulations were performed with the correlation-detector, with no JAR. The bats react to conspecifics flying nearby as objects and modify their echolocation behavior according to the distance between them. The results clearly demonstrate a significant rise in frequencies as the density increases (Regression test, F1,993=64.4, p<0.0001), there is also a significant rise in frequency when increasing the bat density from 1 to 2 bats per 100 m2 (t-test: t = 3.15, p=0.0017, DF = 389). All trials with one prey item in the arena. The graph indicates mean and standard errors.
-
Figure 4—figure supplement 1—source data 1
The data for Figure 4—figure supplement 1.
- https://cdn.elifesciences.org/articles/55539/elife-55539-fig4-figsupp1-data1-v2.txt
Author response image 1
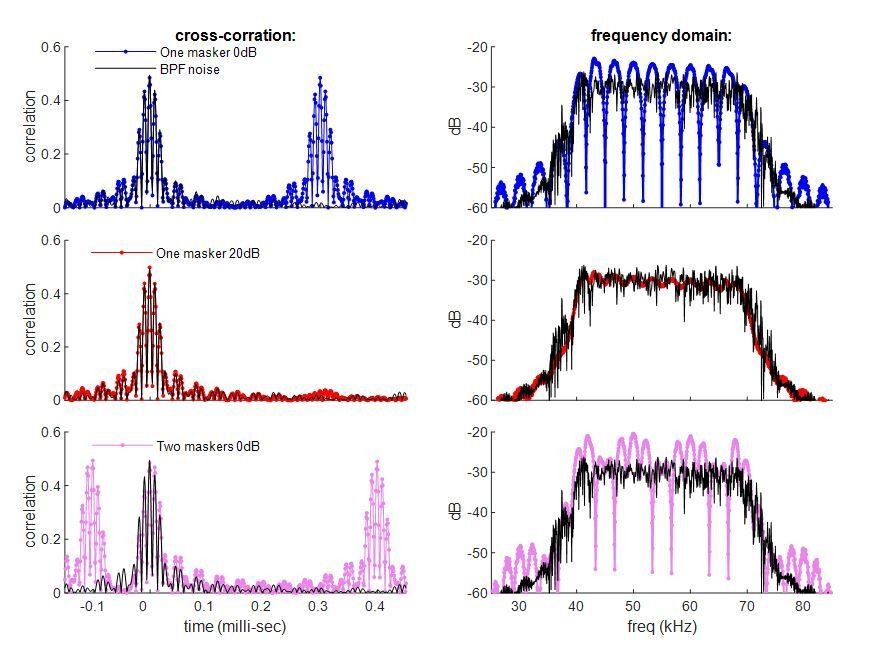
The Spectral Interference between a desired echo and masking signals with various latencies and SNRs.
Left panels depict the cross-correlation between the transmitted call (a linear FM chirp call with a duration of 7milliseconds, 40-70kHz) and the received signal (the desired echo plus the masker). Reference masker signal (black line) in all panels is a Band Pass Filtered noise with the same frequency range as the call (i.e. 40-70kHz). Top panel: One masker with delay 0.3 milliseconds and SNR 0dB. Medium panel: One masker with a delay of 0.3 milliseconds and an SNR of 20dB. Bottom panel: Two maskers with delays of -0.1 (before the desired echo) and 0.4 milliseconds and an SNR of 0dB. Note, the various spectral interferences do not shift the correlation peak of the desired echo (always at time 0) and they do not change the shape of the cross-correlation function.
Videos
Video 1
One bat and one prey item.
The video presents one simulated bat (thick blue line) flying in the arena with one prey item (thin dot). The bat starts flying randomly, and whenever it detects the prey it heads towards it and tries to capture it. After each successful capture, indicated by a cross in the video, a new prey item reappear in a random place in the arena.
Video 2
Three bats with 10 prey items.
The upper panel displays three simulated bats (thick lines) flying simultaneously with 10 prey items (colored dots). Thin lines on top of the bats’ trajectories indicate the behavioral phase: ‘green’ for approach, ‘pink’ for buzz, and ‘cyan’ for an obstacle-avoidance maneuver (avoiding the arena-borders or other bats). Red diamonds indicate locations and timings of the jamming events (i.e. whenever the desired echo is completely blocked by a masker). The lower panel shows the level (dB-SPL) of the following signals as a function of time: the transmitted calls (black), the echoes reflecting off the prey items (green), and the received masking signals (red). The illustrated signals are acquired from the trajectory of the bat that is depicted by the dark blue line, starting at the upper-left position.
Tables
Key resources table
| Reagent type (species) or resource | Designation | Source or reference | Identifiers | Additional information |
|---|---|---|---|---|
| Software, algorithm | MATLAB | MATLAB R2018b. MathWorks | ||
| Software, algorithm | Model; Simulation | This paper | Newly created using MATALB. See Materials and methods. | |
| Software, algorithm | JMP14 | JMP14 Statistical Discovery. From SAS |
Table 1
the echolocation parameters in the different hunting phases.
Once prey is detected, the hunting phase is defined by the distance to the target. Based on Table 1. During each behavioral phase, the IPI, call duration, bandwidth, and level (in dB) are reduced linearly between the start and end values (Table 1).
| Flight phase | Search | Approach | Buzz | |||
|---|---|---|---|---|---|---|
| Parameter | Start | End | Terminal 1 start | Terminal 1 end | Terminal 2 | |
| Inter Pulse Interval [ms] | 100 | 70 | 35 | 18 | 6 | 5 |
| Call Duration [ms] | 7 | 5 | 2 | 2 | 1 | 0.5 |
| Terminal Frequency [kHz] | 39 | 39 | 39 | 39 | 39 | 19 |
| Chirp Bandwidth [kHz] | 8 | 35 | 30 | 30 | 20 | 20 |
| Source Level [dB-SPL] | 110 | 110 | 90 | 90 | 80 | 80 |
| Distance to target [m] | >1.2 | 1.2 | 0.4 | 0.4 | 0.2 | <0.2 |
Additional files
-
Source code 1
The source code and MATLAB function requirt to run the simulation. See readme Bat Simulation files for more details.
- https://cdn.elifesciences.org/articles/55539/elife-55539-code1-v2.rar
-
Source data 1
‘readme Bat Simulation’explains how to execute the attached GUI (Graphical User Interface) and MATALB code which generate the sensorimotor predator-prey simulation.
- https://cdn.elifesciences.org/articles/55539/elife-55539-data1-v2.pdf
-
Source data 2
Summary table of all the figures and the relevant data-tables.
- https://cdn.elifesciences.org/articles/55539/elife-55539-data2-v2.xlsx
-
Transparent reporting form
- https://cdn.elifesciences.org/articles/55539/elife-55539-transrepform-v2.docx
Download links
A two-part list of links to download the article, or parts of the article, in various formats.
Downloads (link to download the article as PDF)
Open citations (links to open the citations from this article in various online reference manager services)
Cite this article (links to download the citations from this article in formats compatible with various reference manager tools)
A sensorimotor model shows why a spectral jamming avoidance response does not help bats deal with jamming
eLife 9:e55539.
https://doi.org/10.7554/eLife.55539


