CSF1R blockade induces macrophage ablation and results in mouse choroidal vascular atrophy and RPE disorganization
- Section on Neuron-Glia Interactions in Retinal Disease, National Eye Institute, National Institutes of Health, United States
- Section on Histopathology, National Eye Institute, National Institutes of Health, United States
- Section on Ocular and Stem Cell Translational Research, National Eye Institute, National Institutes of Health, United States
Figures
Figure 1
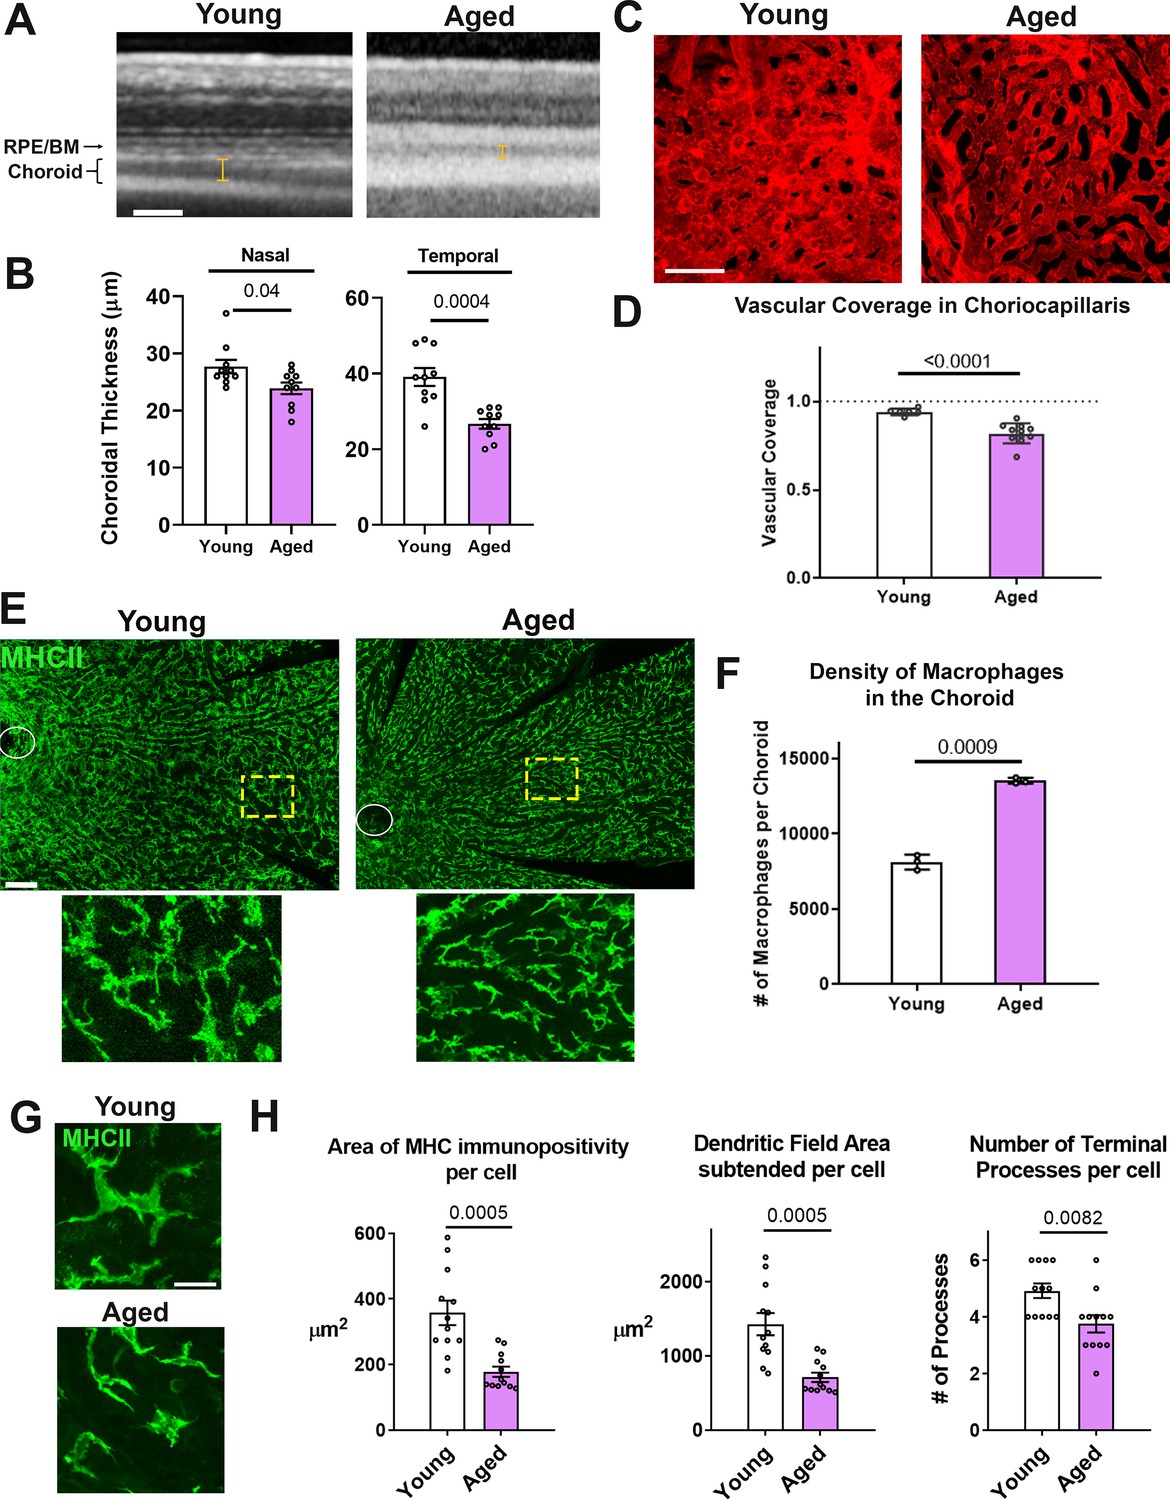
Age-related progressive choroidal thinning and vascular atrophy are associated with alterations in choroidal macrophages.
(A) Young adult (3 month old) and aged (24 month-old) wild type BALB/cJ mice were imaged with enhanced depth imaging optical coherence tomography (EDI OCT) imaging; measurements made of choroidal thickness (indicated by I-bars). Scale bar = 100 µm. (B) Choroidal thickness measurements, assessed in the temporal and nasal quadrants (300 µm temporal and nasal respectively from the optic nerve on the horizontal meridian), were significantly decreased in the aged group. (C) Choriocapillaris vascular structure was analyzed in sclerochoroidal flatmounts following systemic DiI perfusion. Scale bar = 50 µm. (D) The fractional area coverage by choriocapillaris vessels was significantly reduced in the aged animals. (E) Choroidal macrophages were visualized by immunohistochemical staining for MHCII in sclerochoroidal flatmounts. Scale bar = 100 µm. Panels show representative images with insets showing high-magnification views. Ellipses mark the position of the optic nerve. (F) Macrophage density was markedly increased in the aged group. n = 3 animals per group. (G) High magnification images of choroidal macrophages showing reduced ramification in aged vs. young adult animals. Scale bar = 20 µm. (H) Quantitative morphological analyses of macrophages from aged animals showed decreased mean cell size (defined as the area of MHCII-immunopositivity per cell), cell coverage (dendritic field area subtended by a single cell), and mean process number (number of terminal processes per cell). P values indicate comparisons relative to control with an unpaired t-test with Welch’s correction, n = 4 animals per group.
Figure 2
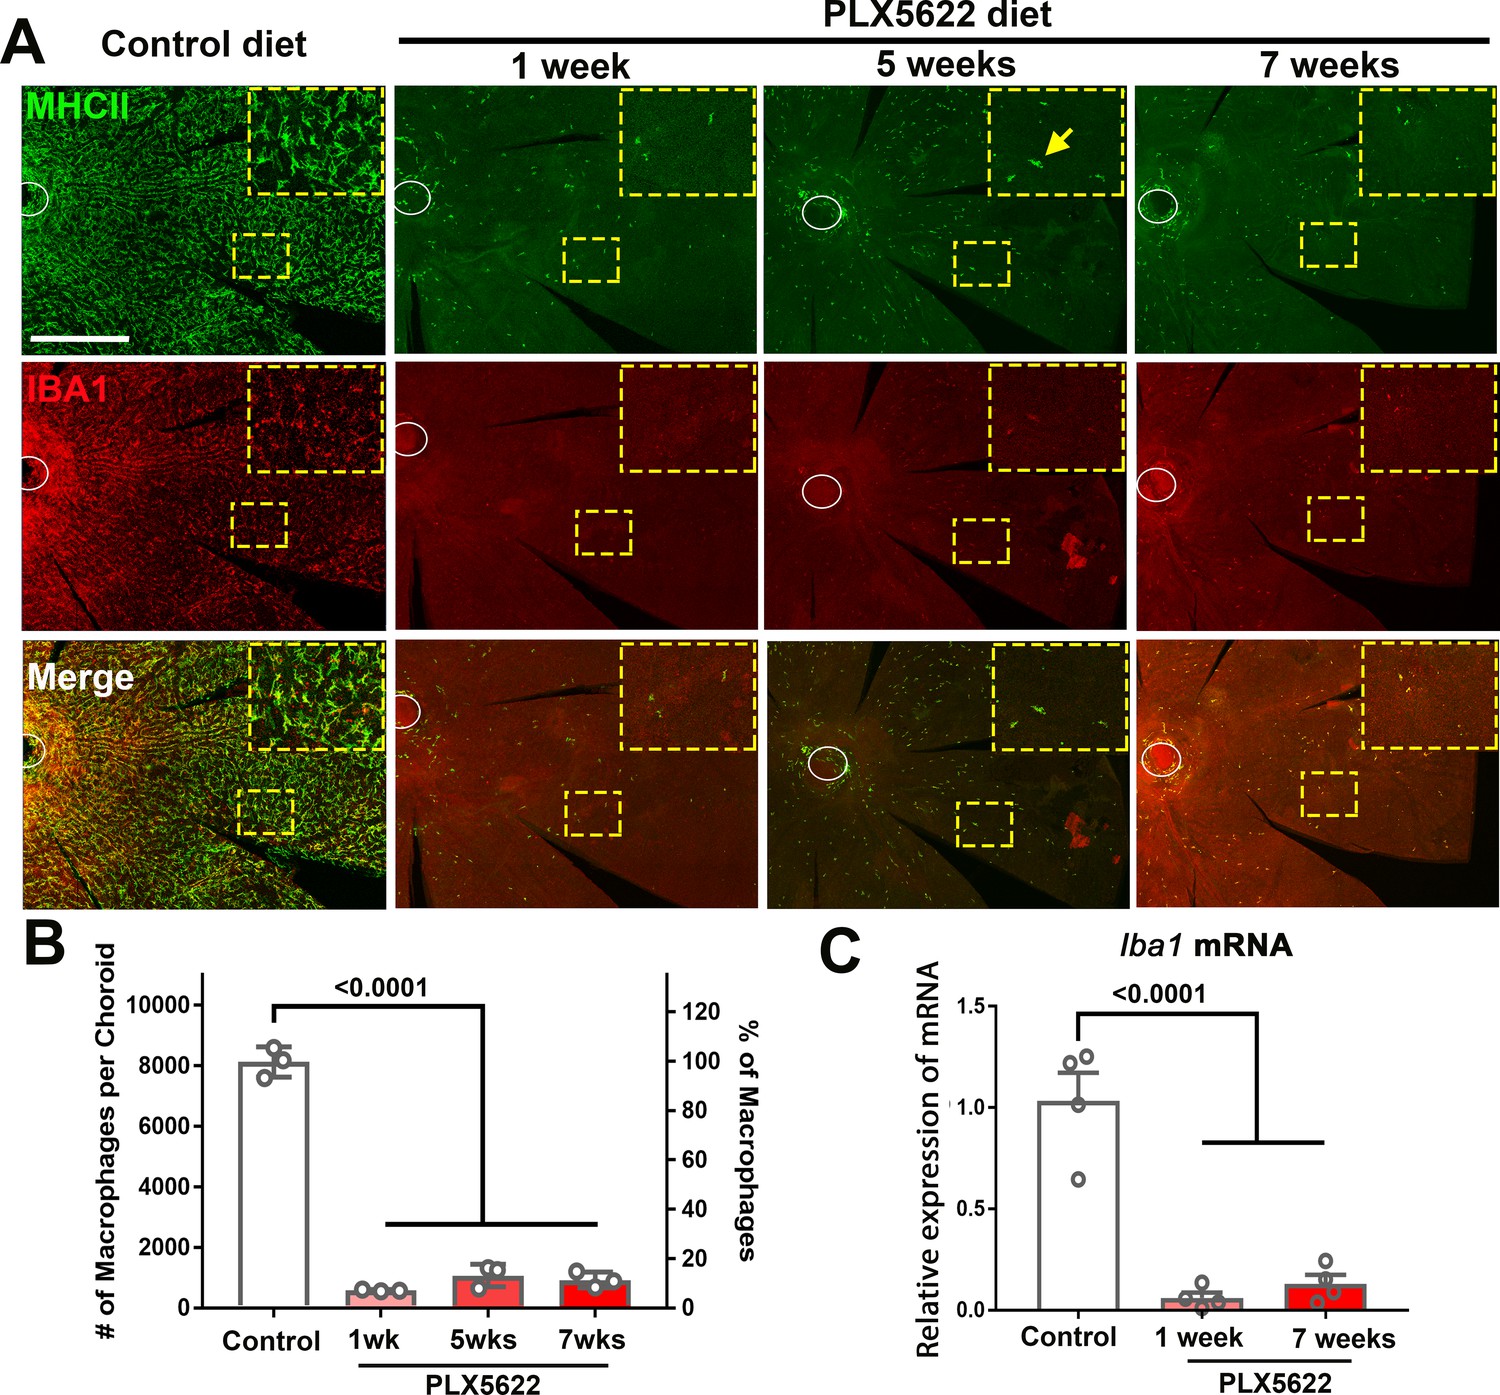
CSF1R inhibition via PLX5622 administration induces a rapid and sustained depletion of resident macrophages in the adult mouse choroid.
(A) Three-month old wild type Balb/cJ mice were administered diet containing PLX5622 (at 1200 parts per million) continuously for up to 7 weeks. Controls consisted of age-matched animals maintained on standard mouse chow. Resident macrophages in the choroid were visualized by immunohistochemical staining for MHCII (green) and IBA1 (red) in sclerochoroidal flatmounts. Panels show representative images with insets showing high-magnification views. Ellipses mark the position of the optic nerve. The choroid of control animals demonstrated a dense network of IBA1+, MHCII+ resident macrophages with ramified, dendritiform morphology. Macrophage numbers were markedly decreased following 1 week of PLX5622 administration which remained reduced at similar levels for up to 7 weeks of administration. The few residual macrophages showed reduced ramification. Scale bar = 500 µm. (B) Quantitative counts of total MHC-II+ macrophages across the entire choroid revealed a ≈90% reduction in macrophage numbers by 1 week of PLX5622 treatment, which was sustained with continued treatment. (C) Quantitative PCR analyses of the whole RPE-choroid complex demonstrated a corresponding reduction in the expression of Iba1 mRNA, corresponding to the depletion of Iba1-expressing macrophages. P values indicate comparisons relative to control, 1-way ANOVA, n = 3 animals per treatment group.
Figure 3 with 1 supplement
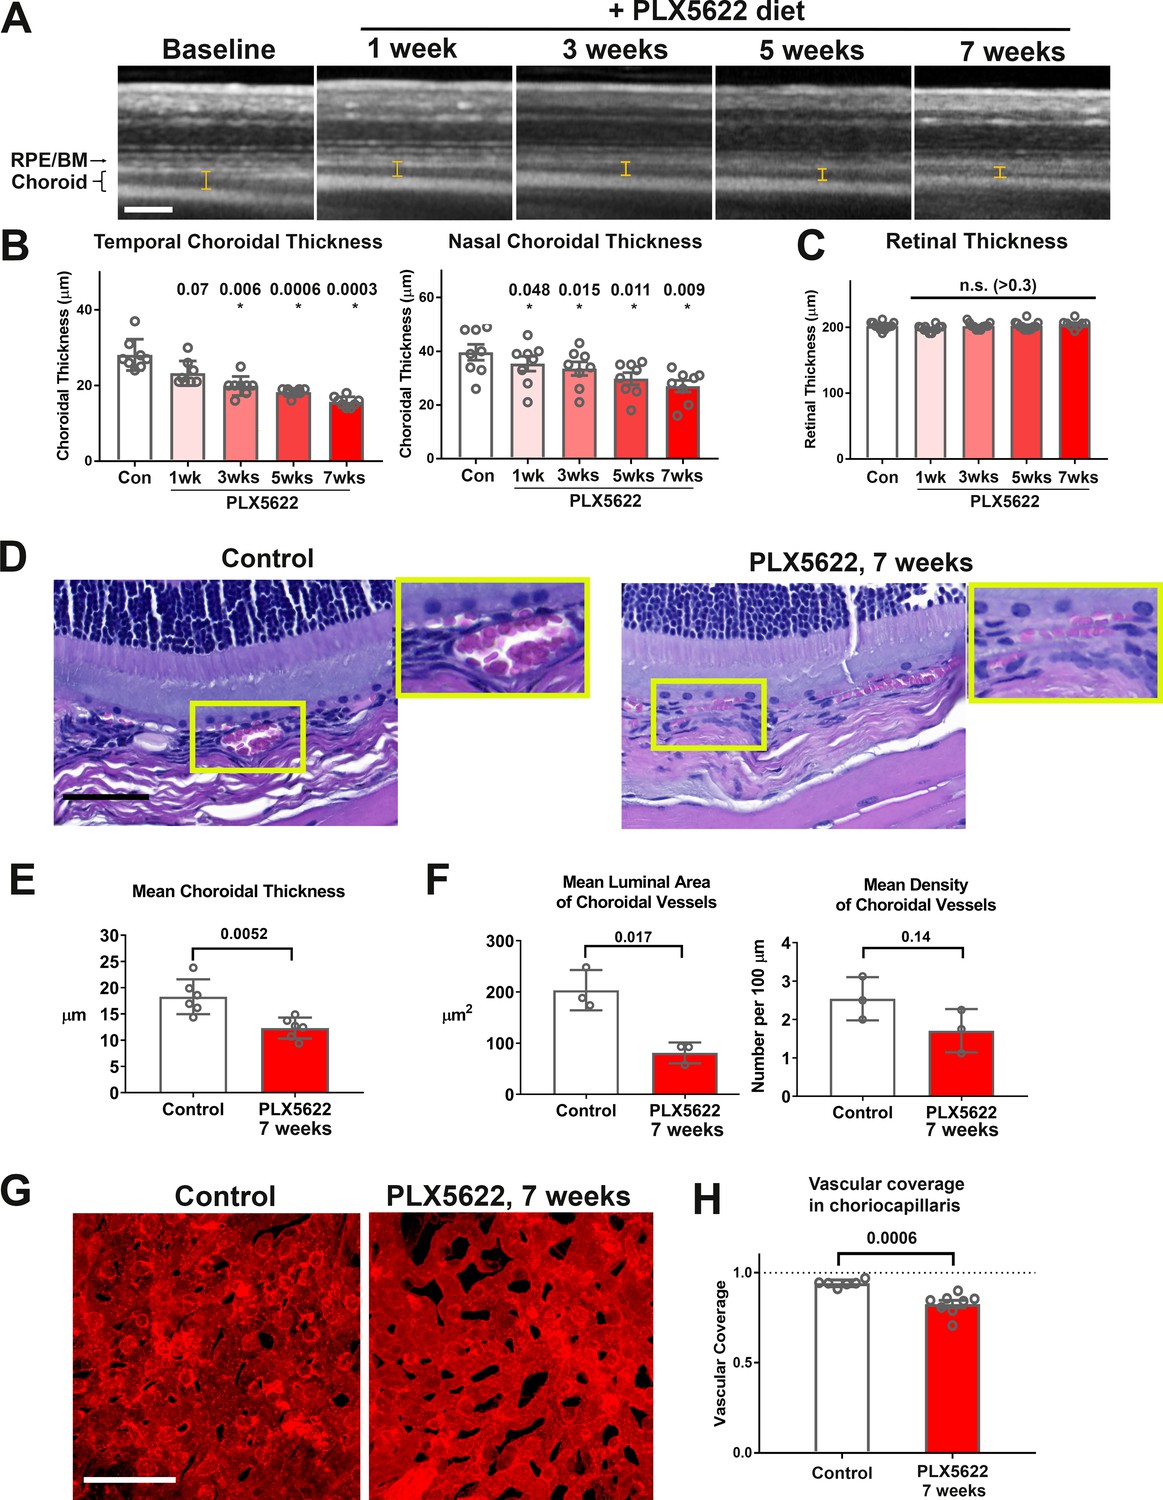
Long-term depletion of resident choroidal macrophages is accompanied by progressive choroidal thinning and vascular atrophy.
(A) Animals administered PLX5622-containing diet continuously over 7 weeks were followed with longitudinal in vivo enhanced depth imaging optical coherence tomography (EDI OCT) imaging; I-bars show the measurements made of choroidal thickness. Scale bar = 100 µm. (B) Choroidal thicknesses measured in the temporal and nasal quadrants (at 300 µm temporal and nasal respectively from the optic nerve at the horizontal meridian) demonstrated progressive and significant decreases from baseline. (C) Total retinal thickness (measured from the RPE layer to the vitreal surface at the internal limiting membrane) were stable over the same period. P values in B, C were computed for comparisons relative to baseline using 1-way ANOVA test, n = 10 eyes from five animals at each time-points. (D–F) Comparative histological analysis of the choroid in control and depleted animals showed decreases in overall choroidal thickness and vascular density. Panels show representative images with insets (yellow boxes) showing high-magnification views. Scale bar = 50 µm. Mean total choroidal thickness was significantly reduced with macrophage depletion (E), as was the mean cross-sectional area of vascular lumina (F), with a trend towards decreased density of choroidal vessels. n = 6 eyes from three animals per treatment group. (G, H) Choriocapillaris vascular structure was imaged in flat-mounted sclerochoroidal tissue following vascular labeling with DiI perfusion; the fractional area coverage by vessels in the choriocapillaris was significantly reduced following 7 weeks of macrophage depletion. Scale bar = 50 µm. n = 8 eyes from four animals per treatment group. P values in E), (F), and H) were computed with an unpaired t-test with Welch’s correction.
Figure 3—figure supplement 1
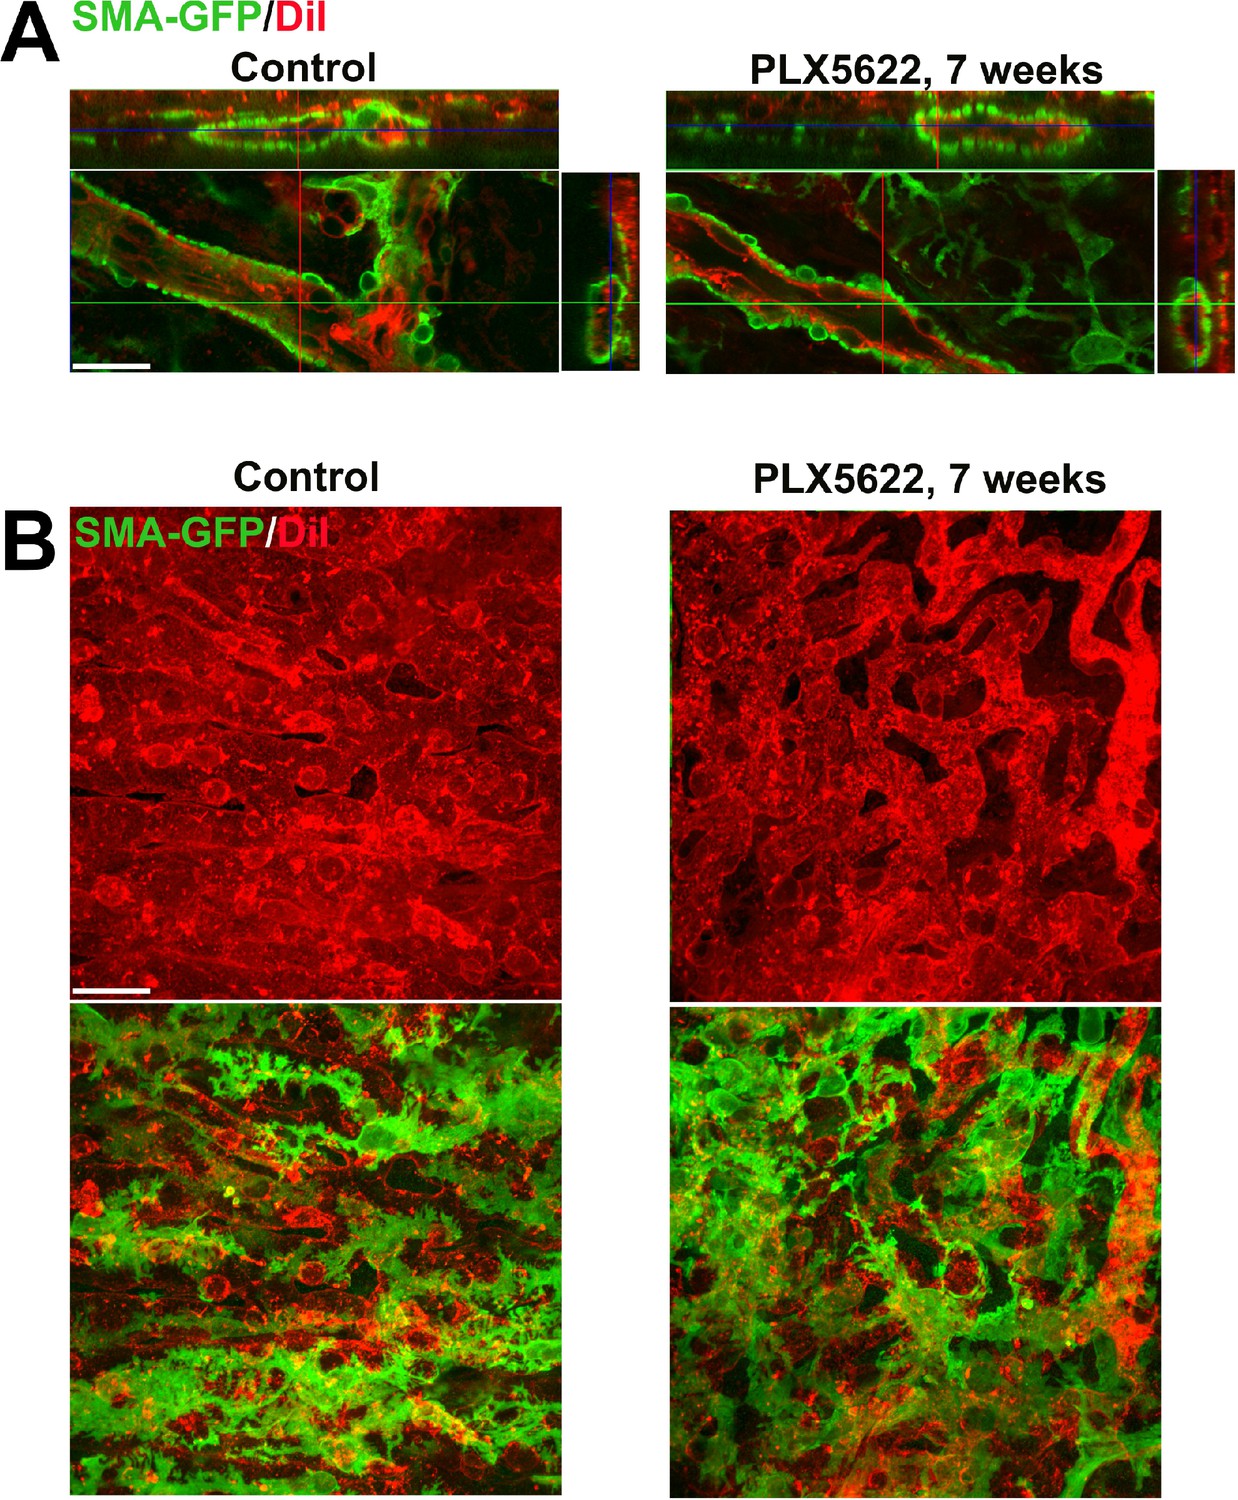
Long-term depletion of resident choroidal macrophages does not result in marked depletion or disorganization of smooth muscle actin (SMA)-expressing perivascular smooth muscle cells or choriocapillaris pericytes.
Albino transgenic mice possessing a transgene containing an α-SMA promoter driving the expression of green fluorescent protein (GFP) were used to visualize perivascular cells of the choroidal vasculature. The choroidal vasculature was visualized by systemic DiI perfusion (red). (A) Perivascular smooth muscle cells of adult 3 month old mice administered diet containing PLX5622 for 7 weeks to deplete choroidal macrophages were compared with those in controls (age-matched mice fed standard diet). Orthogonal views of confocal images demonstrated complete coverage of large choroidal vessels (red) with contiguous perivascular cells (green) that were largely unaltered with choroidal macrophage depletion. (B) Confocal images of the choriocapillaris visualized enface demonstrated a similar presence and coverage of ramified pericytes on the sclerad surface of choriocapillaris vasculature in depleted and control animals. Scale bars = 20 µm, n = 3 animals each treatment group.
Figure 4 with 1 supplement
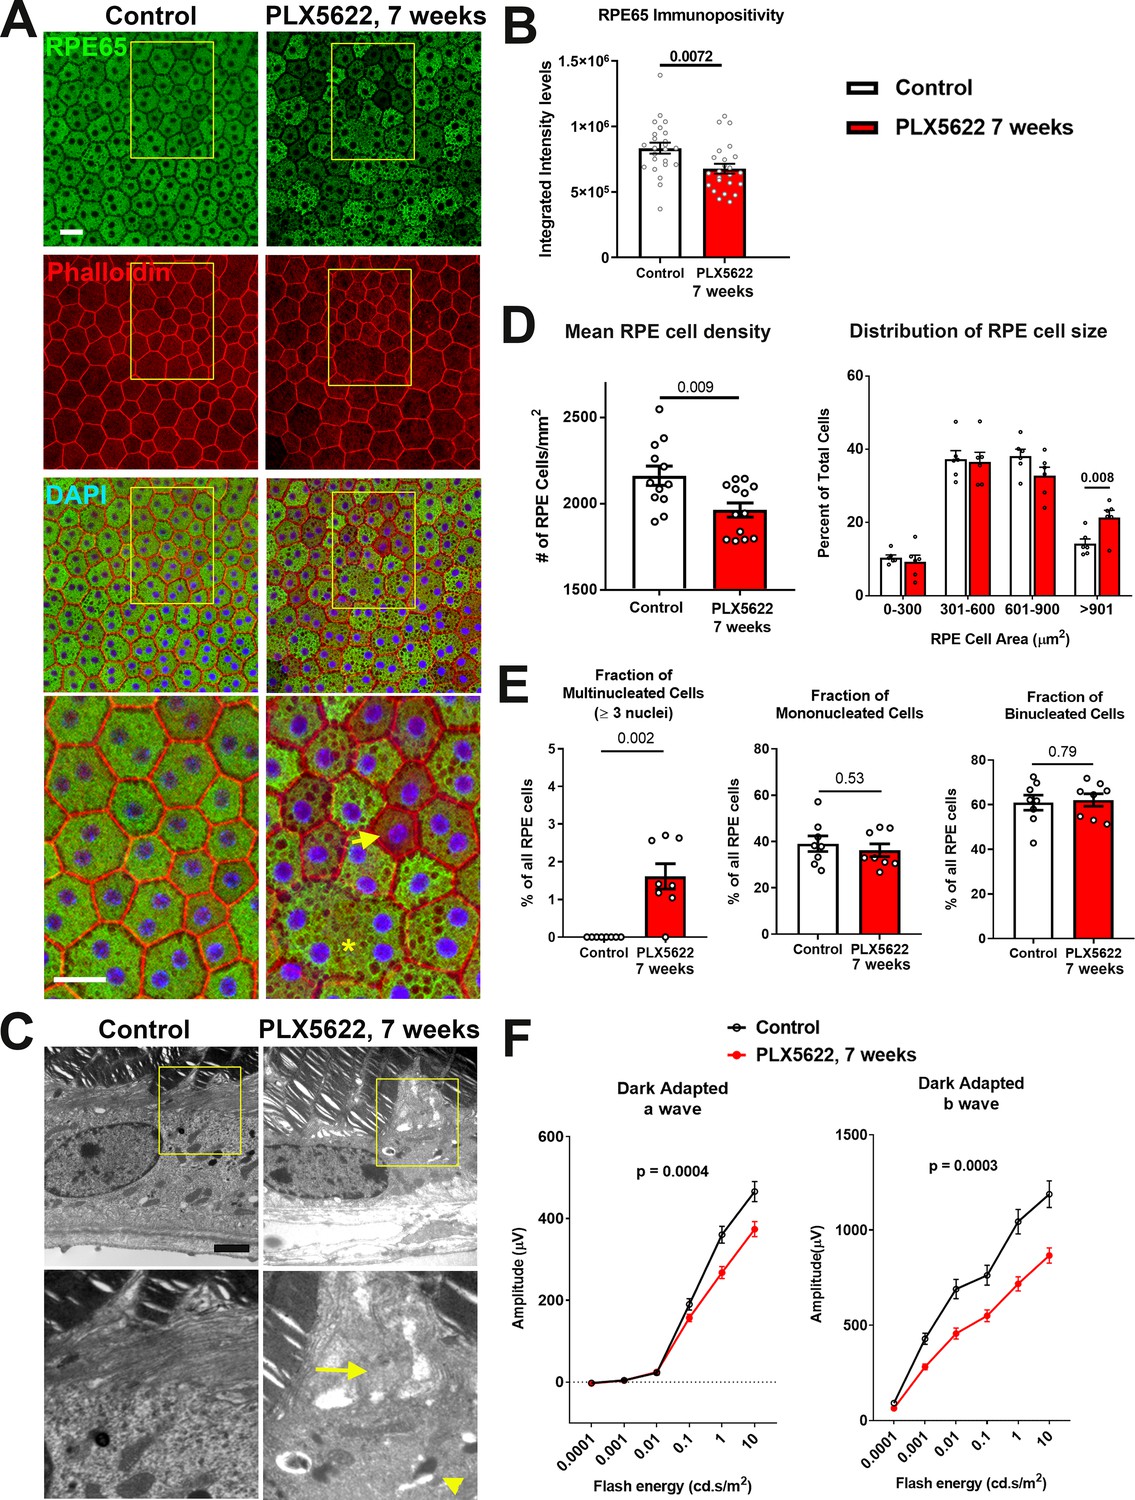
Long-term depletion of choroidal macrophages is associated with alterations in RPE structure and function.
(A) Immunohistochemical analyses of the RPE monolayer in sclerochoroidal flatmounts in control and PLX5622-treated animals (for 7 weeks) were performed with RPE65 (green), conjugated phalloidin to stain F-actin (red), and DAPI (blue). High-magnification views (yellow box inset) highlight large multinucleated (>3 nuclei) cells (asterisk *), local reductions of RPE65 immunopositivity (arrow), and generally increased intracellular vacuolation. Scale bar = 20 µm. (B) Quantitative analysis of RPE65 immunopositivity in RPE. (C) Transmission electron microscopic analysis of RPE cells show in PLX5622-treated animals disrupted RPE apical microvilli structure (arrow) and increased intracellular vacuolation (arrowhead). Quantitative comparison of RPE morphological features from control and depleted animals of (D) RPE cell density, mean and distribution, and (E) the proportion of multinucleated (≥3 nuclei), mononucleated and binucleated RPE cells. P values in B, D, E correspond to comparisons made using an unpaired t-test with Welch's correction. n = 4 to 6 animals in each treatment group. (F) Comparison of scotopic electroretinographic responses between control and depleted animals showed significantly decreased a- and b-wave amplitudes in the PLX5622-treated group. P values correspond to comparisons made using a 2-way ANOVA test, n = 10 to 16 eyes from 5 to 8 animals in each treatment group.
Figure 4—figure supplement 1
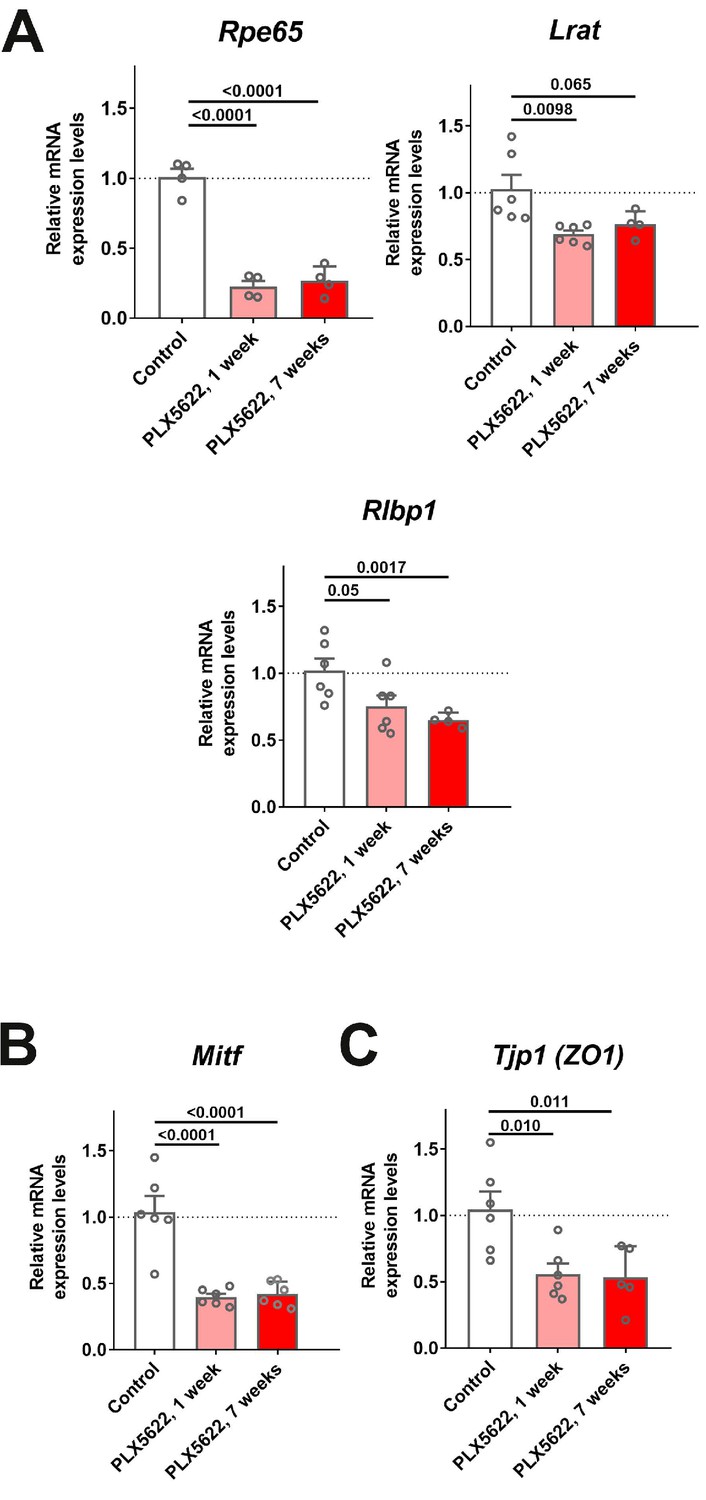
mRNA expression levels of genes related to RPE function are altered following transient and sustained depletion of choroidal macrophages.
Changes in mRNA expression of RPE-specific genes in sclerochoroidal tissue following 1 and 7 weeks of continuous PLX5622 administration were evaluated with RT-PCR. Age-matched untreated animals served as controls. (A) RPE genes related to visual cycle function demonstrated general decreases; Rpe65 expression was markedly decreased beginning at 1 week of treatment, with smaller relative changes were observed for Lrat and Rlbp1. Mitf, a transcriptional factor important for RPE differentiation (B), and Tjp1 (ZO1), a tight-junctional protein between RPE cells (C), also showed significant decreases. P values correspond to comparisons relative to control made using a 1-way ANOVA test, n = 4–6 animals each treatment group.
Figure 5 with 2 supplements
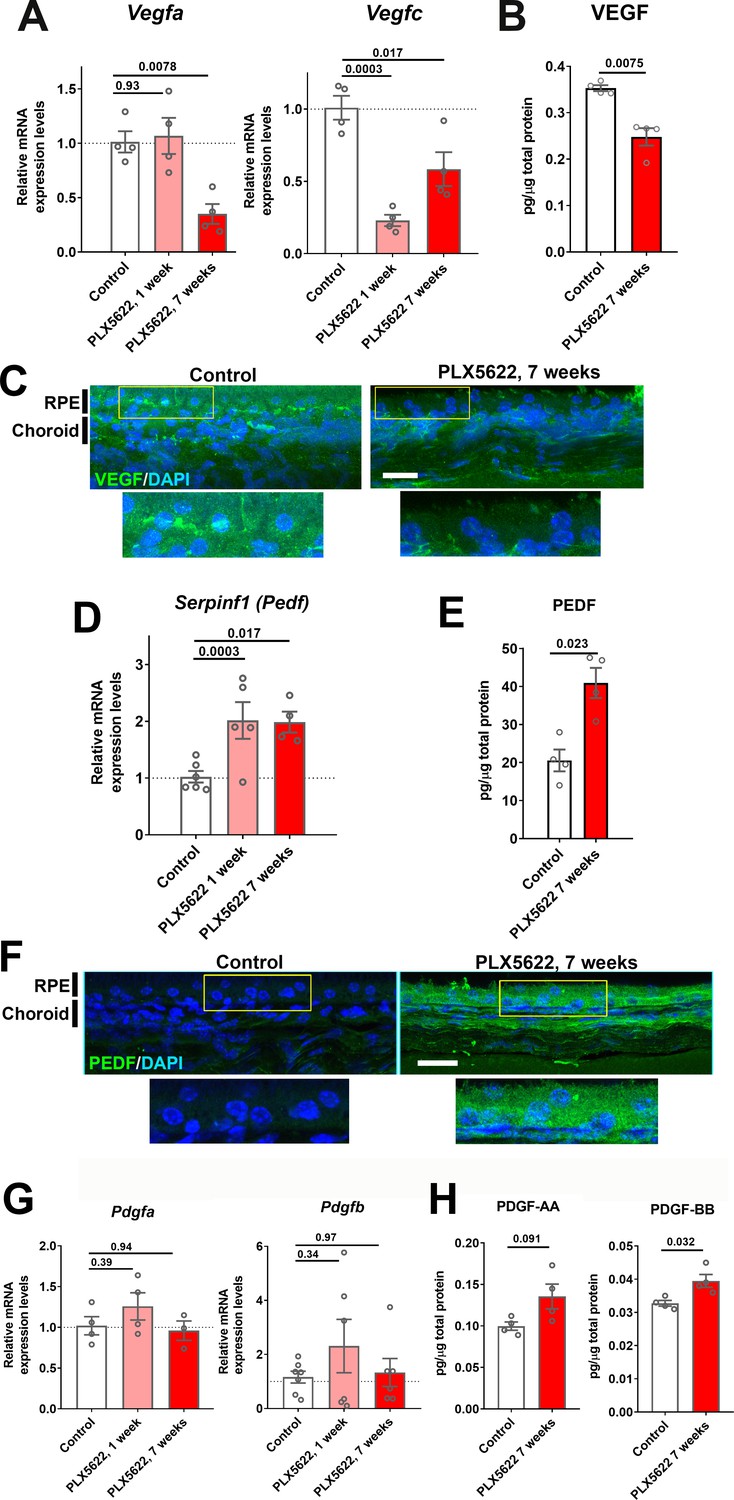
Expression levels of angiogenic growth factors in the RPE-choroid complex are altered with long-term choroidal macrophage depletion.
Total mRNA and protein were isolated from RPE-choroid complexes of animals treated with PLX5622-containing diet for 1 or 7 weeks and untreated control animals. mRNA levels of Vegfa and Vegfc (A), and protein level of VEGF (B) were all significantly reduced following 7 weeks of depletion. Immunohistochemical localization demonstrated VEGF expression at the level of the RPE that was decreased following macrophage depletion (C). Serpinf1 mRNA (D) and PEDF protein (E) were increased following macrophage depletion; immunohistochemical analyses demonstrated increased PEDF immunopositivity in the RPE layer and choroid (F). Pdgfa and Pdgfb mRNA levels (G) and PDGF-AA and PDGF-BB protein levels (H) were largely unaltered with macrophage depletion. P values were from a 1-way ANOVA, n = 4 to 8 animals per treatment group.
Figure 5—figure supplement 1
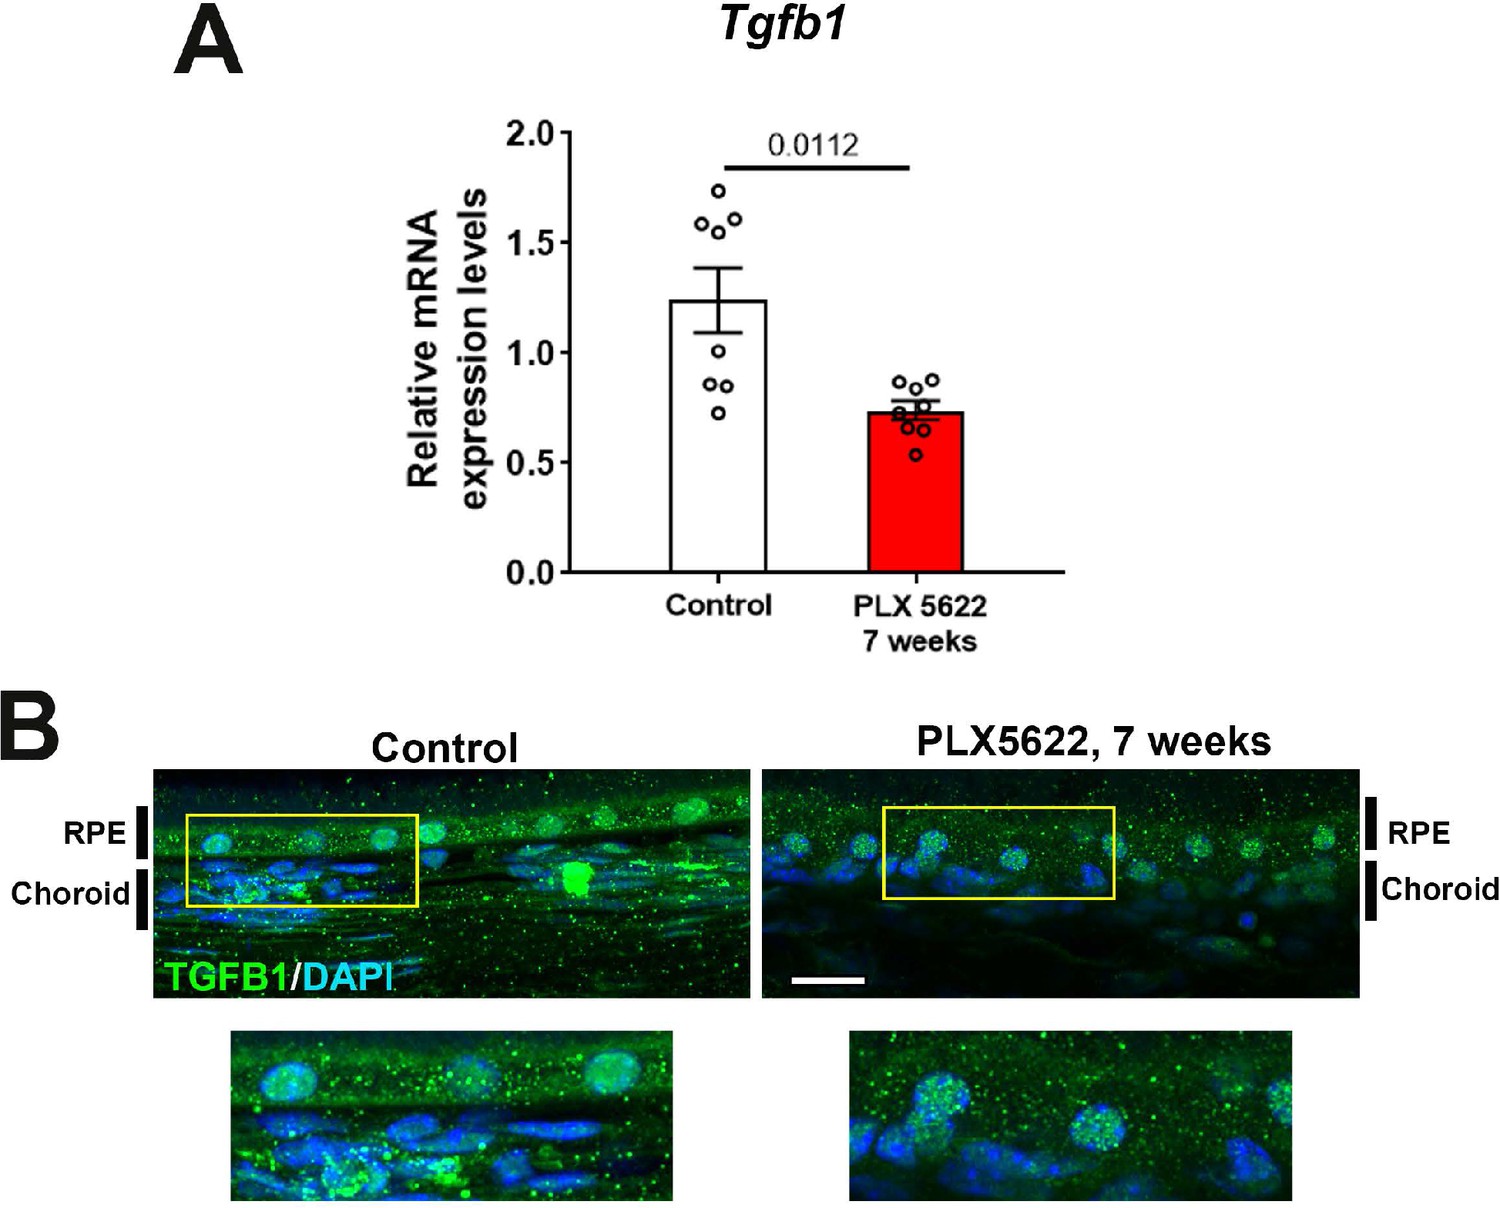
mRNA expression levels of Tgfb1 were altered following sustained depletion of choroidal macrophages.
Changes in mRNA expression of Tgfb1 in sclerochoroidal tissue were evaluated with RT-PCR following 7 weeks of continuous PLX5622 administration. Age-matched untreated animals served as controls. mRNA level of Tgfb1 (A) was significantly reduced following 7 weeks of macrophage depletion. Immunohistochemical localization demonstrated decreased TGFβ1 immunopositivity in the RPE layer and choroid following macrophage depletion (B). P values represent comparison to control level using an unpaired t-test with Welch’s correction. Scale bars = 20 µm, n = 4 to 8 animals per treatment group.
Figure 5—figure supplement 2
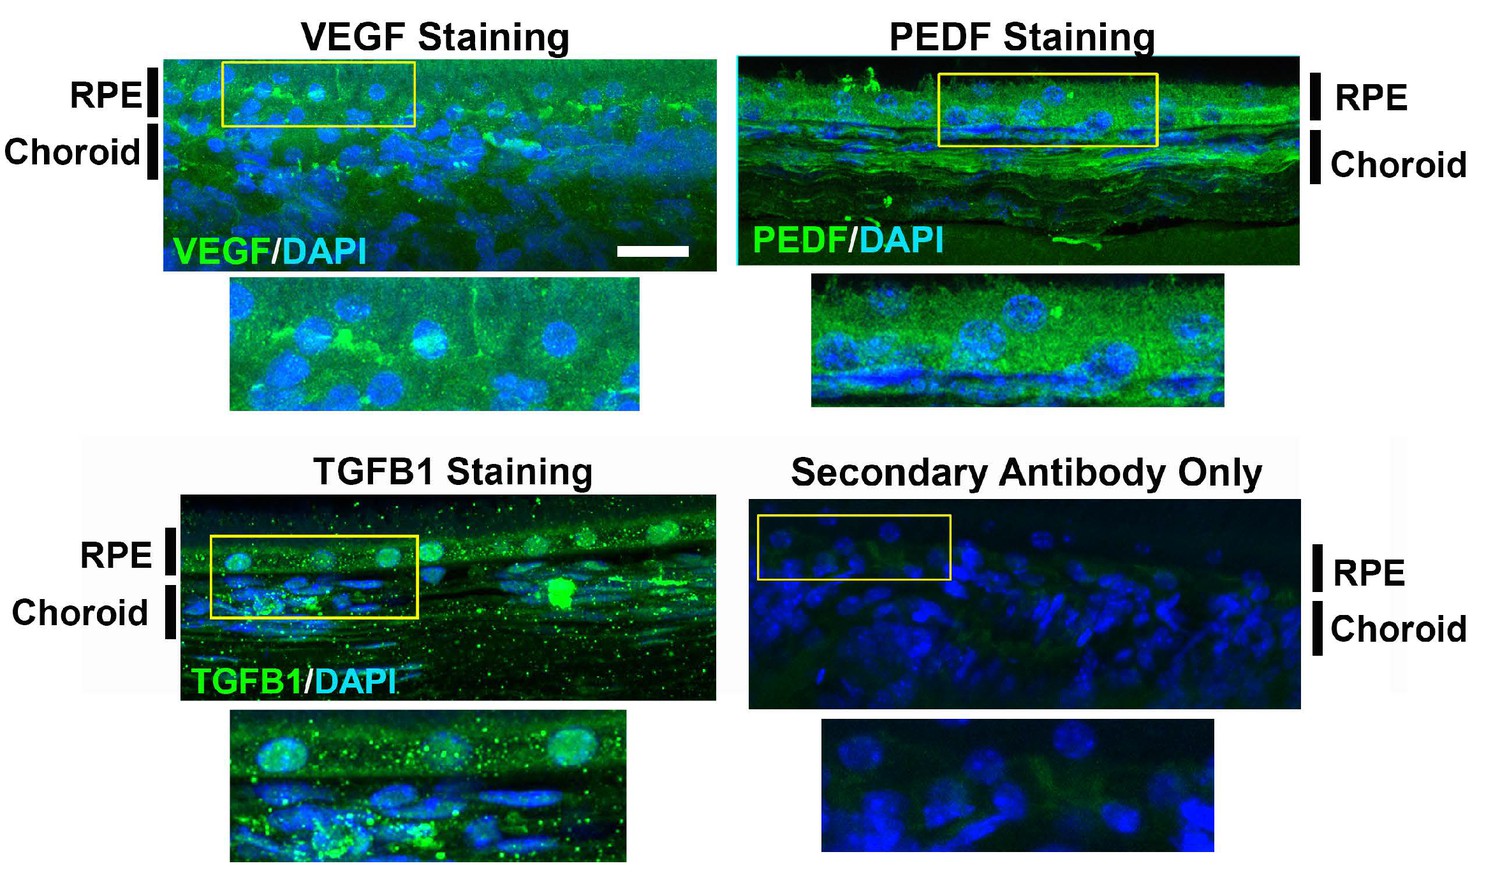
Secondary antibody staining control.
Choroidal sections were labeled with primary antibodies to VEGF, PEDF, TGFβ1. Negative controls constituted sections labeled with the secondary antibody only, in the absence of primary antibodies. n = 3 animals in each treatment group.
Figure 6 with 1 supplement
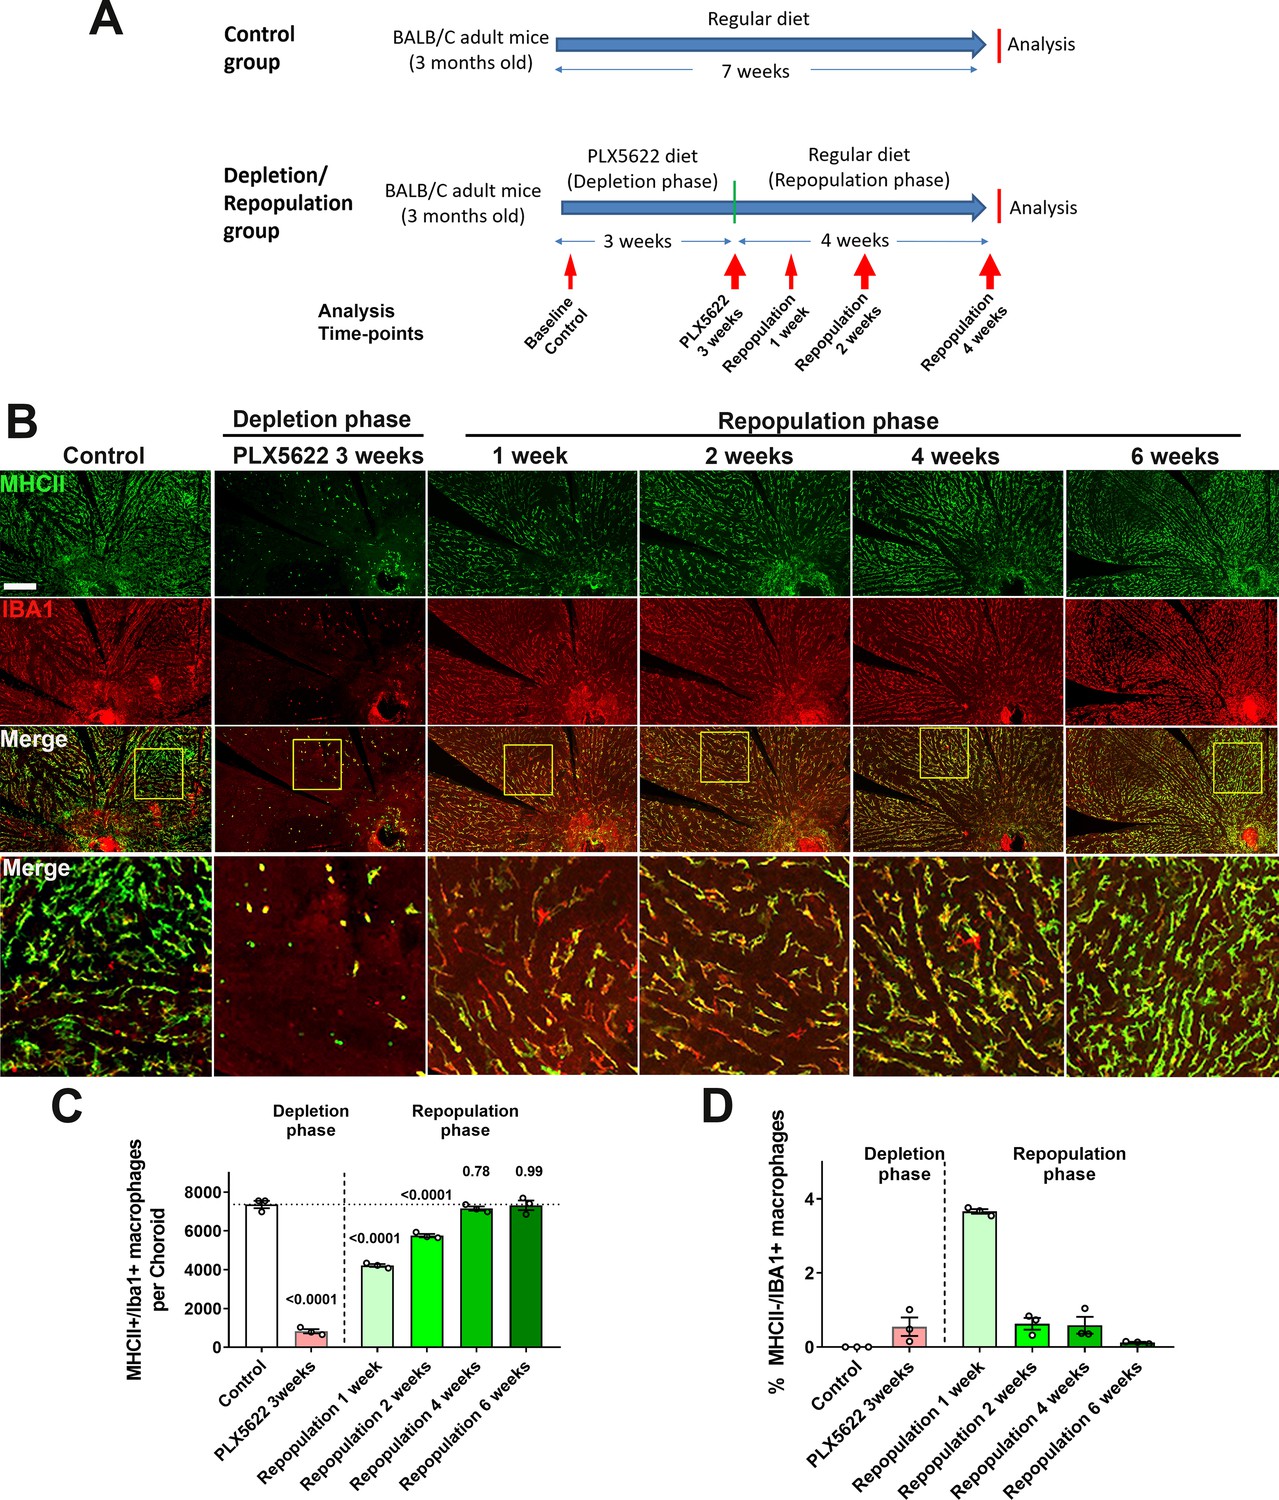
Choroidal macrophages demonstrate spontaneous repopulation and recovery of constitutive numbers following depletion.
(A) Adult 3 month old mice were administered a diet containing PLX5622 for 3 weeks to achieve depletion of choroidal macrophages (depletion phase), and then returned to a standard diet for another 4 weeks (repopulation phase). The control group consisted of age-matched animals maintained on a standard diet. (B) Sclerochoroidal flatmounts were immunolabeled with MHCII (green) and IBA1 (red) to visualize the resident macrophages. Panels show representative images and yellow box marking the areas showing high-magnification views. Scale bar = 1 mm. (C) The total number of macrophages in the choroid that were immunopositive for both IBA1 and MHCII markedly decreased after 3 weeks of PLX5622 administration but progressively increased following PLX5622 cessation to reach baseline levels after 4–6 weeks. (D) While all IBA1+ macrophages were immunopositive for MHC at baseline, a small fraction of IBA1+ macrophages were immunonegative for MHCII early in the repopulation phase (at 1 week following resumption of a standard diet). This phenotype was transient as all IBA1+ macrophages reacquired MHCII immunopositivity when repopulation neared completion at 6 weeks of repopulation. P values were from a 1-way ANOVA, n = 3 animals per treatment group.
Figure 6—figure supplement 1
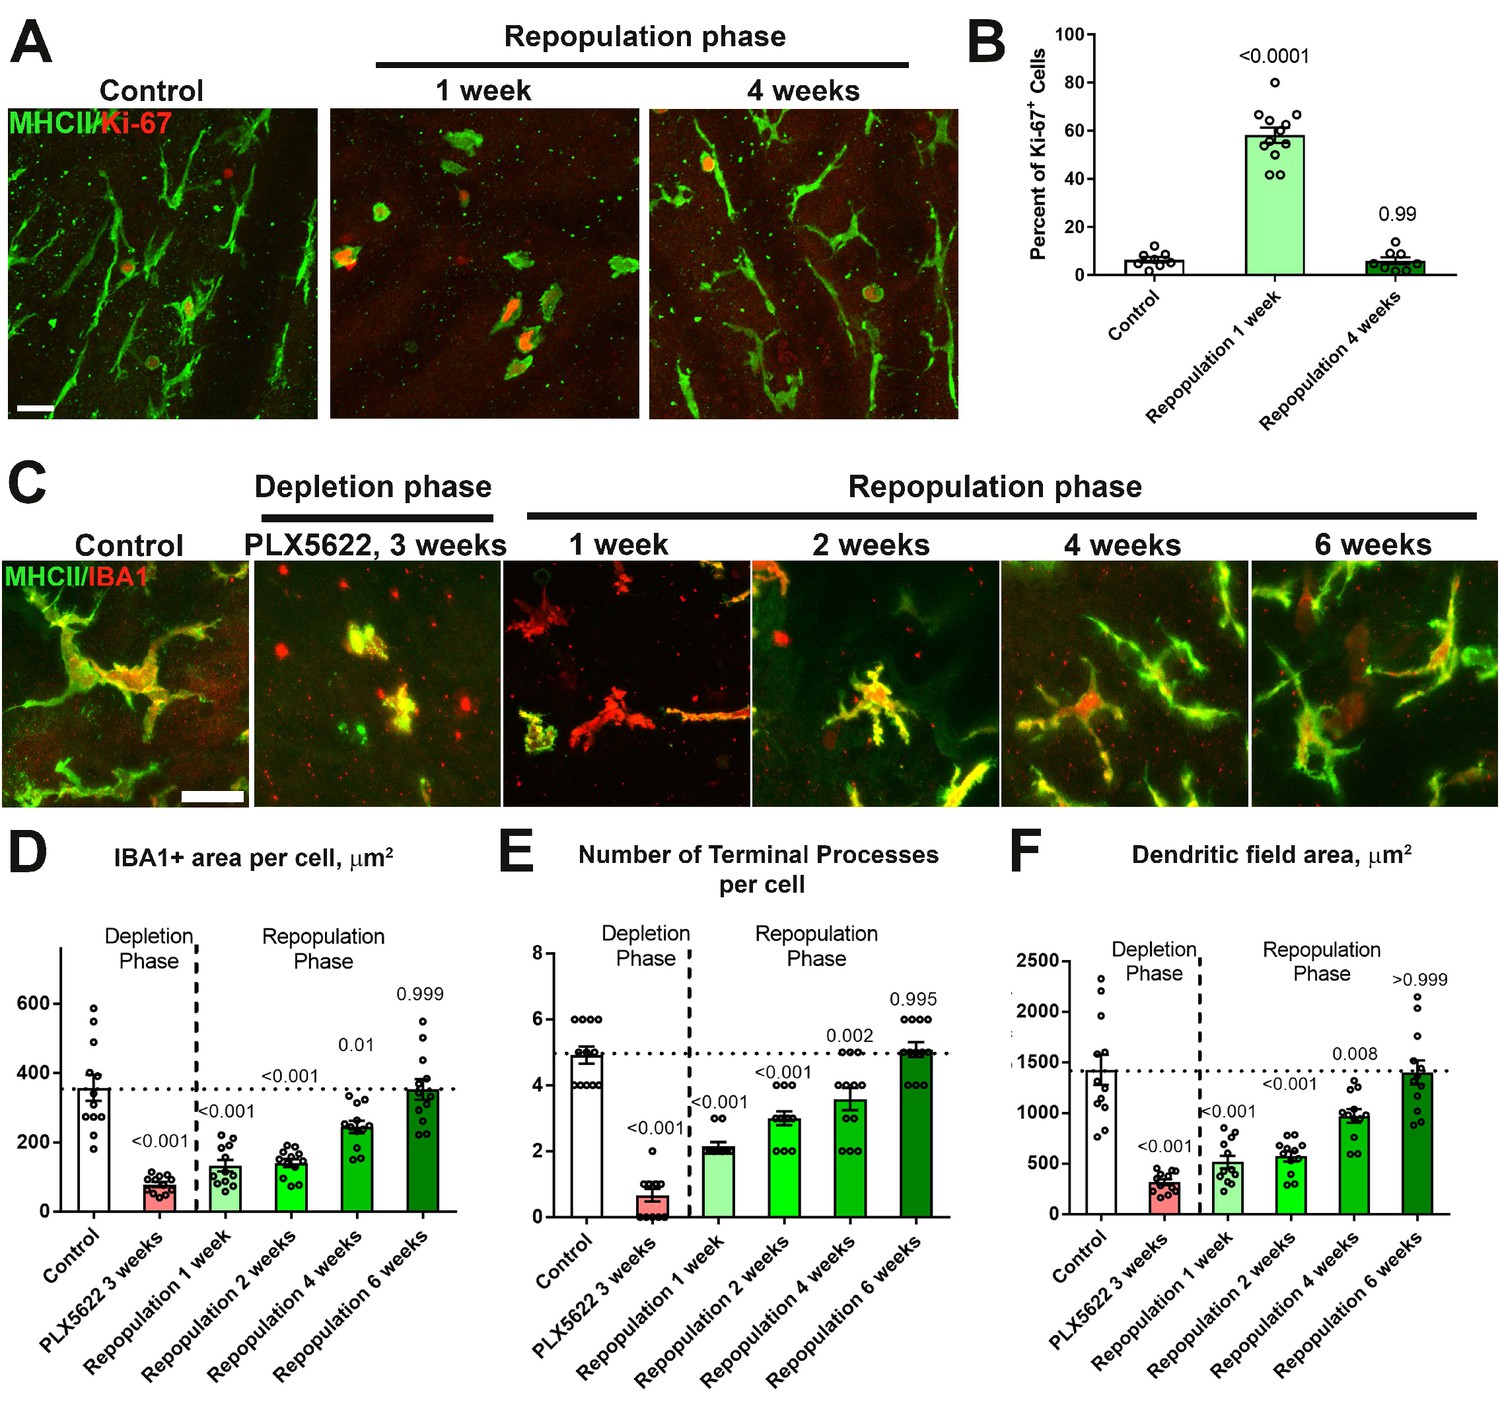
Repopulating choroidal macrophages demonstrate proliferation in situ and progressive morphological maturation.
(A, B) Ki67 immunopositivity was absent in MHCII+ repopulating macrophages in undepleted control animals but was prominent at 1 week of repopulation. The proportion of Ki67+ in MHCII+ cells declined to control levels by 4 weeks. Scale bar = 20 µm. (C) High magnification images of choroidal macrophages showing deramified morphologies during depletion and a progressive recovery of ramified morphologies during macrophage repopulation. Scale bar = 20 µm. Quantitative morphological analyses of repopulating macrophages showed progressive enlargement of cell size (defined as the area of IBA1-immunopositiviey per cell) (D), increasing ramification (in terms of number of terminal processes per cell) (E), and increasing dendritic field size (defined as the area of the bounding polygon around each cell) (F). Full recapitulation of these morphological measures back to baseline levels was achieved at 6 weeks into the repopulation phase. P values represent comparisons to control levels, 1-way ANOVA with Tukey’s correction for multiple comparisons. n = 4 animals each treatment group.
Figure 7
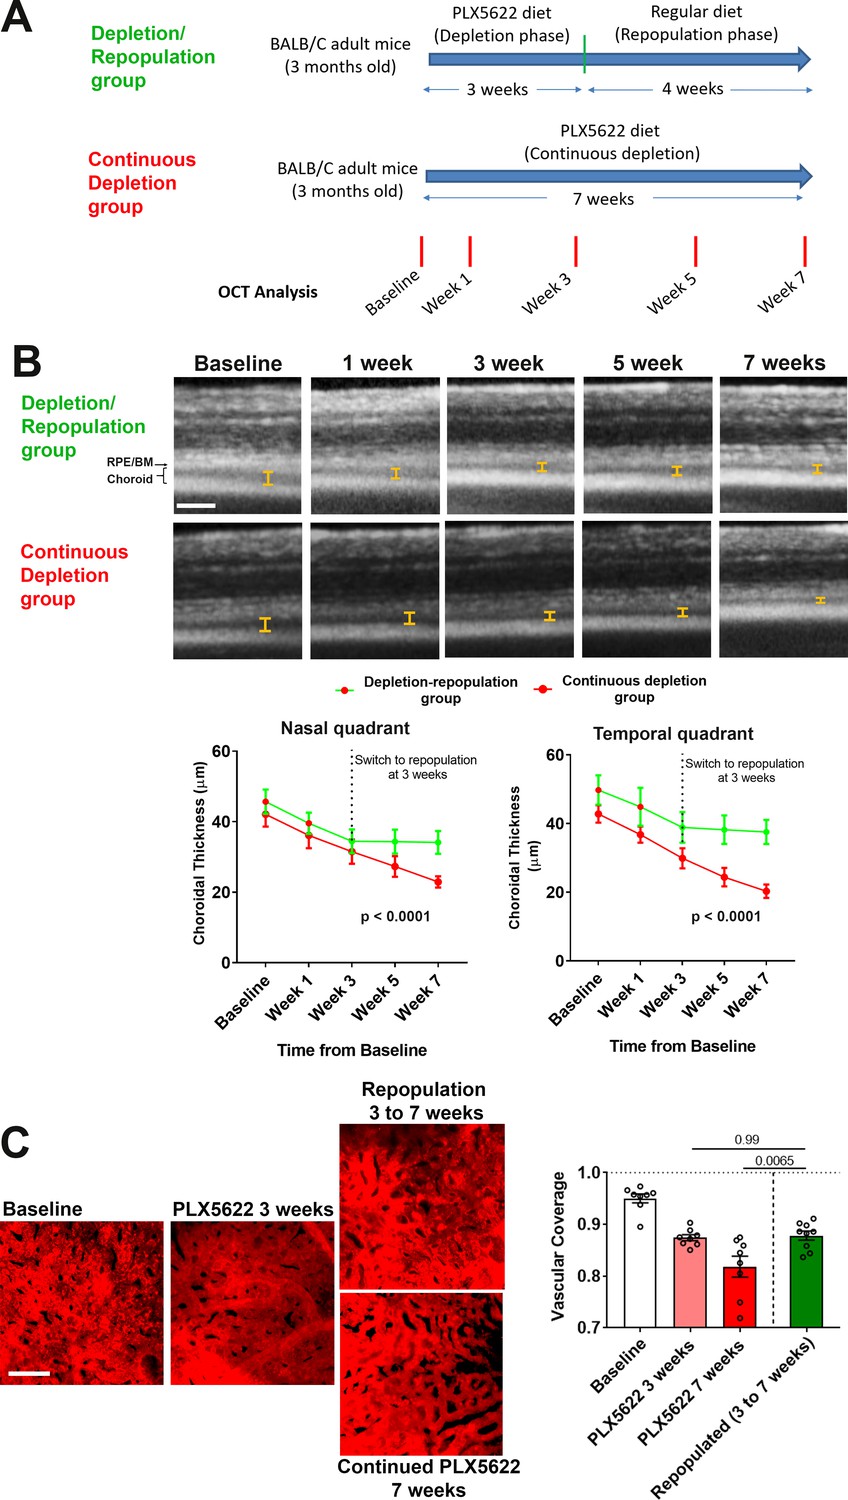
Choroidal macrophage repopulation following depletion is accompanied by an arrest in depletion-associated choroidal vascular atrophy.
(A) Experimental plan for the assessment of vascular changes in the choroid during macrophage depletion and repopulation. Age-matched 3 month-old adult BALB/cJ animals were divided into two groups: (1) the depletion-repopulation group: animals administered PLX5622-containing diet for 3 weeks, followed by 4 weeks on a standard diet, and (2) the continuous depletion group: animals were administered PLX5622-containing diet continuously for 7 weeks. Animals in both groups were assessed at baseline, and 1, 3, 5, and 7 weeks following baseline with serial OCT imaging. (B) Representative longitudinal aligned in vivo EDI OCT images of animals in the two groups taken at different time points; bars show the intervals across which choroidal thickness were measured. Scale bar = 200 µm. Choroidal thicknesses measured in the temporal and nasal quadrants (at 300 µm temporal and nasal respectively from the optic nerve at the horizontal meridian) decreased progressively with time in the continuously depleted group (red line), but stabilized in the depletion/repopulation group (green line) upon the onset of repopulation at 3 weeks following baseline, n = 9 eyes from five animals in each group for all time-points, p values indicate comparisons between the two experimental groups, 2-way ANOVA using a mixed-effects analysis. (C) Choriocapillaris vascular structure was imaged in sclerochoroidal flatmounts labeled with systemic DiI perfusion. Scale bar = 50 µm. The fractional area coverage by choriocapillaris vessels decreased continuously up to 7 weeks following baseline in the continuous depletion group but was stabilized from 3 to 7 weeks following baseline in the depletion/repopulation group. P values were from a 1-way ANOVA, n = 8 eyes from four animals per treatment group.
Figure 8 with 2 supplements
Choroidal macrophage repopulation following depletion is accompanied by an arrest in depletion-associated alterations in RPE structure and gene expression.
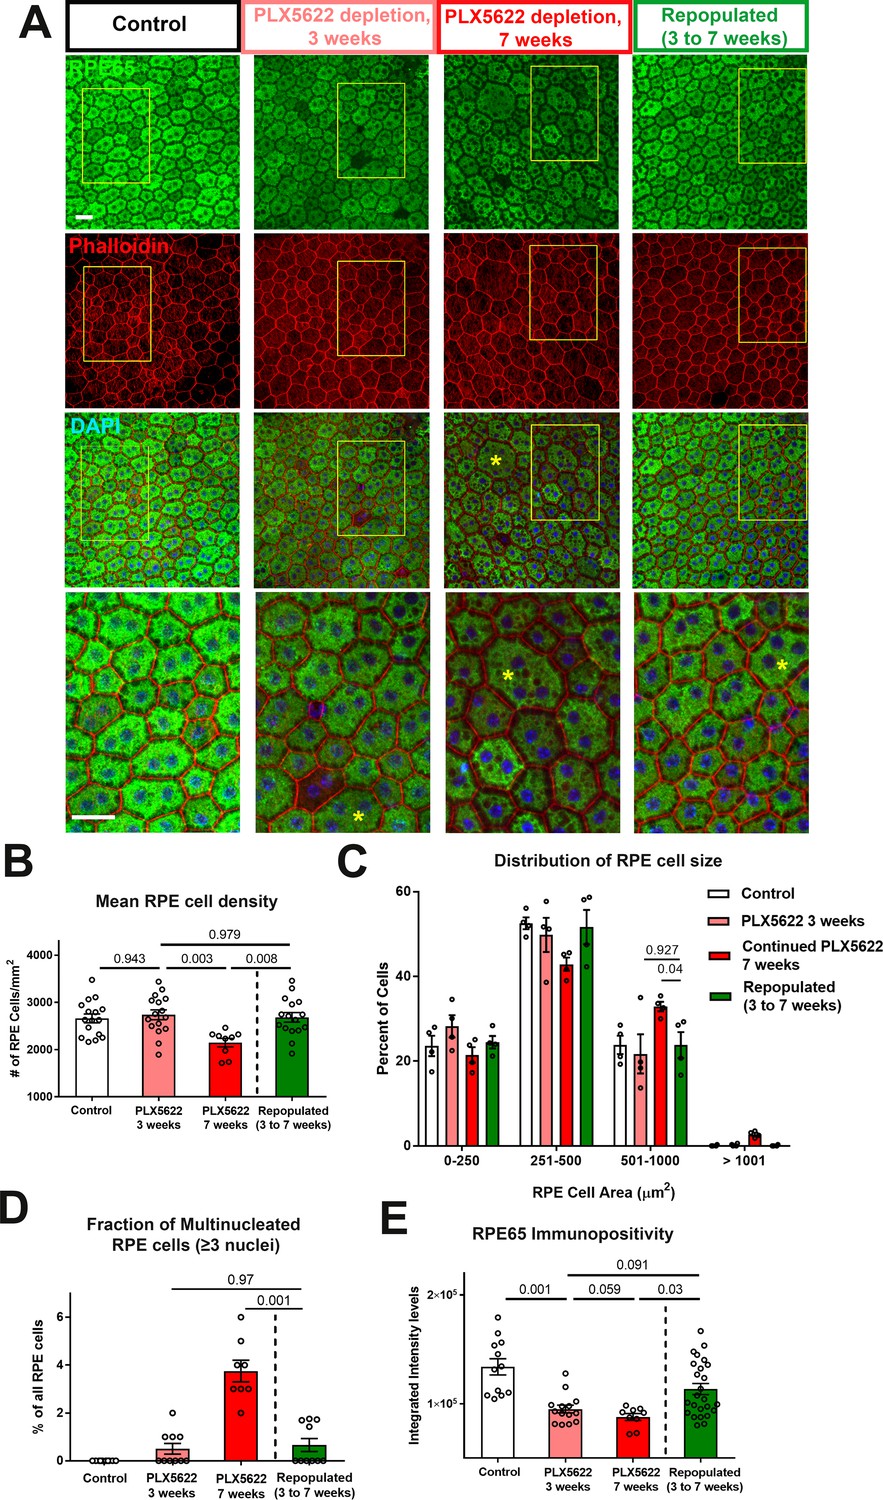
(A) Immunohistochemical analyses of the RPE-sclerochoroidal flatmounts from (1) untreated control animals (white bars), (2) animals continuously treated for 3 weeks of PLX5622-containing diet (pink bars), (3) animals continuously treated for 7 weeks of PLX5622-containing diet (red bars), and (4) animals treated for 3 weeks of PLX5622 containing diet and then followed by 4 weeks of standard diet (green bars); were performed with RPE65 (green), conjugated phalloidin (red), and DAPI (blue). The progressive patchy decrease in RPE65 immunopositivity and increase of large multinucleated (≥3 nuclei) cells were observed in animals in the 3- and 7 weeks depletion groups, however these changes were recovered upon the onset of repopulation. High-magnification views in the inset (yellow boxes) demonstrated the presence of large cells (>500 µm2 in area, asterisks) with multiple nuclei in the 7 week depleted group but was less prominent in the repopulated group. (B) Quantitative analysis of RPE morphology revealed that repopulation of choroidal macrophages after 3 weeks of depletion prevented further decrease in RPE cell density evident on 7 weeks of depletion. (C) Analysis of the distribution of RPE cell areas revealed that the increase in the proportion of large cells (>500 µm2 in area) induced with 7 weeks depletion was prevented in the repopulation group, which resembled the control and 3 week depletion groups in their distribution. (D) Analysis of the proportion of multinucleated RPE cells (≥3 nuclei) showed that the increased proportion of multinucleated cells induced with 7 weeks depletion was prevented in the repopulation group. (E) Quantitation of mean intensity of RPE65 immunopositivity showed that the significant decrease in RPE65 staining induced by depletion was partially restored after macrophage repopulation. P values indicate comparisons computed from a 1-way ANOVA, n = analysis of 4 imaging field from each animal, four animals per treatment group.
Figure 8—figure supplement 1
Macrophage depletion-associated changes in RPE genes expression are ameliorated with macrophage repopulation.
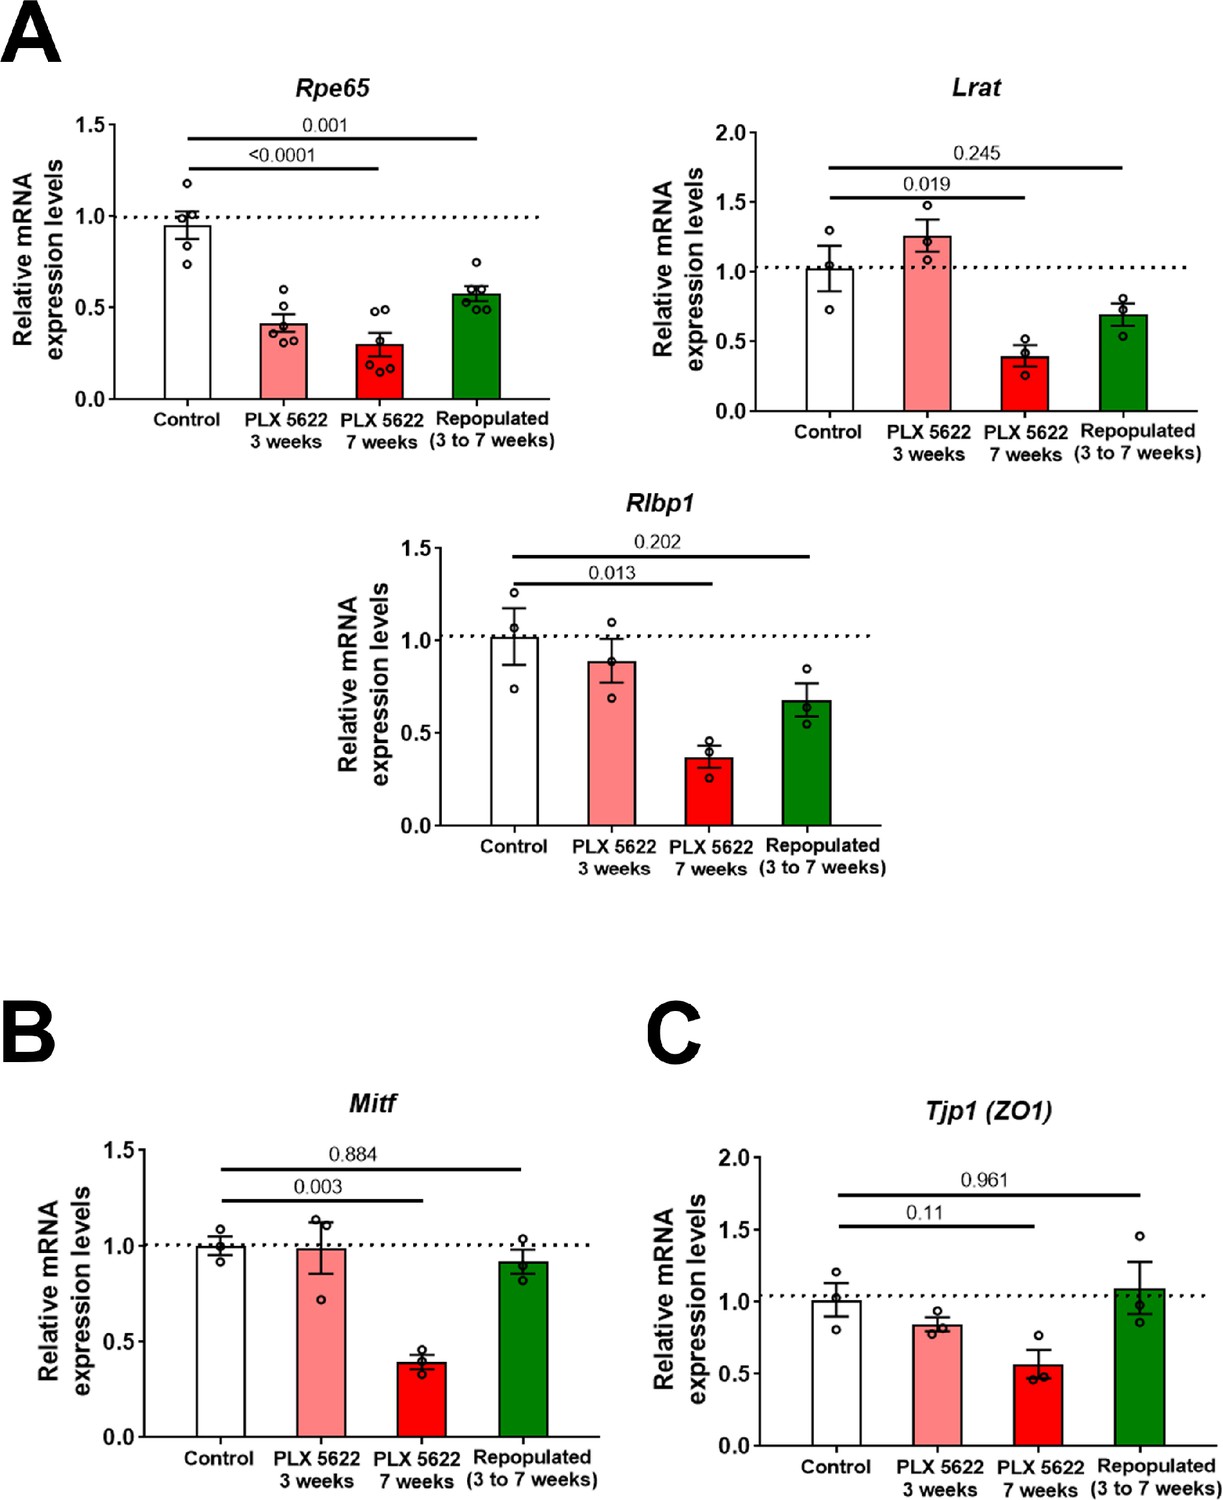
Changes in mRNA expression of RPE-specific genes in sclerochoroidal tissue from the following experimental groups were evaluated with RT-PCR: (1) untreated age-matched controls, (2) macrophage-depleted for 3 weeks, (3) macrophage-depleted for 7 weeks (continuous depletion group), and (4) macrophage-depleted for 3 weeks, followed by 4 weeks of macrophage repopulation (depletion-repopulation group). (A) RPE genes related to visual cycle function (Rpe65, Lrat, Rlpb1), (B) Mitf, and (C) Tjp1/Zo1, demonstrated decreases with depletion that were ameliorated or reversed with macrophage repopulation. P values correspond to comparisons relative to control made using a 1-way ANOVA test, n = 3 to 6 animals each treatment group.
Figure 8—figure supplement 2
Changes in ERG amplitudes during macrophage depletion and subsequent macrophage repopulation.
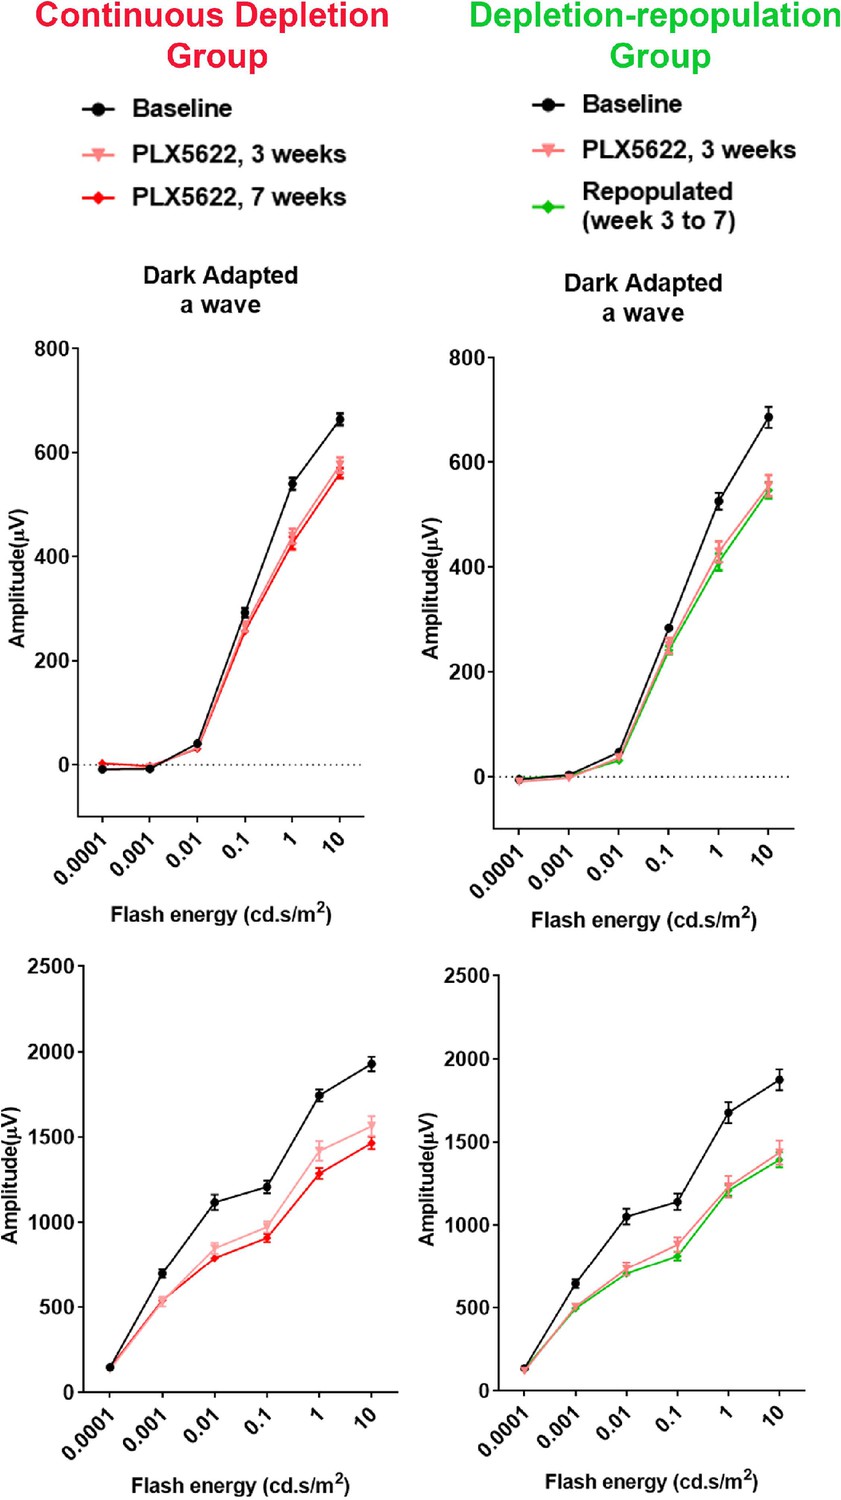
The scotopic electroretinographic responses showed significantly decreased a- and b-wave amplitudes at 3 weeks of depletion in both continuous depletion and depletion-repopulation groups. Slight decrease of scotopic b-wave was observed in the continuous depletion group at 7 weeks of depletion. Scotopic a- and b-wave amplitudes were stable between 3 to 7 weeks during macrophage repopulation. n = 10 eyes from five animals in each treatment group.
Figure 9 with 1 supplement
Choroidal macrophage repopulation following depletion is accompanied by a reversal in angiogenic factor expression.
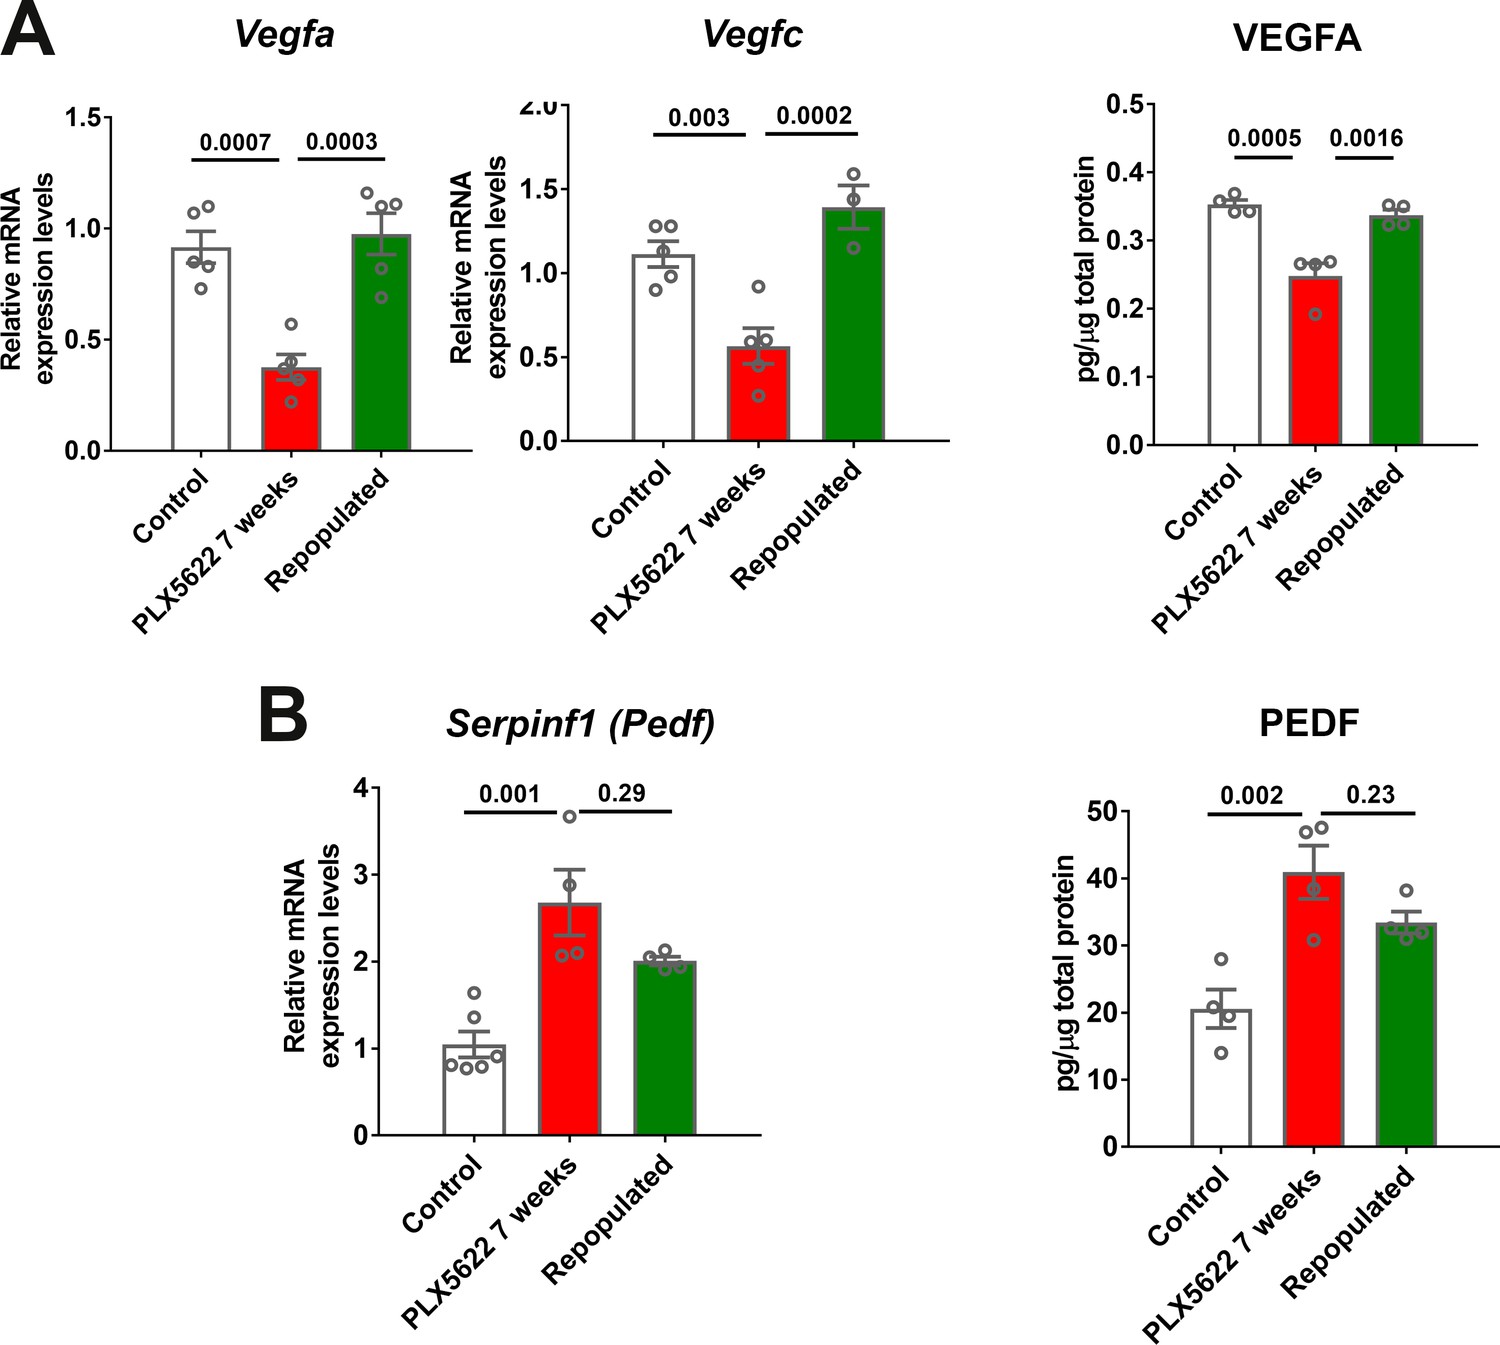
mRNA and total protein were isolated from the RPE-choroid complex of (1) control animals maintained on a standard diet (white bars), (2) depleted animals treated continuously with a PLX5622-containing diet for 7 weeks (red bars), and (3) repopulated animals treated with PLX5622-containing diet for 3 weeks and then switched to a standard diet for 4 weeks (green bars). mRNA and protein levels of angiogenic factors were analyzed by qrt-PCR and multiplex assay/ELISA respectively. (A) mRNA levels of Vegfa and Vegfc, and protein level of VEGFA, which were all decreased in the depleted group relative to the control group, were recovered back to control levels in the repopulated group. (B) mRNA levels of Serpinf1, and protein levels of PEDF, which were increased in the depleted group relative to the control group, were found at intermediate levels in the repopulated group. P values were from a 1-way ANOVA, n = 4 to 6 animals per treatment group.
Figure 9—figure supplement 1
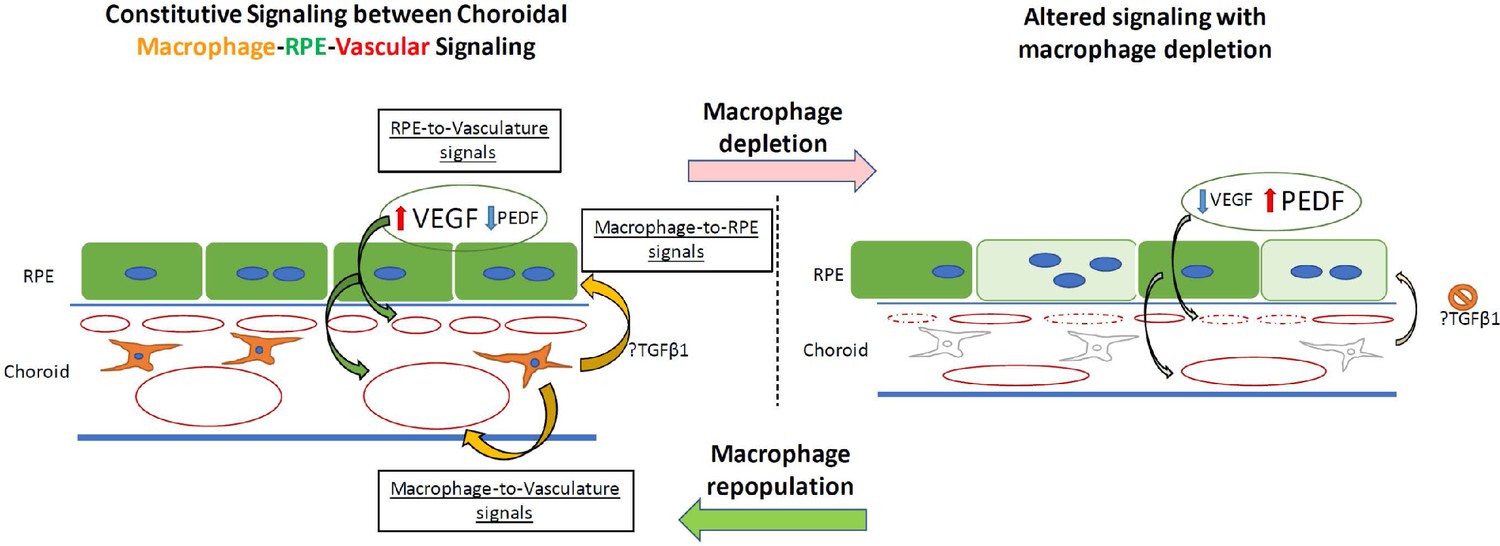
Schematic showing putative signaling between choroidal macrophages, vasculature, and the RPE layer in the outer retina under normal conditions and with choroidal macrophage depletion.
(Left) In the normal adult choroid, angiogenic signals (VEGF, PEDF) secreted from the RPE cell layer regulate local choroidal vascular structure. Choroidal macrophages produce potential trophic signals that influence RPE structure and angiogenic secretion (e.g. TGFB1), secondarily influencing vascular maintenance. Potential uncharacterized angiogenic signals may also originate from choroidal macrophages to impinge onto choroidal vasculature to maintain them. (Right) With the ablation of choroidal macrophages, macrophage trophic signals are diminished, leading to RPE cell structure changes and altered balanced of angiogenic factor production by RPE cells. These induce choroidal vascular atrophy, reducing choroidal thickness and decreasing choriocapillaris coverage.
Tables
Key resources table
| Reagent type (species) or resource | Designation | Source or reference | Identifiers | Additional information |
|---|---|---|---|---|
| Antibody | anti-Iba1 Rabit polyclonal | Wako | Cat# 019–19741 RRID:AB_839504 | Dilution 1:200 |
| Antibody | anti-MHC-II Rat monoclonal | BD Pharmingen | Cat# 556999 RRID:AB_396545 | Dilution 1:200 |
| Antibody | anti-RPE65 Mouse monoclonal | Millipore | Cat# MAB5428 RRID:AB_571111 | Dilution 1:200 |
| Antibody | anti-VEGFa Rabit polyclonal | Abcam | Cat# ab46154 RRID:AB_2212642 | Dilution 1:200 |
| Antibody | anti-PEDF Rabit polyclonal | Abcam | Cat# ab180711 RRID:AB_2827998 | Dilution 1:200 |
| Commercial assay or kit | Mouse SERPINF1/PEDF ELISA kit | LifeSpan BioSciences | LS-F36110 | |
| Commercial assay or kit | Magnetic Luminex Assay kit for VEGF, PDGF-AA and PDGF-BB | R and D Systems | LXSAMSM-11 | |
| Sequence-based reagent | Vegfa_F | IDT | PCR primers | TGTGCGCAGACAGTGCTCCA |
| Sequence-based reagent | Vegfa_R | IDT | PCR primers | CCTGGGACCACTTGGCATGG |
| Sequence-based reagent | Vegfc_F | IDT | PCR primers | GGGAAATGTGCCTGTGAATG |
| Sequence-based reagent | Vegfc_R | IDT | PCR primers | GTTCAGATGTGGCCTTTTCC |
| Sequence-based reagent | Serpinf1_F | IDT | PCR primers | CACCCAAGTGGAACACAGG |
| Sequence-based reagent | Serpinf_R | IDT | PCR primers | TTAAGTACTACTGGGGTCCA |
| Sequence-based reagent | Rpe65_F | IDT | PCR primers | GCCAATTTACGTGAGAATTGGG |
| Sequence-based reagent | Rpe65_R | IDT | PCR primers | CAGTCCATGGAAGGTCACAG |
| Sequence-based reagent | Lrat_F | IDT | PCR primers | CCGTCCCTATGAAATCAGCTC |
| Sequence-based reagent | Lrat_R | IDT | PCR primers | ATGGGCGACACGGTTTTCC |
| Sequence-based reagent | Rlbp1_F | IDT | PCR primers | GGCACTTTCCGCATGGTT C |
| Sequence-based reagent | Rlbp1_R | IDT | PCR primers | CCGGGTCTCCTCCTTTTCAT |
| Sequence-based reagent | Mitf_F | IDT | PCR primers | CAGCCATAAACGTCAGTGTGC |
| Sequence-based reagent | Mitf_R | IDT | PCR primers | GAGTGAGCATAGCCATAGGGC |
| Sequence-based reagent | Tjp1_F | IDT | PCR primers | GAGAAAGGTGAAACTCTGCTG |
| Sequence-based reagent | Tjp1_R | IDT | PCR primers | GTGGTCAATCAGGACAGAAAC |
| Sequence-based reagent | Pdgfa_F | IDT | PCR primers | GCCAGCCTTCACGGGTCC |
| Sequence-based reagent | Pdgfa_R | IDT | PCR primers | CCTCACATCTGTCTCCTCCT |
| Sequence-based reagent | Pdgfb_F | IDT | PCR primers | CTGCAAGTGTGAGACAGTAG |
| Sequence-based reagent | Pdgfb_R | IDT | PCR primers | CTAGGCTCCGAGGGTCTC |
| Sequence-based reagent | Gapdh_F | IDT | PCR primers | GCCGCCTGGAGAAACCTGCCAA |
| Sequence-based reagent | Gapdh_R | IDT | PCR primers | GGGGTGGGTGGTCCAGGGTTT |
Additional files
Download links
A two-part list of links to download the article, or parts of the article, in various formats.
Downloads (link to download the article as PDF)
Open citations (links to open the citations from this article in various online reference manager services)
Cite this article (links to download the citations from this article in formats compatible with various reference manager tools)
CSF1R blockade induces macrophage ablation and results in mouse choroidal vascular atrophy and RPE disorganization
eLife 9:e55564.
https://doi.org/10.7554/eLife.55564


