Cytoprotection by a naturally occurring variant of ATP5G1 in Arctic ground squirrel neural progenitor cells
- Department of Neurology, University of California-San Francisco, United States
- Cardiovascular Research Institute, University of California-San Francisco, United States
- Department of Physiology, University of California-San Francisco, United States
- Innovative Genomics Institute, United States
Figures
Figure 1 with 1 supplement
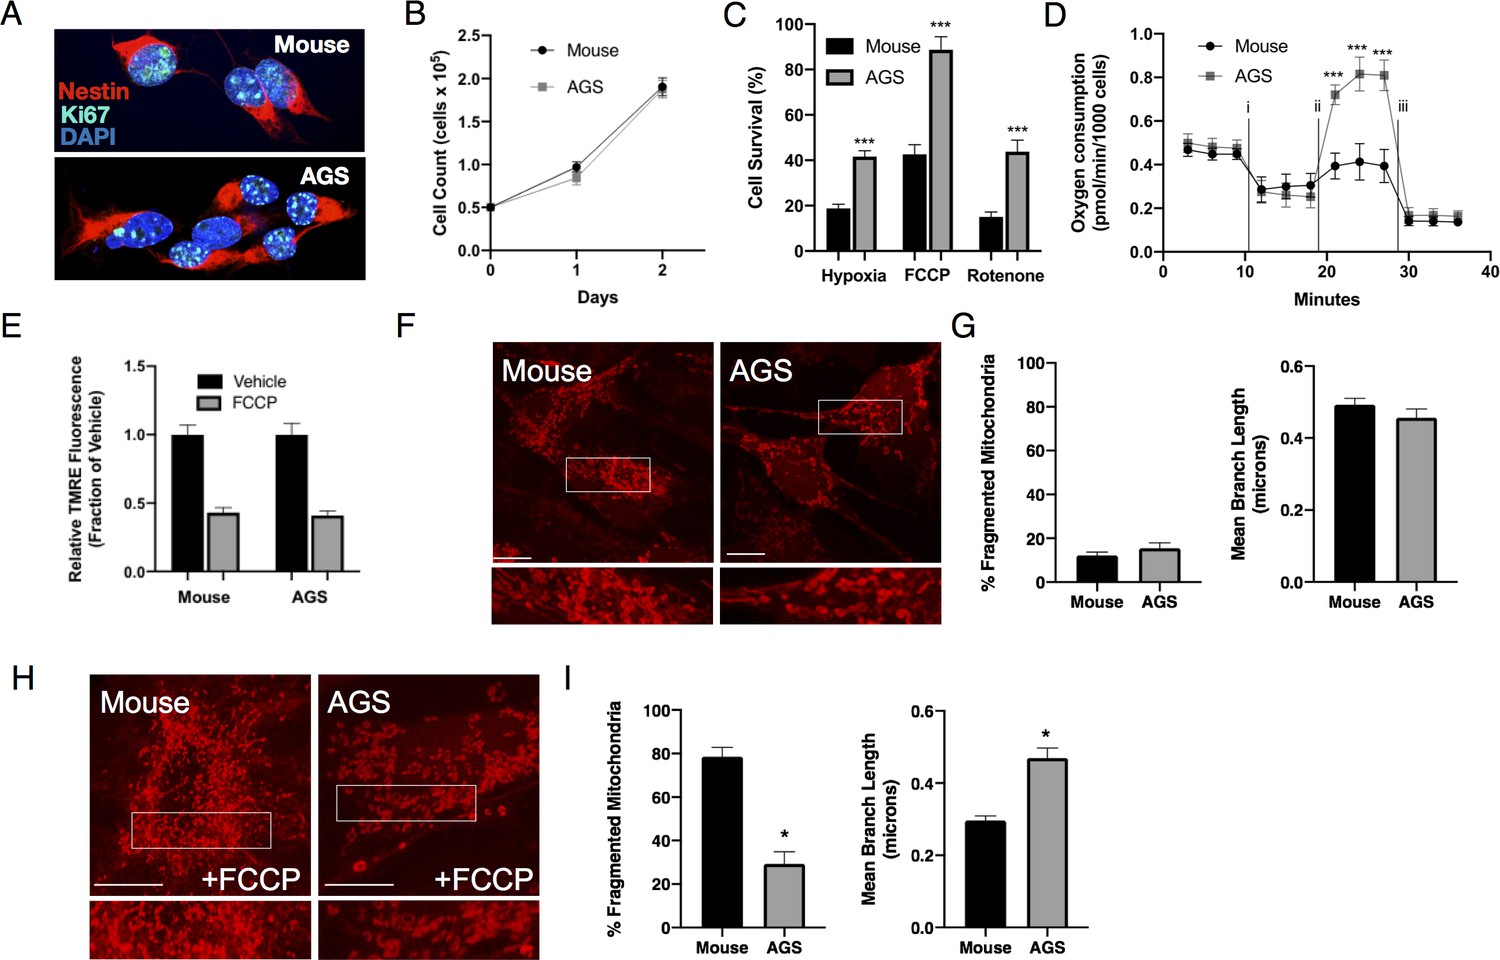
Phenotypic characteristics of Mouse and AGS NPCs.
(A) Confocal image of mouse (top) and AGS (bottom) NPCs demonstrating similar morphology and expression of Nestin (red) and Ki-67 (teal) in nearly all cultured cells of both species. (B) Mouse and AGS NPCs have similar proliferation rates expressed as mean ± SEM of 3 independent experiments where 50,000 NPCs were seeded in a 24-well cell culture plate in triplicate and counted by automated cytometer on two subsequent days (C) AGS NPCs exhibit increased cell survival when exposed to hypoxia (1%, 24 hr), hypothermia (31°C, 24 hr), or rotenone (10 μM, 16 hr). Bar graphs represent the mean ± SEM of 3 independent experiments with three replicates/condition. (D) Seahorse XF analyzer assay of cultured mouse and AGS NPCs sequentially exposed to (i) oligomycin (1 μM), (ii) FCCP (2 μM), and (iii) rotenone/antimycin (0.5 μM) showing enhanced FCCP-stimulated oxygen consumption (spare respiratory capacity). Data represents the mean ± SEM of three independent experiments with 4–6 replicates/species. (E) Relative fluorescence ± SEM of three independent experiments in triplicate each of cultured mouse and AGS NPCs loaded with TMRE (50 nM) exposed to vehicle or FCCP (1 μM) (F) Representative confocal images of mouse (left) and AGS (right) NPCs expressing the mitochondrial marker mCherry-mito7 to demonstrate mitochondrial morphology at baseline (H) and one hour following treatment with 1 μM FCCP. Scale bar represents 10 μm. (G, I) Percent of mitochondria with fragmented morphology (left panel) and the mean branch length (right panel) of mitochondrial networks of NPCs expressing mCherry-mito7. Data obtained from 30 cells/species/condition. *p<0.05; ***p<0.001.
Figure 1—figure supplement 1
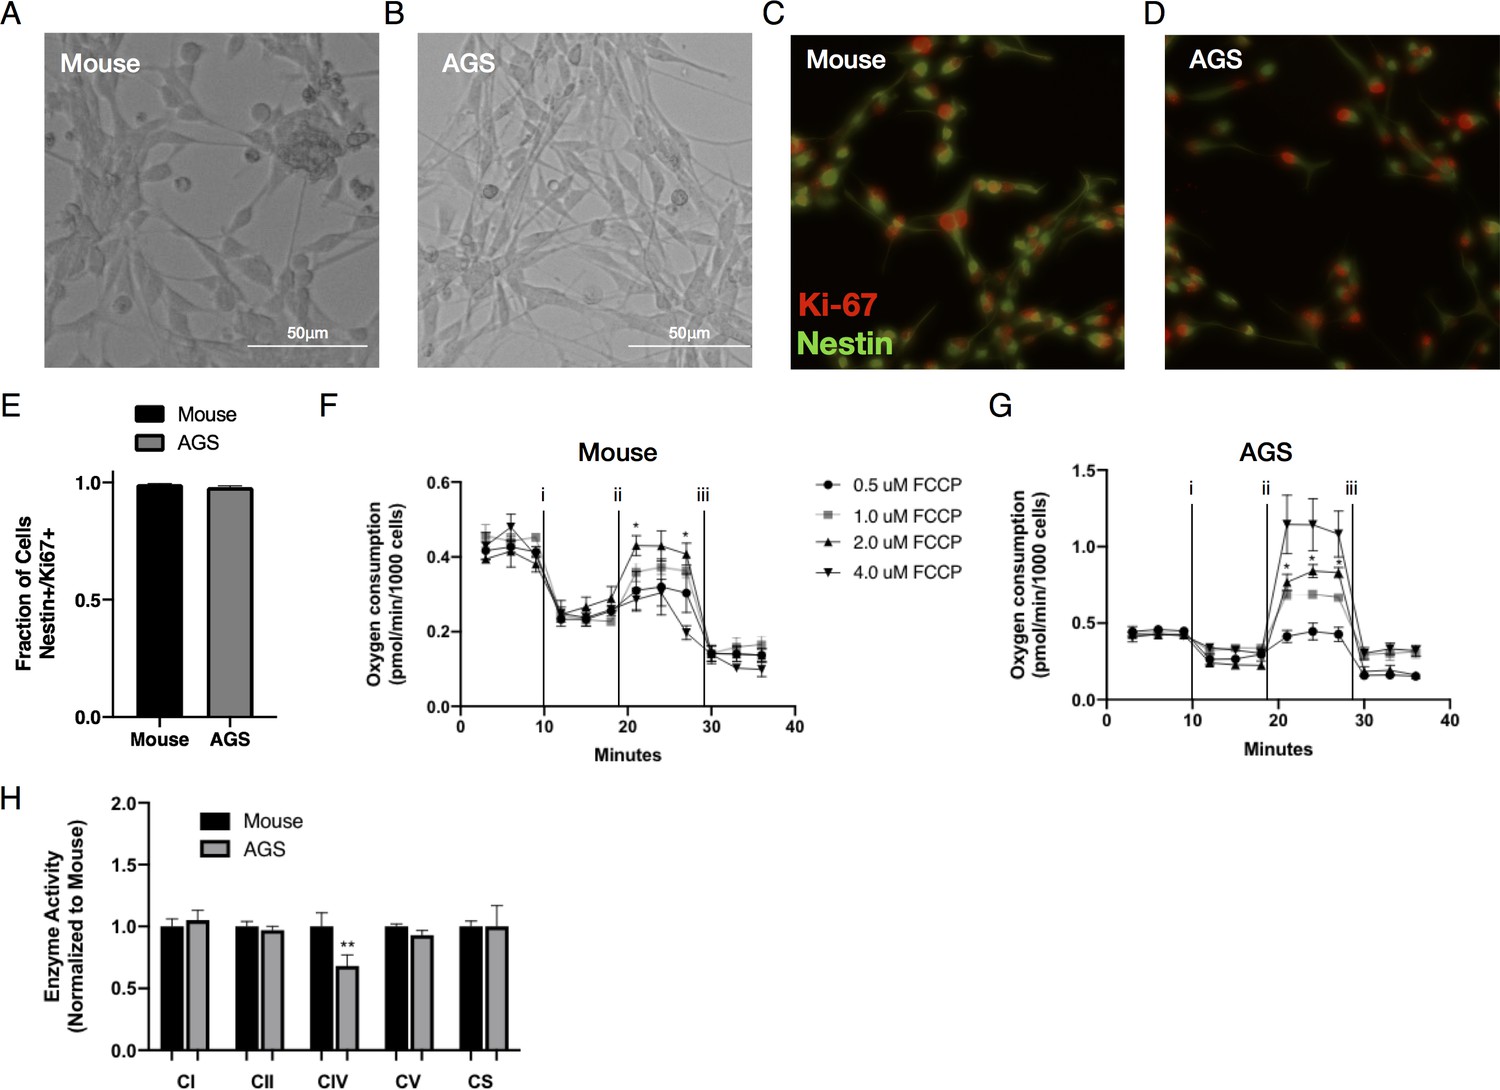
Mouse and AGS NPCs express Nestin and Ki-67 and additional metabolic phenotypic data.
(A–B) Representative live brightfield microscopy image of mouse and AGS NPCs. (C–D) Representative fluorescent microscopy images of fixed mouse and AGS NPCs immunolabeled with Nestin (green) and Ki-67 (red). (E) Quantitative assessment of mouse and AGS NPCs demonstrates that nearly all cells express both Nestin and Ki-67. Cell counts ± SEM from 25 microscopic fields/cell line. Seahorse XF analyzer FCCP dose response assay of cultured mouse (F) and AGS (G) NPCs sequentially exposed to (i) oligomycin (1 μM), (ii) increasing doses of FCCP (0.5–4 μM), and (iii) rotenone/antimycin (0.5 μM) showing enhanced FCCP-stimulated oxygen consumption with optimal dosage without toxicity or heterogeneous response of 2 μM for both mouse and AGS NPCs. Data represents the mean ± SEM of 1 experiment with 3–5 replicates/dose. *p<0.05 for 2 μM vs 0.5 μM FCCP dose. (H) Enzymatic activity of Complex I, II, IV, V, and citrate synthase (CS) in mouse and AGS NPCs measured from mitochondrial extracts of NPCs and normalized to protein content. Data are the mean ± SEM of three independent experiments expressed as a fraction of mouse enzymatic activity. **p<0.01 vs mouse.
Figure 2 with 1 supplement
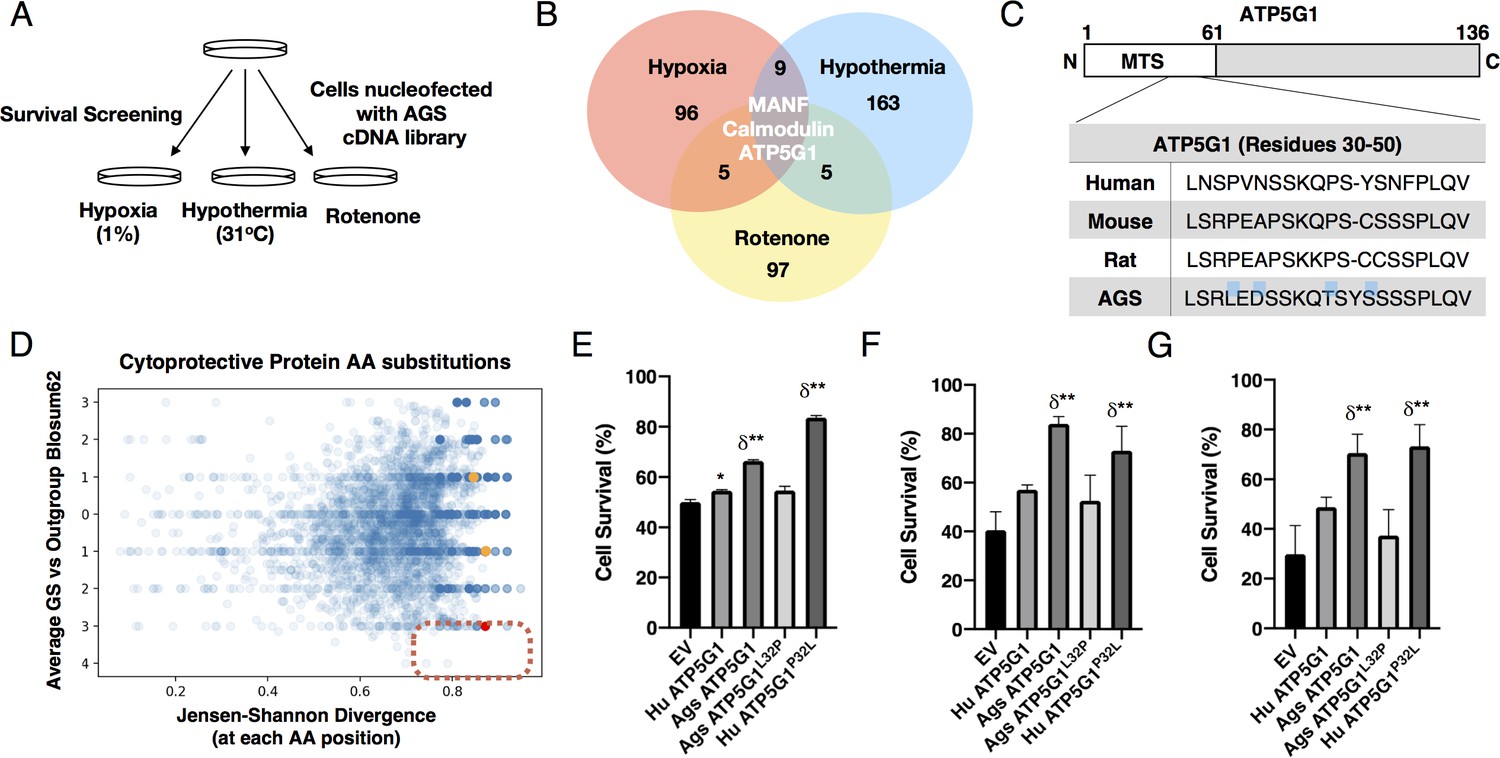
AGS cDNA library survival screen identifies AGS ATP5G1 as a cytoprotective factor.
(A) AGS NPC cDNA was introduced into mouse NPCs by nucleofection. Cells were screened for survival after exposure to hypoxia (1%, 48 hr), hypothermia (31°C, 72 hr), or rotenone (20 μM, 48 hr) to identify AGS cytoprotective factors. (B) Venn-diagram demonstrating the number of cytoprotective proteins identified by next-generation sequencing of plasmids isolated from cells surviving each condition of the cDNA library screen. (C) Truncated sequence alignments demonstrating key GS AA substitutions (blue highlight) for ATP5G1, one of the three proteins imparting survival in all three screens. (D) Ground squirrel-unique amino acid substitutions are plotted as a function of BLOSUM62 score and Jensen-Shannon Divergence (JSD) score. Ground squirrel-unique AA substitutions with the highest probability of functional consequence are in the denoted red quadrant (top 1% scoring of high JSD values and low BLOSUM62 scores). The red dot represents the ATP5G1L32P substitution; orange dots represent two other ATP5G1 substitutions. (E–G) Mouse NPCs expressing human ATP5G1, AGS ATP5G1, AGS ATP5G1L32P, human ATP5G1 P32L, or empty vector (EV) and exposed to 24 hr of 1% O2 (E), 31°C (F), or 20 μM rotenone (G). Cell death was determined by flow cytometry for propidium iodide and experiments are mean ± SEM of three independent experiments with three replicates/genotype/condition, *p<0.05 or **p<0.01 vs EV; δ <0.05 vs human ATP5G1.
Figure 2—figure supplement 1
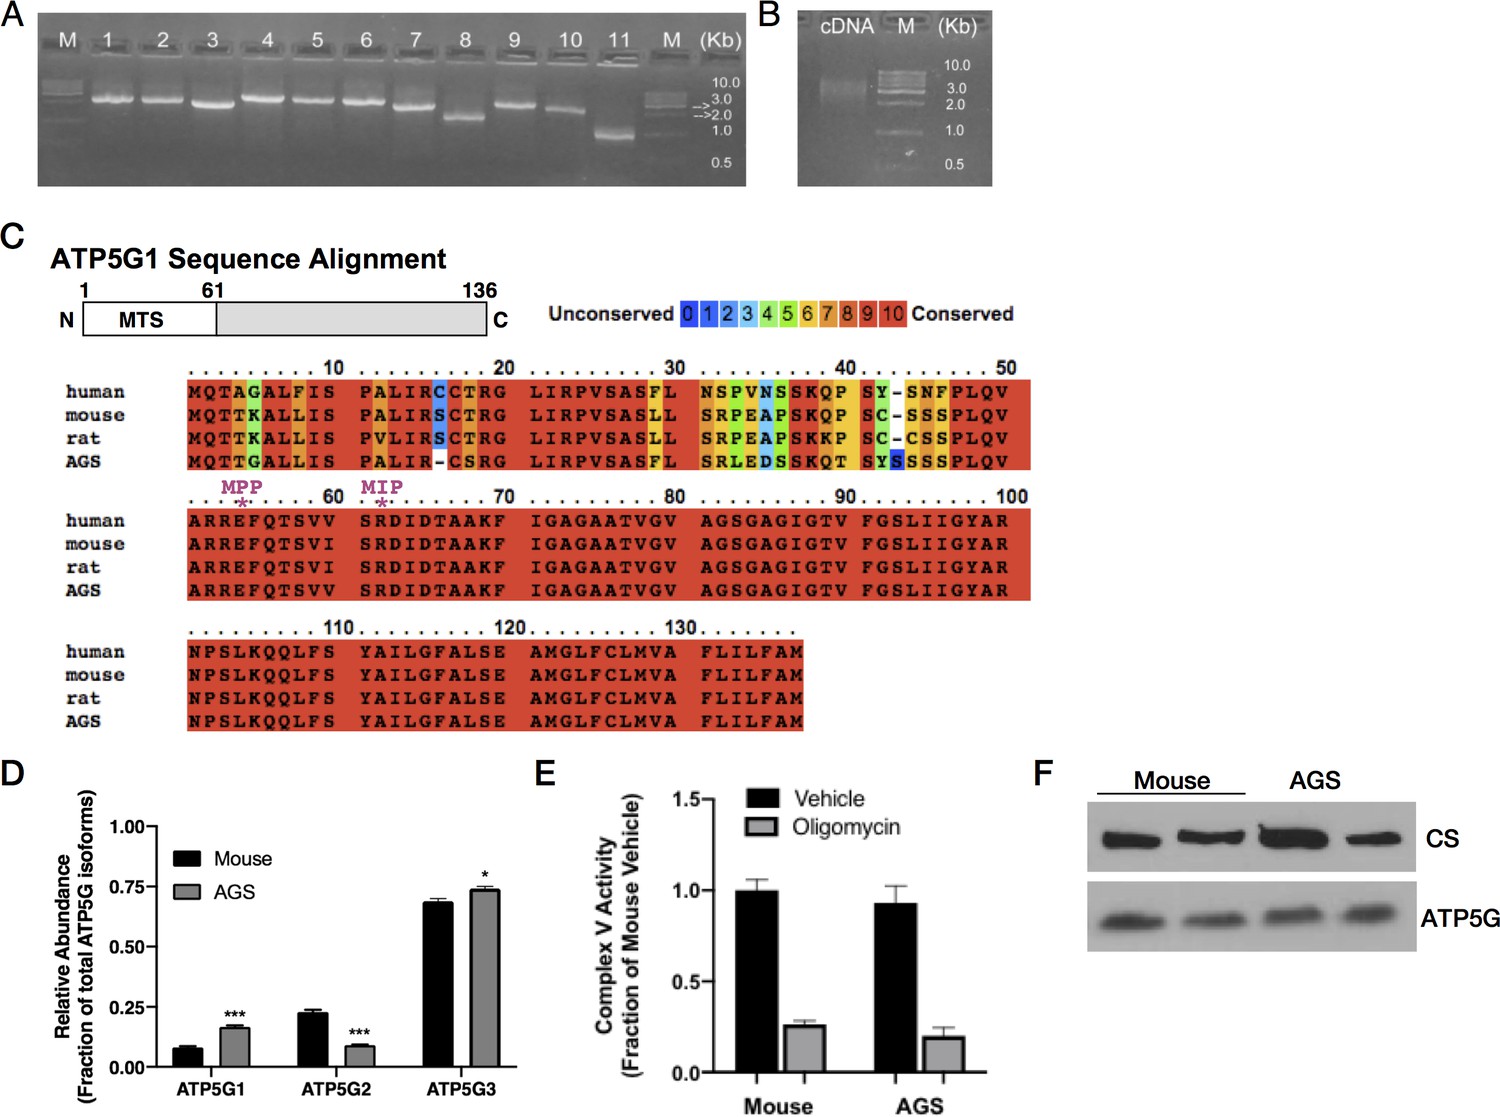
cDNA library construction and ATP5G expression in mouse and AGS NPCs.
(A) Agarose gel image of 11 randomly chosen AGS cDNA library clones prior to amplification demonstrating an average insert size of 2.4 kB. (B) Agarose gel image of amplified and normalized AGS cDNA library. (C) ATP5G1 sequence alignment in human, mouse, AGS, and rat demonstrating variability in the mitochondrial targeting sequence (alignment visualized using PRALINE, http://www.ibi.vu.nl/programs/pralinewww/). The * indicates putative mitochondrial processing peptide (MPP) and mitochondrial intermediate peptide (MIP) cleavage sites. (D) qRT-PCR for ATP5G1, ATP5G2, and ATP5G3 demonstrating increased relative abundance of ATP5G1 in AGS NPCs. Data ± SEM from four independent experiments performed in triplicate. *p<0.05***p<0.001. (E) Mouse and AGS mitochondrial extract Complex V enzymatic activity treated with vehicle or oligomycin (1 μM) normalized to protein content. Data are the mean ± SEM of 3 independent experiments expressed as a fraction of mouse enzymatic activity. (F) Representative SDS-PAGE western blots for citrate synthase (CS) and ATP5G of mouse and AGS mitochondrial extracts demonstrate similar ATP5G expression levels.
Figure 3 with 3 supplements
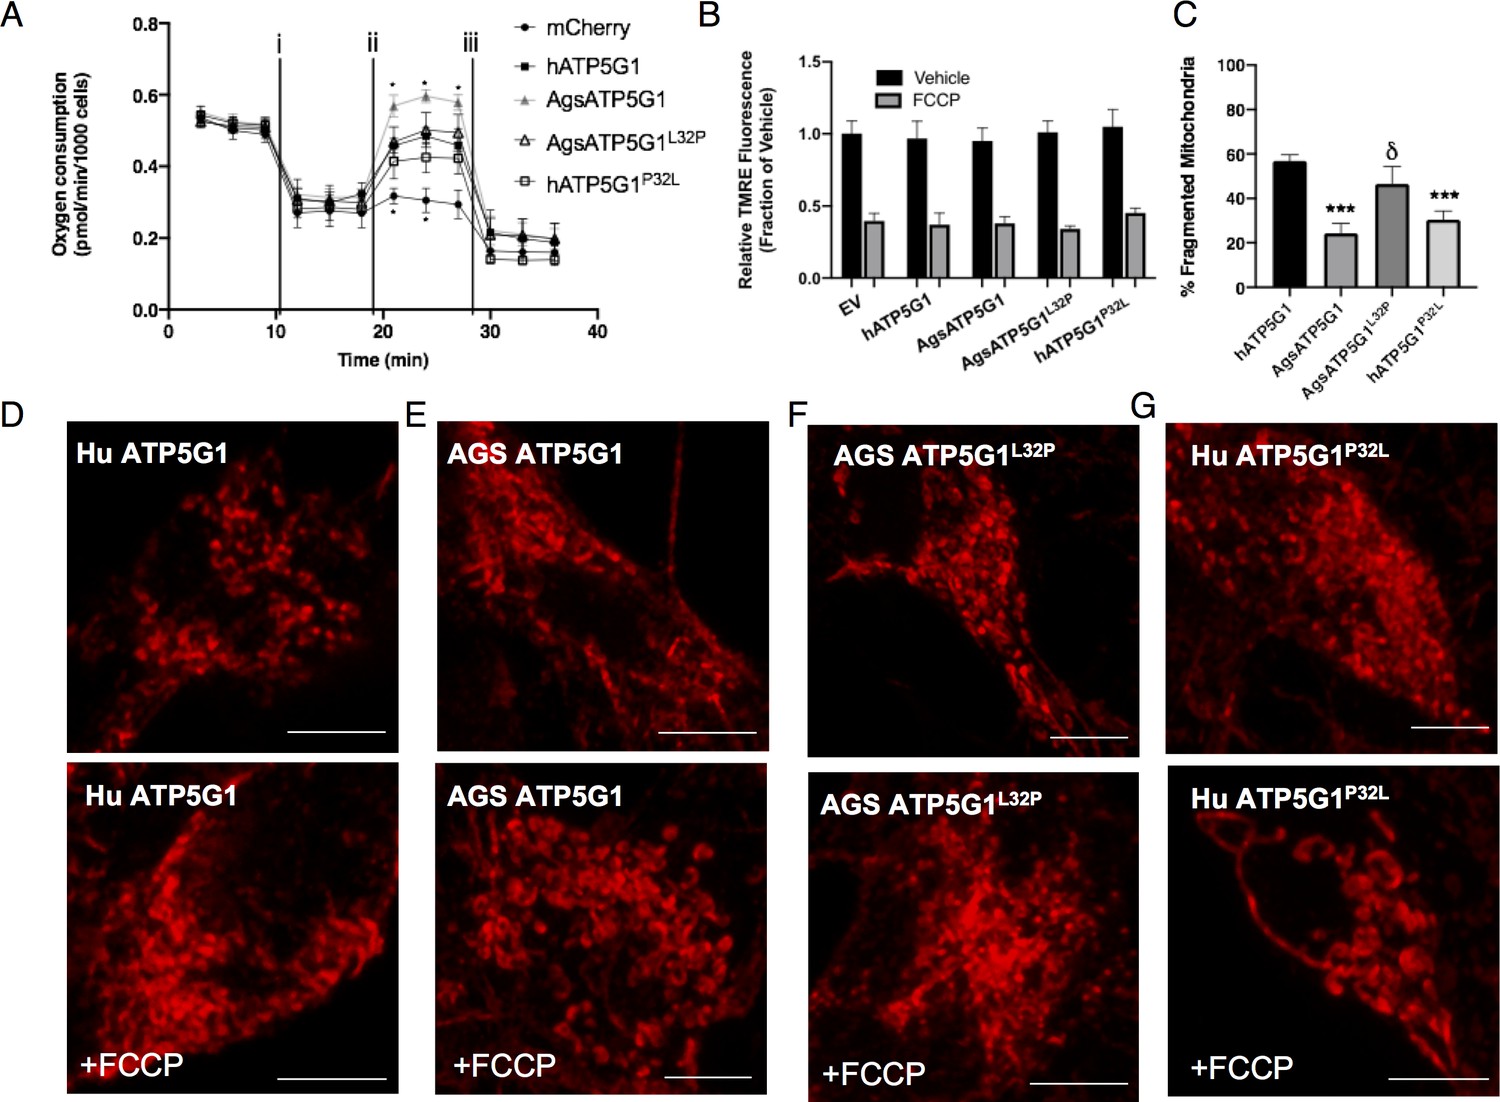
Overexpression of AGS ATP5G1 in mouse NPCs recapitulates AGS metabolic phenotypes, which is dependent on the uniquely evolved leucine-32.
(A) Seahorse XF analyzer assay of cultured mouse NPCs expressing human ATP5G1, AGS ATP5G1, AGS ATP5G1L32P, human ATP5G1P32L, or empty vector and sequentially exposed to (i) oligomycin (1 μM), (ii) FCCP (2 μM), and (iii) rotenone/antimycin (0.5 μM) showing increased FCCP-stimulated oxygen consumption (spare respiratory capacity) with AGS ATP5G1. Substitution of the AGS leucine-32 results in reduced spare respiratory capacity. Data represents the mean + SEM of three independent experiments with 4–6 replicates/species. (B) Relative fluorescence ± SEM of three independent experiments in triplicate each of cultured mouse NPCs stably expressing the indicated ATP5G1 construct, loaded with TMRE (50 nM), and exposed to vehicle or FCCP (1 μM) (C) Percent ± SEM fragmented mitochondria and representative confocal images (D-G) of mitochondrial networks in mouse NPCs expressing human, AGS, and mutant forms of mCherry-ATP5G1 one hour following treatment with vehicle (top panel) or 1 μM FCCP (bottom panel). Data obtained from 30 cells/condition. *p<0.05; ***p<0.001 vs. human ATP5G1; δ <0.05 vs AGS ATP5G1. Scale bars represent 5 μm.
Figure 3—figure supplement 1
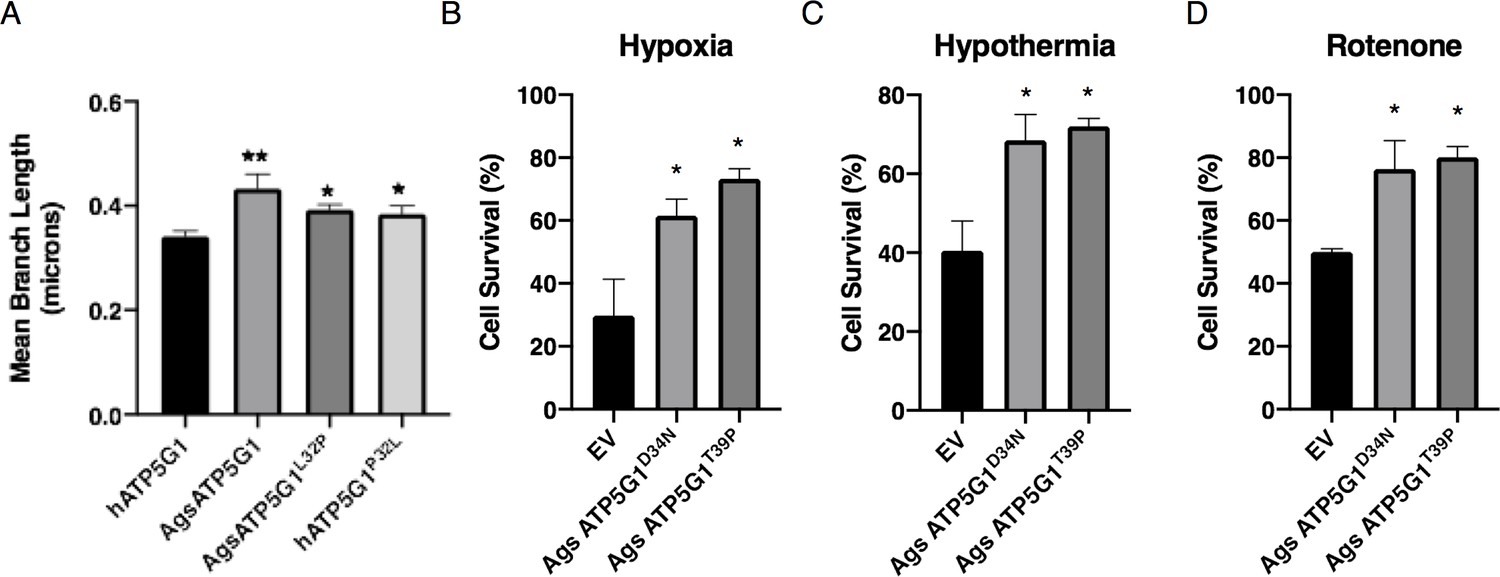
Additional data for overexpression of AGS ATP5G1 in mouse NPCs recapitulating AGS metabolic phenotypes, which is dependent on the uniquely evolved leucine-32.
(A) Mean branch length of mitochondrial networks of mouse NPCs expressing mCherry-ATP5G1 variants from Figure 3D–G. Bar graph represents mean ± SEM from automated processing of 30 cells/cell line. (B–D) Mouse NPCs expressing mutant AGS ATP5G1 isoforms (ATP5G1D34N, ATP5G1T39P) or empty vector (EV) and exposed to 24 hr of 1% O2 (B), 31°C (C), or 20 mM rotenone (D). Bar graphs represent mean ± SEM from three independent experiments with three replicates/cell line/condition, *p<0.05 vs EV; **p<0.01.
Figure 3—figure supplement 2
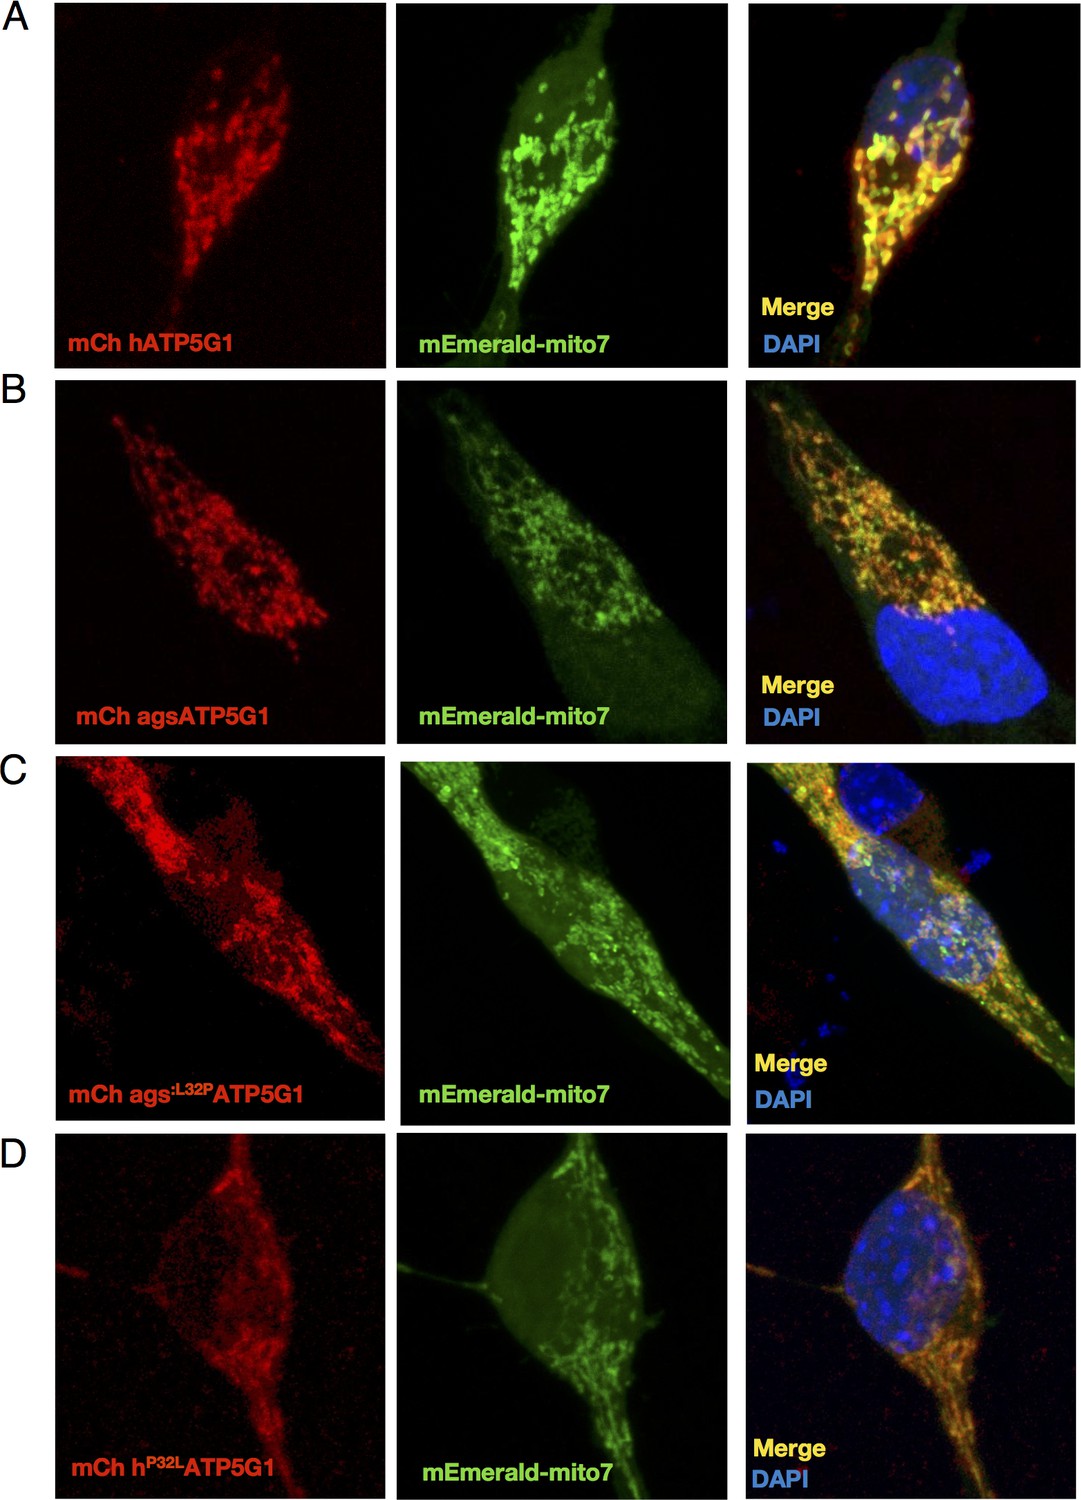
Human and AGS ATP5G1 constructs are appropriately targeted to the mitochondria of mouse NPCs.
(A-D) Confocal imaging of mouse NPCs transiently expressing mEmerald-mito7 and the indicated mCherry-ATP5G1 constructs demonstrate appropriate mitochondrial localization of the human, AGS, and substituted isoforms of ATP5G1.
Figure 3—figure supplement 3
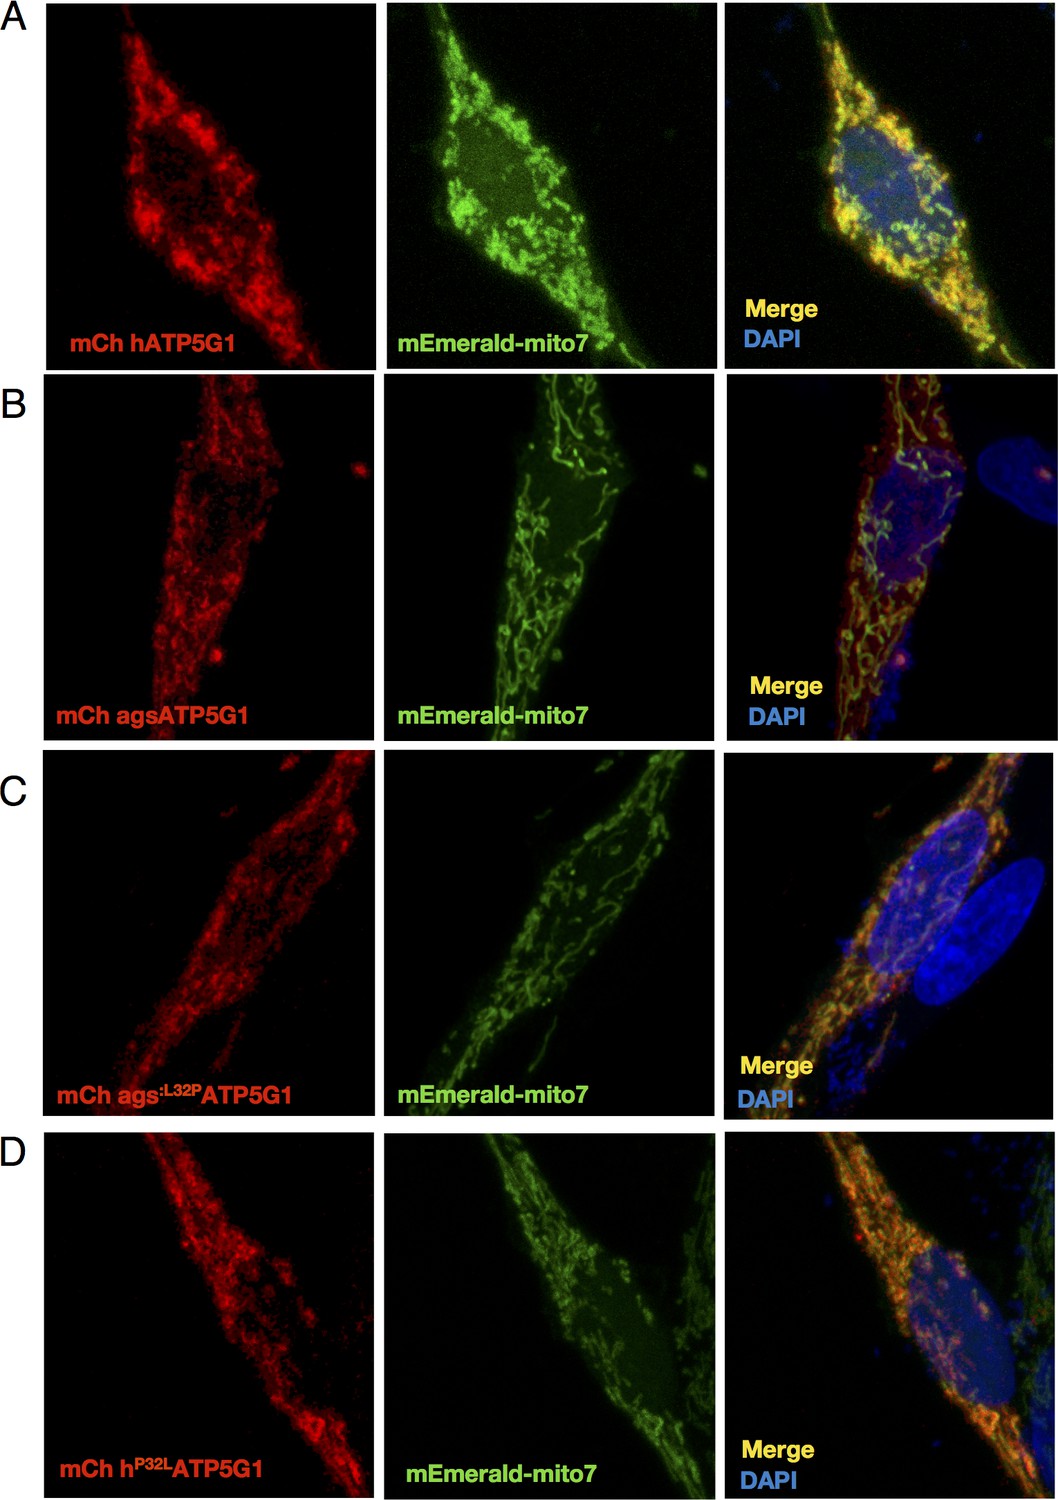
Human and AGS ATP5G1 constructs are appropriately targeted to the mitochondria of AGS NPCs.
(A-D) Confocal imaging of AGS NPCs transiently expressing mEmerald-mito7 and the indicated mCherry-ATP5G1 constructs demonstrate appropriate mitochondrial localization of the human, AGS, and substituted isoforms of ATP5G1.
Figure 4 with 1 supplement
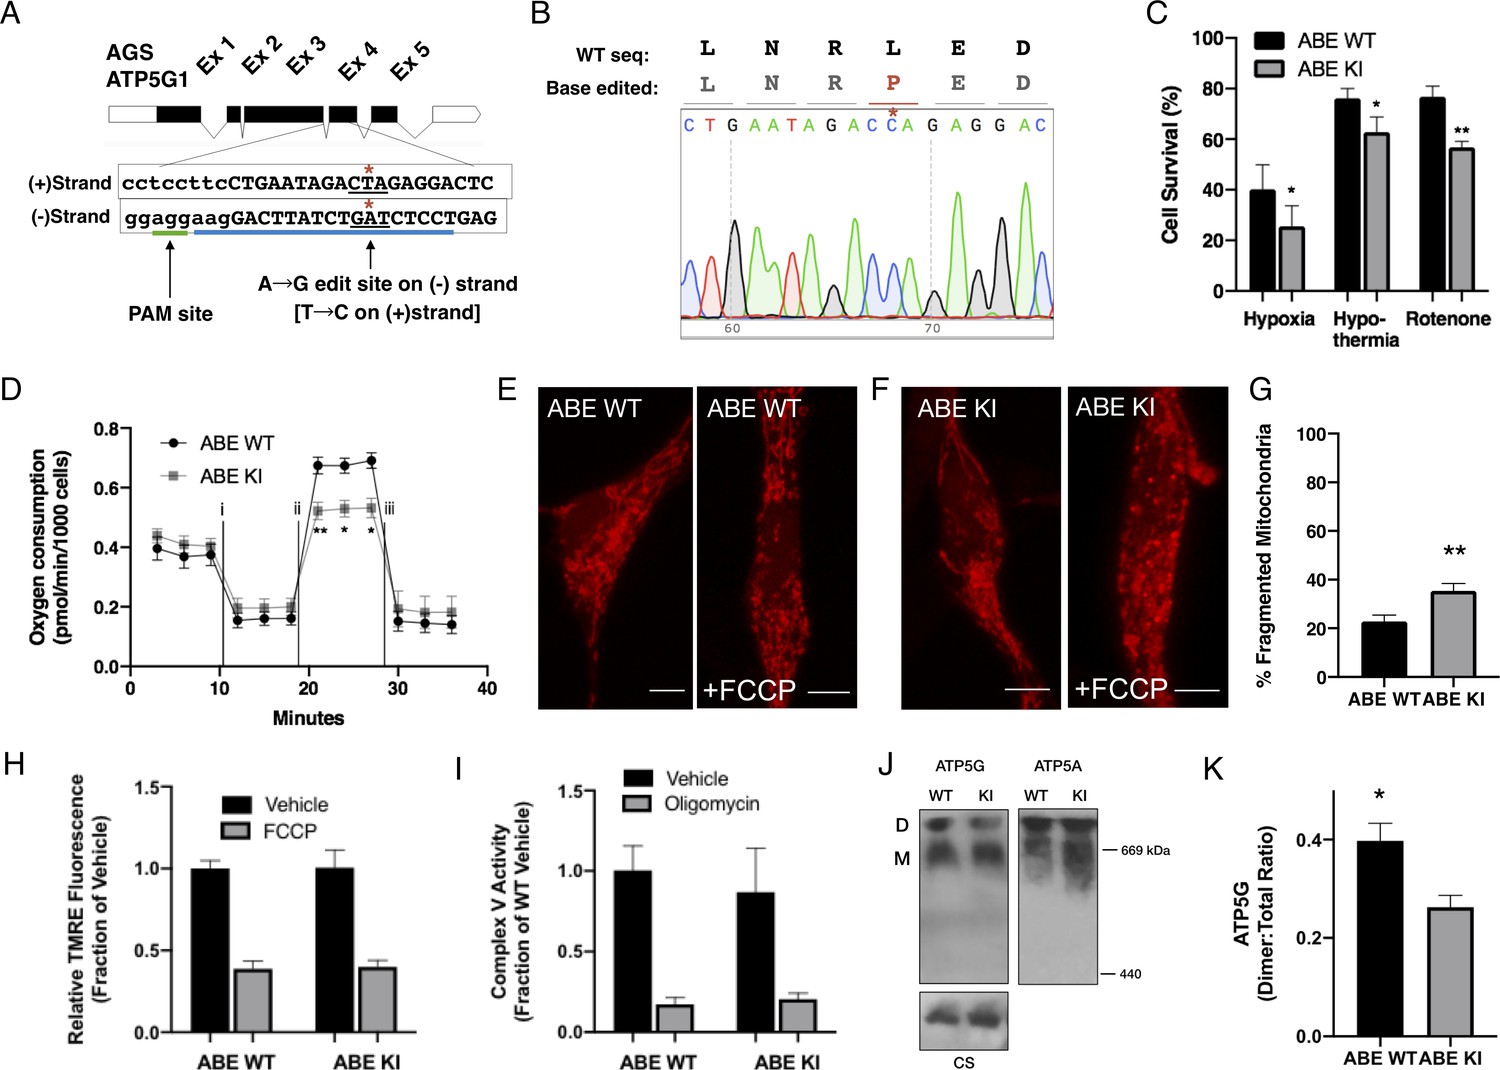
CRISPR base editing to generate ATP5G1L32P AGS NPCs results in a partial loss of AGS metabolic resilient phenotypes.
(A) AGS ATP5G1 CRISPR base editing strategy. To create AGS cells with the human amino acid substitution at leucine-32, AGS cells transiently expressing ABEmax were nucleofected with an sgRNA (blue underline) directed toward a PAM site (green underline) on the (-) strand to target conversion of adenine to guanine, which on the (+) strand is a cytosine-to-thymine (*). (B) Sequencing data from a successfully edited clonal AGS cell line demonstrating the cytosine-to- thymine base edit resulting in the desired leucine to proline knock-in cell line. (C) AGS ATP5G1L32P (ABE KI) NPCs exhibit decreased cell survival compared to unedited AGS cells (ABE WT) when exposed to hypoxia (1%, 24 hr), hypothermia (31°C, 72 hr), or rotenone (10 μM, 16 hr). Bar graphs represent the mean ± SEM of three independent experiments with three replicates/condition. (D) Seahorse XF analyzer assay of cultured ABE KI and WT cells sequentially exposed to (i) oligomycin (1 μM), (ii) FCCP (2 μM), and (iii) rotenone/antimycin (0.5 μM) showing enhanced FCCP-stimulated oxygen consumption (spare respiratory capacity). Data represents the mean ± SEM of 3 independent experiments with 4–6 replicates/species. (E and F) Representative confocal images of ABE WT (E) and ABE KI (F) NPCs expressing the mitochondrial marker mCherry-mito7 to demonstrate mitochondrial morphology one hour following treatment with FCCP. Scale bar represents 5 μm. (G) Percent of mitochondria ± SEM with fragmented morphology, data obtained from 50 to 60 cells/genotype. (H) Relative fluorescence ± SEM of 3 independent experiments in triplicate each of cultured ABE AGS NPCs loaded with TMRE (50 nM) and exposed to vehicle or FCCP (1 μM). (I) Complex V enzymatic activity normalized to protein content of ABE WT and KI mitochondrial extracts normalized to protein content and treated with vehicle or oligomycin (1 μM). Data are the mean ± SEM of 3 independent experiments expressed as a fraction of ABE WT enzymatic activity. (J) Representative immunoblots for ATP5G (left), ATP5A (right), or citrate synthase (CS, left, input control) of clear-native gel electrophoresis of mitochondrial extracts from ABE WT and ABE demonstrate ATP synthase dimers (D) and monomers (M). (K) Quantification of ATP5G demonstrates a reduction in ATP synthase dimers relative to total ATP synthase protein (D:(D+M) ratio) in ABE KI. Data are mean ± SEM of 3 independent blots. *p<0.05; **p<0.01.
Figure 4—figure supplement 1

Additional data for ABE cell lines.
(A) Sequencing data from an unsuccessfully edited clonal AGS cell line demonstrating the preservation of the wild-type sequence (* indicates wild-type thymidine). (B) qRT-PCR for ATP5G1, ATP5G2, and ATP5G3 demonstrating the same relative abundance of ATP5G1 in ABE WT and ABE KI NPCs. Data are means ± SEM from three independent experiments performed in triplicate. (C) Mean branch length of mitochondrial networks of ABE AGS NPCs expressing mCherry-mito7. Data obtained from 30 cells/genotype. (D) Representative western blot images and (E) quantification demonstrating the relative abundance of ATP5G and ATP5A proteins are similar in ABE WT and ABE KI cells. Quantification of western blots from four independent experiments with 2–3 replicates each. **p<0.01.
Tables
Table 1
Species-specific primers used in quantitative RT-PCR.
| Mouse | |
|---|---|
| Rpl27 Forward | ATA AGA ATG CGG CCG CAA GC |
| Rpl27 Reverse | ATC GAT TCG CTC CTC AAA CTT |
| Atp5g1 Forward | TGC AGA CCA CCA AGG CAC TG |
| Atp5g1 Reverse | GGC CTC TGG TCT GCT CAG GA |
| Atp5g2 Forward | CGT CTC TAC CCG CTC CCT GA |
| Atp5g2 Reverse | CTG CAG ACA GCG GAC GAC TC |
| Atp5g3 Forward | GGG CCC AGA ATG GTG TGT GT |
| Atp5g3 Reverse | TGC AGC ACC TGC ACC AAT GA |
| AGS | |
| Rpl27 Forward | CTG CCA TGG GCA AGA AGA AA |
| Rpl27 Reverse | AGC AGG GTC TCT GAA GAC AT |
| Atp5g1 Forward | TCC GGC TCT GAT CCG CTG TA |
| Atp5g1 Reverse | GGG AGC TGC TGC TGT AGG AA |
| Atp5g2 Forward | TGC CTG CTC CAG GTT CCT CT |
| Atp5g2 Reverse | GGG ACT GCC AAG CTG CTG AA |
| Atp5g3 Forward | TGA GGC CCA GAA TGG TGA ACG |
| Atp5g3 Reverse | CAG CAC CAG AAC CAG CCA CT |
Additional files
-
Supplementary file 1
Cytoprotective AGS genes identified from AGS cDNA screens in mouse NPCs exposed to hypoxia, hypothermia, or rotenone.
- https://cdn.elifesciences.org/articles/55578/elife-55578-supp1-v2.xlsx
-
Supplementary file 2
Ground squirrel-unique amino acid substitutions identified from the cytoprotective screened genes and associated Jensen-Shannon Divergence and BLOSUM-62 scores.
- https://cdn.elifesciences.org/articles/55578/elife-55578-supp2-v2.xlsx
-
Transparent reporting form
- https://cdn.elifesciences.org/articles/55578/elife-55578-transrepform-v2.docx
Download links
A two-part list of links to download the article, or parts of the article, in various formats.
Downloads (link to download the article as PDF)
Open citations (links to open the citations from this article in various online reference manager services)
Cite this article (links to download the citations from this article in formats compatible with various reference manager tools)
Cytoprotection by a naturally occurring variant of ATP5G1 in Arctic ground squirrel neural progenitor cells
eLife 9:e55578.
https://doi.org/10.7554/eLife.55578


