Multi-state recognition pathway of the intrinsically disordered protein kinase inhibitor by protein kinase A
- Department of Biochemistry, Molecular Biology, and Biophysics, University of Minnesota, United States
- Department of Chemistry and Supercomputing Institute, University of Minnesota, United States
- Shenzhen Bay Laboratory, China
- Department of Chemistry, Bethel University, United States
- DIBAF, University of Tuscia, Largo dell' Università, Italy
- School of Chemical Biology and Technology, Beijing University Graduate School, China
- Department of Pharmacology and Toxicology, University of Utah, United States
- Department of Chemistry and Biochemistry and Pharmacology, University of California, San Diego, United States
Figures
Figure 1
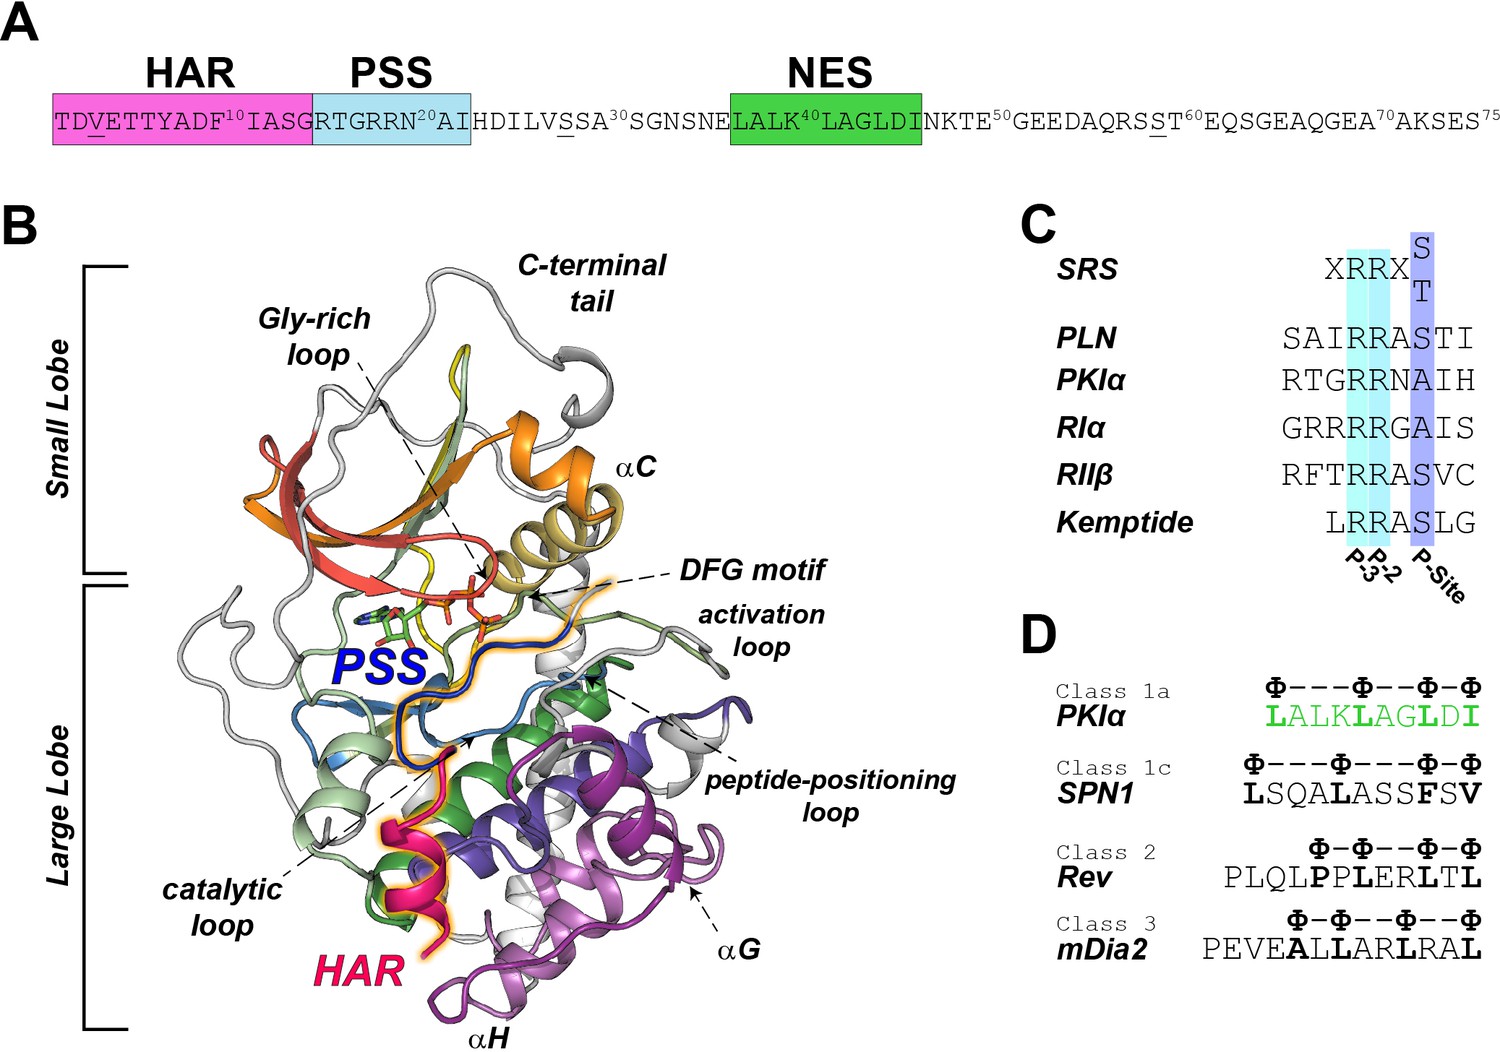
PKIα primary sequence, homology, and complex with PKA-C.
(A) Primary sequence of PKIα, featuring the high affinity region (HAR), the pseudo-substrate region (PSS), and the nuclear export signal (NES). (B) X-ray structure of the PKA-C/ATP/PKI5-24 ternary complex featuring only part of the HAR sequence and the PSS motif (PDB ID: 1ATP; Knighton et al., 1991a). PKA-C secondary structure elements are color-coded using Hanks and Hunter definition (Hanks et al., 1988). (C) Comparison of the substrate recognition sequences (SRS) for different PKA-C substrates, including PKIα, Kemptide, phospholamban (PLN), and the regulatory subunit RIα and RIIβ. D. NES sequences from different proteins (Fung et al., 2015; Fung et al., 2017).
Figure 2 with 1 supplement
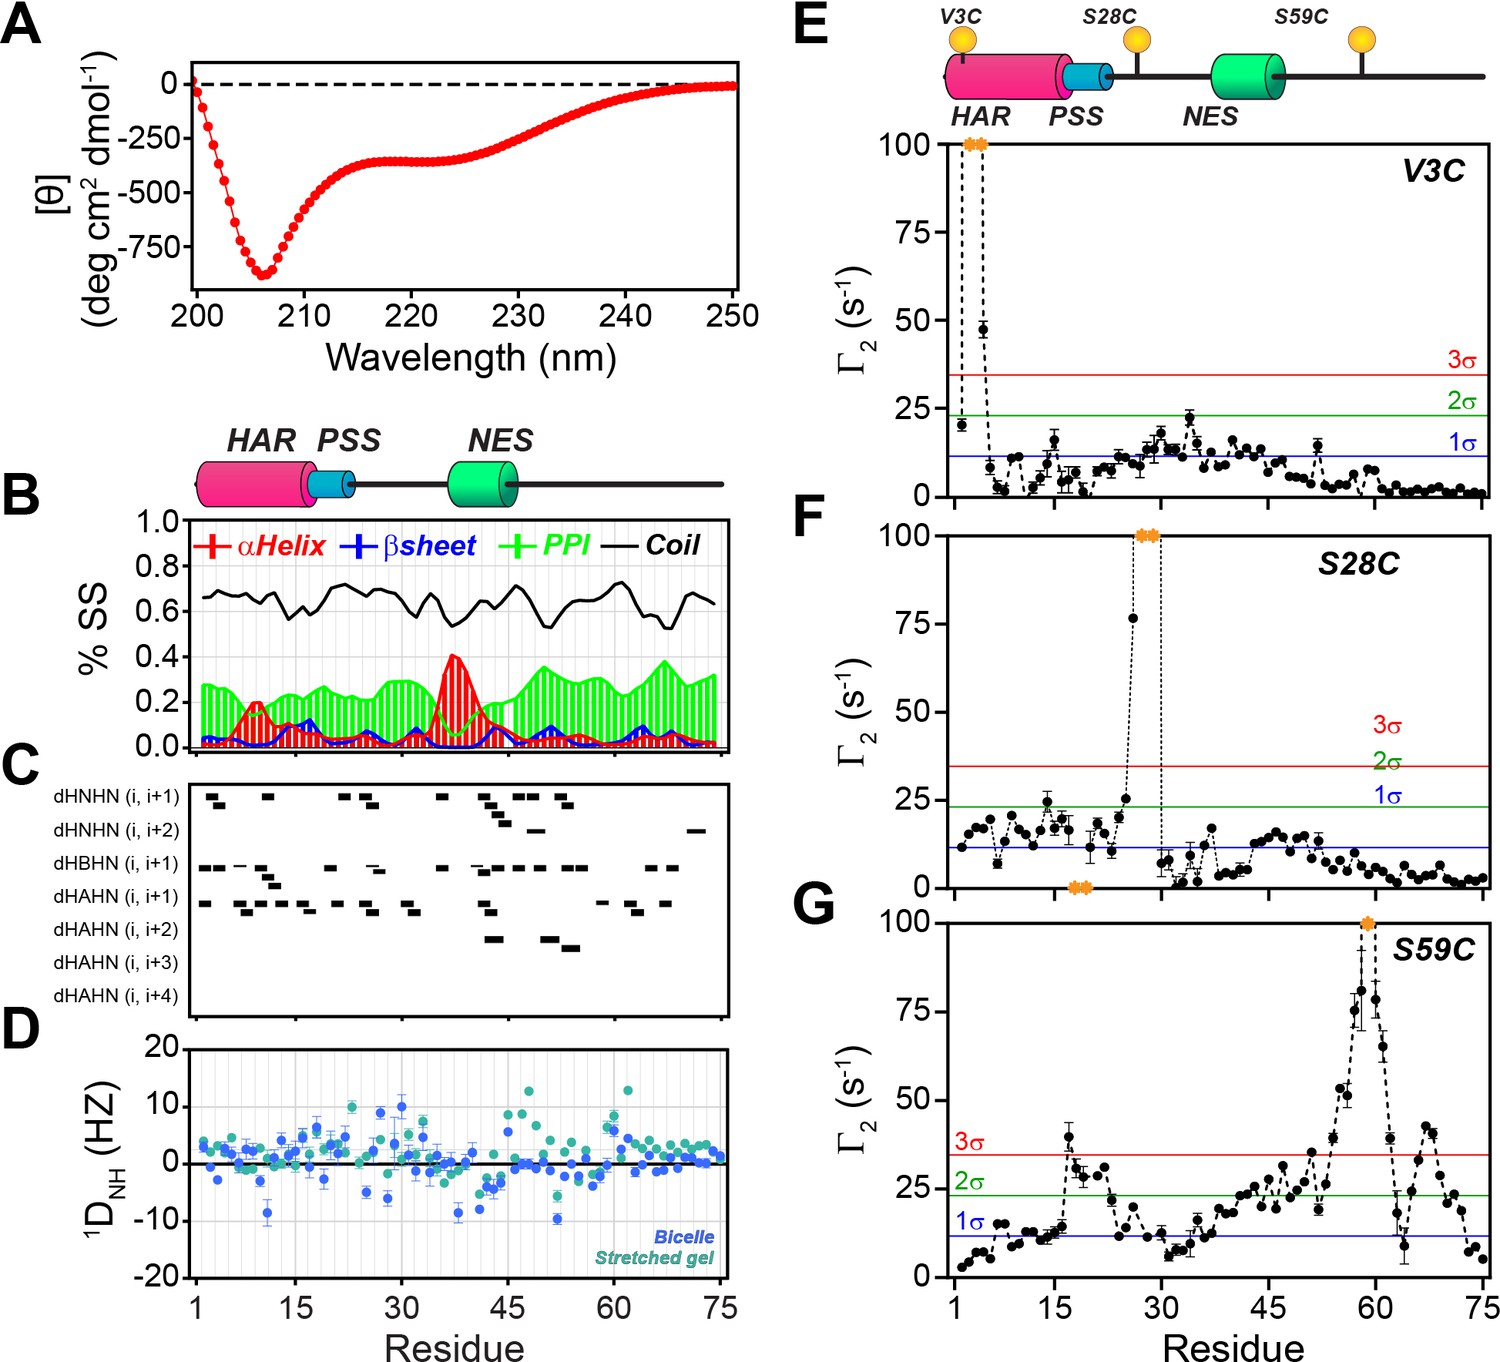
PKIα is an intrinsically disordered protein with transient tertiary contacts.
(A) Far-UV circular dichroism (CD) spectrum of PKIα acquired at 25°C in native condition showing the typical CD profile for IDPs, with a minimum around 208 nm (Wicky et al., 2017; Chemes et al., 2012; Silvers et al., 2012). (B) Secondary structure content for free PKIα as determined from NMR chemical shifts using δ2D program (Camilloni et al., 2012). Note that the program neglects to calculate values for the first and last residues. (C) Plots of the [1H,1H] NOEs derived from the analysis of [1H,15N] NOESY-HSQC experiment. (E) Residual dipolar couplings (RDCs) for PKIα aligned in stretched polyacrylamide gels and 5% bicelles (q = 3.5). The oscillations around zero of the 1DNH values confirm the absence of a defined structure. (E-F) Intra-molecular 1H- Γ2-PRE measurements of the three cysteine mutants of PKIα (Iwahara et al., 2007). For these experiments, a delay of 10 ms was used to calculate the intra-molecular 1H- Γ2-PRE effects. The yellow spheres on the schematic of PKIα (B panel) indicate the location of the cysteine mutations. The yellow dots in each graph indicate those residues broadened beyond detection. The horizontal lines indicate one (blue), two (green), and three (red) standard deviations (σ) from the mean PRE.
Figure 2—figure supplement 1
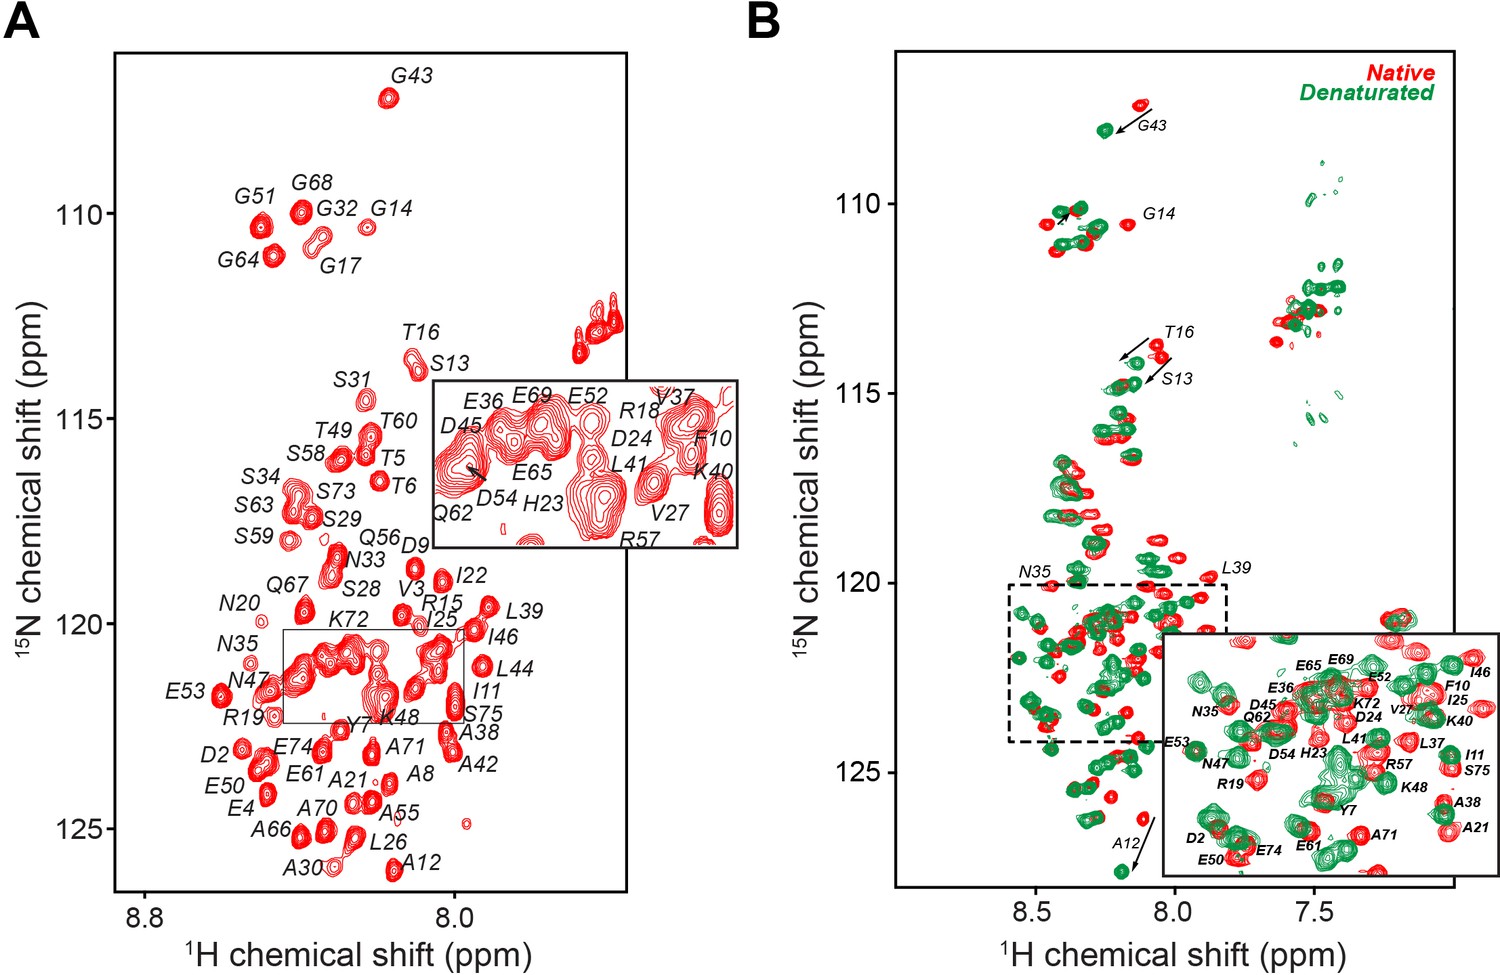
PKIα is an intrinsically disordered protein.
(A) [1H,15N]-Heteronuclear single quantum correlation (HSQC) spectrum of PKIα free form with resonance assignment. The protein fingerprint features a poor resonance dispersion clustered around eight ppm in the 1H dimension, typical of intrinsically disordered proteins (Dyson and Wright, 2004; Mittag et al., 2010). (B) [1H,15N]-HSQC spectra of PKIα in native (red) and denatured (green) conditions. Addition of 8 M urea to the NMR sample did not cause substantial chemical shift perturbations (CSP) with the exception of a few resonances in the N-terminal moiety and the NES motif, confirming the presence of only weak secondary structural elements. The experiments were performed using a 600 MHz Avance-Neo Bruker spectrometer equipped with a TCI probe on a 0.2 mM U-15N-PKIα sample. All the experiments were acquire using 32 scans, 1024 (1H) and 64 (15N) complex points.
Figure 3 with 2 supplements
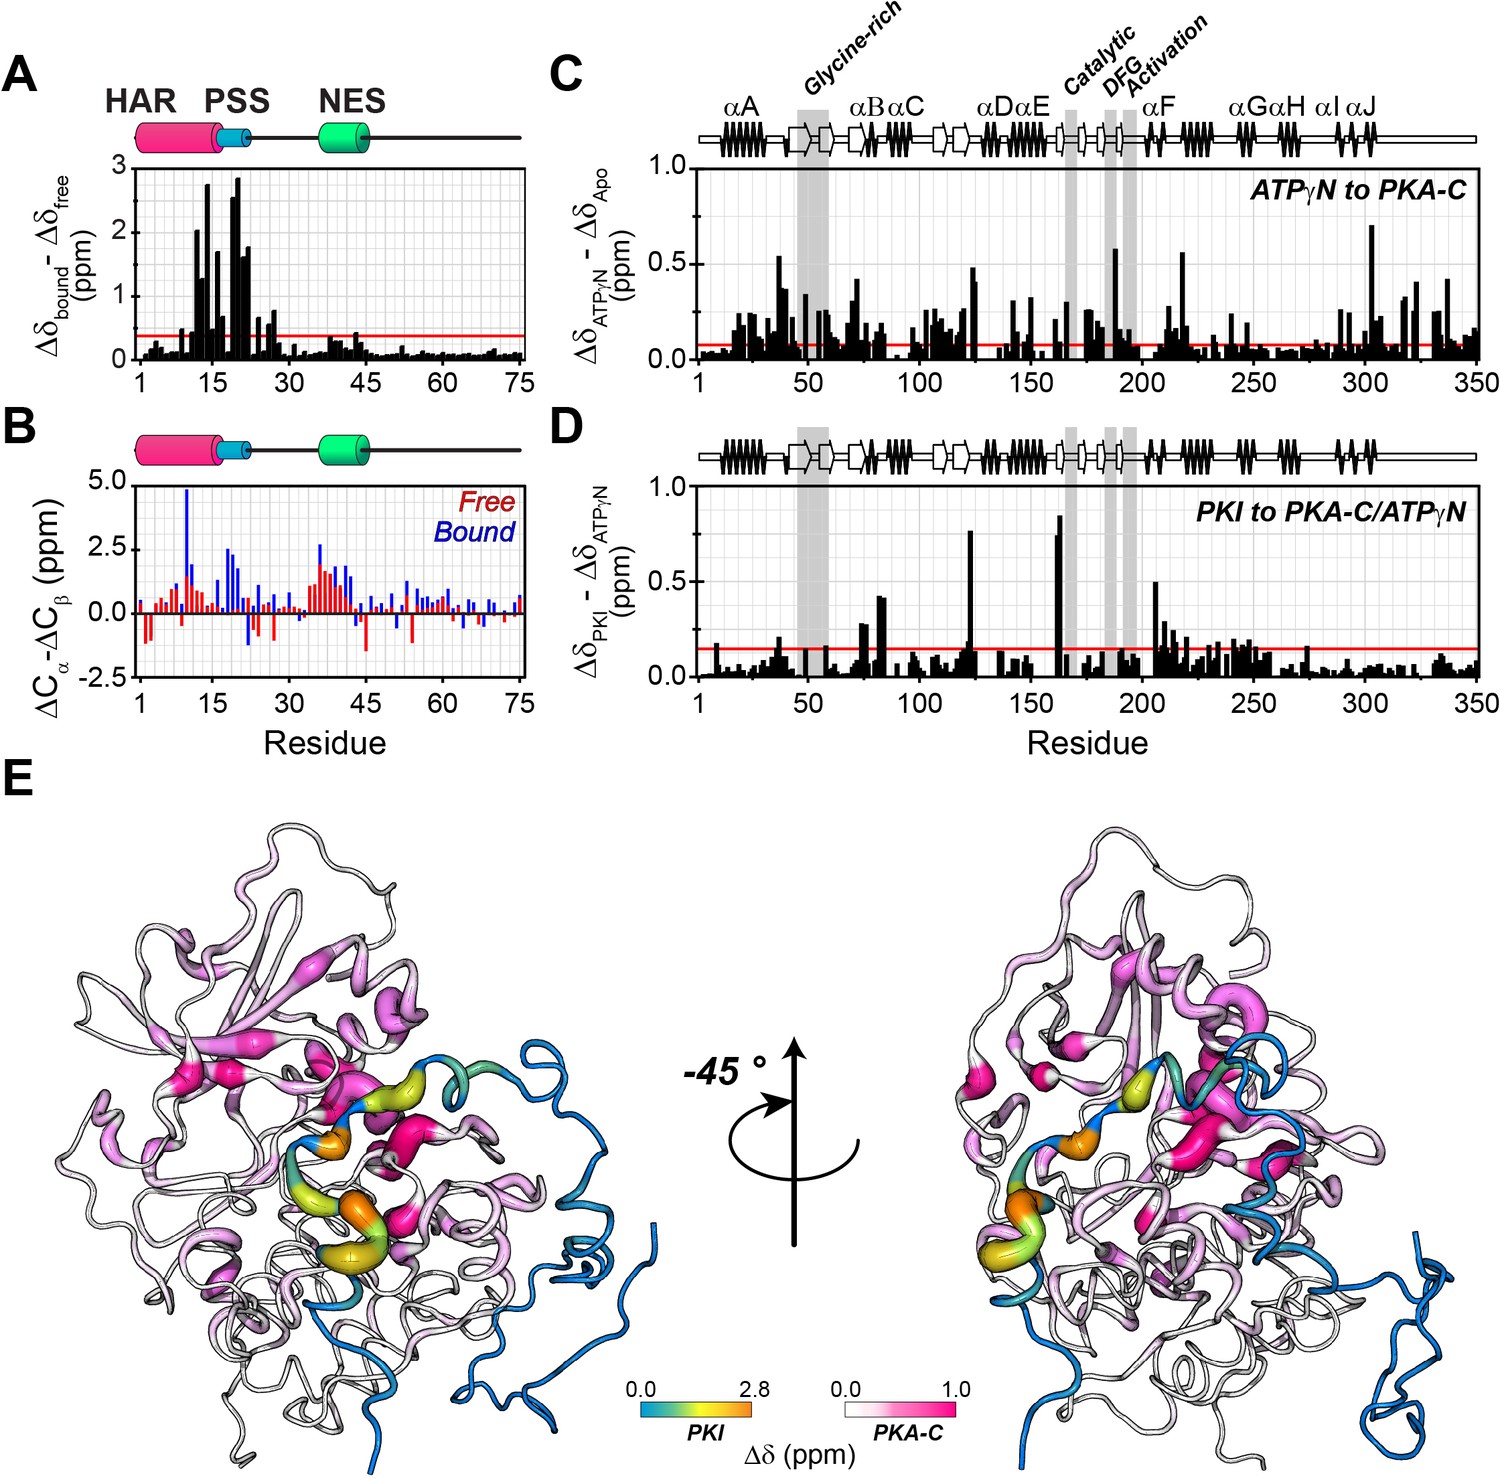
PKIα adopts partial secondary structure upon interaction with PKA-C.
(A) Chemical shift perturbation (CSP) of the amide fingerprint of PKIα upon binding PKA-C/ATPγN binary complex calculated using equation 1 (Williamson, 2013). The residues of PKIα that undergo significant CSPs are localized in the HAR and PSS, which are involved in strong electrostatic interaction within the binding site of PKA-C. (B) Chemical shift index (CSI) for Cα and Cβ of free (red) and bound (blue) PKIα. The PSS motif becomes more rigid upon interaction with PKA-C. The HAR and the NES adopt a transient α-helical conformation, which is enhanced upon binding the kinase. (C) CSP of PKA-C amide fingerprint upon binding ATPγN. (D) CSP of the PKA-C/ATPγN binary complex upon binding PKIα. The red lines in the histograms indicate one standard deviation from the average CSP: 0.38 ppm, 0.11 ppm, and 0.10 ppm for (A), (C and D), respectively. (E) CSPs for PKA-C and PKIα amide resonances mapped onto a selected conformer from the ensemble of the PKA-C/ATP/PKIα structures calculated from MD simulations (see Materials and methods).
Figure 3—figure supplement 1
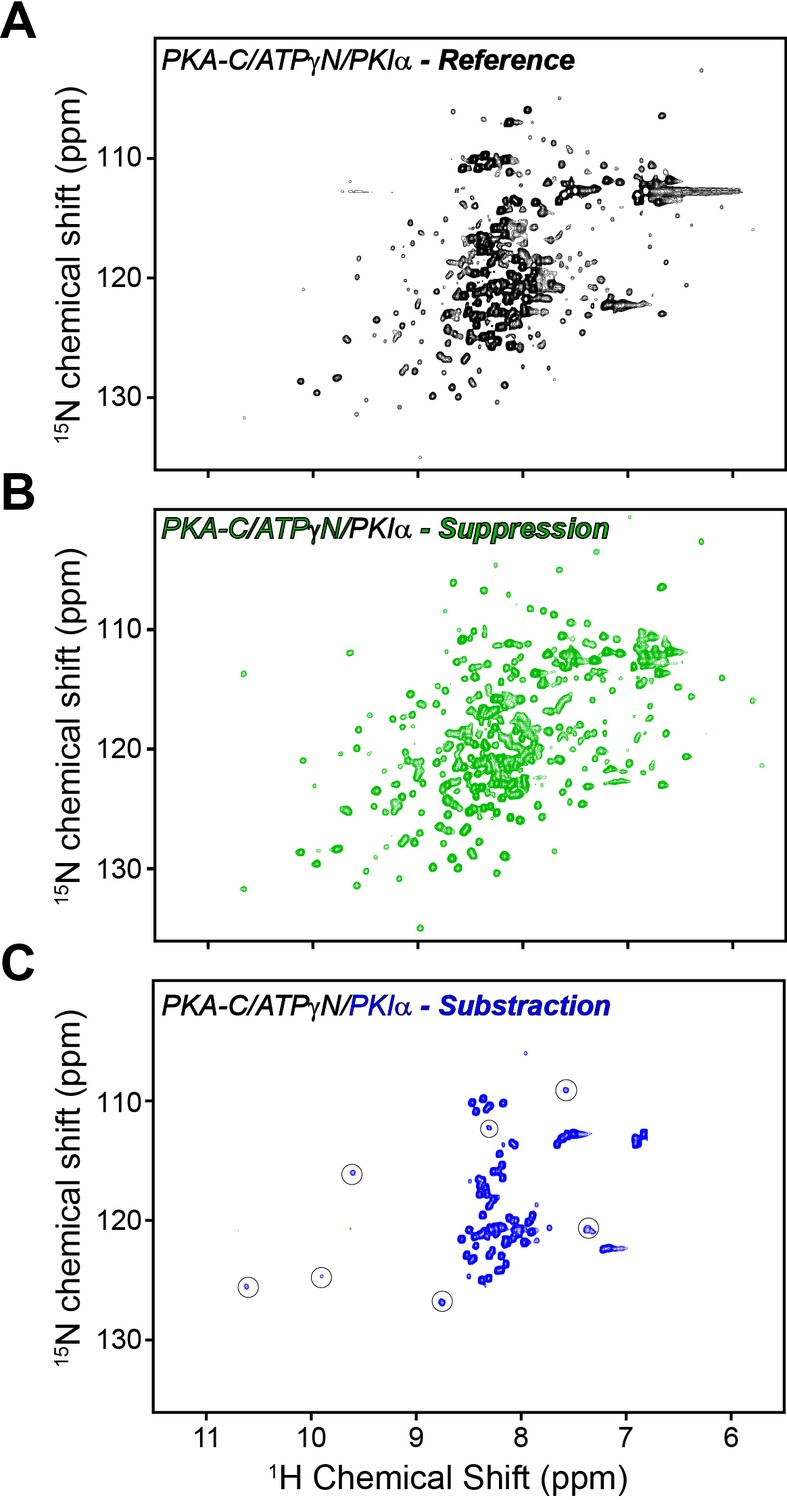
Mapping PKA-C/PKIα interactions using [1H,15N] CCLS-HSQC experiments.
(A) reference spectrum of the PKA-C/ATPγN/PKIα complex with overlaid fingerprints of U-15N PKA-C and U-13C/15N PKIα. (B) Suppression spectrum showing only the PKA-C fingerprint. The suppression spectrum is obtained by filtering the amides linked to 13C labeled PKIα. (C) Subtraction spectrum showing the amide fingerprint of only PKIα. This spectrum is obtained from the subtraction of the reference spectrum (A) minus the suppression spectrum (B) The intensities of the amide resonances in the small squares are multiplied by a factor of 9 and correspond to the PSS region that broadens upon interactions with PKA-C. The spectra [1H,15N] CCLS-HSQC were acquired using the pulse sequence in Tonelli et al. (2007) using 128 scans, 1024 (1H) and 64 (15N) complex points.
Figure 3—figure supplement 2
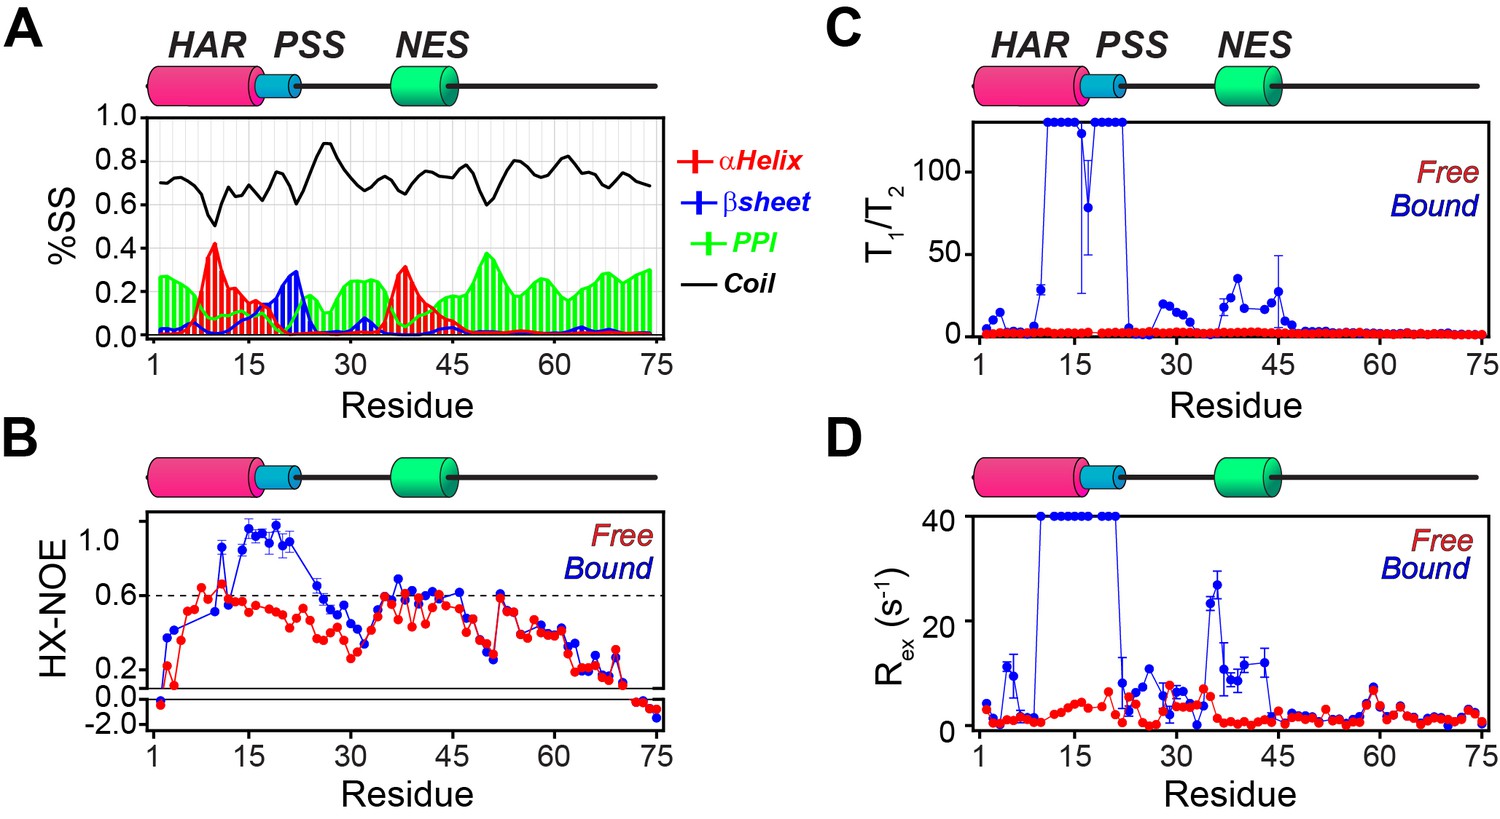
NMR dynamic parameters for free and bound PKIα.
(A) Secondary structure content for PKIα in complex with PKA-C/ATPγN calculated from the NMR chemical shifts using the δ2D program (Camilloni et al., 2012). (B) [1H-15N] ΔHX-NOE values for PKIα in free form (red) and bound to PKA-C/ATPγN (blue). (C) Ratios of longitudinal and transverse relaxation times (T1/T2) for free (red) and PKA-C bound (blue) PKIα. (D) Rex measured for PKIα free (red) and bound (blue) forms. These values were calculated using: Rex = R2,eff- R2,0.
Figure 4

Changes in the NMR dynamic parameters of PKIα upon formation of the ternary complex with PKA-C and ATPγN.
(A) Histogram of the changes in heteronuclear NOE (ΔHX-NOE) values of PKIα free and bound and map of the ΔHX-NOE values onto a selected conformer from the ensemble of the PKA-C/ATP/PKIα structures calculated from MD simulations (see Materials and methods). (B-D) Corresponding ΔR1, ΔR2, and ΔRex plots for PKIα free and bound forms. The sample concentration for free form of 2H/15N PKIα was 0.2 mM; while for PKIα bound to PKA-C/ATPγN was 0.3 mM. All the experiments were recorded at 27°C.
Figure 5

The C-terminal tail of PKIα interacts transiently with PKA-C.
(A) Intermolecular 1HN PRE measurements between U-2H/13C/15N PKIαS59C and U-2H/15N PKA-C/ATPγN. (B) Intermolecular PRE effects detected on PKA-C. (C) Intra- and inter-molecular PRE effects mapped onto the a selected conformer from the ensemble of the PKA-C/ATP/PKIα structures calculated from MD simulations. The yellow sphere illustrates where the spin label is attached. The black dots on both panel A and B indicate those resonances that broaden out beyond detection mainly in the sample with the spin-label active (paramagnetic sample). The horizontal lines indicate one (blue), two (green), and three (red) standard deviations from the mean (σ) of the observed PRE values. We refer as strong PRE effects values greater than 3σ, medium between 1 and 2σ, and weak less than 1σ.
Figure 6 with 1 supplement
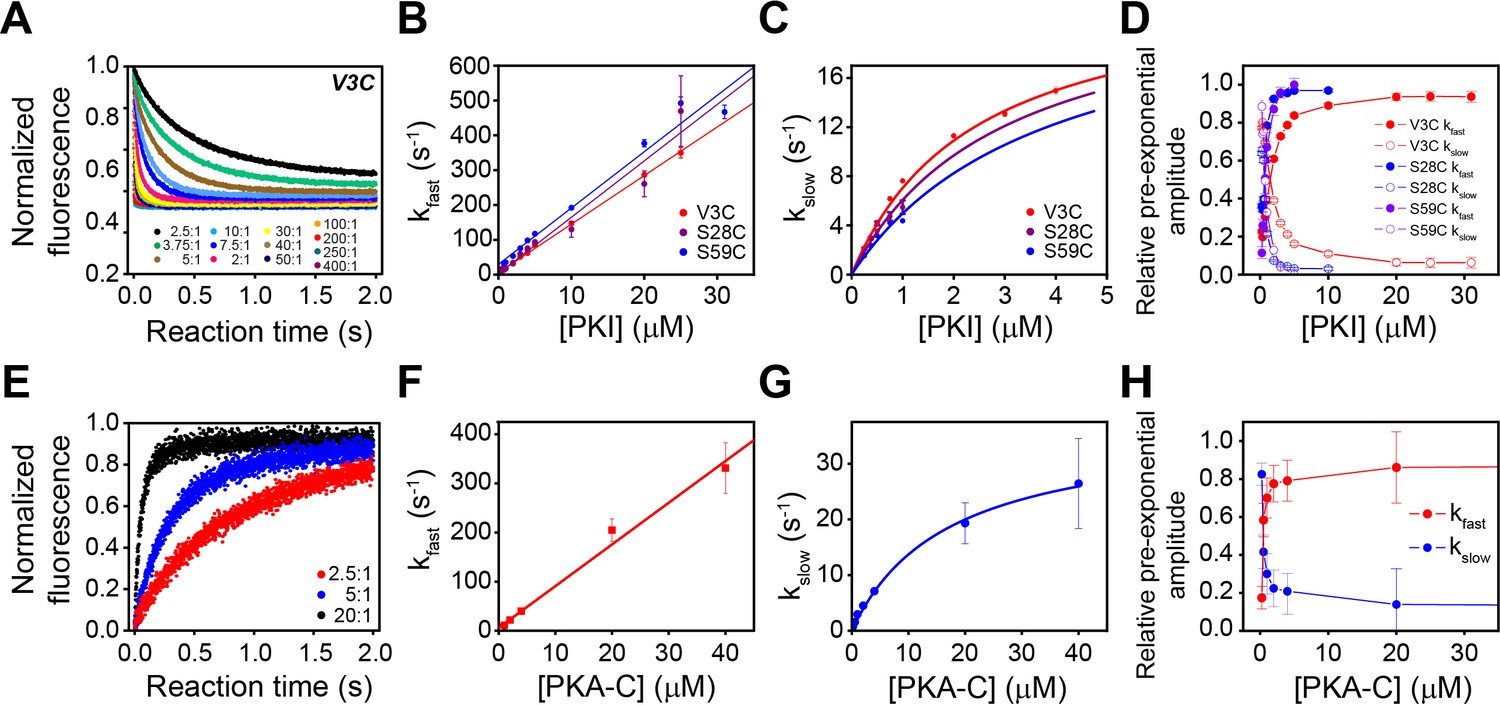
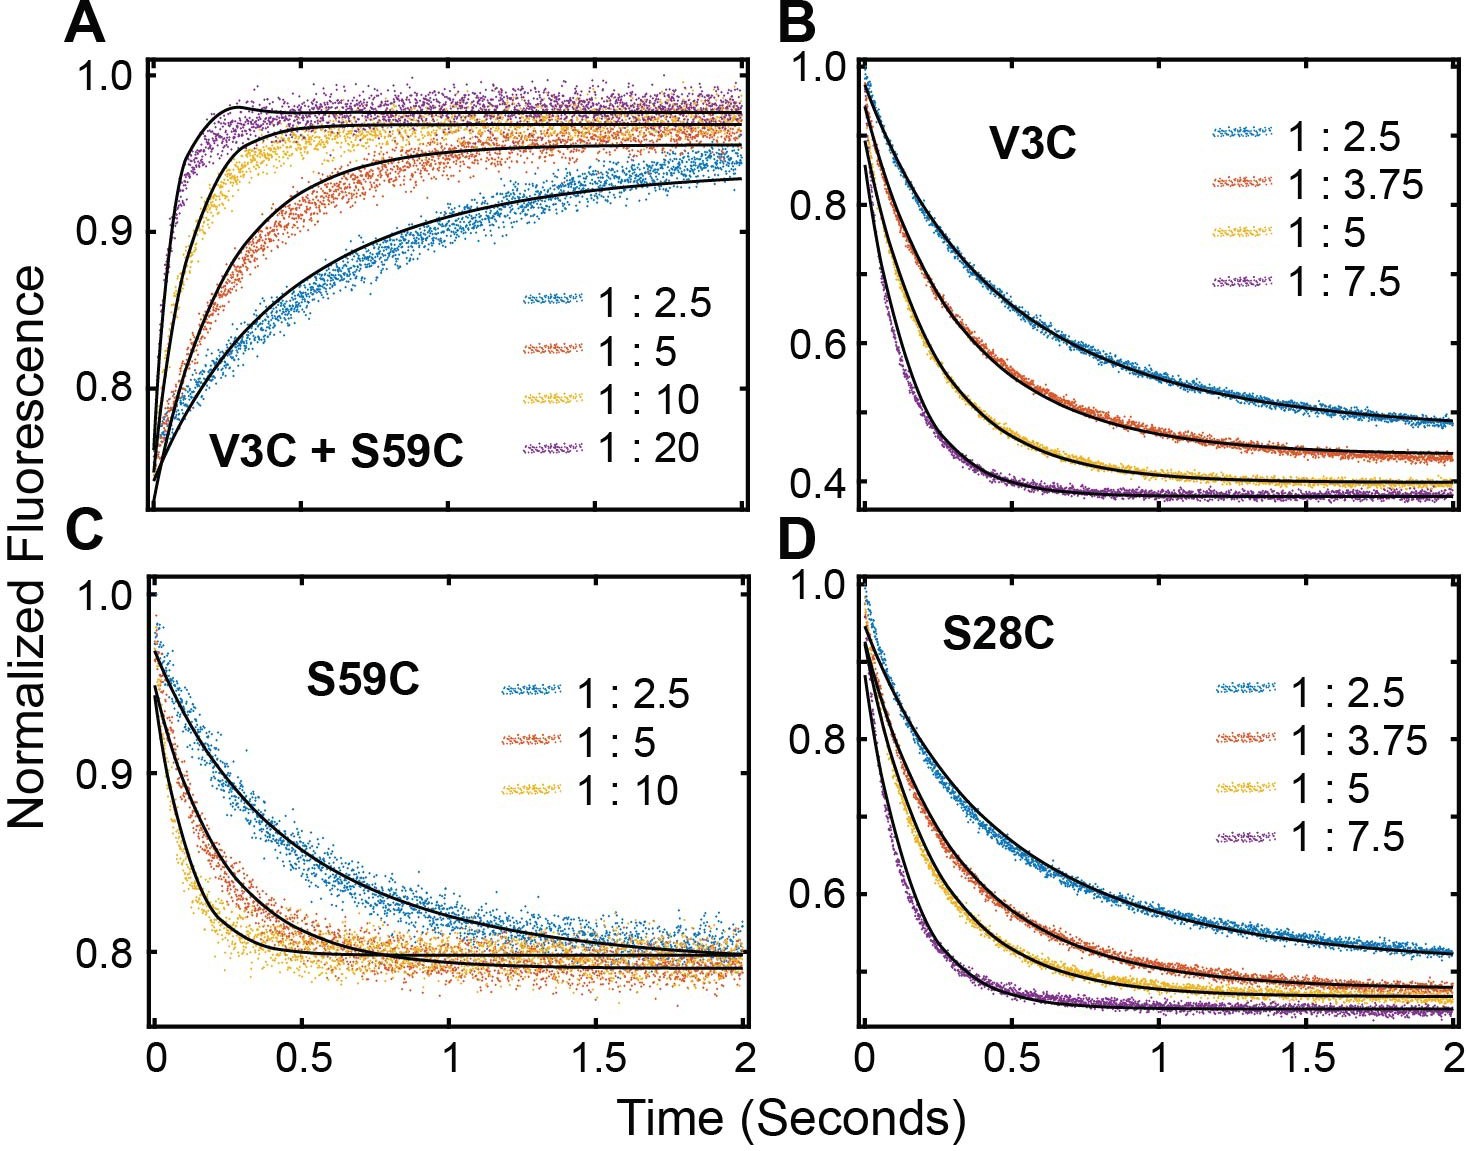
Multi-pathway mechanism of PKIα binding to PKA-C revealed by stopped-flow FRET experiments.
(A) Total fluorescence of Alexa-488 labeled PKA-CC199A,S325C (100 nM) monitored at 520 ± 10 nm, mixed with varied concentrations of TMR labeled PKIαV3C, ranging from 0 to 400 times the concentration of the enzyme. (B-C) Dependence of the fast and slow rate constants on the concentration of PKIα. (D) Relative pre-exponential amplitude obtained by fitting each transient to a bi-exponential function A1*Exp(-t*kobs1) + A2*Exp(-t*kobs2). (E) Total fluorescence of double-labeled PKIαV3C, S59C (Alexa-488, TMR) (100 nM) monitored at 520 ± 10 nm mixed at different concentrations of non-labeled PKA-CC199A, S325C. (F-G) Dependence of the fast and slow rate constants on PKA-C concentration. (H) Relative pre-exponential amplitude obtained by fitting each transient to a bi-exponential function. Representative data from N = 3 experiments for each condition were repeated three times per experiment.
Figure 6—figure supplement 1
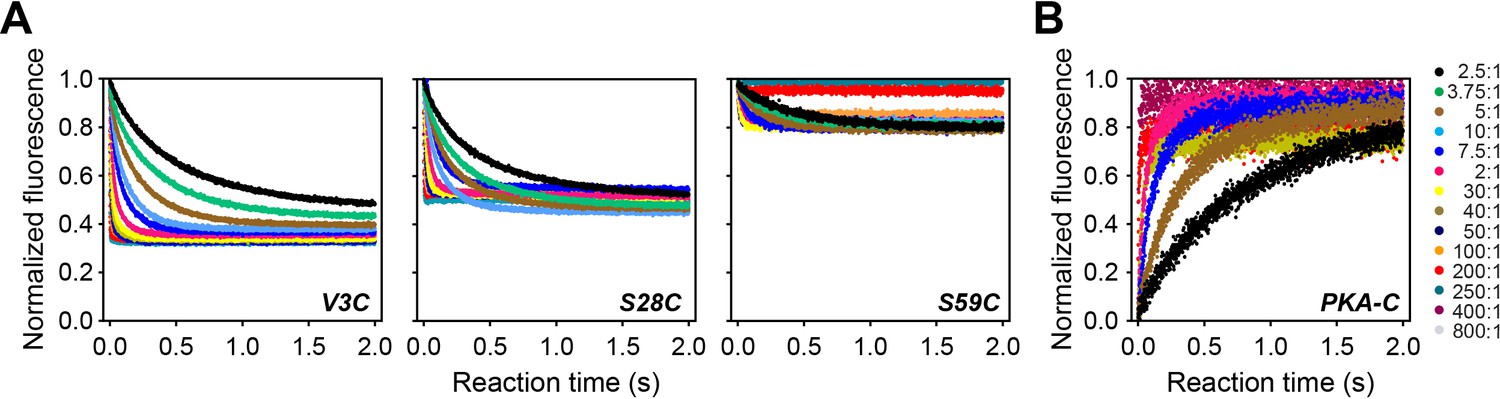
Time-resolved FRET data.
(A) Total fluorescence of Alexa-488 labeled PKA-CC199A, S325C (100 nM) monitored at 520 ± 10 nm, mixed with varied concentrations of TMR labeled PKIαV3C, PKIαS28C or PKIαS59C, from 0 to 800 times the concentration of the enzyme. (B) Total fluorescence of double-labeled PKIαV3C,S59C (Alexa-488, TMR) monitored at 520 ± 10 nm mixed with varied concentrations of non-labeled PKA-CC199A,S325C. On the right side of panel B are listed and color-coded the different molar ratios used for the experiments in panels A and B.
Figure 7

Conformational ensembles free and bound of PKIα by SAXS and metadynamics.
(A-B) Distribution of helical populations for the HAR and NES regions in the free (A) and bound (B) PKIα ensembles. (C) SAXS data obtained with PKIα free and the PKA-C/PKIα complex in the presence of ATPγN. The top panel shows the scattering intensity, I(q), as a function of q and the bottom panel the Kratky plot. The blue (complex) and red (free PKIα) traces are the best-fit curves obtained by fitting predicted scattering data from the conformation ensembles from RAM simulations. (D) Conformational ensemble of free PKIα that best fits the SAXS profile. E. PKIα ensemble bound to PKA-C that best fits the SAXS profile.
Figure 8 with 1 supplement
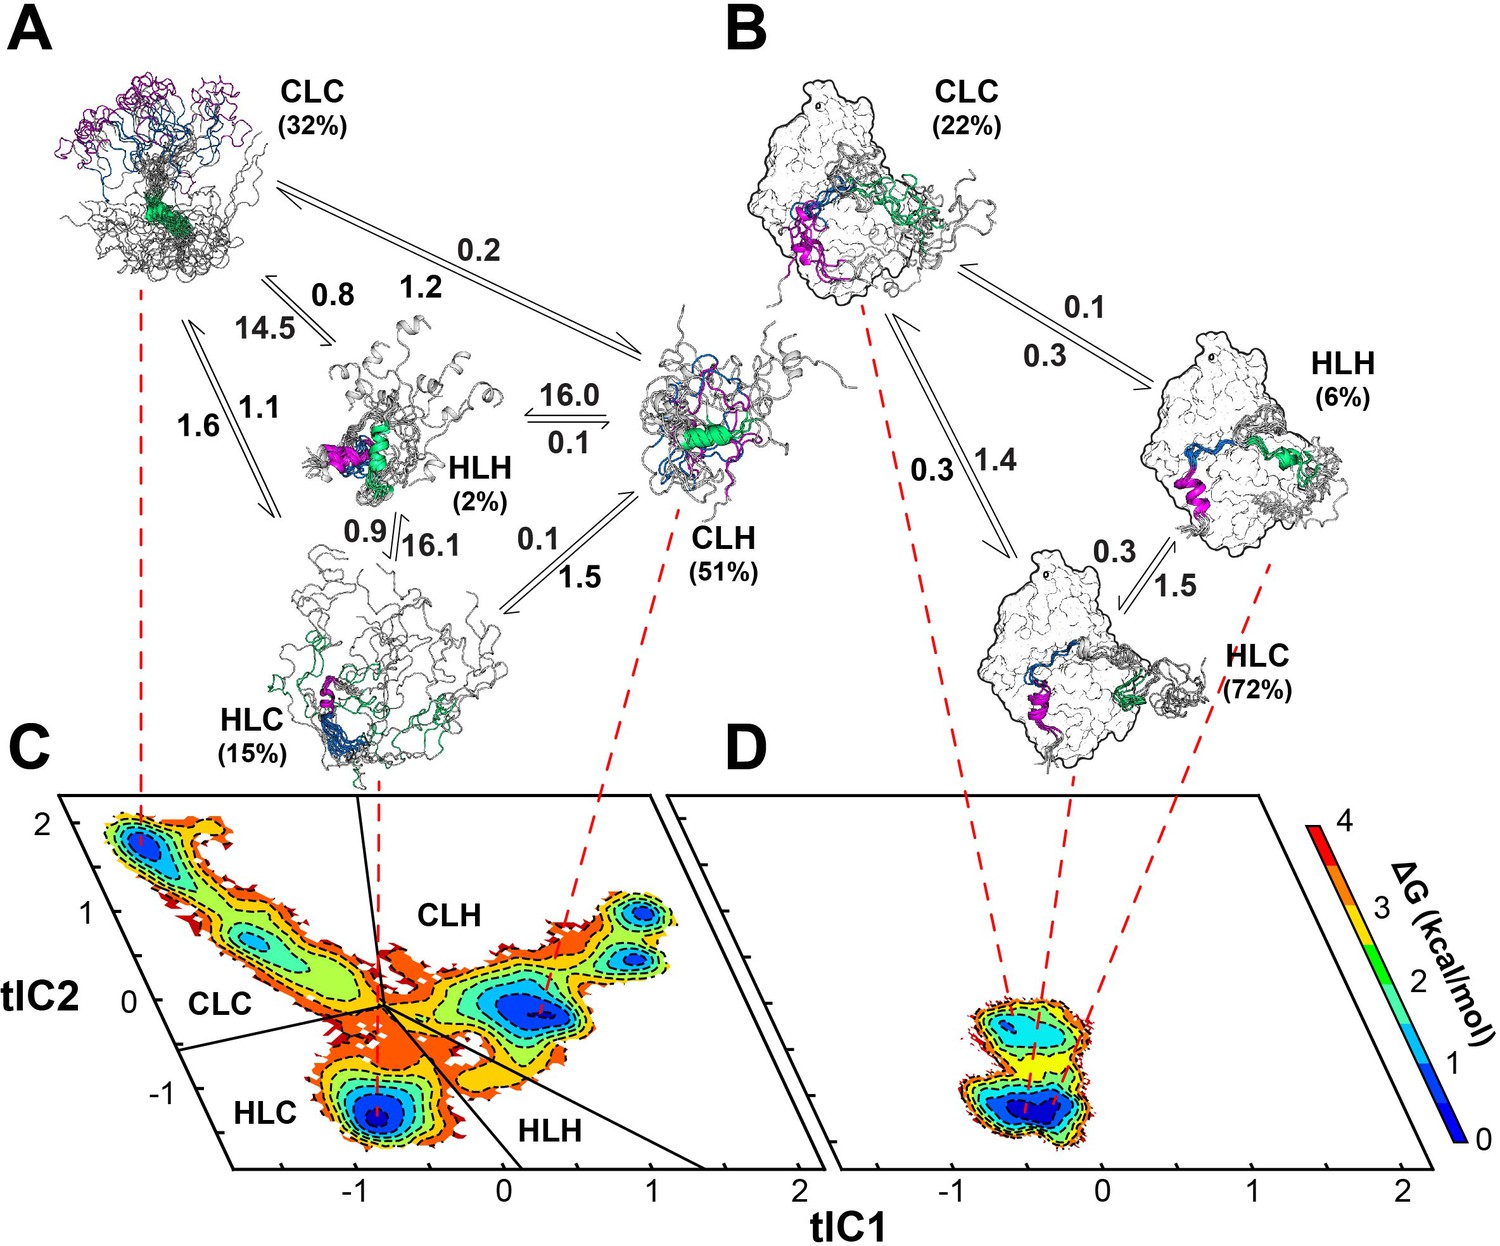
Multi-state binding kinetics of PKI α to PKA-C from Markov model.
(A) Schematic illustration of the transition kinetics between different conformational ensembles of PKIα in the free form. (B) Corresponding scheme for the bound ensembles. The population of each state is indicated as percentage. The kinetic constants expressed in microseconds are indicated on the arrows. (C) 2D free energy landscape for PKIα in the free form projected along the first two tICs (D) Corresponding free energy landscape for PKIα in the bound forms. The major conformational ensembles of free PKIα in the free form can be categorized into four states, featuring different combination of helix/coil/loop for the HAR, PSS and NES motifs.
Figure 8—figure supplement 1
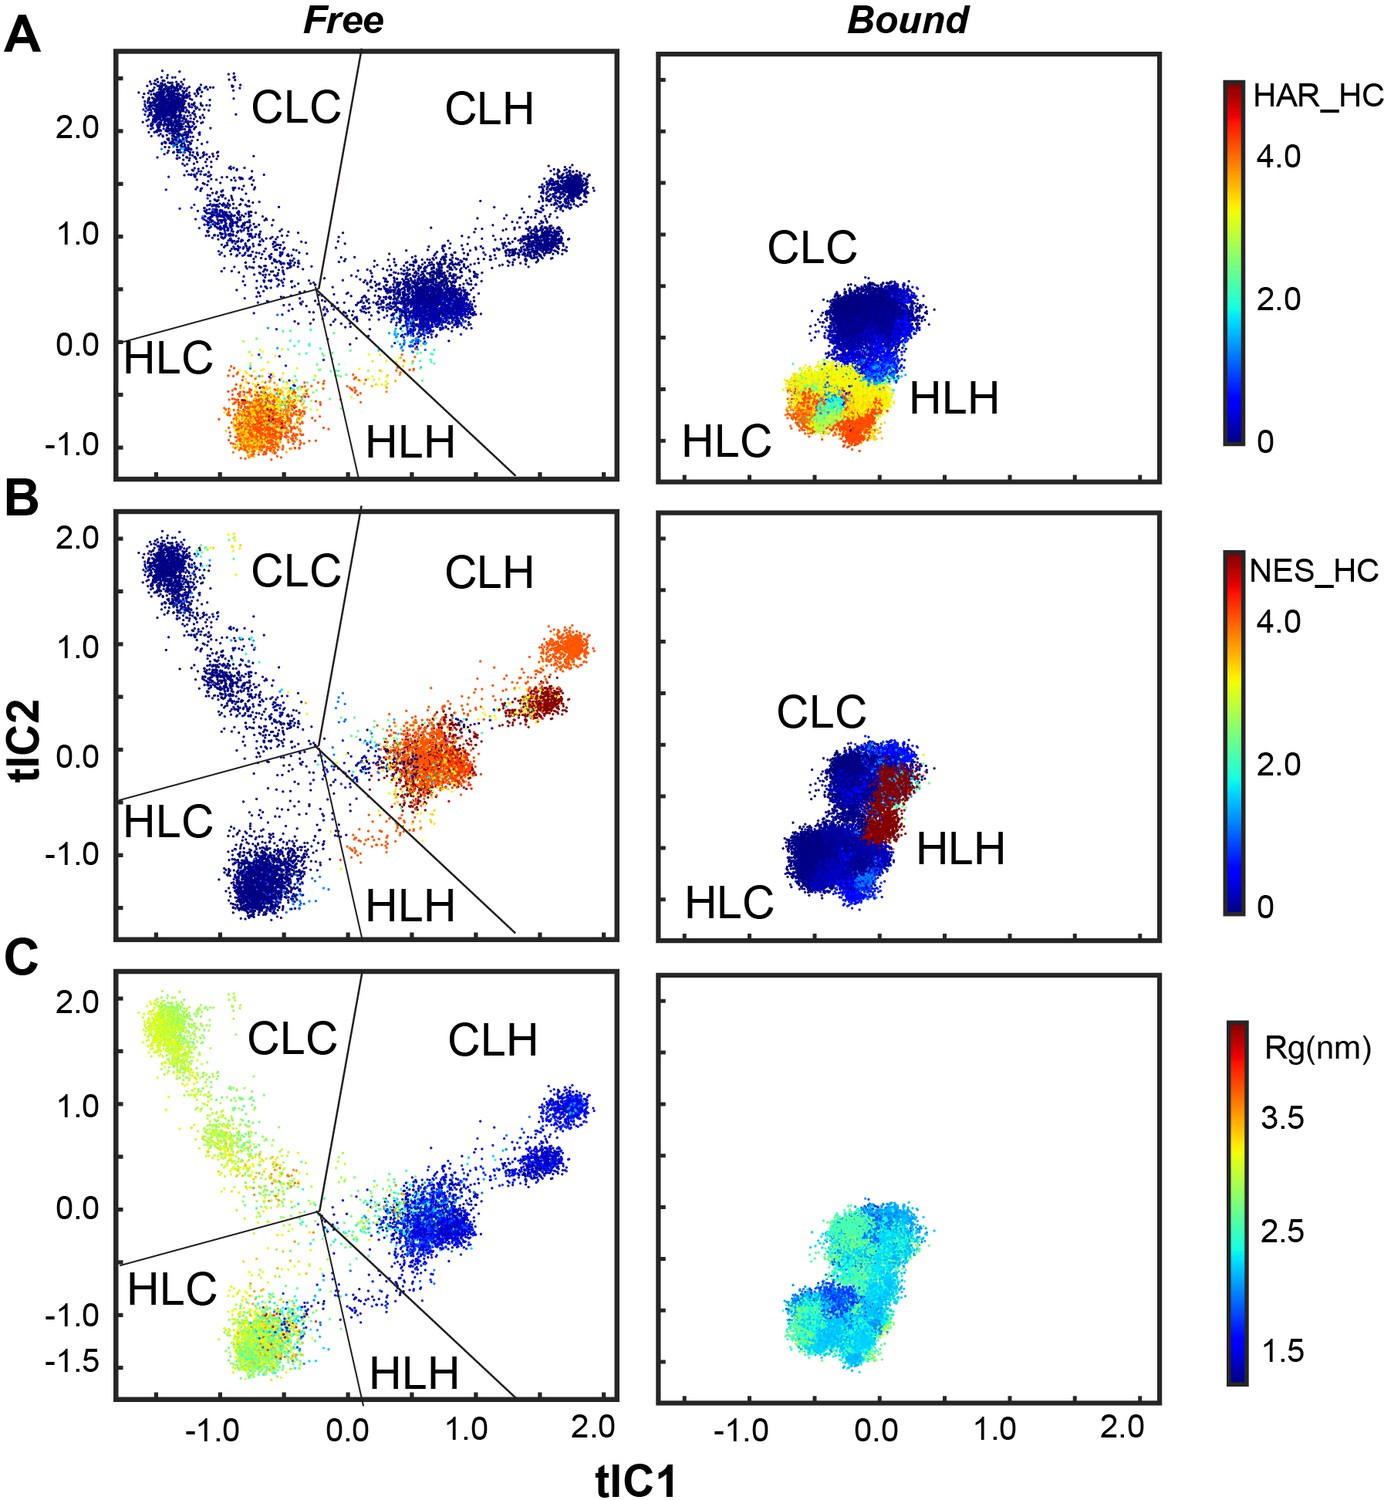
Scatter plot from MD simulations showing the conformational ensembles of PKIα in the free and bound forms projected along the first two tICs.
(A) Helical content of the HAR motif. (B) Helical content of the NES motif. (C) The radius of gyration (Rg). The conformational space can be divided into four major ensembles based on the secondary structure content in the HAR and NES motifs. The helical content of NES is highly correlated with Rg.
Scheme 1
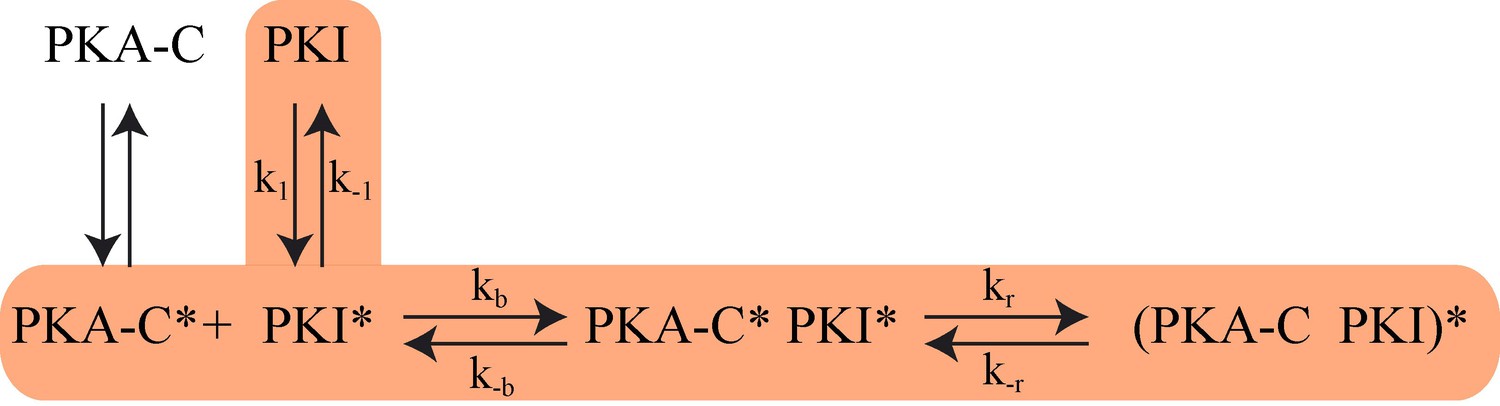
The proposed Kinetic Model of PKA-C/PKIα binding.
Highlighted pathway is used in the numerical fitting of Stopped Flow rapid mixing FRET data using MATLAB.
Scheme 2
FRET Profiles of (A) double labeled PKI, (B) PKIACCEPTOR-3, (C) PKIACCEPTOR-59 and (D) PKIACCEPTOR-28 fitted with kinetic model in Scheme 1.
Tables
Table 1
Rate constants obtained from the fluorescence decay of PKIACCEPTOR-3, PKIACCEPTOR-28, and PKIACCEPTOR-59upon mixing with Alexa-labeled PKA-CC199A,S325C or the fluorescence buildup of PKIDONOR-ACCEPTOR upon mixing with unlabeled PKA-CC199A,S325C at 25°C.
| PKIACCEPTOR3 | PKIACCEPTOR28 | PKIACCEPTOR59 | PKIDONOR-ACCEPTOR | |
|---|---|---|---|---|
| Fast phase | ||||
| kon (M−1 s−1) | 1.88 ± 0.03×10⁷ | 1.40 ± 0.02×10⁷ | 1.62 ± 0.11×10⁷ | 0.85 ± 0.04×10⁷ |
| koff (s−1) | 13 ± 3 | 5 ± 1 | 2 ± 10 | 6 ± 7 |
| Kdapp (nM) | 700 ± 170 | 390 ± 110 | 150 ± 620 | 700 ± 800 |
| Slow phase | ||||
| kslow (s−1) | 24 ± 2 | ND | ND | 37 ± 2 |
| K0.5 (µM) | 2.4 ± 0.4 | 3.0 ± 0.4 | 3.8 ± 0.5 | 17 ± 3 |
-
ND: Non determined.
Key resources table
| Reagent type (species) or resource | Designation | Source or reference | Identifiers | Additional information |
|---|---|---|---|---|
| Gene (Oryctolagus cuniculus ) | PKIA or PKIα | Uniprot ID P61926 | ||
| Gene (Mus musculus) | PKA-CA or PKA-C | Uniprot ID: Q9DBC7 | ||
| Strain, strain background (Escherichia coli) | BL21(DE3) | New England Biotech (NEB) | C2527I | Chemically competent cells |
| Recombinant DNA reagent | pT7-7 PKIα | Dr. Herberg (Universität Kassel, Germany) | DOI: 10.1042/BJ20071665 | |
| Recombinant DNA reagent | PKIαV3C | This study | Single Cys mutant of PKIα | |
| Recombinant DNA reagent | PKIαS28C | This study | Single Cys mutant of PKIα | |
| Recombinant DNA reagent | PKIαS59C | This study | Single Cys mutant of PKIα | |
| Recombinant DNA reagent | PKIαV3C, S59C | This study | Double Cys mutant of PKIα | |
| Recombinant DNA reagent | PKA-Cα | Prof. Taylor S.S. (USCD, CA, USA) | (Hemmer et al., 1997) DOI: 10.1006/abio.1996.9952 | |
| Recombinant DNA reagent | (His6X)-PKA-RIIαR213K | Prof. Taylor S.S. (USCD, CA, USA) | (Hemmer et al., 1997) DOI: 10.1006/abio.1996.9952 | |
| Sequence-based reagent | PKIαV3C | This study | PCR primer(Forward): aaggagatatacatatgggaactgattgcgaaactacttatgccgatttta | |
| Sequence-based reagent | PKIαS28C | This study | PCR primer (Forward): ccatccacgatatcctggtctgcagtgcttccgg | |
| Sequence-based reagent | PKIαS59C | This study | PCR primer (Forward): aggaagatgctcaaagatcttgcactgaacaatccggagaag | |
| Sequence-based reagent | PKIαV3C, S59C | This study | PCR primer (Forward): 1)aaggagatatacatatgggaactgattgcgaaactacttatgccgatttta 2)aggaagatgctcaaagatcttgcactgaacaatccggagaag | |
| Chemical compound, drug | MTSL | Toronto Research Chemical | O875000 | Spin label |
| Chemical compound, drug | dMTSL | Toronto Research Chemical | A188600 | Spin label |
| Chemical compound, drug | Alexa Fluor 488 C5 Meleimide | Thermo Fisher Scientific | A10254 | FRET acceptor |
| Chemical compound, drug | Tetramethylrhodamine-5-maleimide (TMR) | Life Technologies | T6027 | FRET donor |
| Chemical compound, drug | AMP-PNP or ATPγN | Roche Applied Science | 10102547001 | ATP analogous |
| Commercial assay or kit | QuikChange Lightning Multi Mutagenesis Kit | Agilent genomics | 210519 | Commercial mutagenesis kit |
| Commercial assay or kit | PepTag Assay, Non-Radioactive Detection of PKA | Promega | V5340 | Commercial assay kit |
| Software, algorithm | TopSpin 3.0 | Bruker Inc | https://www.bruker.com/ | |
| Software, algorithm | NMRFAM-Sparky | NMRFam | https://nmrfam.wisc.edu/nmrfam-sparky-distribution/ | |
| Software, algorithm | NMRPipe | Delaglio F, NIH (Delaglio et al., 1995) | https://www.ibbr.umd.edu/nmrpipe/install.html | |
| Software, algorithm | PyMol | Schrödinger, LLC | https://pymol.org | |
| Software, algorithm | MatLab2019b | MathWorks | https://www.mathworks.com/products/matlab.html | |
| Software, algorithm | GraphPad Prism 8 | GraphPad Software Inc | https://www.graphpad.com/ | |
| Software, algorithm | Origin 8 | OriginLab | https://www.originlab.com/ | |
| Software, algorithm | SAXSQuant software suit | Anton Paar | N/A | |
| Software, algorithm | Primus | ATSAS 2.8.3 software | https://www.embl-hamburg.de/biosaxs/download.html | |
| Software, algorithm | MultiFoXS server | (Schneidman-Duhovny et al., 2013). | https://modbase.compbio.ucsf.edu/multifoxs/ DOI: 10.1016/j.bpj.2013.07.020 | |
| Software, algorithm | GROMACS 4.6 | (Hess et al., 2008) | http://www.gromacs.org/ | |
| Software, algorithm | PLUMED 2.1 | (Bonomi et al., 2009) | https://www.plumed.org/doc-v2.5/user-doc/html/_c_h_a_n_g_e_s-2-1.html | |
| Software, algorithm | ALMOST 2.1 | (Fu et al., 2014) | https://sourceforge.net/projects/almost/ | |
| Software, algorithm | MSMBuilder 3.5 | (Harrigan et al., 2017) | http://msmbuilder.org/3.5.0/index.html | |
| Software, algorithm | δ2D | (Camilloni et al., 2012) | http://www-mvsoftware.ch.cam.ac.uk/index.php/d2D |
Additional files
Download links
A two-part list of links to download the article, or parts of the article, in various formats.
Downloads (link to download the article as PDF)
Open citations (links to open the citations from this article in various online reference manager services)
Cite this article (links to download the citations from this article in formats compatible with various reference manager tools)
Multi-state recognition pathway of the intrinsically disordered protein kinase inhibitor by protein kinase A
eLife 9:e55607.
https://doi.org/10.7554/eLife.55607


