Fgf4 maintains Hes7 levels critical for normal somite segmentation clock function
- Genetics of Vertebrate Development Section, Cancer and Developmental Biology Laboratory, National Cancer Institute, National Institutes of Health, United States
- Optical Microscopy and Analysis Laboratory, Frederick National Laboratory for Cancer Research, United States
- Institute for Frontier Life and Medical Sciences, Kyoto University, Japan
Figures
Figure 1 with 3 supplements
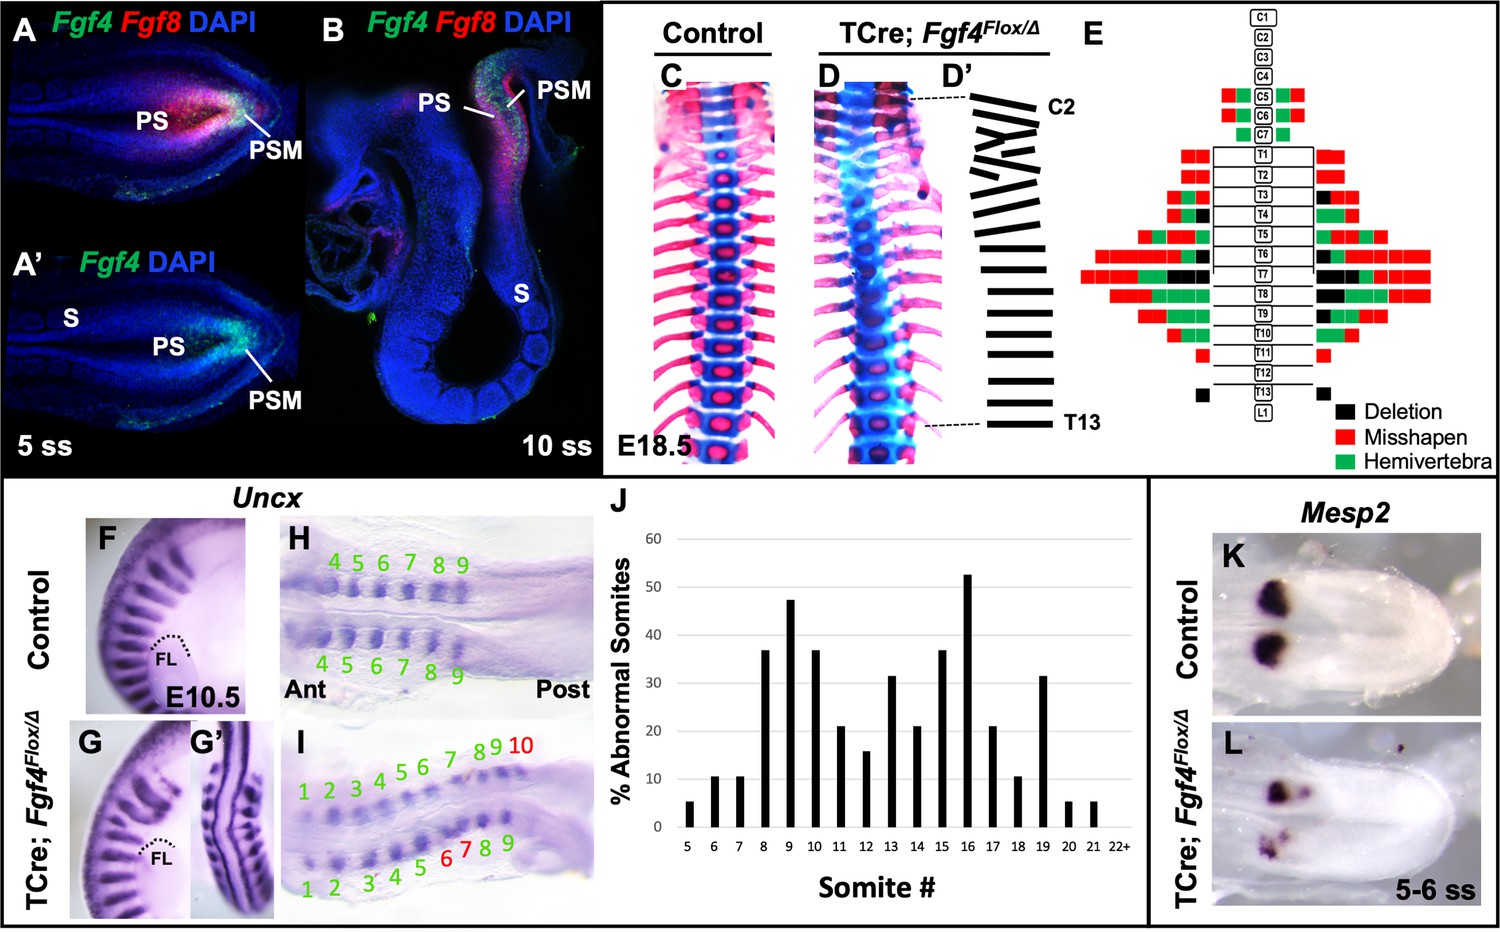
Fgf4 mutants have defects in vertebral and somite patterning.
(A, A’) Max intensity projection (MIP) of HCR staining of Fgf4 and Fgf8 mRNA expression (A) or Fgf4 only (A’) in the PSM of a five somite stage wildtype embryo (dorsal view). PS: primitive streak, PSM: presomitic mesoderm, S: somite. (B) MIP of 4 parasagittal z-sections (approximately 5 µm each) of HCR staining of Fgf4 and Fgf8 mRNA expression, of a 10 somite stage wildtype embryo (lateral view, mediolateral to the midline). (C, D) Skeletal preparations (ventral view after removing ribcage) of E18.5 control and Fgf4 mutants. (D’) Tracing of the Fgf4 mutant vertebral pattern in D. (E) Histograms representing the vertebral column and associated ribs (C = cervical, T = thoracic, L = lumbar), showing variety and location of vertebral defects in E18.5 Fgf4 mutants (n = 12). Each block in the histogram represents a single defect as indicated in the key, bottom right. (F–I) Wholemount in situ hybridization (WISH) detection of Uncx mRNA expression in control and Fgf4 mutants at E10.5 (F, G lateral views, anterior top; G’ dorsal view of embryo in G) and at 9–10 somite stage (H, I dorsal view, anterior left); dotted line in F and G marks the anterior boundary of the forelimb (FL). (J) Graph depicting the percentage of abnormal somites scored with a mispatterned Uncx mRNA WISH pattern (F–I) in Fgf4 mutants at the somite position listed on the x-axis. Somites were scored in 26–30 somite stage Fgf4 mutants (n = 19). Note that posterior to somite 21 the Uncx pattern is normal. (K, L) Dorsal view (anterior left) of 5–6 somite stage control (K) and Fgf4 mutant (L) embryos WISH-stained for Mesp2 mRNA expression. In all control embryos (n = 7), the Mesp2 pattern was normal; in 5/8 mutant embryos, the pattern was abnormal.
Figure 1—figure supplement 1
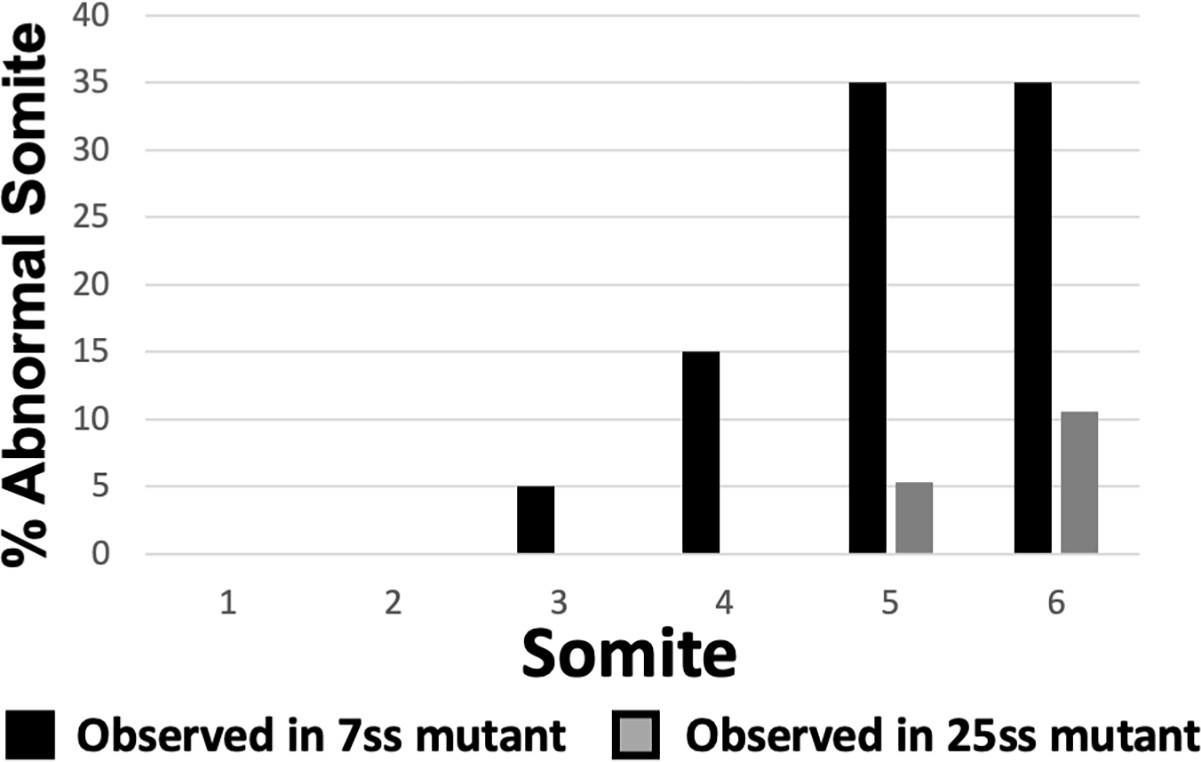
Mispatterning of rostral somites correct as development proceeds.
Graph depicting the percentage of abnormal somites scored with a mispatterned Uncx mRNA WISH pattern at the somite position listed on the x-axis. Somites 1–6 were scored in somite stage 7 Fgf4 mutants (black bars, n = 20) and somites 5 and 6 in 26–30 somite stage Fgf4 mutants (gray bars, n = 19). Note that fewer defects are observed in somites 5 and 6 at the later developmental stage, suggesting that these Uncx abnormalities correct overtime.
Figure 1—figure supplement 2

Mesp2 pattern is normal at 24–26 somite stage in Fgf4 mutants.
(A–B’) HCR staining showing no difference in the patterns of Mesp2 and Tbx6 expression between control and Fgf4 mutant 24–26 somite stage embryos. A and B: MIP, lateral view with anterior to the left. A’ and B’: dorsal projections of A and B, anterior to the left. (control, n = 10; mutant, n = 11).
Figure 1—figure supplement 3
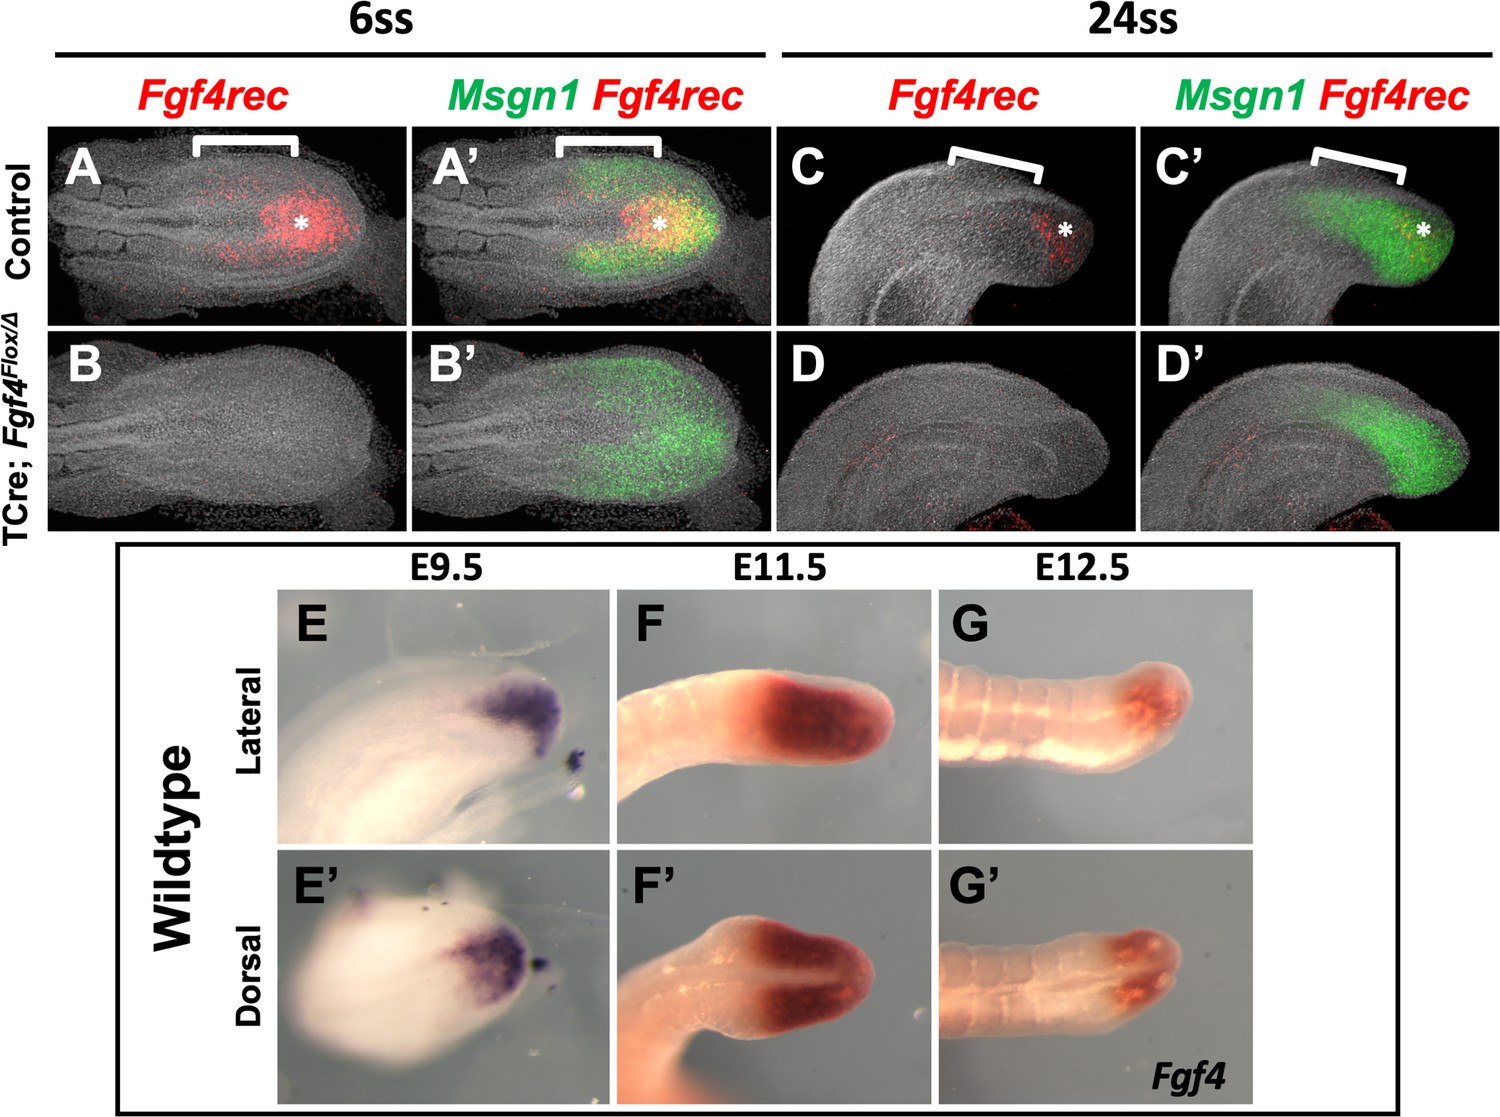
Fgf4 expression in mutant and wildtype embryos.
HCR staining of the indicated genes in control and Fgf4 mutant embryos at 6ss (A, A’, B, B’) and somite stage 24 (C, C’, D, D’). The probe (Fgf4rec) hybridizes only to sequences between the loxP sites in the Fgf4flox allele; hence it hybridizes to wildtype Fgf4 mRNA but not to mRNA transcribed from the Cre-deleted allele. Fgf4rec and Msgn1 patterns indicate that Fgf4 is expressed throughout the PSM in controls (bracket), with higher expression in the posterior midline (asterisk) (A’, C’). Fgf4 does not appear to be expressed in a gradient in the normal PSM (A, C). Fgf4 expression is absent in mutants in the PS and PSM at all examined stages (B, B’, D, D’). Representative embryos are shown; control, n = 4 for somite stage 6, n = 3 for somite 24; mutant, n = 4 for somite stage 6, n = 4 for somite 24. (E–G’) Colorimetric staining of Fgf4 expression using a full-length probe in wildtype embryos at E9.5, E11.5, and E12.5, showing persistent expression of Fgf4 expression through late development. All images are anterior to left. A-D’ are MIPs of confocal images. A-B’, dorsal view; C-D’, lateral view. E-G lateral views, E’-G’ dorsal views.
Figure 2
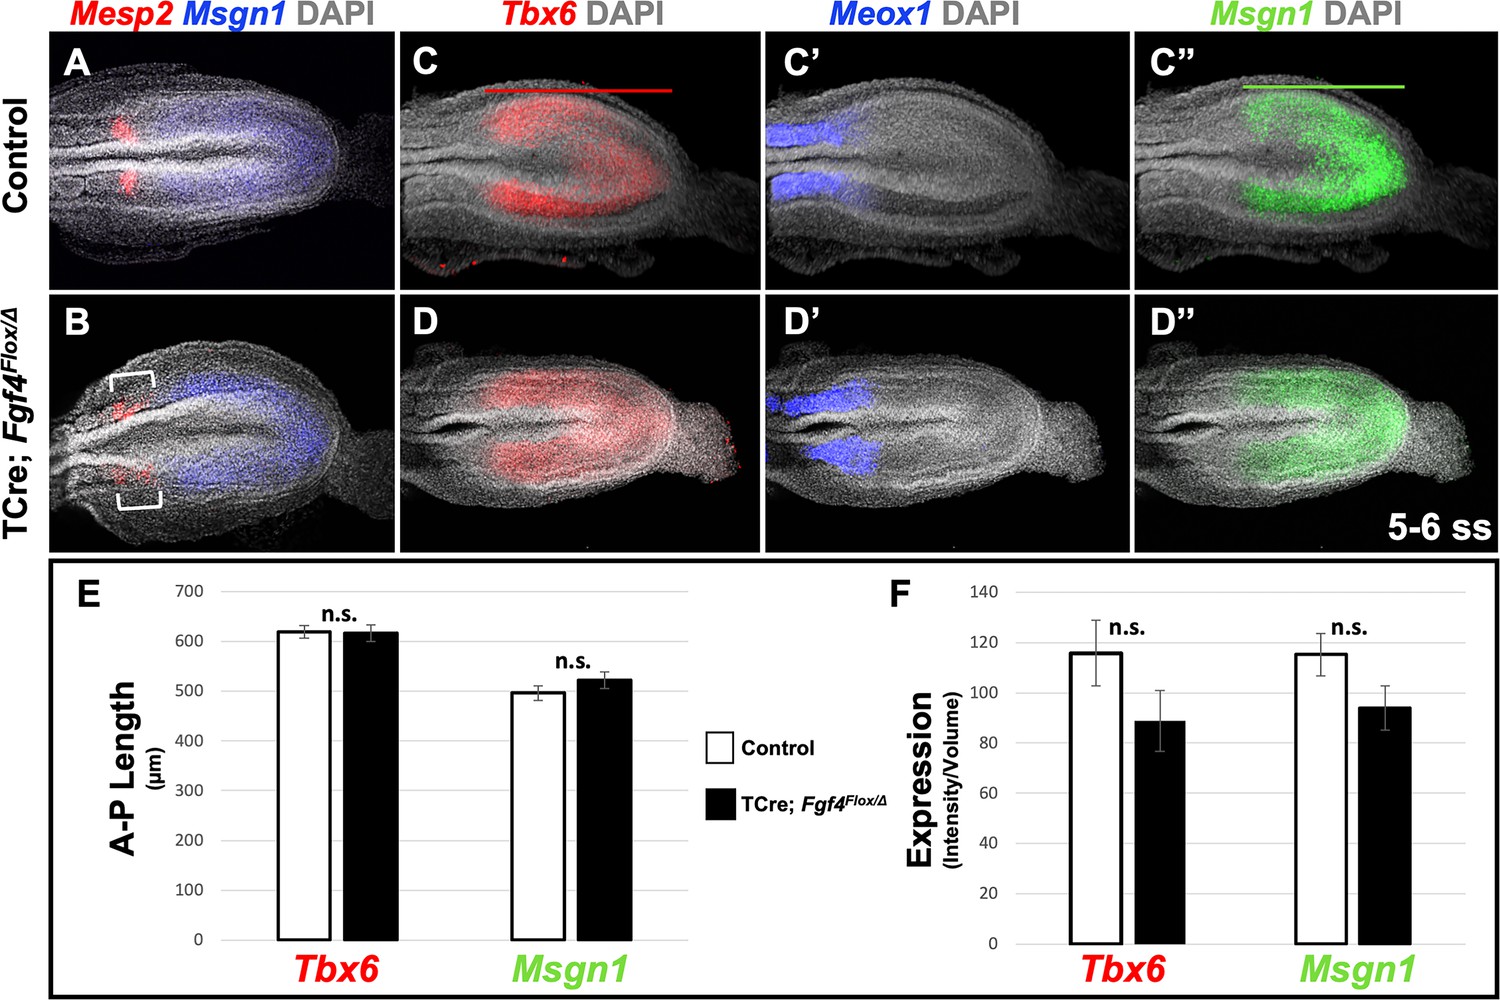
Fgf4 mutants maintain a normal wavefront.
(A, B) HCR staining of 5–6 somite stage control (A, n = 8) and Fgf4 mutant embryos (B, n = 11). In mutants, Msgn1 expression was similar between mutants and controls, but Mesp2 expression was abnormal (6/11). (C–D’’) HCR staining of 5–6 somite stage control and Fgf4 mutant embryos showing normal expression of Meox1 (control, n = 4; mutant, n = 4), Msgn1 (control, n = 9; mutant, n = 8), and Tbx6 (control, n = 10; mutant, n = 8). (E) There is no significant difference in the anterior-posterior length of Tbx6 and Msgn1 domains in control (n = 9) and mutant embryos (n = 8; green and red bars in C and C’). (F) Quantification of Tbx6 and Msgn1 mRNA expression, determined by measurement of fluorescence intensity per cubic micrometer within the volume of the Msgn1 or Tbx6 domain of expression, respectively. There is no significant difference between control and mutant embryos. In E and F, data are mean ± s.e.m, significance determined by a Student’s t-test. Msgn1: control n = 7; mutant n = 8. Tbx6: control, n = 9; mutant, n = 8. All images: MIP, dorsal view, anterior left. Same embryo shown in C-C’’ and D-D’’.
Figure 3
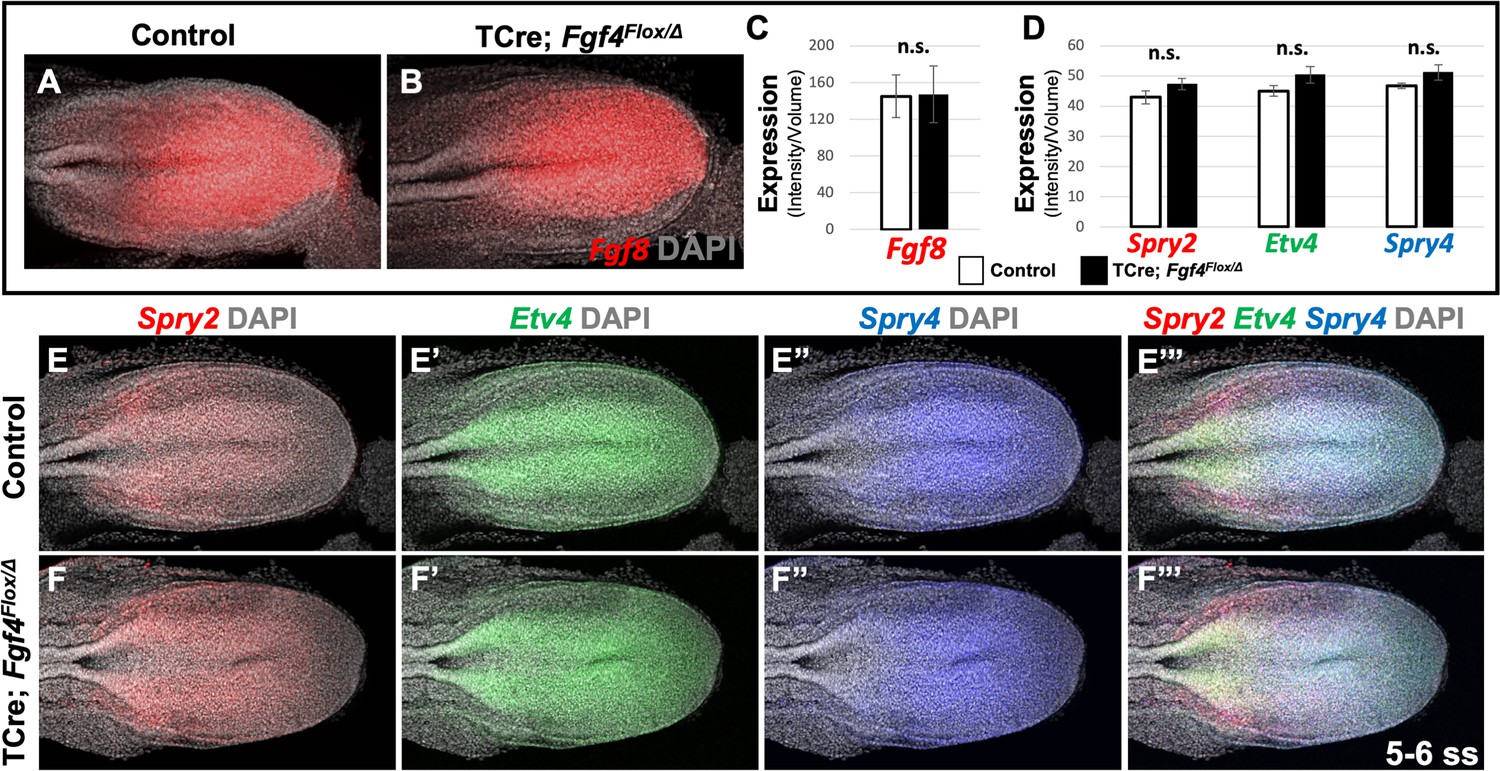
Fgf8 is sufficient for maintaining canonical FGF-responsive gene expression in Fgf4 mutants.
(A, B) HCR staining of 5–6 somite stage control (n = 6) and Fgf4 mutant (n = 3) embryos showing comparable expression of Fgf8, quantified in (C). (C) Quantification of Fgf8 mRNA expression, determined by measurement of fluorescent intensity per cubic micrometer within the volume the mesoderm- specific Tbx6 expression domain. Note, there is no significant difference between control and mutant embryos. (D) Quantification of HCR analysis of Spry2, Etv4, and Spry4 expression in 5–6 somite stage control (n = 4) and Fgf4 mutant (n = 4) embryos imaged in (E–F’’’). Data in C and D are mean ± s.e.m, significance determined by a Student’s t-test. All images: MIP, dorsal view, left. Same embryo shown in E- E’’’ and F- F’’’.
Figure 4 with 1 supplement
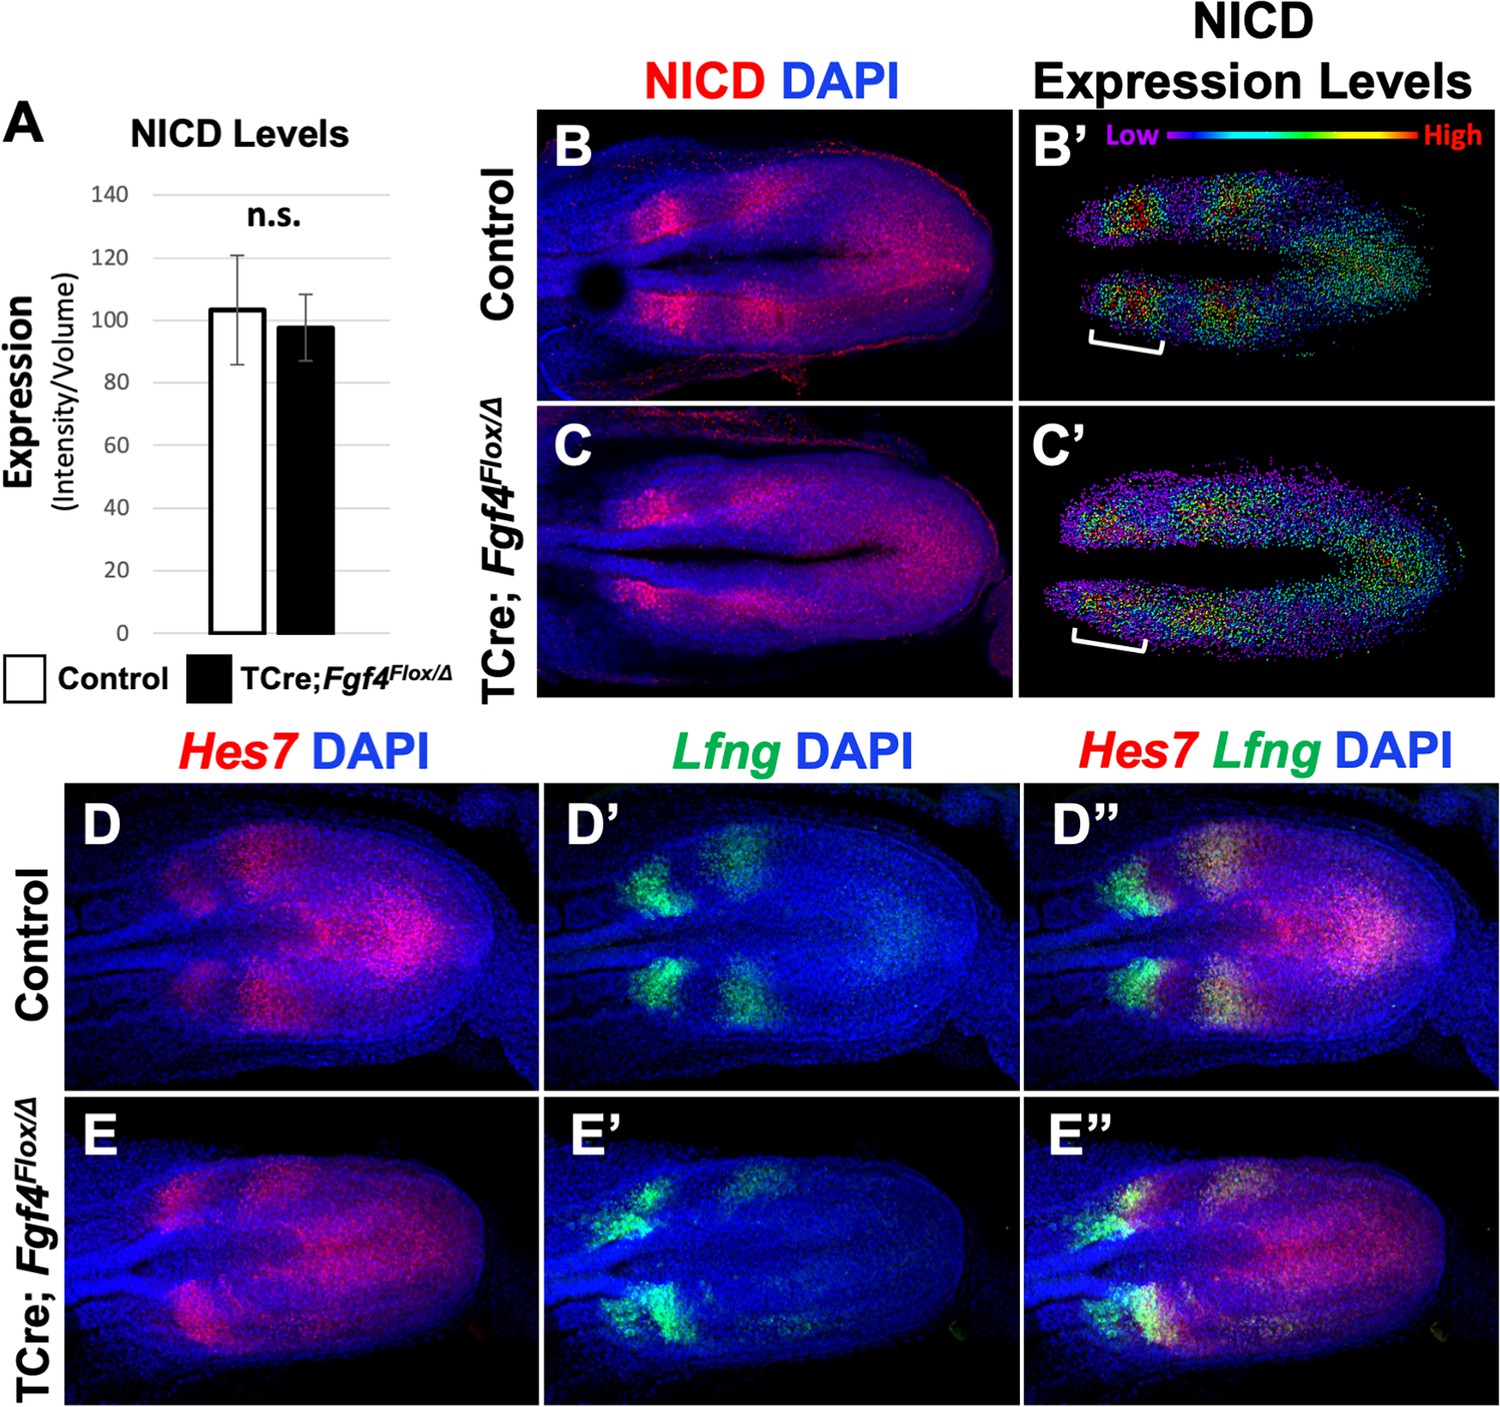
Pattern of Notch signaling is abnormal in Fgf4 mutants.
(A) Quantification of immunostained NICD fluorescent signal specifically in the mesoderm of 5–6 somite stage embryos. Note, there is no significant difference between Fgf4 mutants (n = 5) and littermate controls (n = 5). Data are mean ± s.e.m, significance determined by a Student’s t-test. (B, C) 5–6 somite stage control (B) or Fgf4 mutant (C) embryos immunostained for NICD. (B’ C’) Same images as in (B,C) but visualized using the Imaris spot modeling function where each fluorescent signal is represented as a colored sphere according to pixel intensity (lowest value is purple and highest value is red, as indicated). Note that the pattern in the Fgf4 mutant (C’) is less distinct compared to littermate control (B’); brackets indicate anterior PSM. (D–E’’) HCR staining of representative 5–6 somite stage control (n = 10) and Fgf4 mutant (n = 8) embryos for the indicated genes. Note Fgf4 mutant expression of Hes7 and Lfng in mutants is indistinct. All images: MIPs, dorsal view, anterior left. Same embryo shown in B, B’; C, C’; D-D’’; E-E’’.
Figure 4—figure supplement 1
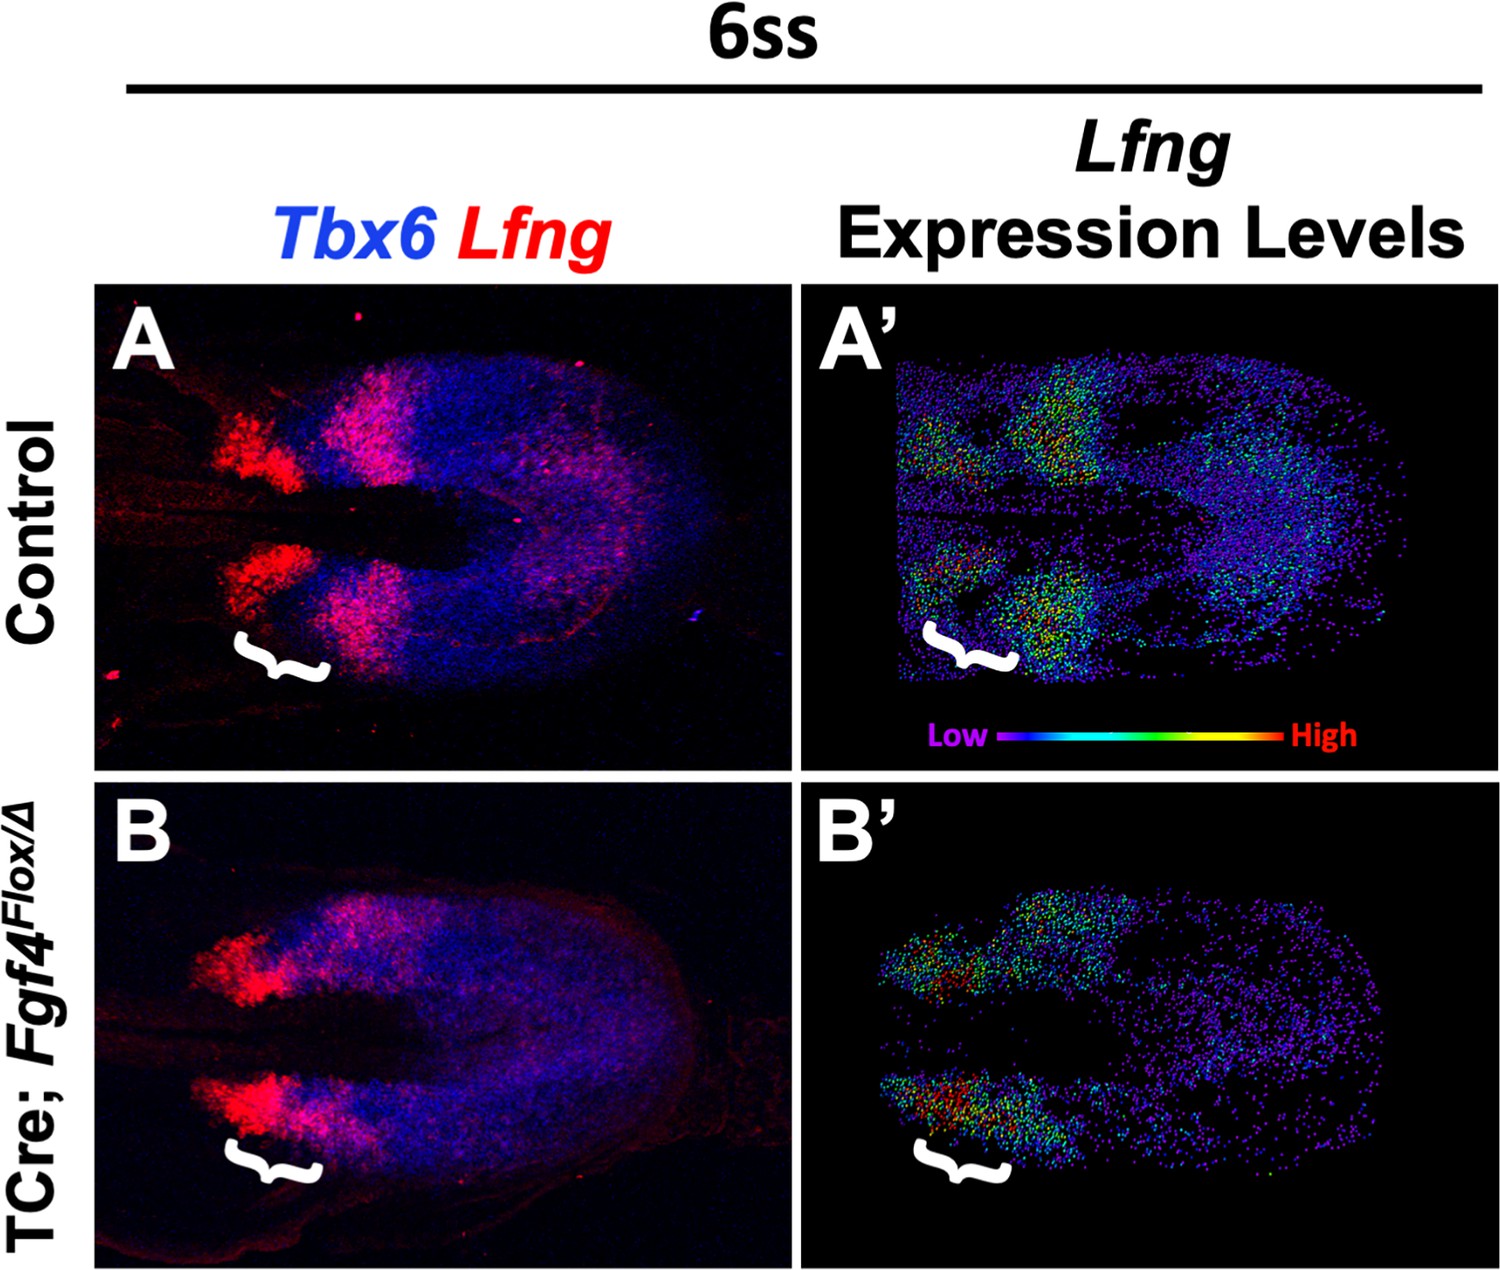
Lfng expression is abnormally patterned in Fgf4 mutants.
(A, B) HCR staining of Lfng and Tbx6 expression in control (A) and Fgf4 mutant embryos (B), showing abnormal expression of Lfng in mutants. (A’, B’) Spot models of Lfng expression visualized using the Imaris spot modeling function where each fluorescent signal is represented as a colored sphere according to pixel intensity (lowest value is purple and highest value is red, as indicated). Note lack of downregulation of Lfng between expression domains at the anterior boundary of Tbx6 in mutants at somite stage 6 (white brackets). Images are MIPs of confocal images, dorsal view, anterior to left.
Figure 5 with 5 supplements
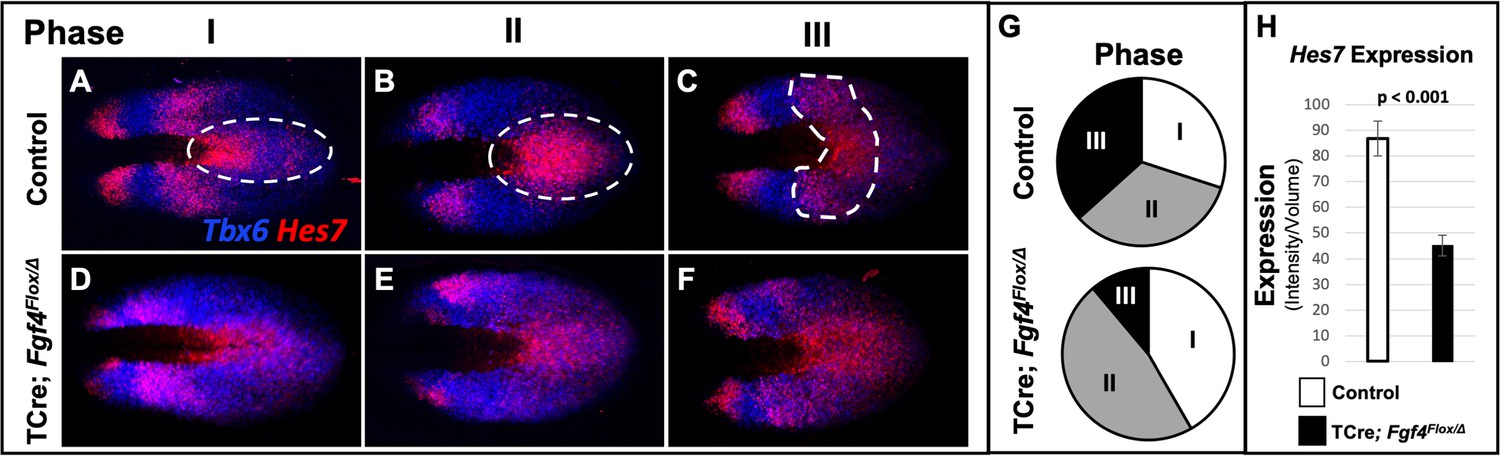
Hes7 expression is abnormally patterned and reduced in Fgf4 mutants.
(A–F) HCR staining for Hes7 expression in 5–6 somite stage control and Fgf4 mutant embryos sorted by phase of oscillation, showing abnormal expression of Hes7 in mutants. (G) Distribution of phases in control and Fgf4 mutants shown in A-F; controls: phase I, n = 9; phase II, n = 10; phase III, n = 11. Fgf4 mutants: phase I, n = 6; phase II, n = 9; phase III, n = 2. (H) Quantification of Hes7 expression specifically within the PSM (all phases combined) in 5–6 somite stage control (n = 11) and Fgf4 mutant (n = 8) embryos shows significantly decreased expression in the Fgf4 mutant. Quantification of Hes7 mRNA expression, determined by measurement of fluorescence intensity per cubic micrometer within the volume the mesoderm-specific Tbx6 expression domain. Data in H are mean ± s.e.m, significance determined by a Student’s t-test. All images are MIPs, dorsal view, anterior to left.
Figure 5—figure supplement 1
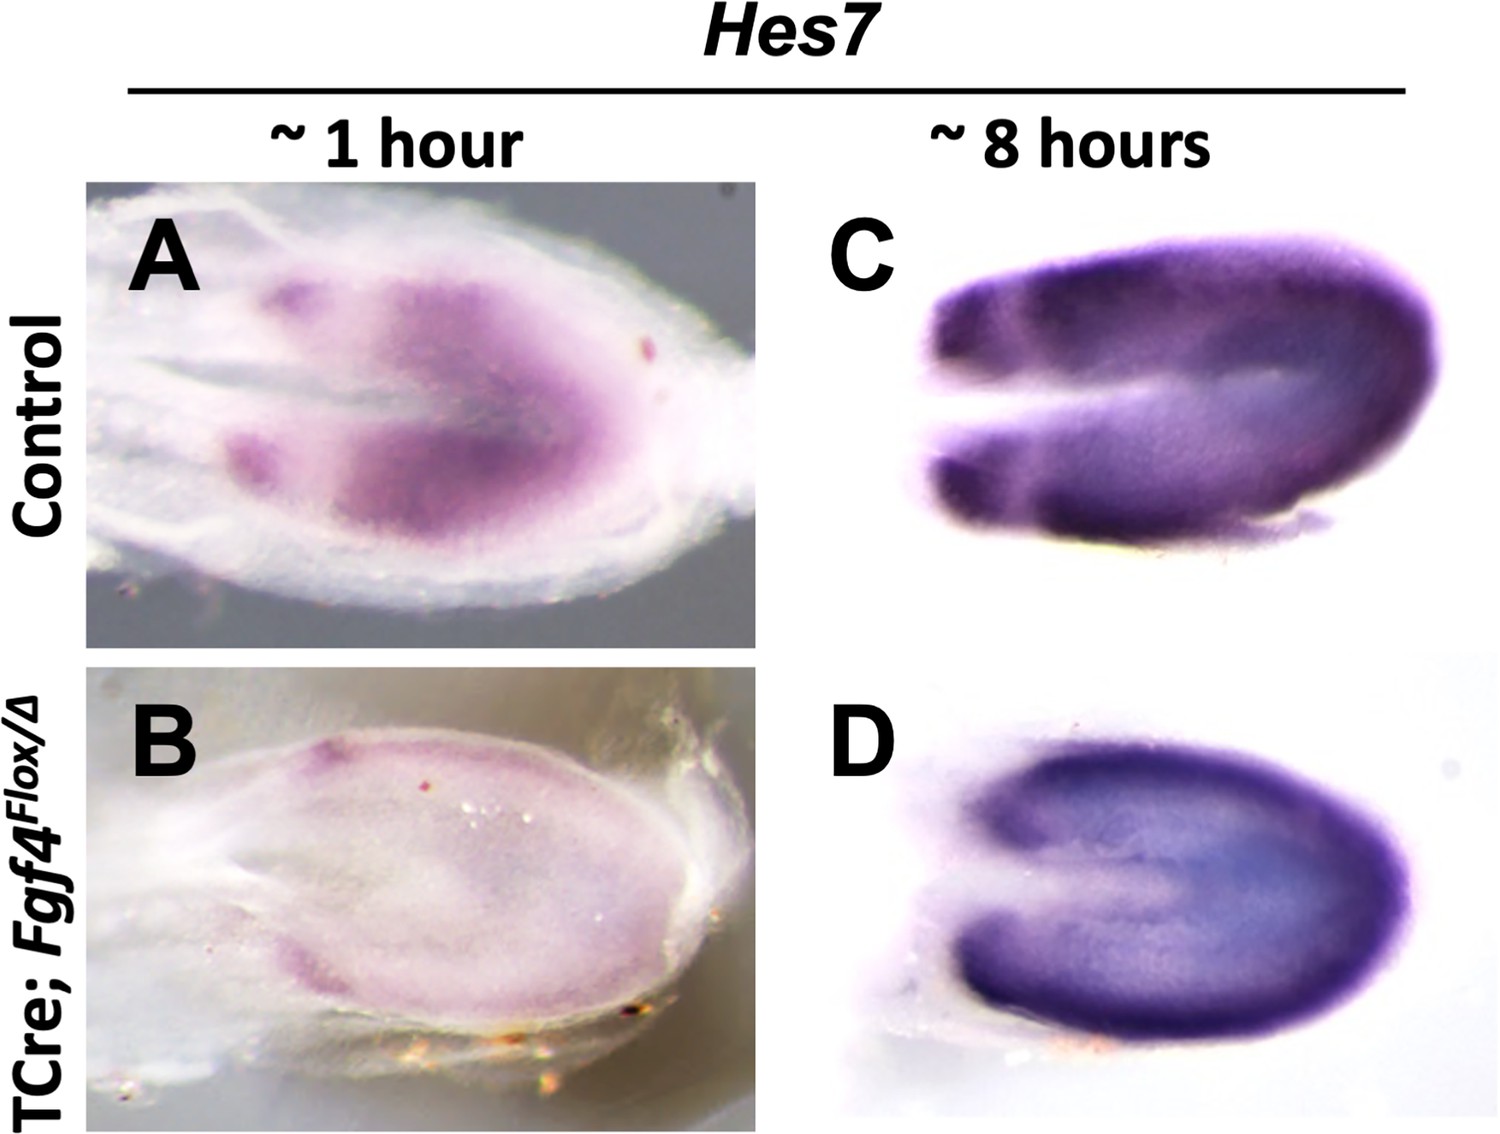
Hes7 expression is abnormal in Fgf4 mutants.
(A–D) Chromogenic whole mount in situ hybridization of Hes7 mRNA in 5–6 somite stage control and Fgf4 mutant embryos. Development of chromogenic signal was either not saturated (developed for ~1 hr in A, B) or saturated (developed for ~8 hr in C, D). Note decreased expression in Fgf4 mutants (B) and abnormal pattern of oscillations (D). All images are dorsal views, anterior left and representative: A, n = 4; B, n = 4; C, n = 4; D, n = 6.
Figure 5—figure supplement 2
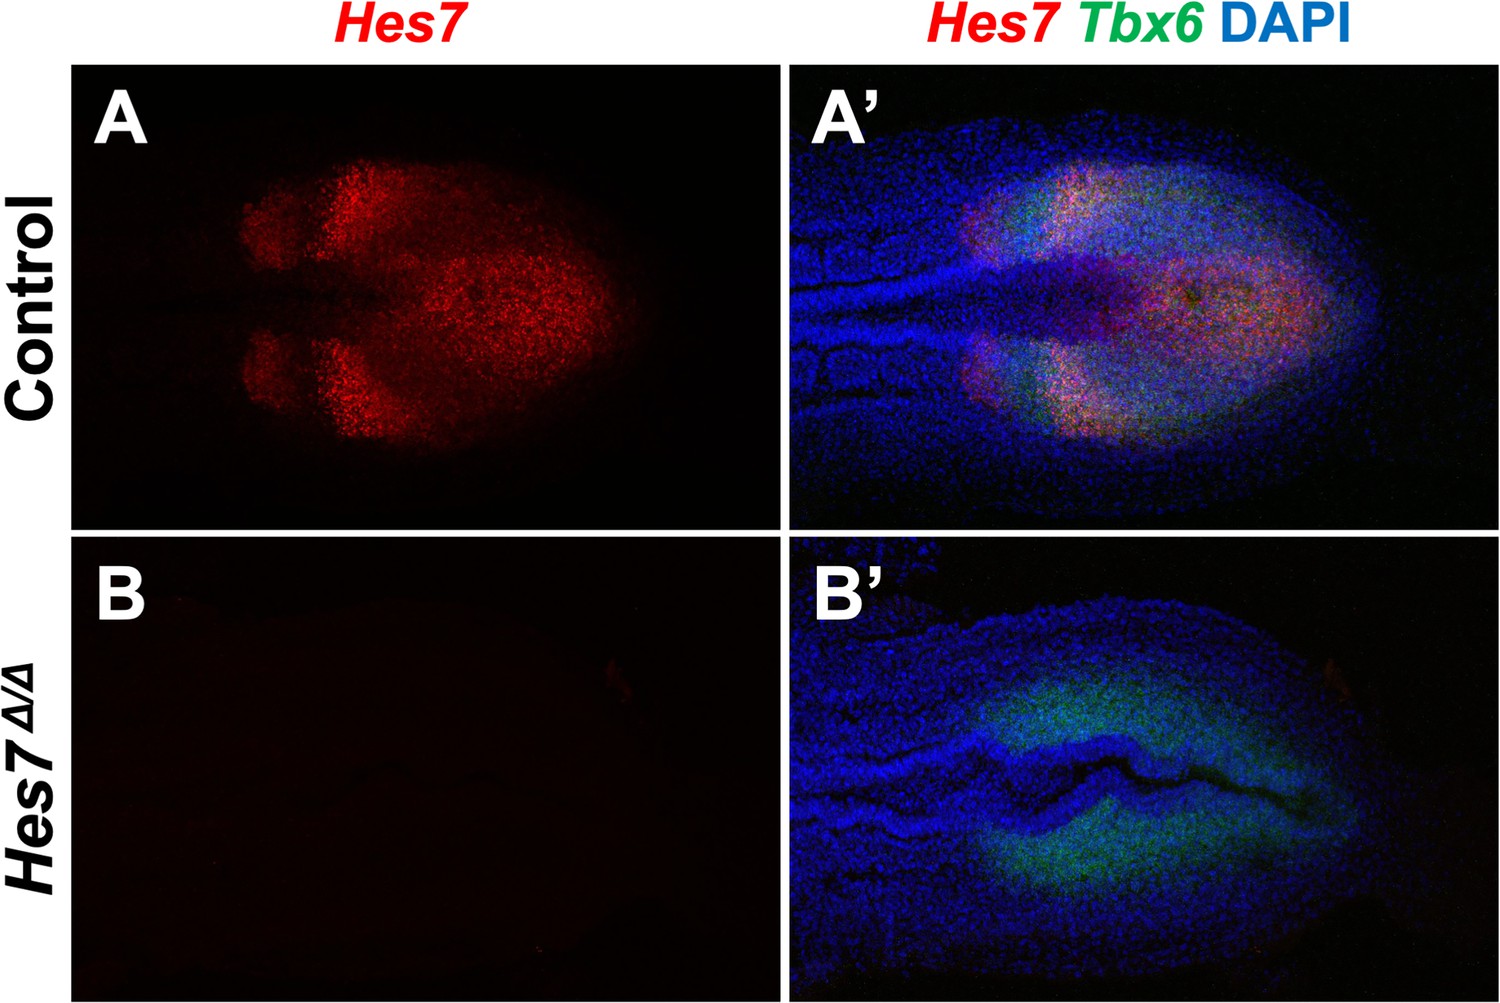
Using Hes7 null homozygotes to adjust Imaris baseline cutoff.
(A, B) HCR staining of 5–6 somite stage control (n = 3) and Hes7 mutant (n = 3) embryos using probes complimentary to the deleted region of Hes7. Note that the probe does not detect any product generated by the Hes7 null allele. (A’, B’) Composite image with Tbx6 and DAPI staining in combination with Hes7 of the same embryos as in A and B. All images are representative MIPs, dorsal view, anterior left. The baseline cutoff for Imaris-modeling of control and Fgf4 mutant embryos was adjusted until a signal was absent from such Hes7 null homozygotes. Same embryo shown in A, A’ and B, B’.
Figure 5—figure supplement 3

Imaris-modeling HCR Expression.
(A) HCR staining of Hes7 and Tbx6 in a 5–6 somite stage wildtype embryo; dorsal view, anterior left. (B) Imaris-generated surface model of Tbx6 expression domain from A. (C) Imaris-generated spot modeling of Hes7 expression domain from A. (D) Anterior view of transverse projection of spot model in C. (E) Spot model in D with Hes7 spots outside of the Tbx6 surface model colored yellow. (F) Spot Hes7 model from C with spots outside the Tbx6 domain removed, thus only mesodermal spots remain. A similar Tbx6 surface model was used in the quantification of Hes7 expression levels in Figure 5H and Figure 5—figure supplement 1 and 4. Spot modeling in F demonstrates how the spot models were generated in Figures 6 and 7.
Figure 5—figure supplement 4
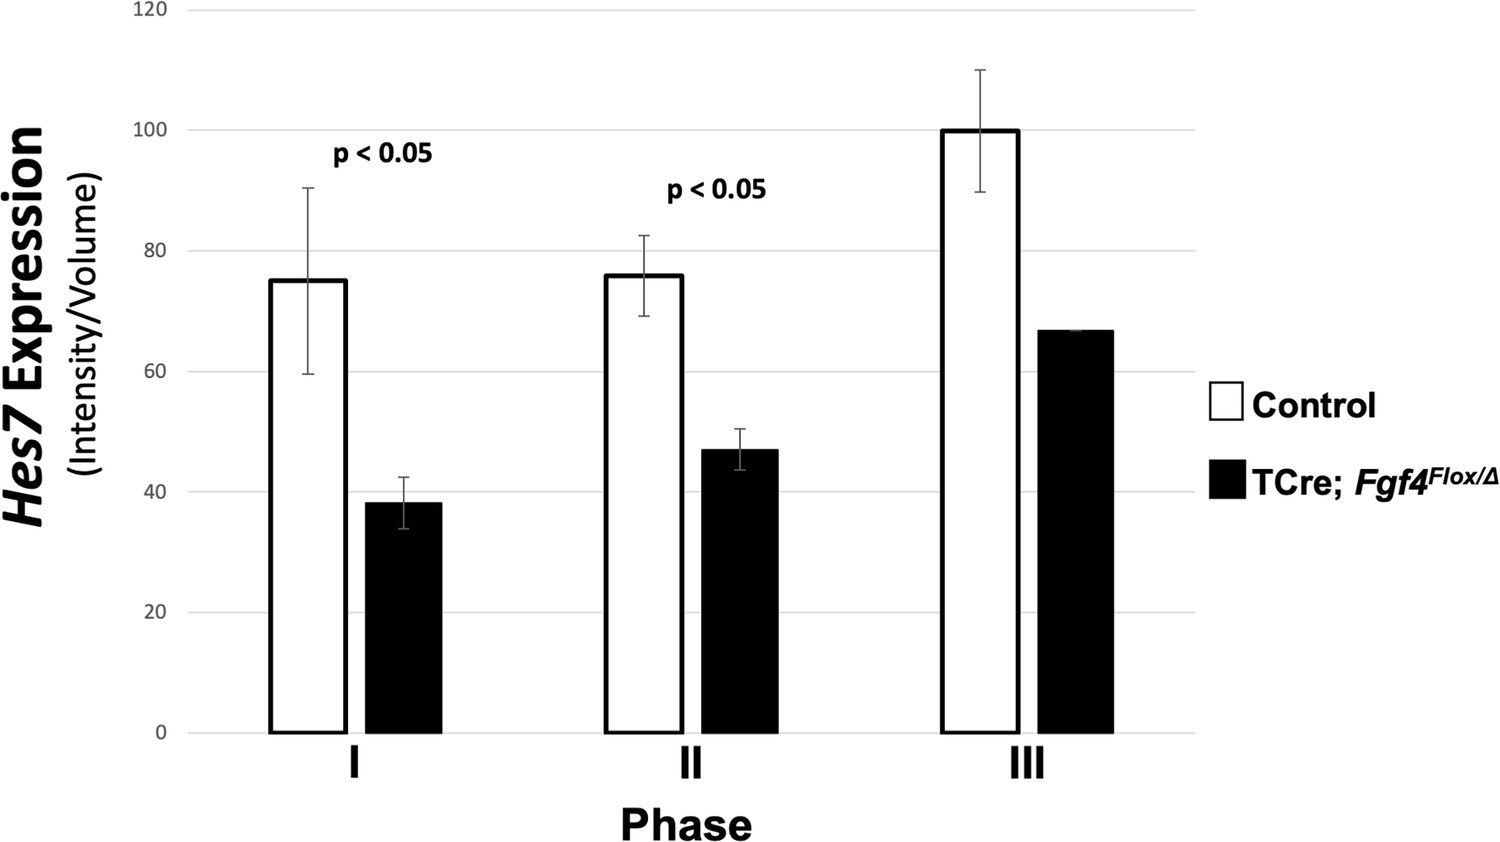
Hes7 expression in Fgf4 mutants is reduced, irrespective of oscillation phase.
Quantification of Hes7 expression within the PSM of control and Fgf4 mutants at 5–6 somite stage. Data and embryos are identical to Figure 5H, except that fluorescence intensity quantification values are segregated by phase.
Figure 5—figure supplement 5
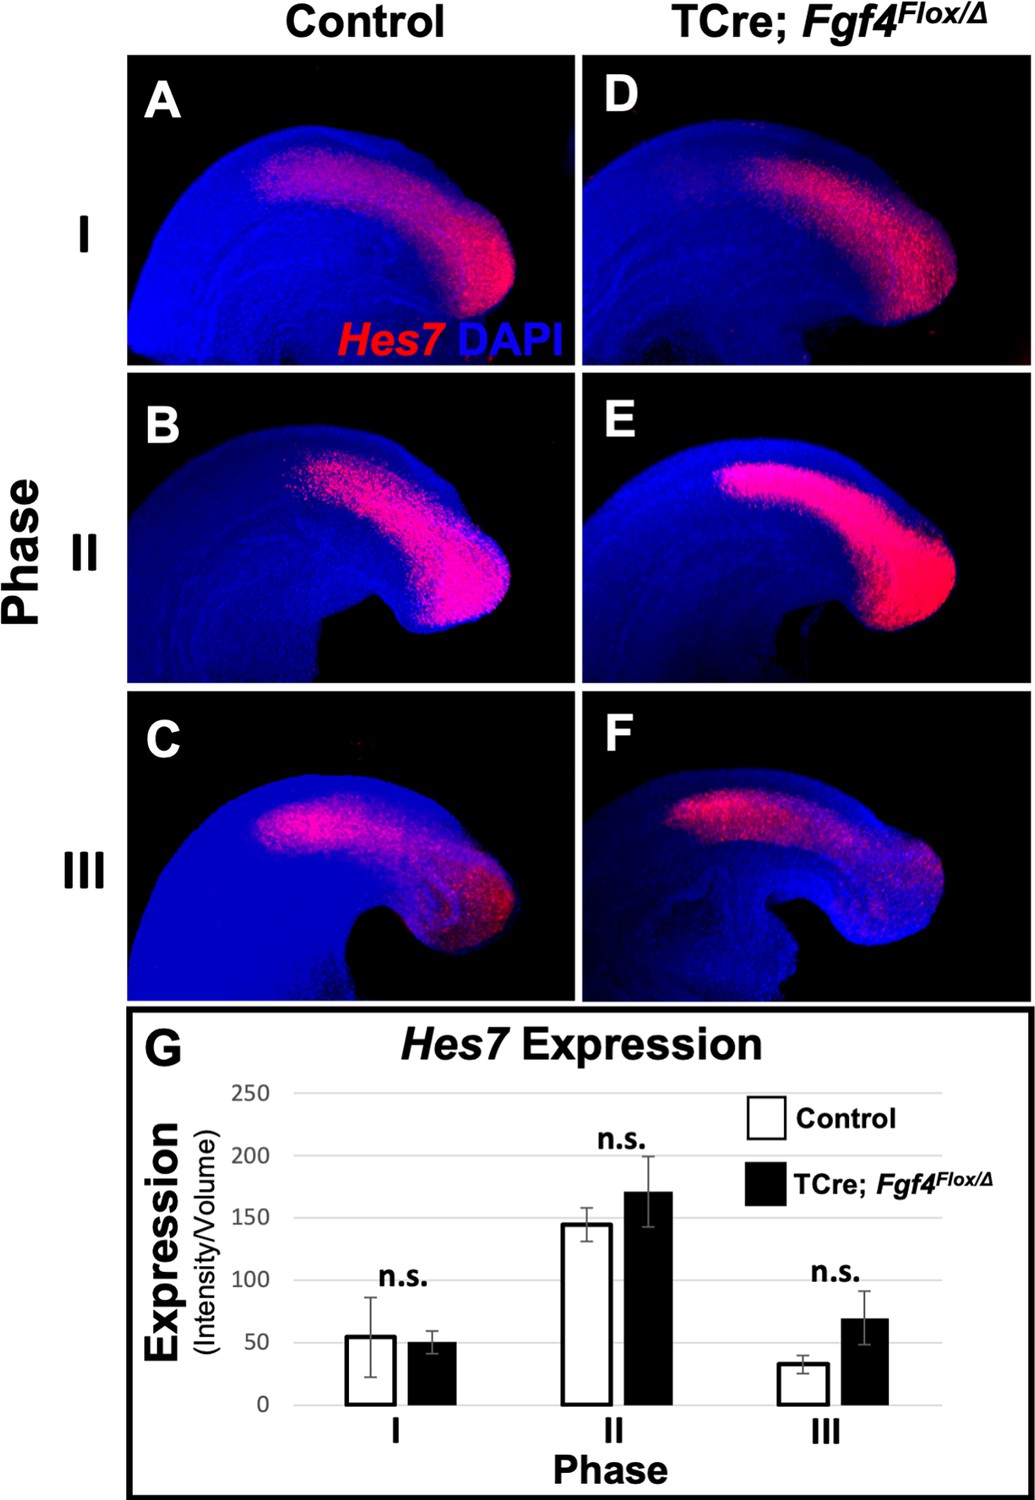
Hes7 expression is normal at 24–26 somite stage in Fgf4 mutants.
(A–F) HCR staining of representative 24–26 somite stage control and Fgf4 mutant embryos showing normal patterns of Hes7 expression for each phase of oscillation. MIP, lateral view with anterior to the left. (G) Quantification of Hes7 expression within the PSM, reveals no difference between controls and Fgf4 mutants. Measurement of Hes7 fluorescence intensity per cubic micrometer within the volume the mesoderm-specific Tbx6 expression domain; data are mean ± s.e.m, significance determined by a Student’s t-test. Controls: phase I, n = 3; phase II, n = 3; phase III, n = 4. Mutants: phase I, n = 4; phase II, n = 4; phase III, n = 3.
Figure 6

Reduced Hes7 expression with less distinct peaks and troughs in the Fgf4 mutant PSM.
(A, B) Spot models based on HCR analysis of Hes7 expression, in 5–6 somite stage control and Fgf4 mutant embryos within the PSM, as defined by the Tbx6 expression domain. Localized Hes7 expression is colored by level of expression from low (blue) to high expression (white), as indicated. Note there are less high expressors (yellow, red and white) and more low expressors (blue). This insight is quantified in (C), where the percentage of spots found in each expression-level group is graphed. Data are mean ± s.e.m, significance determined by a Student’s t-test; control, n = 6; mutant, n = 5. (D–E’) Composite of spot models from A and B. Note that the Hes7 expression trough (boxed region, expanded in D’ and E’) between anterior and posterior oscillatory peaks is less distinct in mutant (E’) with more higher expressors (green) than in control embryos (D’). (F–G’) MIP of HCR staining of 5–6 somite stage control and Fgf4 mutant embryos using probes against Tbx6, Hes7, and Hes7intron which specifically labels active Hes7 transcription. Note the trough of Hes7intron signal between peaks (brackets) in mutants is less pronounced than controls, indicating a failure of transcriptional repression of Hes7 in this region. Representative embryos are shown; control, n = 6; mutant, n = 5. All images are dorsal views, anterior left. Same embryo shown in F, F’; G, G’.
Figure 7 with 1 supplement
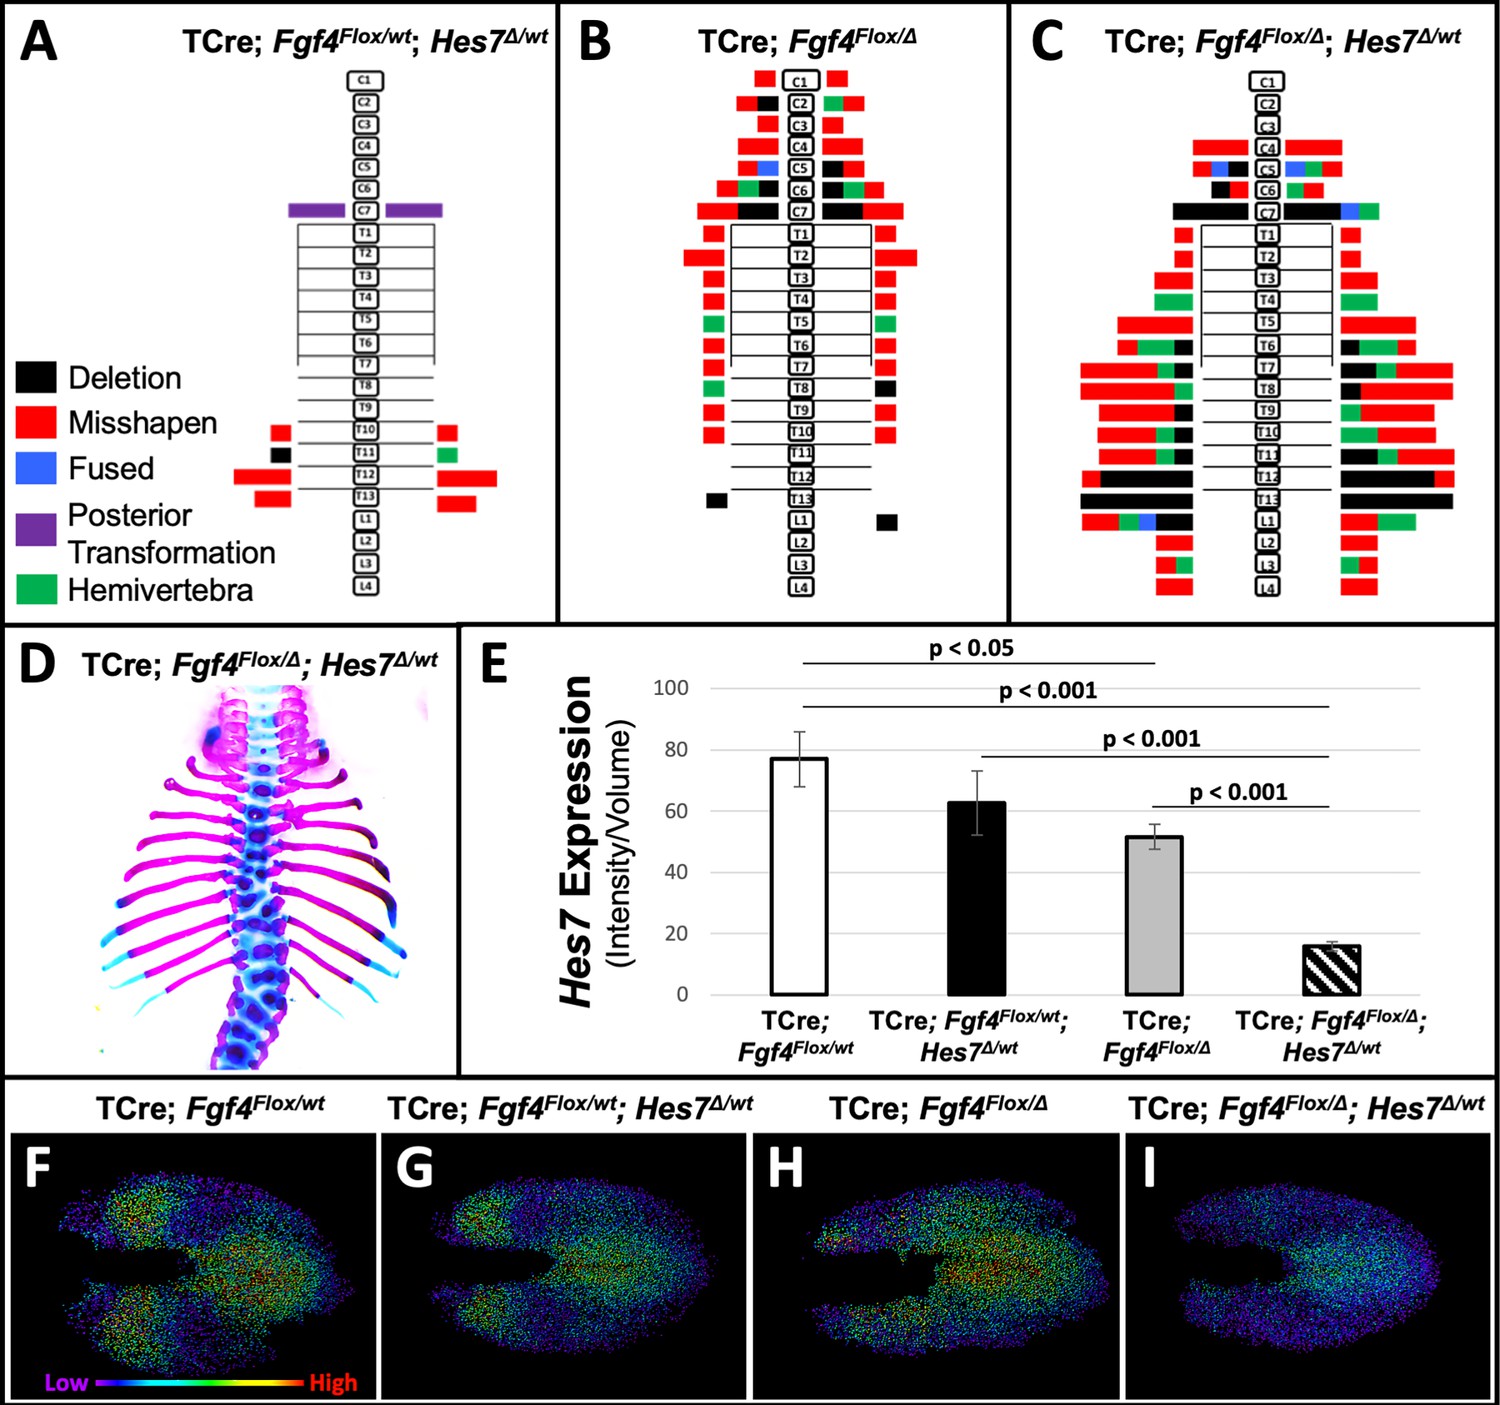
Removal of one Hes7 allele exacerbates vertebral defects in Fgf4 mutants.
(A–C) Histograms representing the vertebral column and associated ribs (C = cervical, T = thoracic, L = lumbar), showing variety and location of vertebral defects at E18.5 in the genotypes indicated (A and B, n = 7; C, n = 6). Each block in the histogram represents a single defect as indicated in the key in A. (D) Skeletal preparation of a representative E18.5 compound Fgf4 mutant- Hes7 heterozygote (ventral view). (E) Quantification of Hes7 expression within the PSM in 5–6 somite stage embryos of the indicated genotype: control (n = 10), Fgf4-Hes7 double heterozygotes (n = 6), Fgf4 mutants (n = 10), and compound Fgf4 mutant- Hes7 heterozygotes (n = 7). Quantification of Hes7 mRNA expression, determined by measurement of fluorescent intensity per cubic micrometer within the volume of the mesoderm-specific Tbx6 expression domain. Data in E are mean ± s.e.m, significance determined by a Student’s t-test. (F–I) Spot models based on HCR analysis of Hes7 expression, in embryos of the indicated genotype, within the PSM, as defined by the Tbx6 expression domain. Localized Hes7 expression is colored by level of expression from low (purple) to high expression (red), as indicated. Images F-I are dorsal views, anterior left.
Figure 7—figure supplement 1
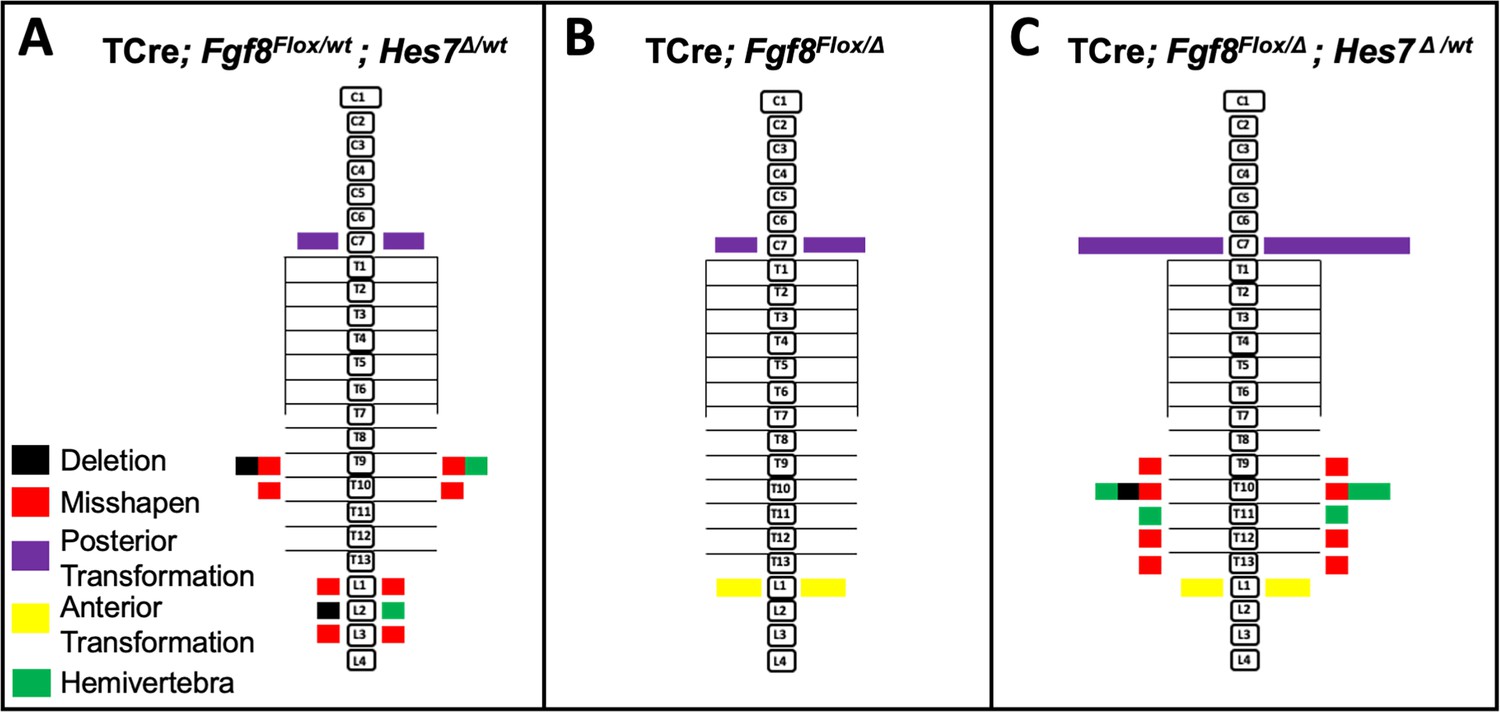
Removal of one Hes7 allele has no effect on vertebral defects in Fgf8 mutants.
Histograms representing the vertebral column and associated ribs (C = cervical, L = thoracic, L = lumbar), showing variety and location of vertebral defects at E18.5 in the genotypes indicated (A, n = 6; B, n = 5; C, n = 8). Each block in the histogram represents a single defect as indicated in the key in A. Note that the vertebral defects in the Fgf8/Hes7 mutants are additive, not synergistic.
Tables
Table 1
Experimental Crosses.
| Experimental cross | Experimental genotype (Freq) | Control genotype (Freq) |
|---|---|---|
| Fgf4flox/flox x TCreTG/TG; Fgf4Δ/wt | TCreTG/0; Fgf4flox/Δ (1/2) | TCreTG/0; Fgf4flox/wt (1/2) |
| Fgf8flox/flox x TCreTG/TG; Fgf8Δ/wt | TCreTG/0; Fgf8flox/Δ (1/2) | TCreTG/0; Fgf8flox/wt (1/2) |
| Hes7Δ/wt x Hes7Δ/wt | Hes7Δ/Δ (1/4) | Hes7wt/wt (1/4) |
| Fgf4flox/flox; Hes7Δ/wt x TCreTG/TG; Fgf4Δ/wt | TCreTG/0; Fgf4flox/Δ; Hes7Δ/wt (1/4) | TCreTG/0; Fgf4flox/wt (1/4) TCreTG/0; Fgf4flox/wt; Hes7Δ/wt (1/4) TCreTG/0; Fgf4flox/Δ (1/4) |
| Fgf8flox/flox; Hes7Δ/wt x TCreTG/TG; Fgf8Δ/wt | TCreTG/0; Fgf8flox/Δ; Hes7Δ/wt (1/4) | TCreTG/0; Fgf8flox/wt (1/4) TCreTG/0; Fgf8flox/wt; Hes7Δ/wt (1/4) TCreTG/0; Fgf8flox/Δ (1/4) |
-
Experimental cross is always written ‘female x male’.
Δ = ‘deletion’ or null.
Key resources table
| Reagent type (species) or resource | Designation | Source or reference | Identifiers | Additional information |
|---|---|---|---|---|
| Strain, strain background Mus musculus | Fgf4Flox/delta | PMID:10802662 | MGI:95518 | |
| Strain, strain background Mus musculus | Fgf8flox/delta | PMID:9462741 | MGI:99604 | |
| Strain, strain background Mus musculus | Hes7delta | PMID:11641270 | MGI:2135679 | |
| Strain, strain background Mus musculus | TCre | PMID:16049111 | MGI:3605847 | |
| Chemical compound, drug | Alcian Blue 8GX | Sigma | A5268-25G | |
| Chemical compound, drug | Alizarin Red | Sigma | A-5533 | |
| Chemical compound, drug | BM Purple | Roche | 11 442 074 001 | |
| Chemical compound, drug | Dapi | Life Technologies | D21490 | |
| Chemical compound, drug | Iohexol (Nycodenz) | Accurate Chemical and Scientific Corp | AN1002424 | |
| Chemical compound, drug | Ultra-low gelling temperature agarose | Sigma | A5030 | |
| Chemical compound, drug | Hydrogen peroxide | Sigma | 516813–500 ML | |
| Chemical compound, drug | Ammonium Chloride | Mallinckrodt | 3384 | |
| Chemical compound, drug | N-Methylacetamide | Sigma | AN1002424 | |
| Chemical compound, drug | Triton-X-100 | Sigma | T8787 | |
| Chemical compound, drug | fluorescein | Sigma | 46960 | |
| Chemical compound, drug | acid blue 9 | TCI | CI42090 | |
| Chemical compound, drug | rose bengal | Sigma | 198250 | |
| Commercial assay or kit | V3.0 HCR Kit | Molecular Instruments | Wholemount Mouse Embryo | |
| Software, algorithm | Imaris Software | Bitplane Inc | Imaris V9.2.1 | |
| Antibody | Anti-NICD (rabbit polyclonal) | CST | #4147 | (1:100) |
| Antibody | Anti-rabbit alexa-647 (goat polyclonal) | Thermo Fisher Scientific | A32733 | (1:100) |
| Antibody | Anti-Dig (sheep FAB fragments) | Roche | 11 093 274 910 | (1:4000) |
| Other | Fetal calf serum | Thermo Fisher Scientific | 16140071 |
Additional files
Download links
A two-part list of links to download the article, or parts of the article, in various formats.
Downloads (link to download the article as PDF)
Open citations (links to open the citations from this article in various online reference manager services)
Cite this article (links to download the citations from this article in formats compatible with various reference manager tools)
Fgf4 maintains Hes7 levels critical for normal somite segmentation clock function
eLife 9:e55608.
https://doi.org/10.7554/eLife.55608


