Establishment of H3K9me3-dependent heterochromatin during embryogenesis in Drosophila miranda
- Department of Integrative Biology, University of California, Berkeley, United States
Figures
Figure 1 with 2 supplements
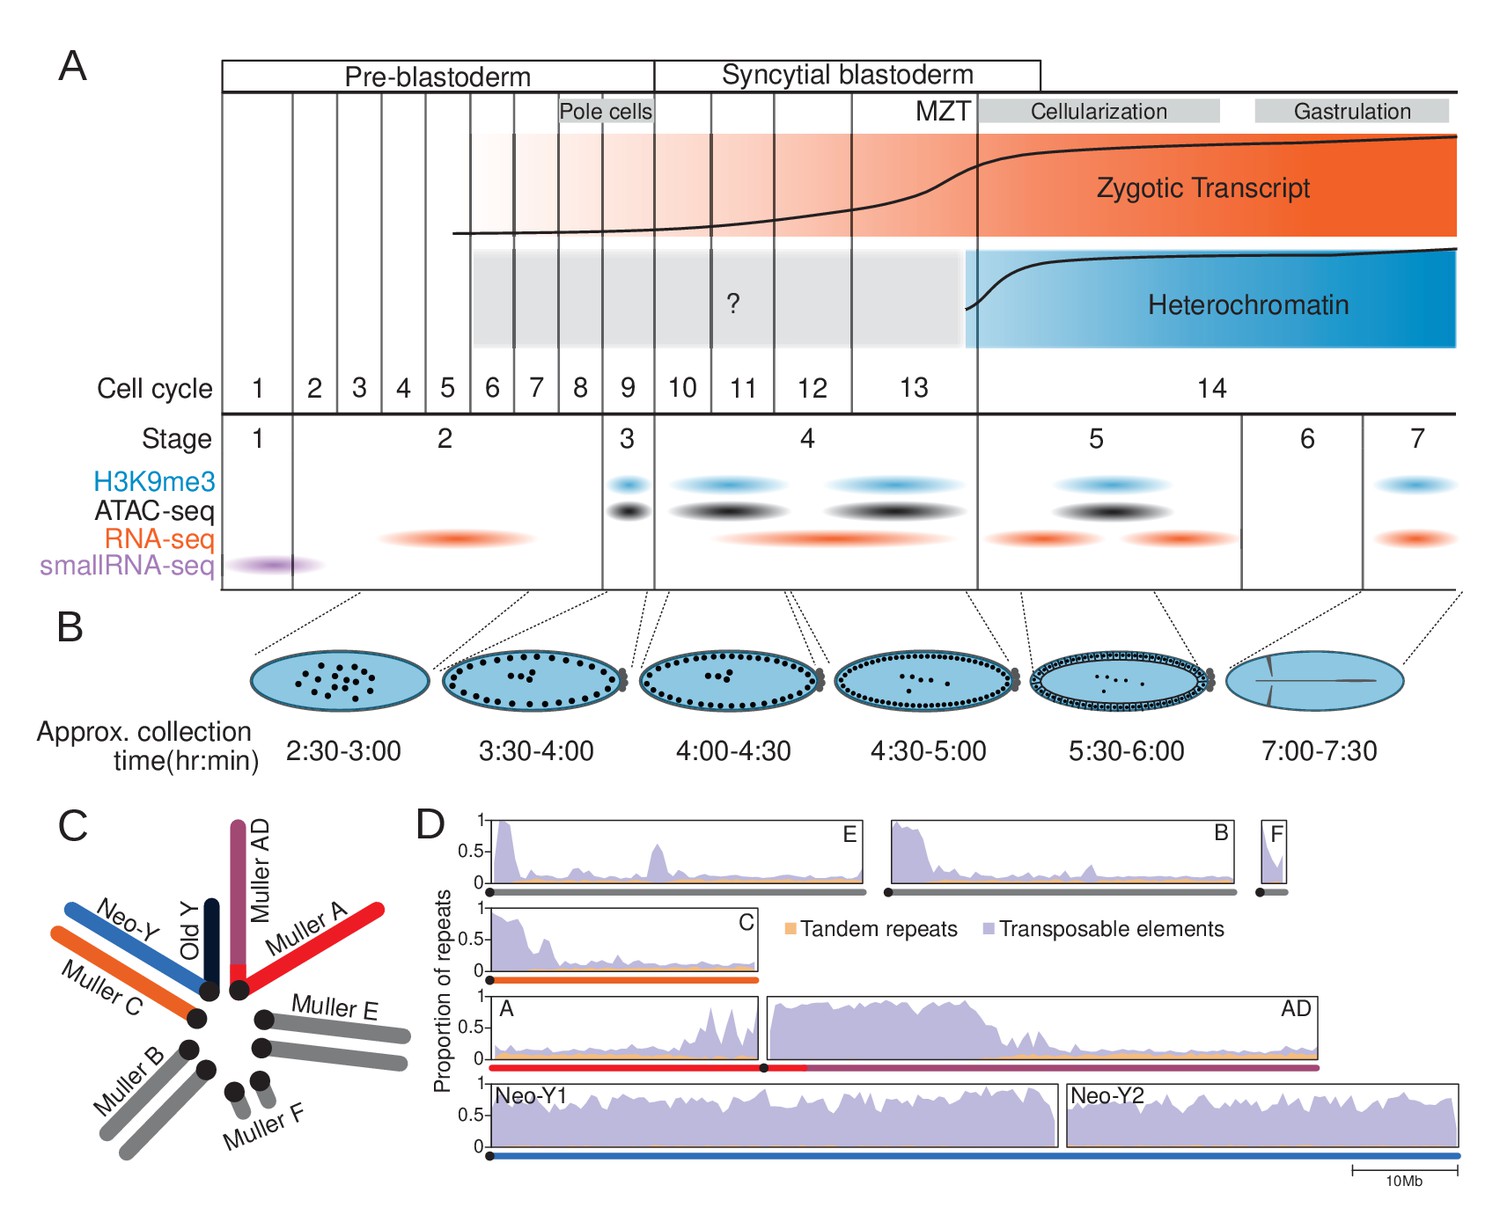
The repeat-rich genome of Drosophila miranda as a model to characterize heterochromatin establishment.
(A) Time course of embryonic development. Major landmarks including the maternal to zygotic transition (MZT) are labeled. The orange and blue track depicts the approximate amount of zygotic expression and heterochromatin, respectively, throughout development. The cell cycle numbers and their corresponding embryonic stages are labeled. (B) Cartoon diagram of the embryonic landmarks used for staging. The approximate time points of embryo collection are labeled under the embryo diagrams. (C) Karyotype of D. miranda male. Muller elements are labeled and the sex chromosomes are color-coded: neo-Y (blue), ancestral Y (dark navy), neo-X (orange), and X (red and purple). (D) Repeat content of the D. miranda genome assembly. The cumulative repeat content for each chromosome is depicted, with tandem repeats in orange and transposable elements in purple; unless otherwise stated, these repeat classes will be distinguished by these colors throughout the manuscript. Karyotypes are drawn below the graphs with the chromosomes color-coded as in (C).
Figure 1—figure supplement 1
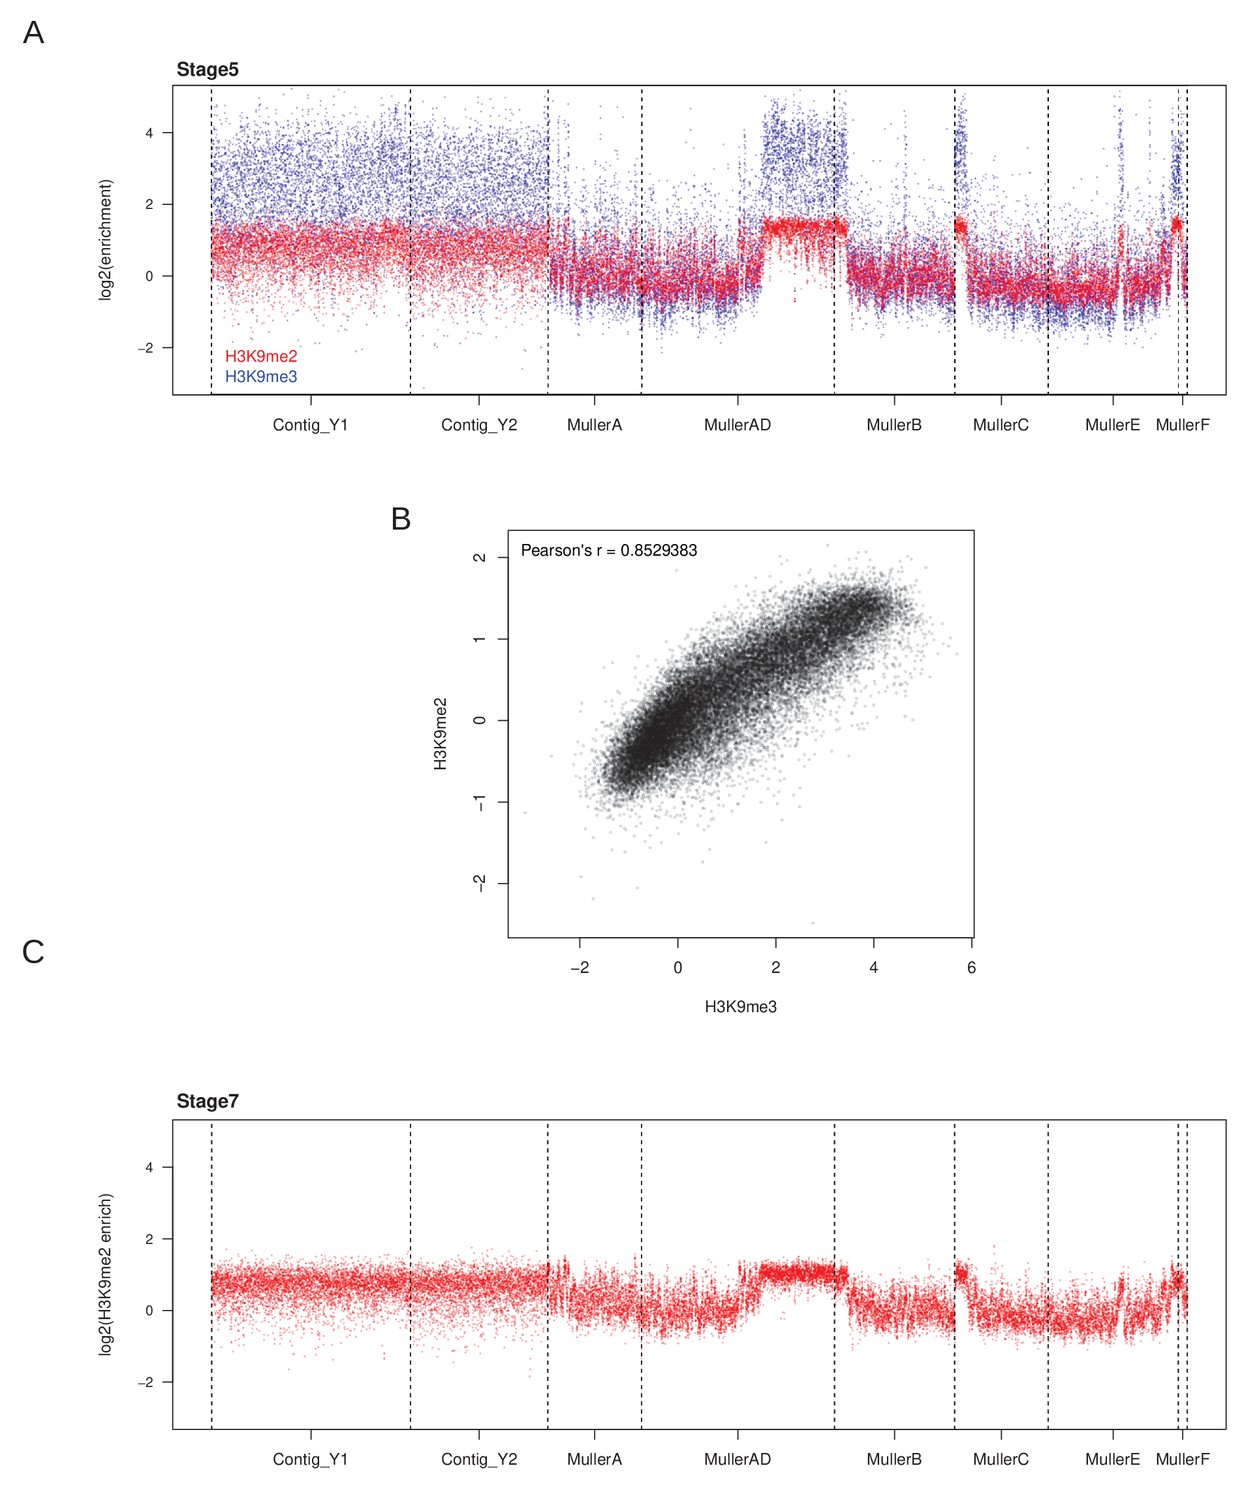
Correlation between H3K9me2 and H3K9me3 enrichment.
(A) H3K9me2 (red) and H3K9me3 (blue) ChIP-seq from the same embryos. Each single embryo nuclei prep was subdivided into two for pull-downs with antibodies against H3K9me2 and H3K9me3. Each point is enrichment averaged across a nonoverlapping 5 kb window. (B) Correlation between H3K9me3 and H3K9me2 enrichment from (A). (C) H3K9me2 ChIP-seq from stage 7 embryos.
Figure 1—figure supplement 2
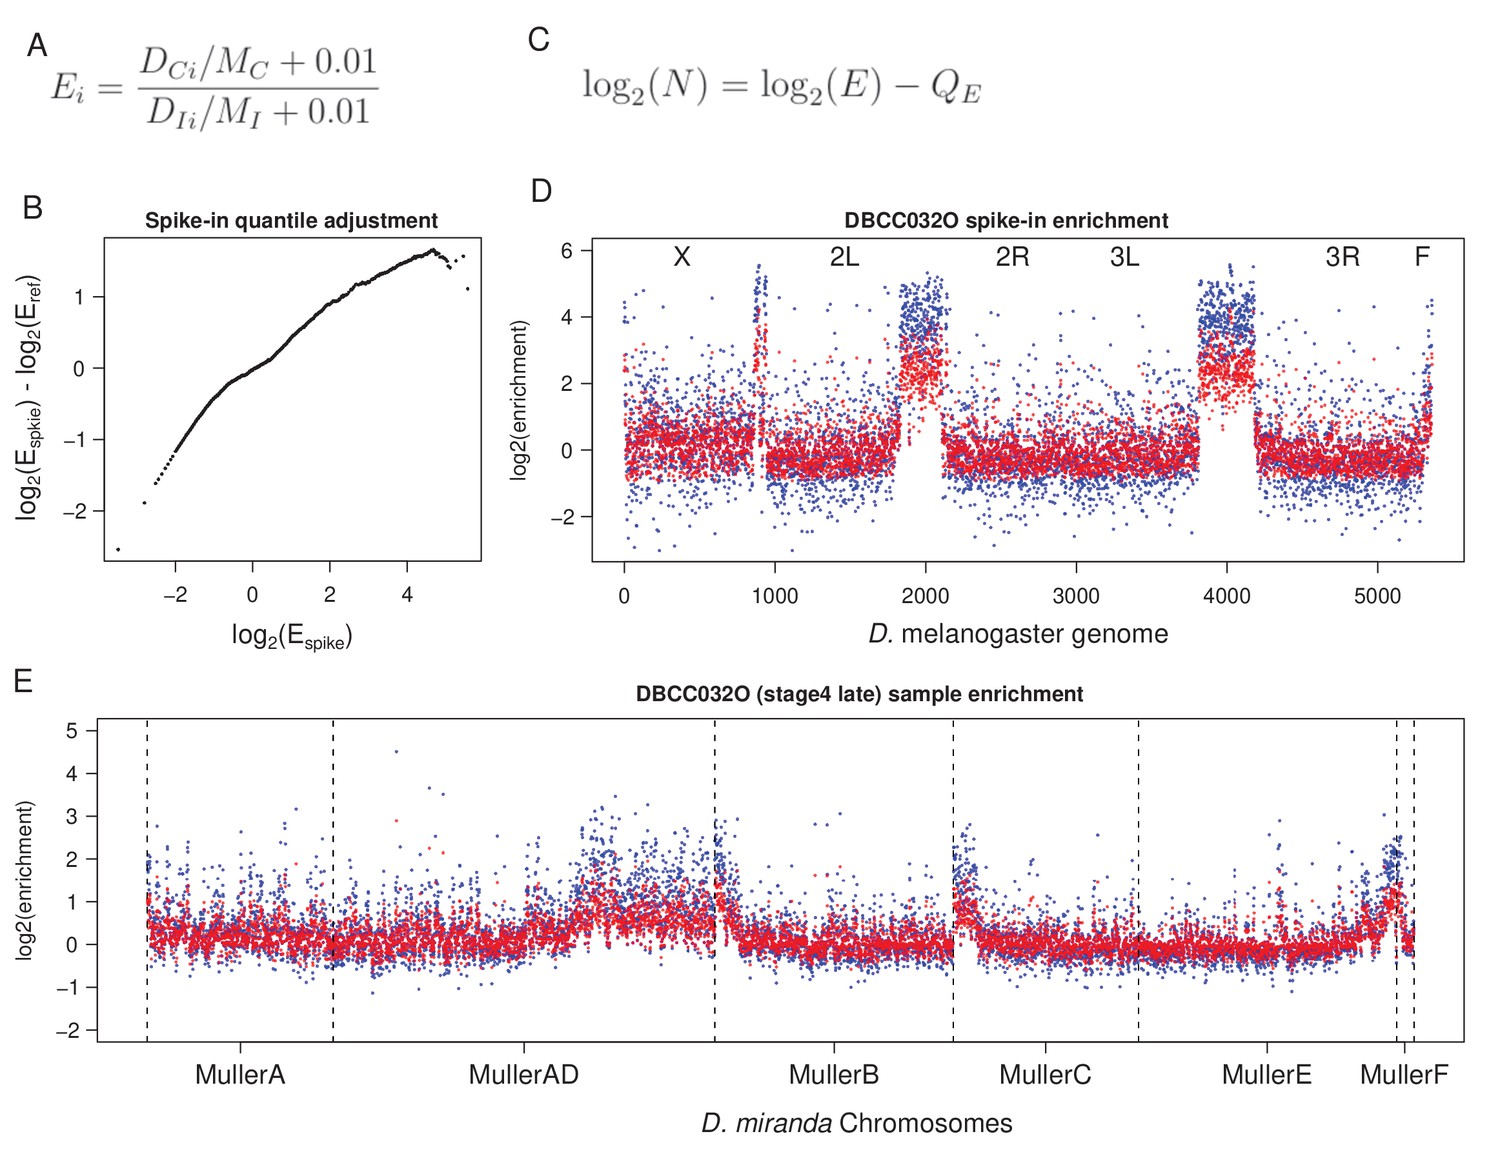
Quantile-informed spike-in normalization procedure.
(A) Enrichment in the sample and the spike-in are first determined as per the equation. Enrichment (E) at genomic window i is determined by normalizing coverage (D) of the ChIP (C) and Input (I) samples by the median autosomal coverage (M) with a 0.01 small pseudo-count. A spike-in reference is then generated by averaging the enrichment value across all spike-in samples. (B) To match the quantiles (at 0.1 intervals) between the enrichment in spike-in with that of the spike-in reference, we subtracted the the log2 enrichment of the former from the latter, generating an adjustment profile (Q). The adjustment profile provides information regarding how much each quantile and the corresponding enrichment needs to be adjusted to match the spike-in with the reference. (C) Based on this adjustment profile (Q), for a given enrichment value (E) across the genome, the quantile-informed spike-in normalized enichment (N) is then simply described by this equation. (D) Normalization applied to the spike in (D. melanogaster) sample. (E) Normalization applied to the corresponding actual (D. miranda) samples. Blue and red points are the enrichment before and after transformation, respectively. Chromosomes are demarcated by dotted lines.
Figure 2 with 2 supplements

Developmental trajectory of heterochromatin enrichment and peaks.
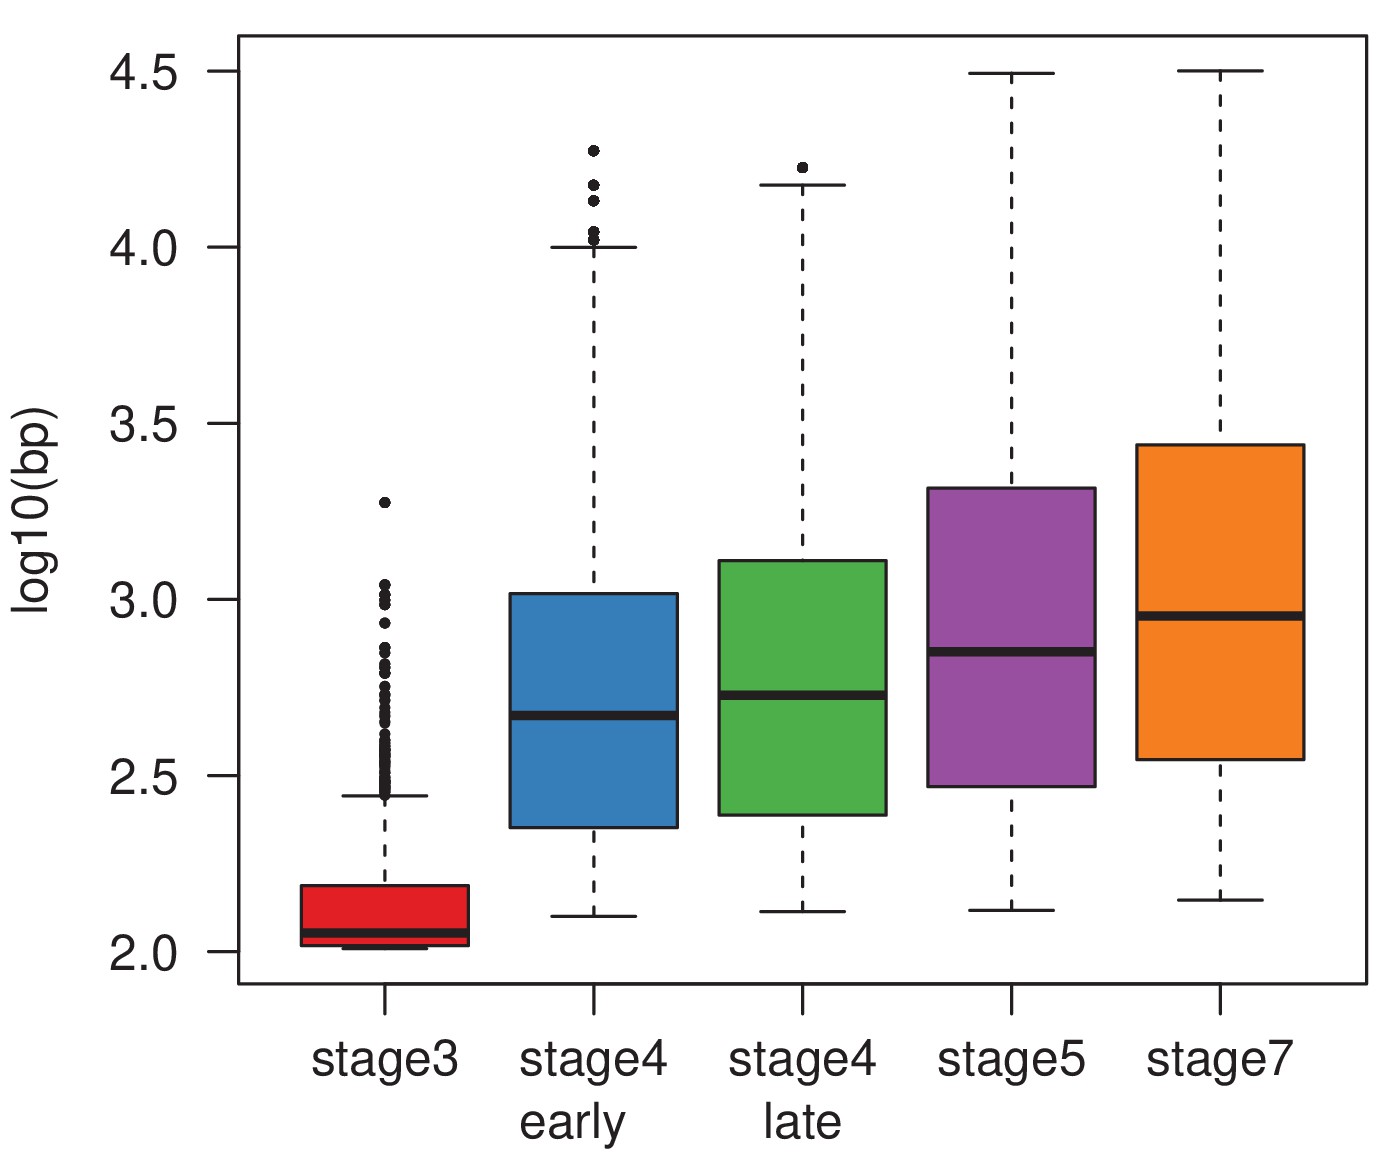
(A) Genome-wide H3K9me3 enrichment landscape through five embryonic stages. Karyotypes are depicted below the X-axis, with the centromeres marked by black circles. (B) Width and height of H3K9me3 peaks (points), as determined by MACS2, is plotted in log scale on the X- and Y-axes, respectively. Stages are color labeled with number of peaks in parentheses. Circles outline areas in which the bulk of the points of a stage reside. Unless otherwise stated, the developmental stages will be differentiated consistently with these colors henceforth. (C) Median H3K9me enrichment in log scale is plotted ±1 kb around peaks for each stage. Gray area demarcates the 95% confidence intervals. (D) H3K9me3 enrichment trajectory of peaks called for each stage across development. For every set of peaks called in each stage, the median enrichment value is plotted and connected across all developmental stages with the 95% CI demarcated by vertical lines. For example, red points and lines are the enrichment values around stage 3 peaks across all five stages. Points and CIs are horizontally staggered for clarity. (E) Colored areas in pie chart mark the proportion of stage 7 peaks that are already enriched (>1.5-fold enrichment) in previous stages. (F) Barplot format of (E), but for peaks called in every stage.
Figure 2—figure supplement 1
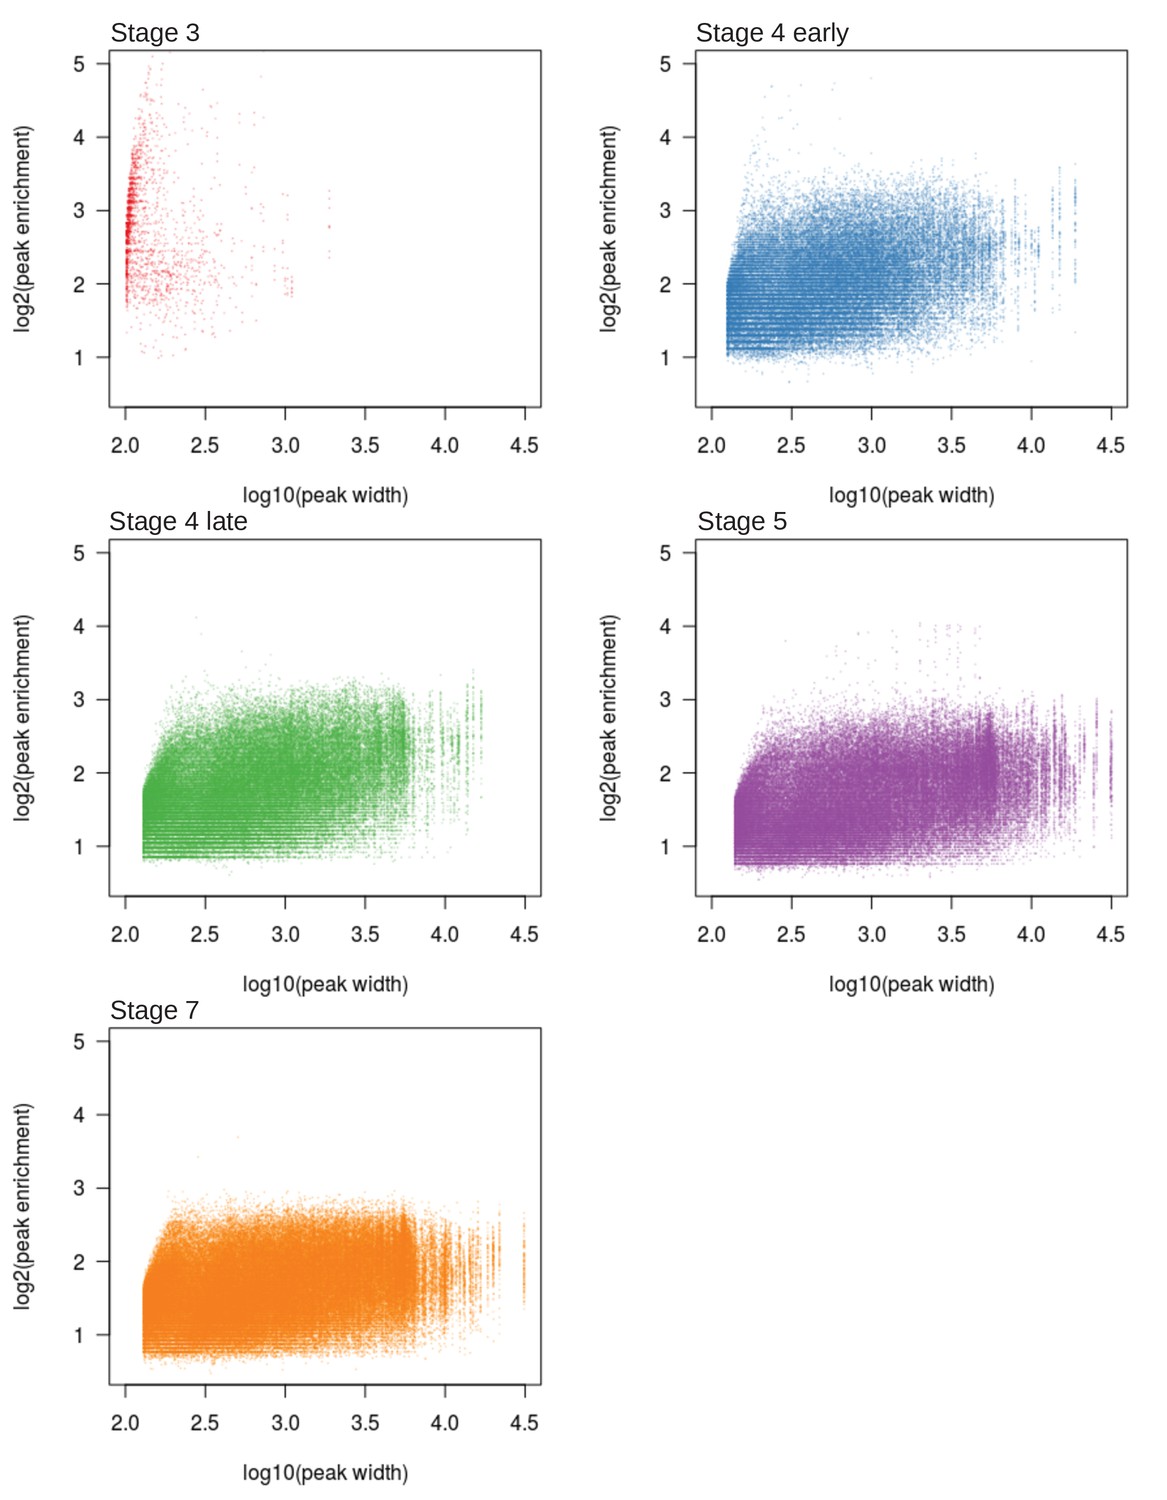
Width and height of H3K9me3 enrichment peaks across different developmental stages.
Figure 2—figure supplement 2
Distribution of peak widths across developmental stages.
Figure 3 with 4 supplements
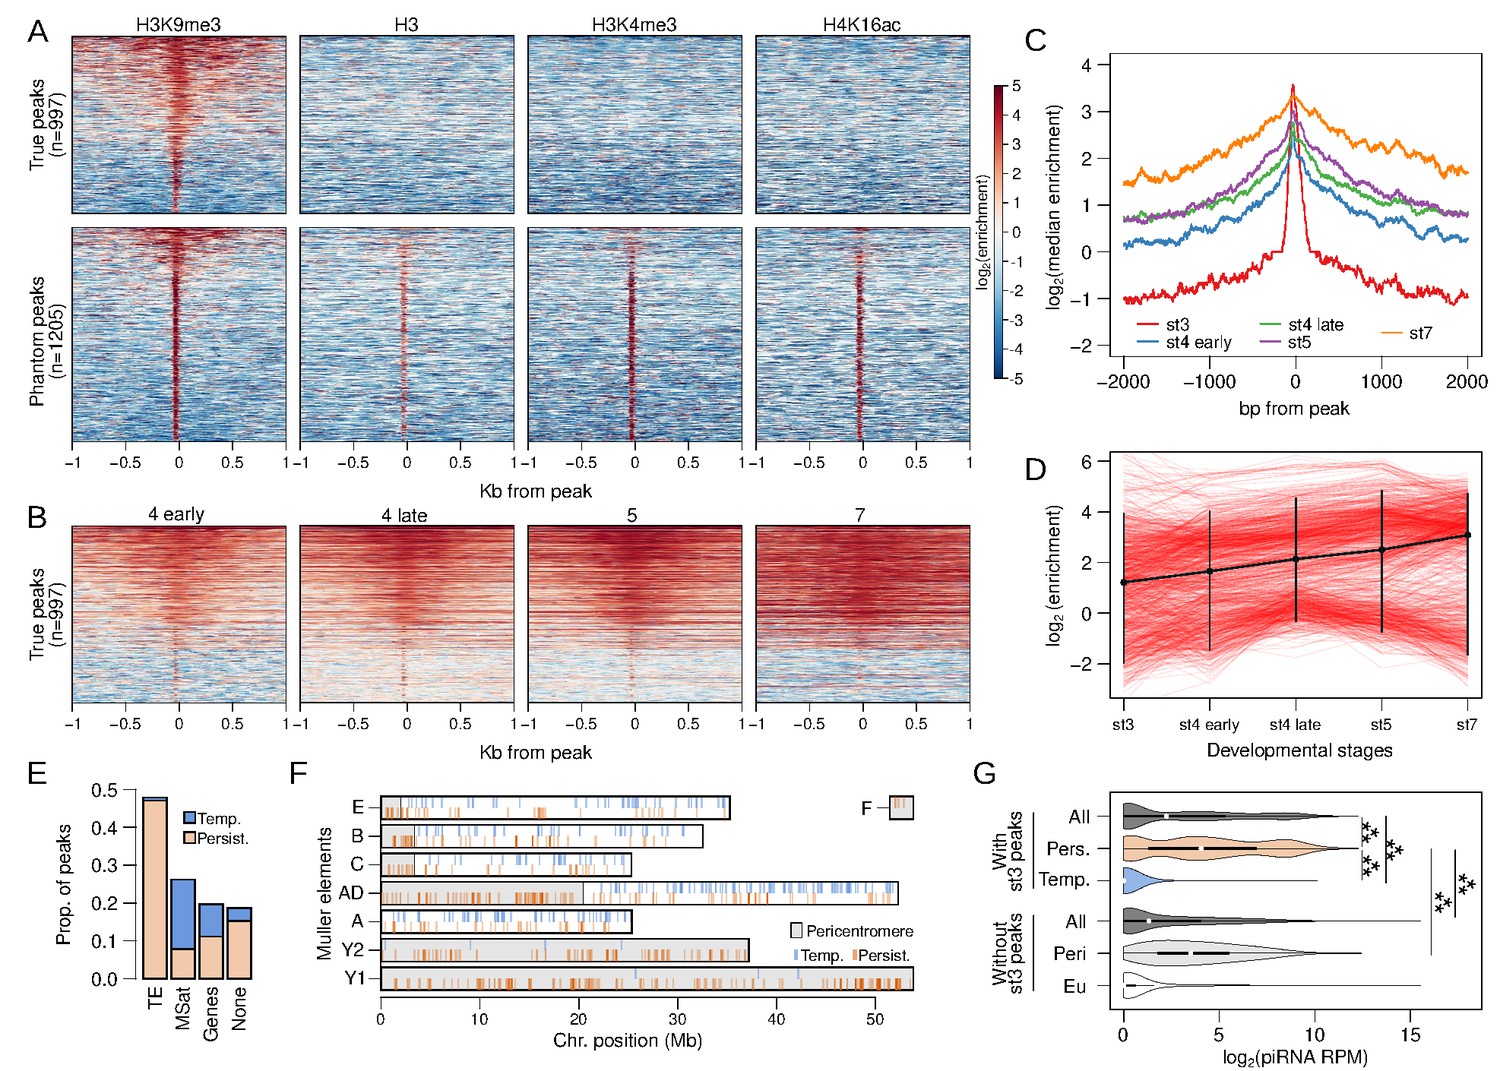
Stage 3 H3K9me3 peaks nucleate heterochromatin.
(A) Separation of genuine stage 3 peaks from non-specific (phantom) stage 3 peaks using ChIP-seq against alternative histone modifications. Heatmaps depict the extent of enrichment around stage 3 H3K9me3 peaks (±1 kb). Peaks are sorted by the average H3K9me3 enrichment around each peak; therefore, all the different ChIP-seq enrichment plots have the same ordering. Top panels are H3K9me3-specific peaks, while bottom panels are non-specific peaks. (B) H3K9me3 enrichment around stage 3 peaks across developmental stages; peaks are ordered as in (A) (top). (C) Median H3K9me3 enrichment across developmental stages around stage 3 peaks. (D) Developmental trajectory of each H3K9me3 peak (red lines). Enrichment of a peak is estimated as enrichment averaged across ±100 bp around each peak. The average across all peaks is in black with error bars representing 95% confidence intervals. (E) Distribution of stage 3 peaks across different annotation categories. (F) Placement of peaks across the genome; gray regions mark the pericentric and heterochromatic regions of the genome. Persistent and temporary peaks are plotted on the bottom and top halves of each chromosome arm, respectively. (G) Distribution of piRNA mapping in 5 kb genomic windows that overlap stage 3 peaks (top) and windows that do not overlap stage 3 peaks (bottom). The two sets of windows are further subdivided into those with persistent (Pers.) and temporary (Temp.) stage 3 peaks and those in (Peri) and outside (Eu) the pericentromeric regions, respectively. ***p<2.2e-16 Wilcoxon rank sum test.
Figure 3—figure supplement 1
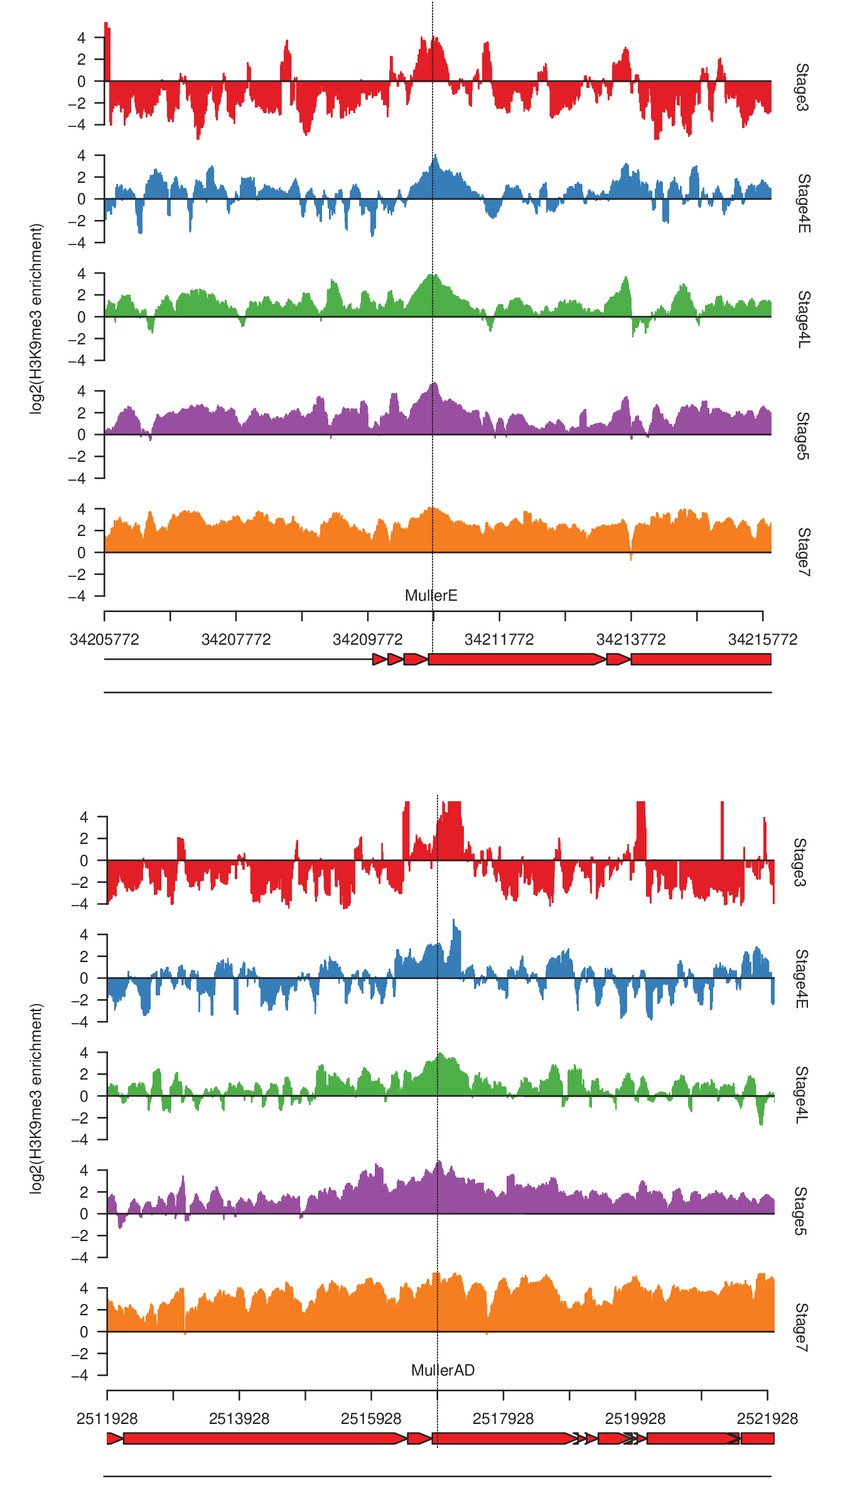
Examples of stage 3 peaks.
Tracks are centered around the peaks (dotted vertical line). The bottom two tracks are repeat annotations (red, top) and gene annotations (blue, bottom).
Figure 3—figure supplement 2
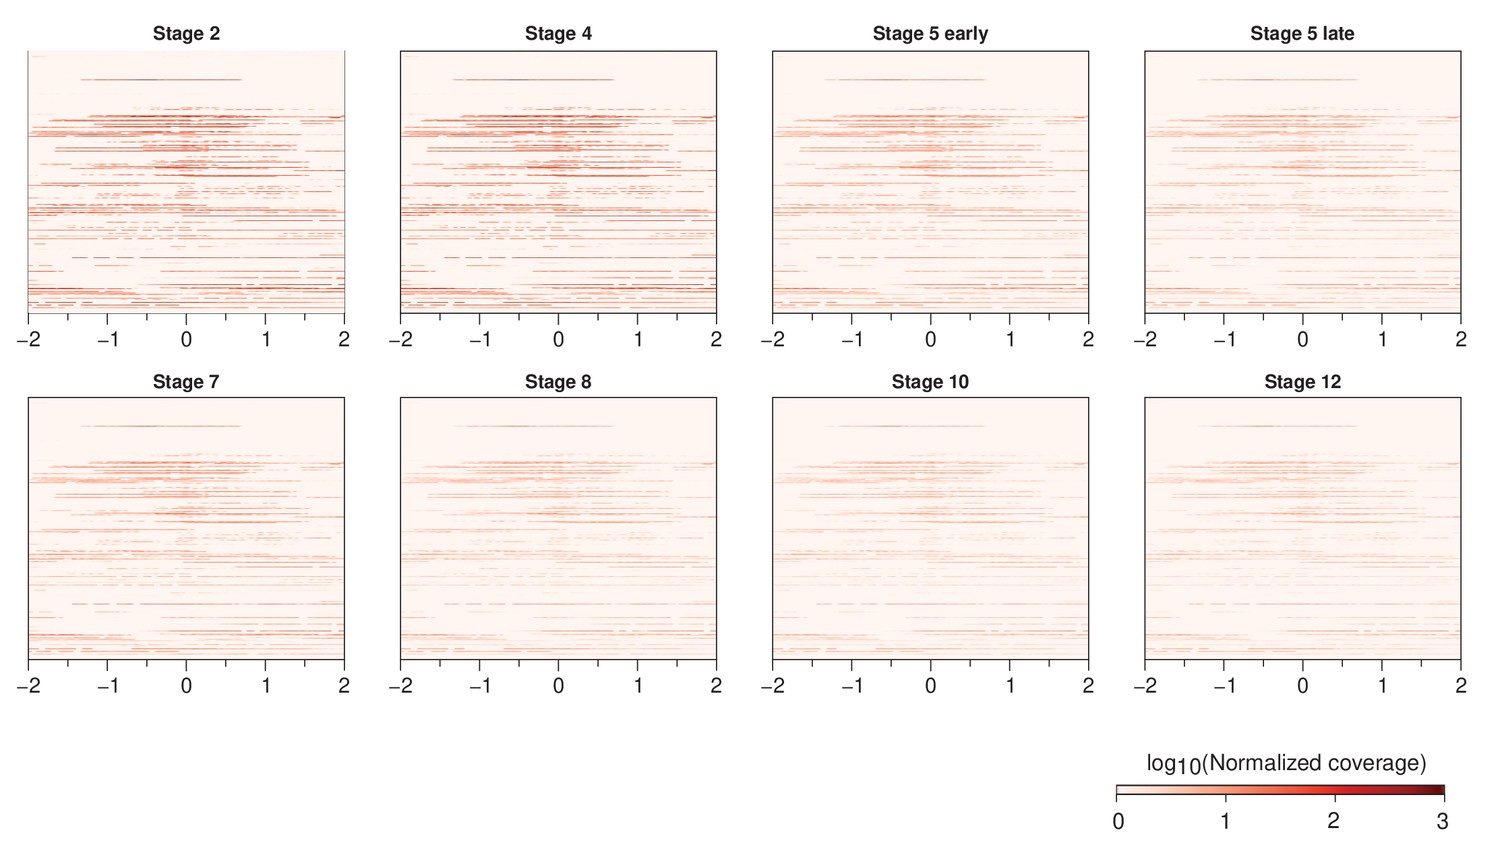
RNA-seq reads from developmentally staged male embryos around stage 3 peaks.
Peaks are ordered as in Figure 3A.
Figure 3—figure supplement 3
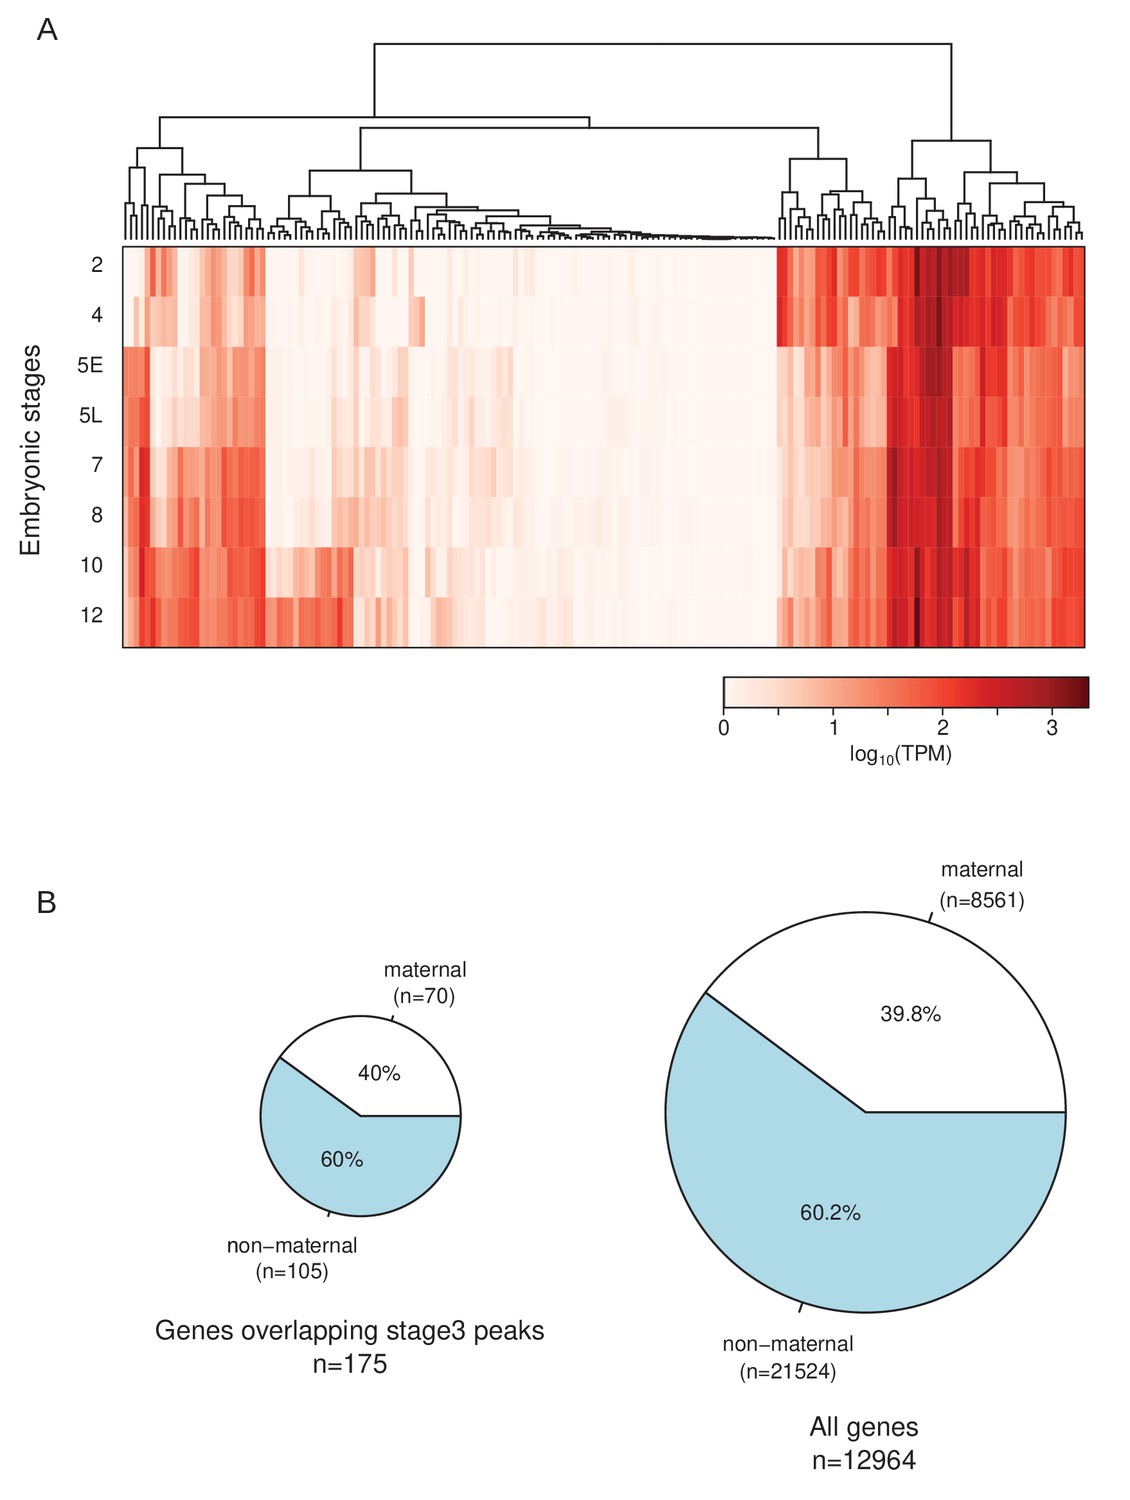
Transcript abundance of genes with stage 3 peaks.
(A) Transcript abundance of genes (n = 175) overlapping stage 3 peaks. (B) Proportion of the genes with maternally deposited transcripts (>5 TPM at stage 2 embryos) for genes overlapping stage 3 peaks (left) and all genes (right).
Figure 3—figure supplement 4

piRNA mapping around stage 3 peaks.
(A) Peak-centered heatmap of maternally deposited embryonic piRNA mapping ±10 and 2 kb around stage 3 peaks. Peaks are sorted as in Figure 3A.
Figure 4 with 4 supplements
Rapid nucleation in early stage 4.
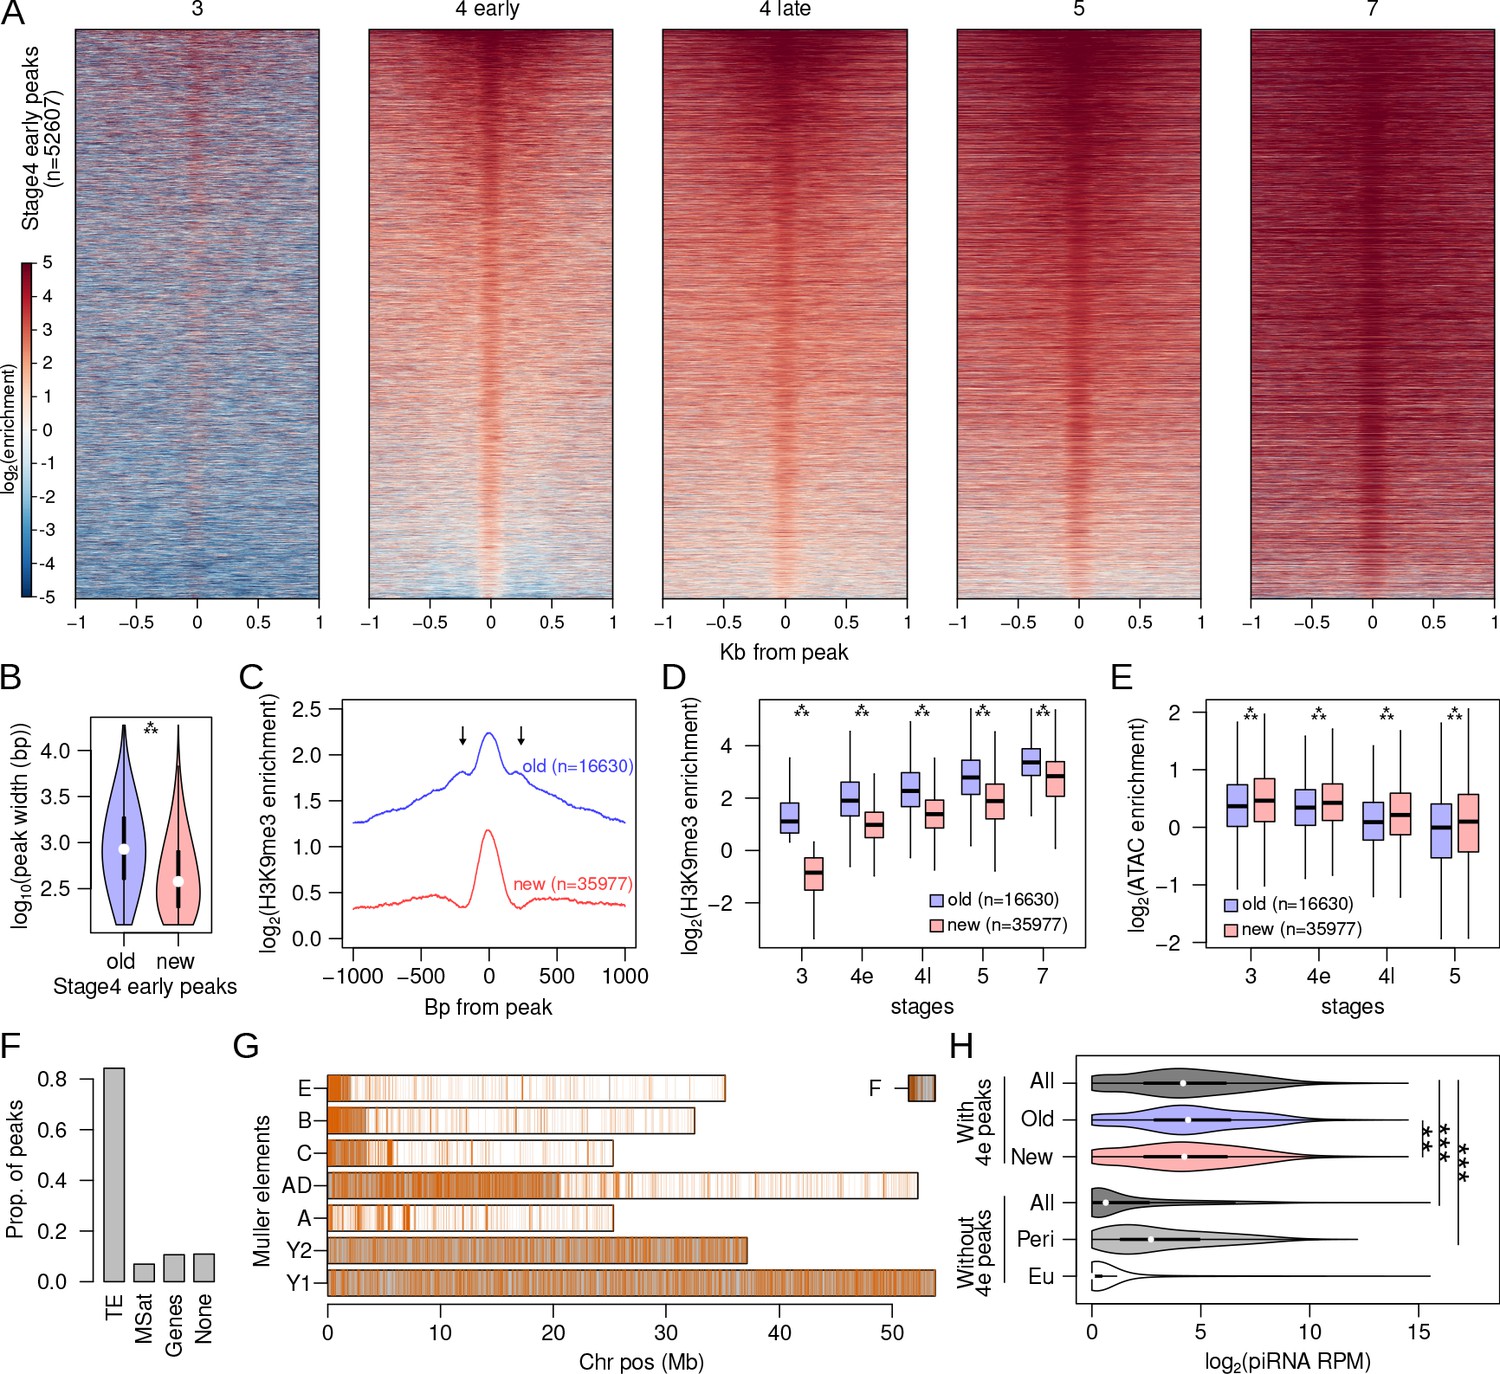
(A) H3K9me3 enrichment around (±1 kb) early stage 4 peaks across development. Peaks are sorted by mean enrichment at early stage 4. (B) Peak widths of early stage 4 peaks that show enrichment in stage 3 (old) and peaks that show no enrichment in stage 3 (new); ***p<2.2e-16 (Wilcoxon rank sum test). (C) Median H3K9me3 enrichment around old and new early stage 4 peaks. Arrows mark secondary peaks around the old peaks. (D) H3K9me3 enrichment of old and new early stage 4 peaks across development; ***=p < 2.2e-16 (Wilcoxon rank sum test). (E) Accessibility as measured by ATAC-seq enrichment in old and new peaks; **p<2.2e-16 (Wilcoxon rank sum test). (F) Distribution of new early stage 4 peaks across different annotation categories. (G) Genome-wide distribution of new early stage 4 peaks; gray regions mark the pericentric and heterochromatic regions of the genome. (H) Distribution of piRNA mapping in 5 kb genomic windows that overlap (top) and do not overlap (bottom) early stage 4 peaks. The windows are further subdivided into containing old or new peaks and being located in (Peri) and outside (Eu) the pericentromeric regions, respectively. **p<0.0001, ***p<2.2e-16 Wilcoxon rank sum test.
Figure 4—figure supplement 1
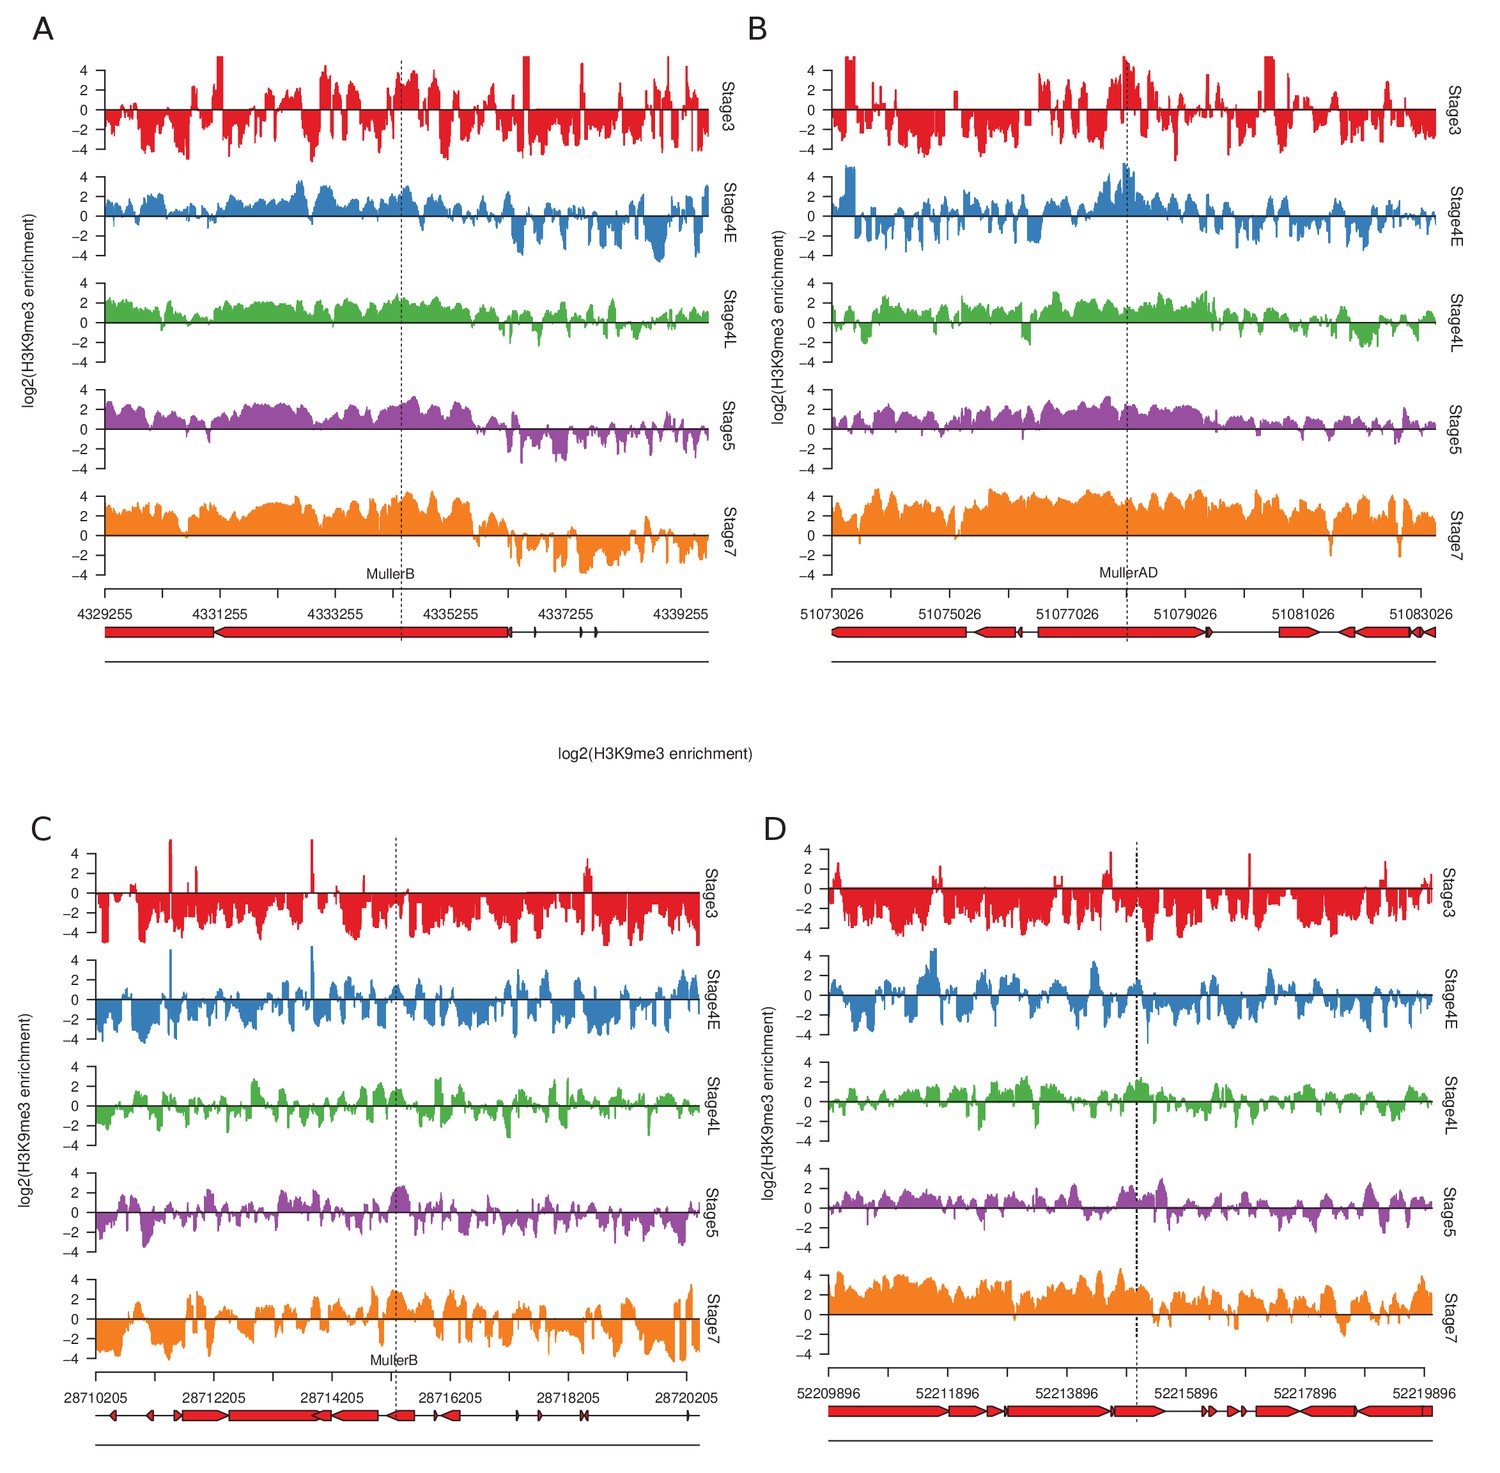
Examples of stage 4 early old (A, B) and new (C, D) peaks.
Tracks are centered around the peaks (vertical dotted line). The bottom two tracks are the repeat annotations.
Figure 4—figure supplement 2
H3K9me3 enrichment at early stage 4 old and new peaks across development.
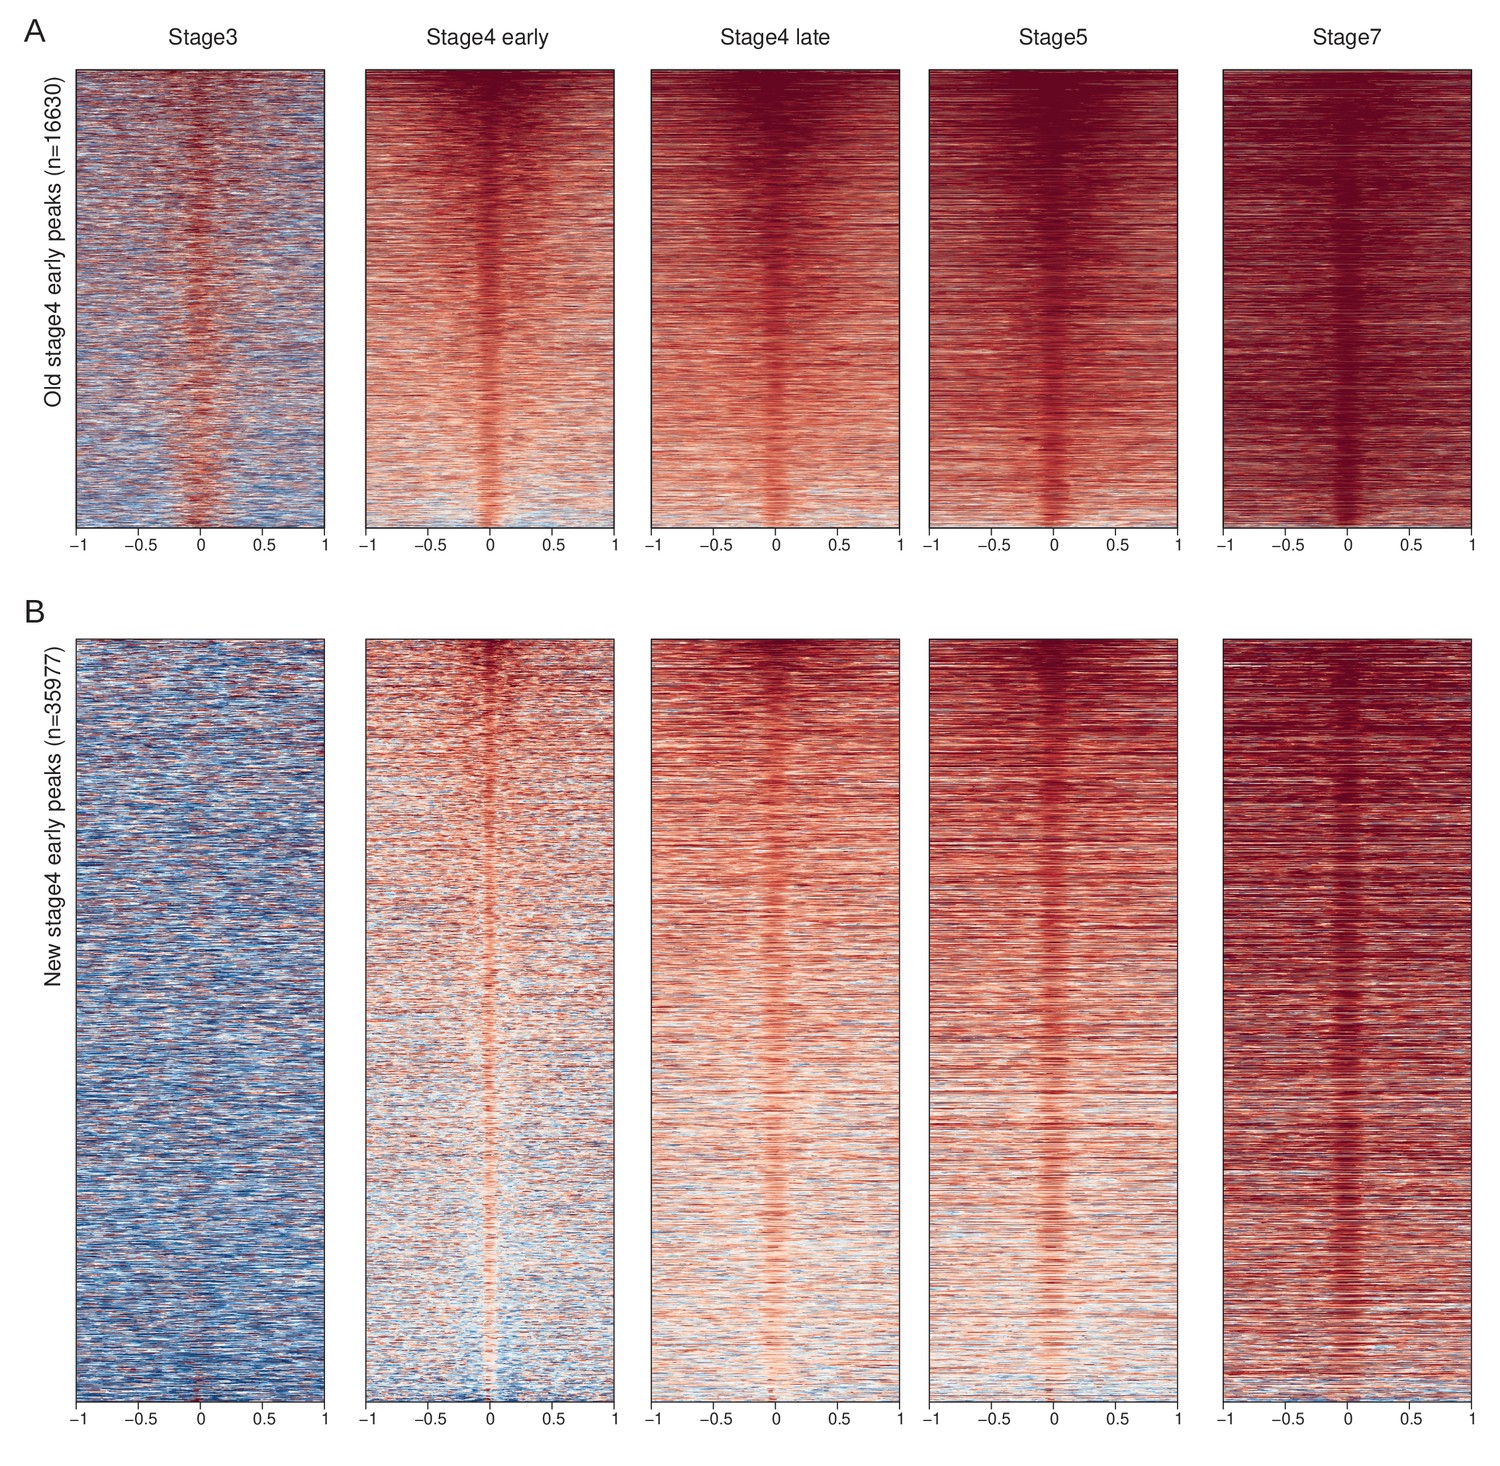
Early stage 4 H3K9me3 peaks are divided into old (A) and new (B) peaks, based on whether the region was already enriched or depleted at stage 3, respectively. Peak-centered enrichment heat maps are plotted for the two sets of peaks across developmental stages.
Figure 4—figure supplement 3
RNA-seq reads from developmentally staged male embryos around stage 4 new peaks.
Figure 4—figure supplement 4
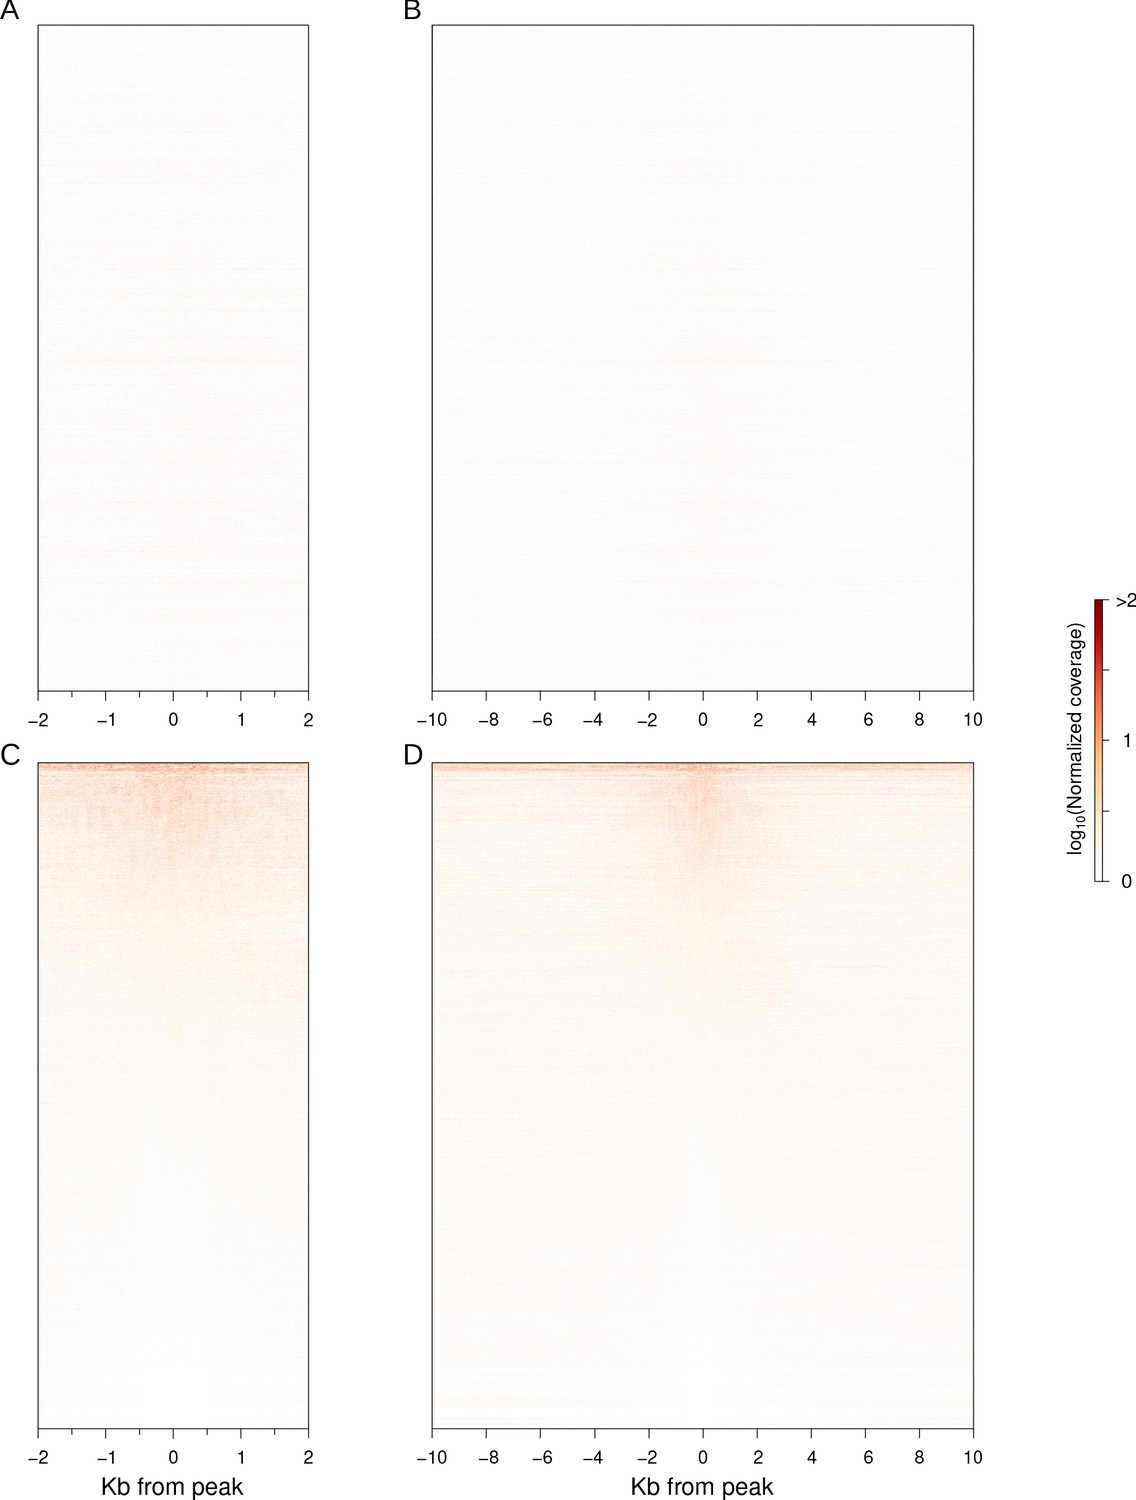
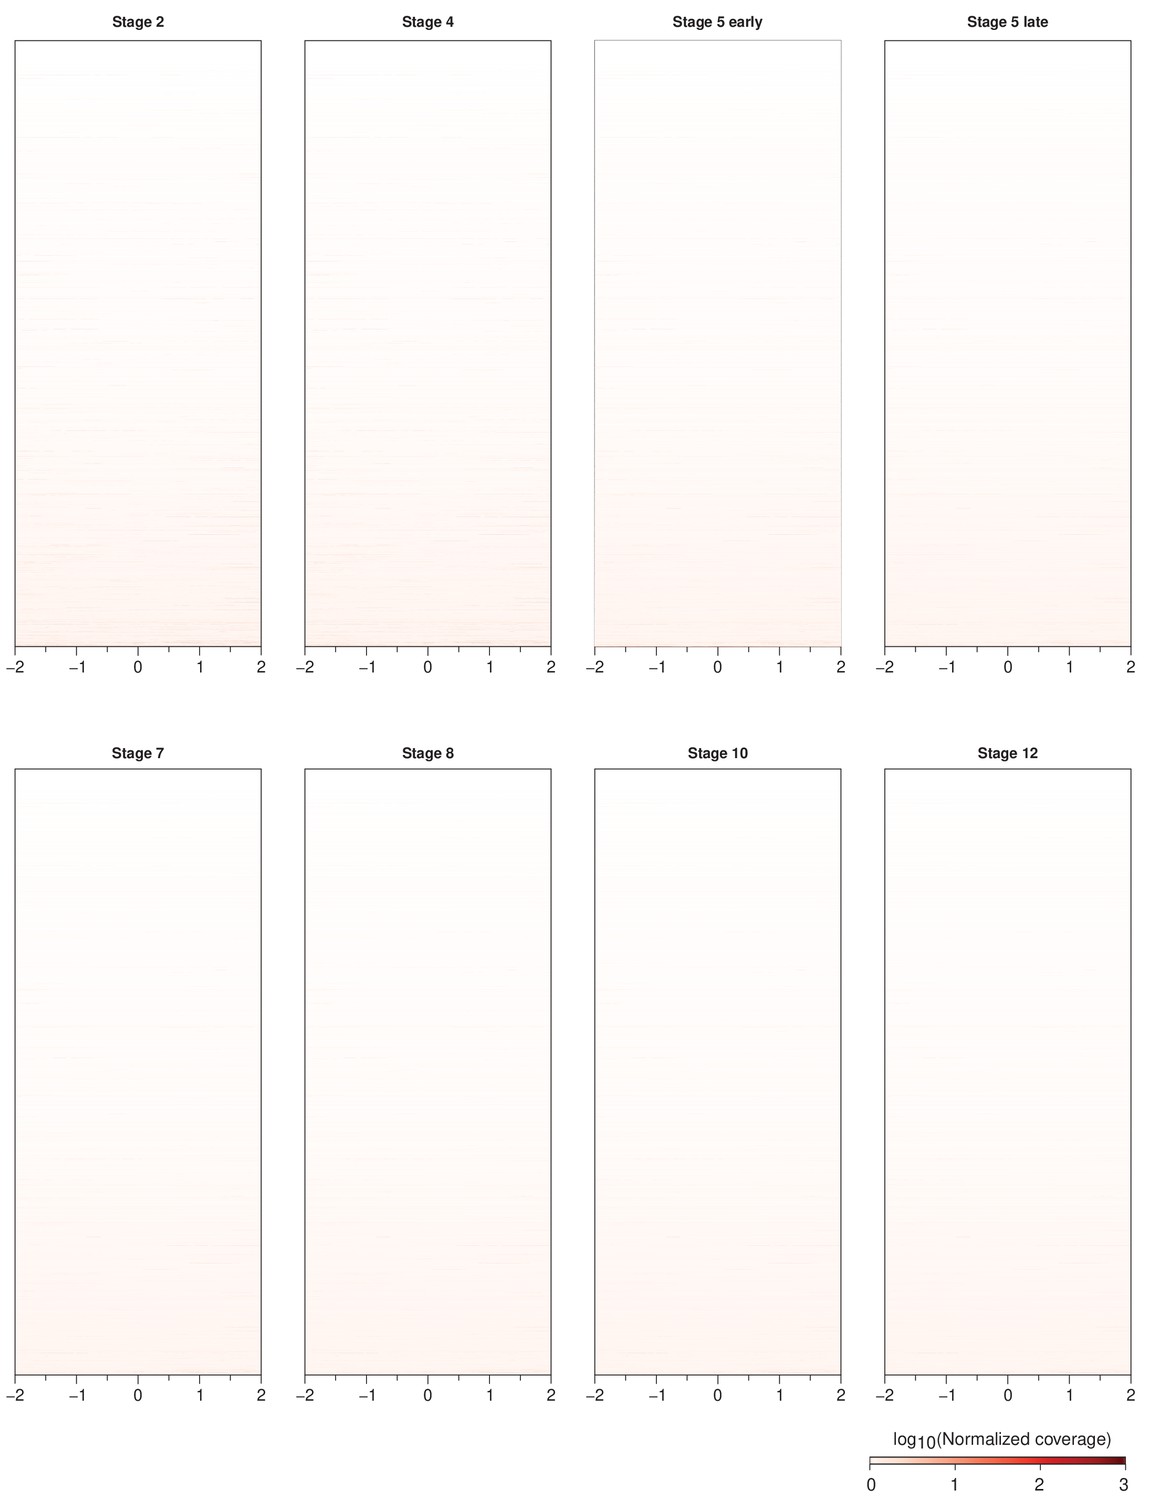
piRNA mapping around early stage 4 peaks.
(A) Peak-centered heatmap of maternally deposited piRNA mapping ±2 kb around stage4 early peaks. Peaks are ordered as in Figure 4A. (B) Same as (A) but ±10 kb around peaks. (C) Same as (A), but peaks are sorted by average piRNA abundance around peaks instead. (D) Same as (C) but ±10 kb around peaks.
Figure 5 with 2 supplements
Narrow nucleation followed by wide establishment of heterochromatin at TEs.
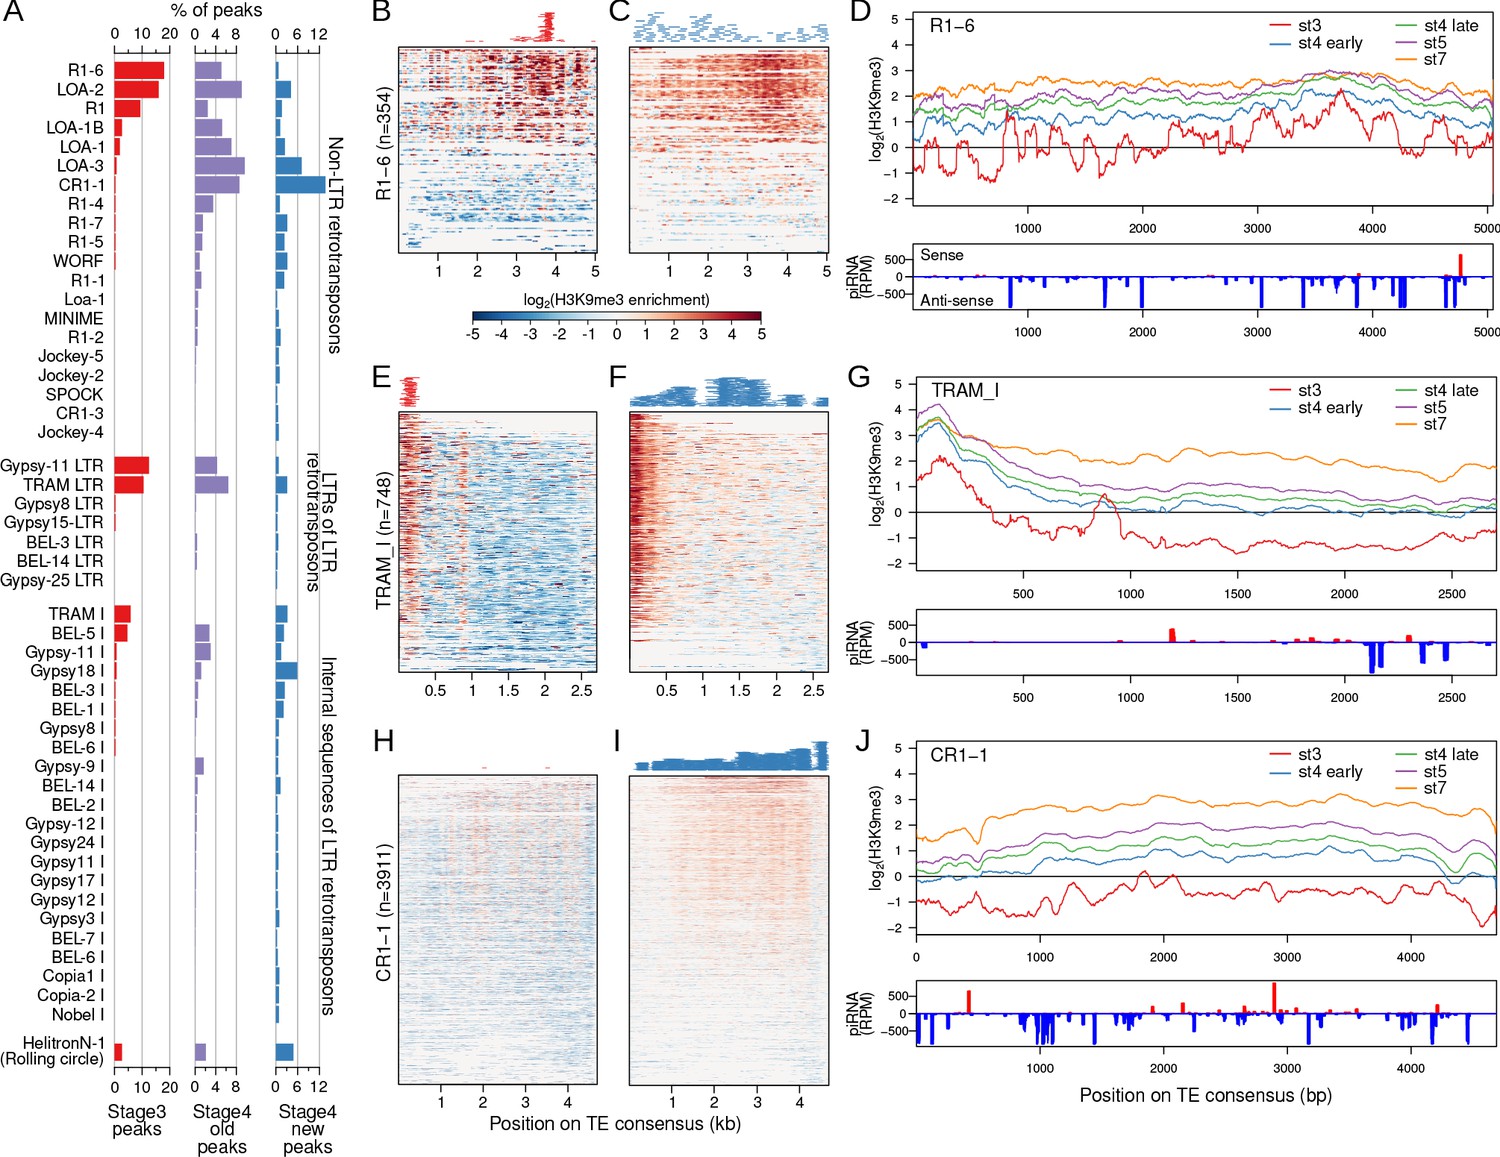
(A) TEs with annotated insertions overlapping stage 3, stage 4 old peaks, and stage 4 new peaks are listed; barplots depict the proportion of peaks overlapping with each TE. (B) H3K9me3 enrichment at stage 3 at all annotated TE insertions of the TE R1 variant (R1-6). Full length and fragmented annotated insertions are lined up with respect to their positions on the consensus TE sequences. Insertions are sorted by average enrichment. Positions of the called peaks are plotted above the heatmap. (C) Same as (B), but for stage 4 enrichment and new peaks. (D) Top. Mean enrichment of all insertions for the TE across development. Bottom. Sense and anti-sense piRNA mapping across the TE. (E–G) and (H–J), same as (B, C) but for the TEs TRAM and CR1-1, respectively. For more examples of enrichment over TEs, see Figure 5—figure supplements 1 and 2.
Figure 5—figure supplement 1
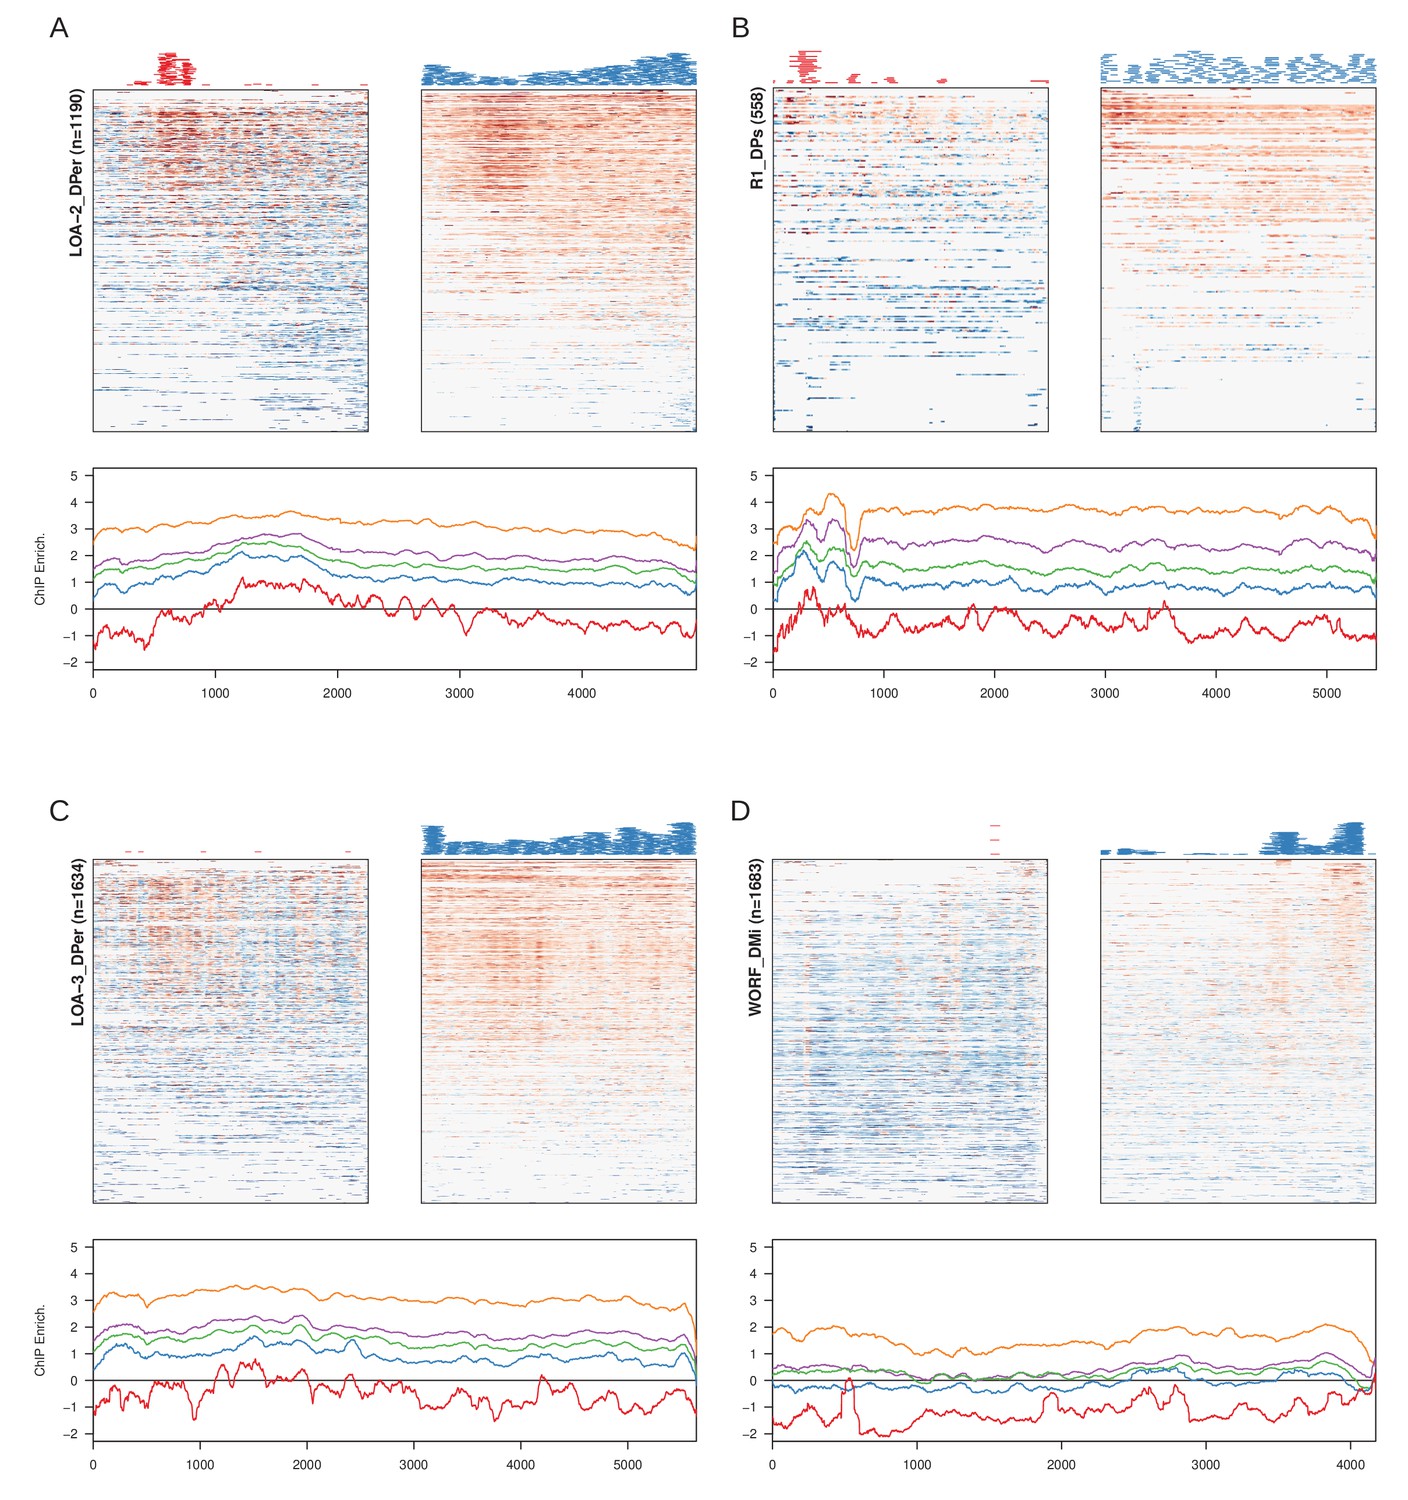
Examples of non-LTR TE families with abundant nucleation at stage 3 (A, B) and/or stage 4 (C, D).
For each, the heatmaps are enrichment profile across insertions at stage 3 (left) and stage 4 early (right) with the positions of peaks plotted above. On the bottom is the enrichment across developmental stages averaged across the insertions.
Figure 5—figure supplement 2

Examples of LTR retrotransposons with abundant nucleation in either the LTR sequence or the internal sequence.
For each, the heatmaps are enrichment profile across insertions at stage 3 (top left panel) and stage 4 early (top right panel) with the positions of identified peaks plotted above. On the bottom is the enrichment across developmental stages averaged across the insertions. (A) For Gypsy11, nucleation pattern is similar to TRAM in both the LTR (left) and internal sequences (right). However, the promoter adjacent nucleation in the internal sequence primarily occurs in early stage 4. (B) For BEL-5 element, only the internal sequence is identified in the repeat library. It shows similar 5' nucleation as TRAM.
Figure 6 with 1 supplement
Association between early H3K9me3 nucleation at TEs, maternal piRNA production, and expression.
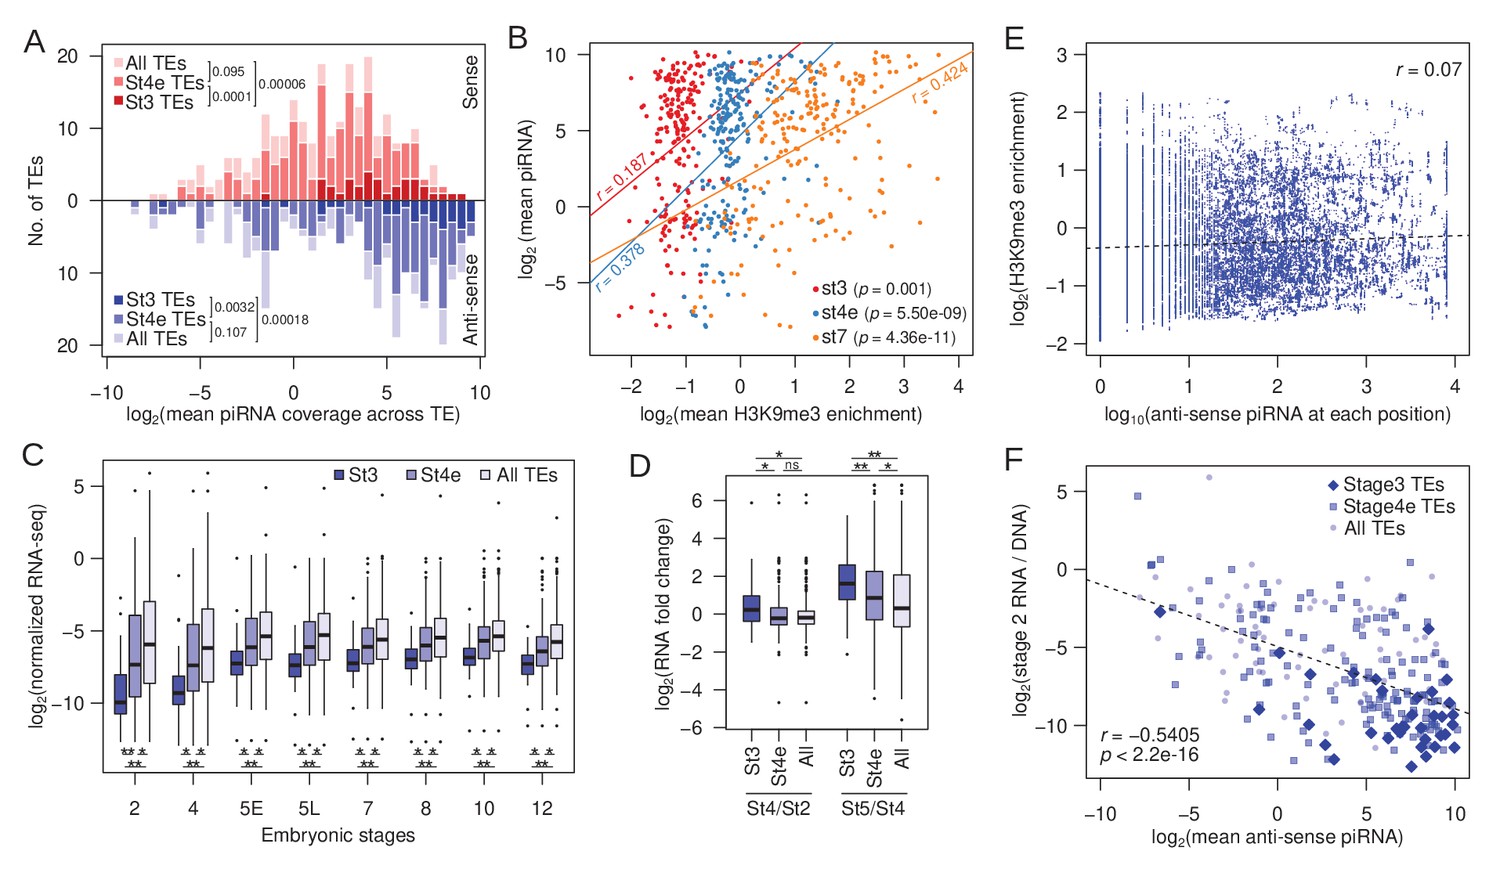
(A) Distribution of TEs by their average maternally deposited sense (top, red) and anti-sense (bottom, blue) piRNA coverage. TEs with stage 3 peaks (stage 3 TEs), early stage 4 peaks (stage 4e TEs), and all TEs are in decreasing color intensity. p-values of pairwise comparisons determined by Wilcoxon’s rank sum test are marked beside the legends. (B) Correlation between average H3K9me3 enrichment across a TE at different developmental stages and average piRNA abundance. Pearson’s correlation coefficients (r) are labeled beside the regression lines. (C) Average expression of TEs with stage 3 peaks, early stage 4 peaks, and all TEs across embryonic development. Pairwise significance is determined by Wilcoxon’s rank sum rest: *p value<0.05 and **p value<0.001 after multiple-testing correction with false discovery rate. (D) Zygotic expression of different TE classes is approximated by the fold difference between early embryonic stages. Pairwise significance determined as in (C). (E) For each position of stage 3 nucleating TEs, the H3K9me3 enrichment is plotted against the number of piRNA reads mapped. Linear regression is plotted in dotted line and Pearson's correlation coefficient (r) is labeled. (F) Negative correlation between maternally deposited anti-sense piRNA and expression of all TEs (light blue dots), stage 3 TEs (dark blue diamonds), and early stage 4 TEs (blue boxes). Expression of TEs is scaled by copy number by dividing the RNA-seq read counts with DNA-seq read counts. Dotted line demarcates the linear regression and r represents the Pearsons’ correlation coefficient.
Figure 6—figure supplement 1
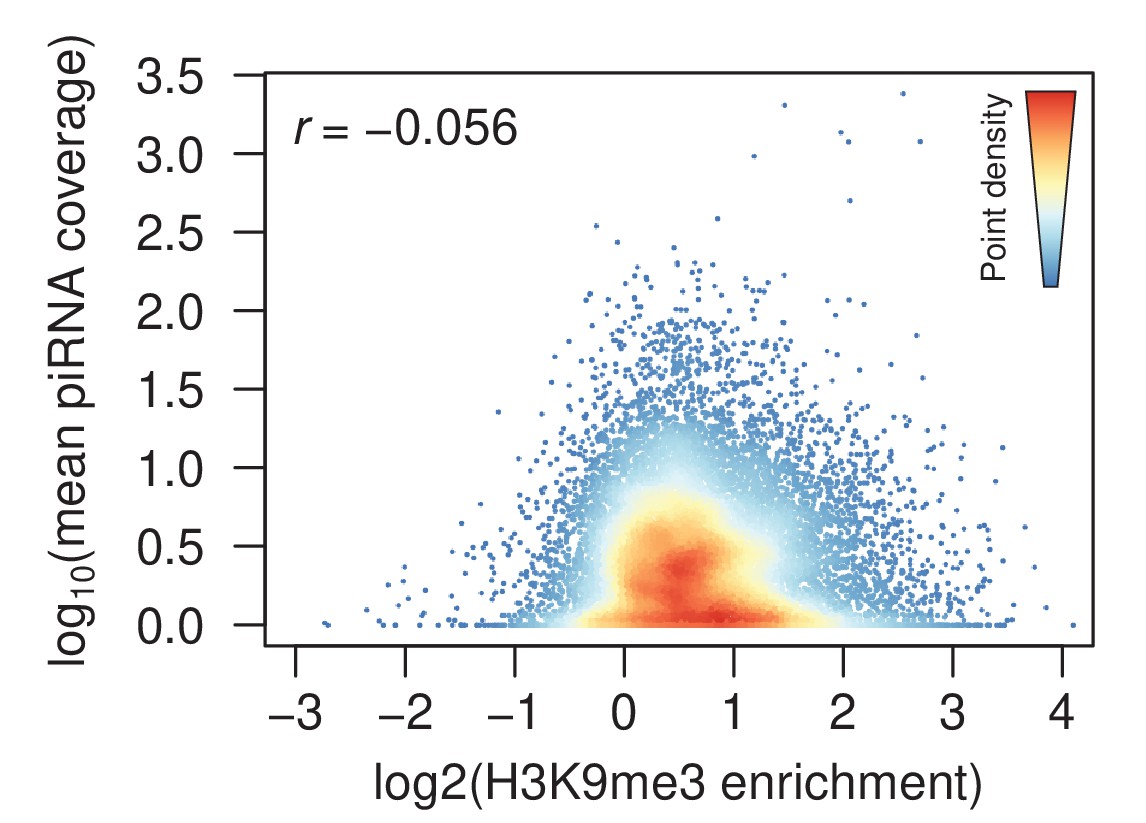
Density scatter plot of the correlation between H3K9me3 enrichment of new stage 4 peaks against maternally deposited piRNA coverage.
Each point is the enrichment and piRNA coverage 250 bp around a stage 4 early peak. The warmer color denotes higher density of points. H3K9me3 enrichment and piRNA around stage 4 peaks are uncorrelated (r = Pearson’s correlation coefficient).
Figure 7 with 2 supplements
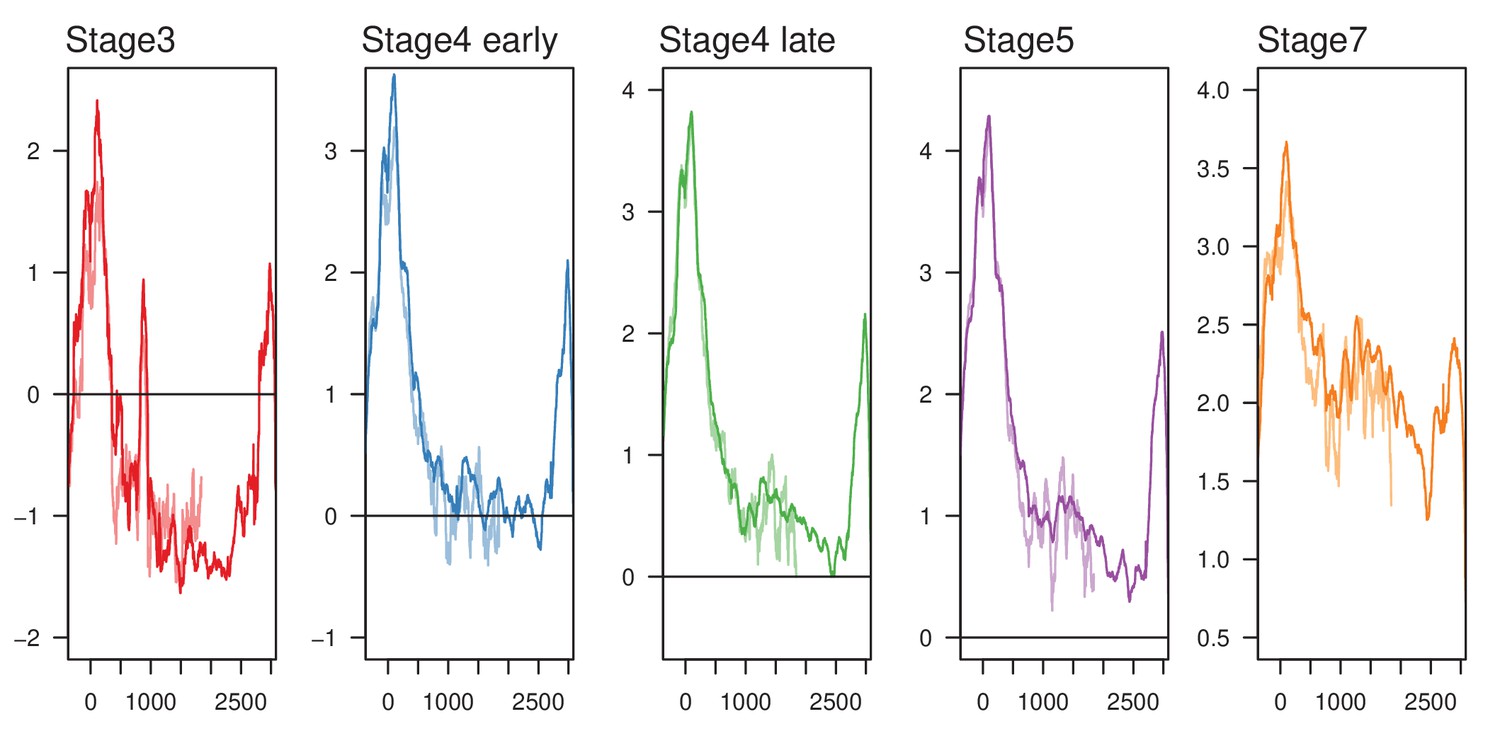
Loss of 5’ LTR and nucleation sites reduce H3K9me3 enrichment at TRAM insertions.
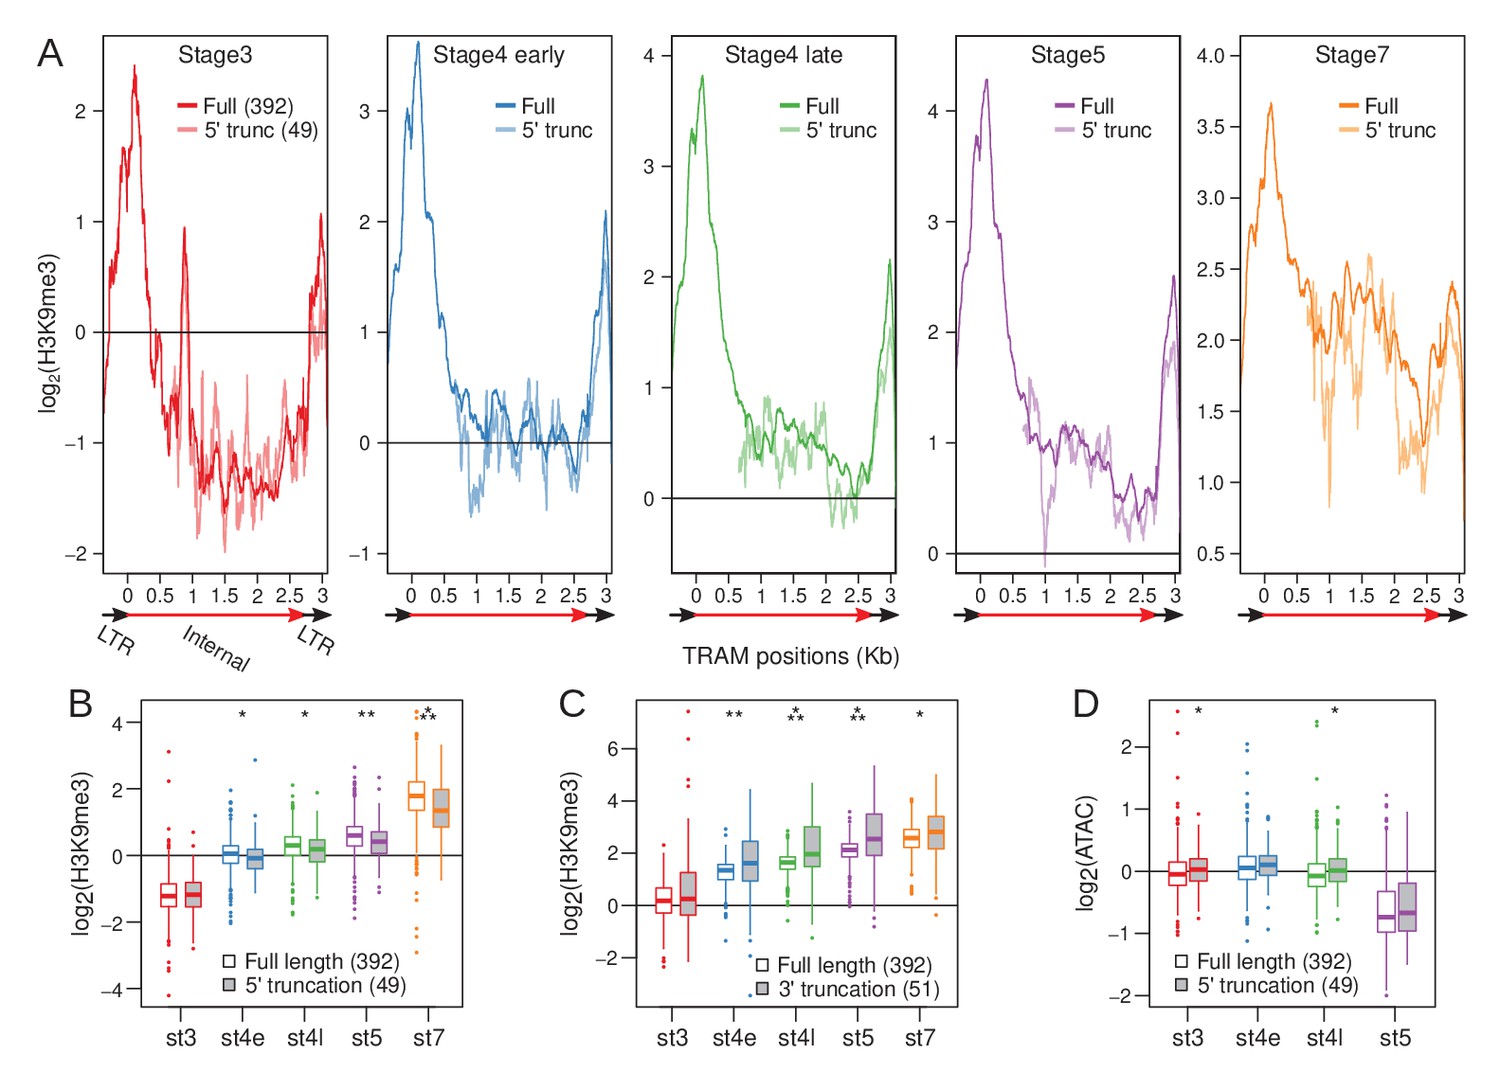
(A) H3K9me3 enrichment averaged across full-length TRAM insertions (sold lines) and 5’ truncated TRAM insertions lacking the 5’ nucleation sites (dotted lines) across developmental stages. Structure of TRAM is labeled below the plots (also see Figure 7—figure supplement 1). Note that the Y-axes change across the plots. (B) Distribution of average H3K9me3 enrichment for full length (boxes with white fill) and 5’ truncated (boxes with gray fill) insertions across development. For each insertion, enrichment is averaged across the last 1 kb of the internal sequence (3’ LTR is excluded). Boxplots depict the distribution of H3K9me3 enrichment across insertions. (C) Same as (B), but averaged across the first 1 kb of the internal sequence of full length and 3’ truncated insertions (5’ LTR is excluded). (D) Same as (B), but with ATAC enrichment instead of H3K9me3 enrichment. *p<0.05, **p<0.005, ***p<0.00005, Wilcoxon’s rank sum test.
Figure 7—figure supplement 1
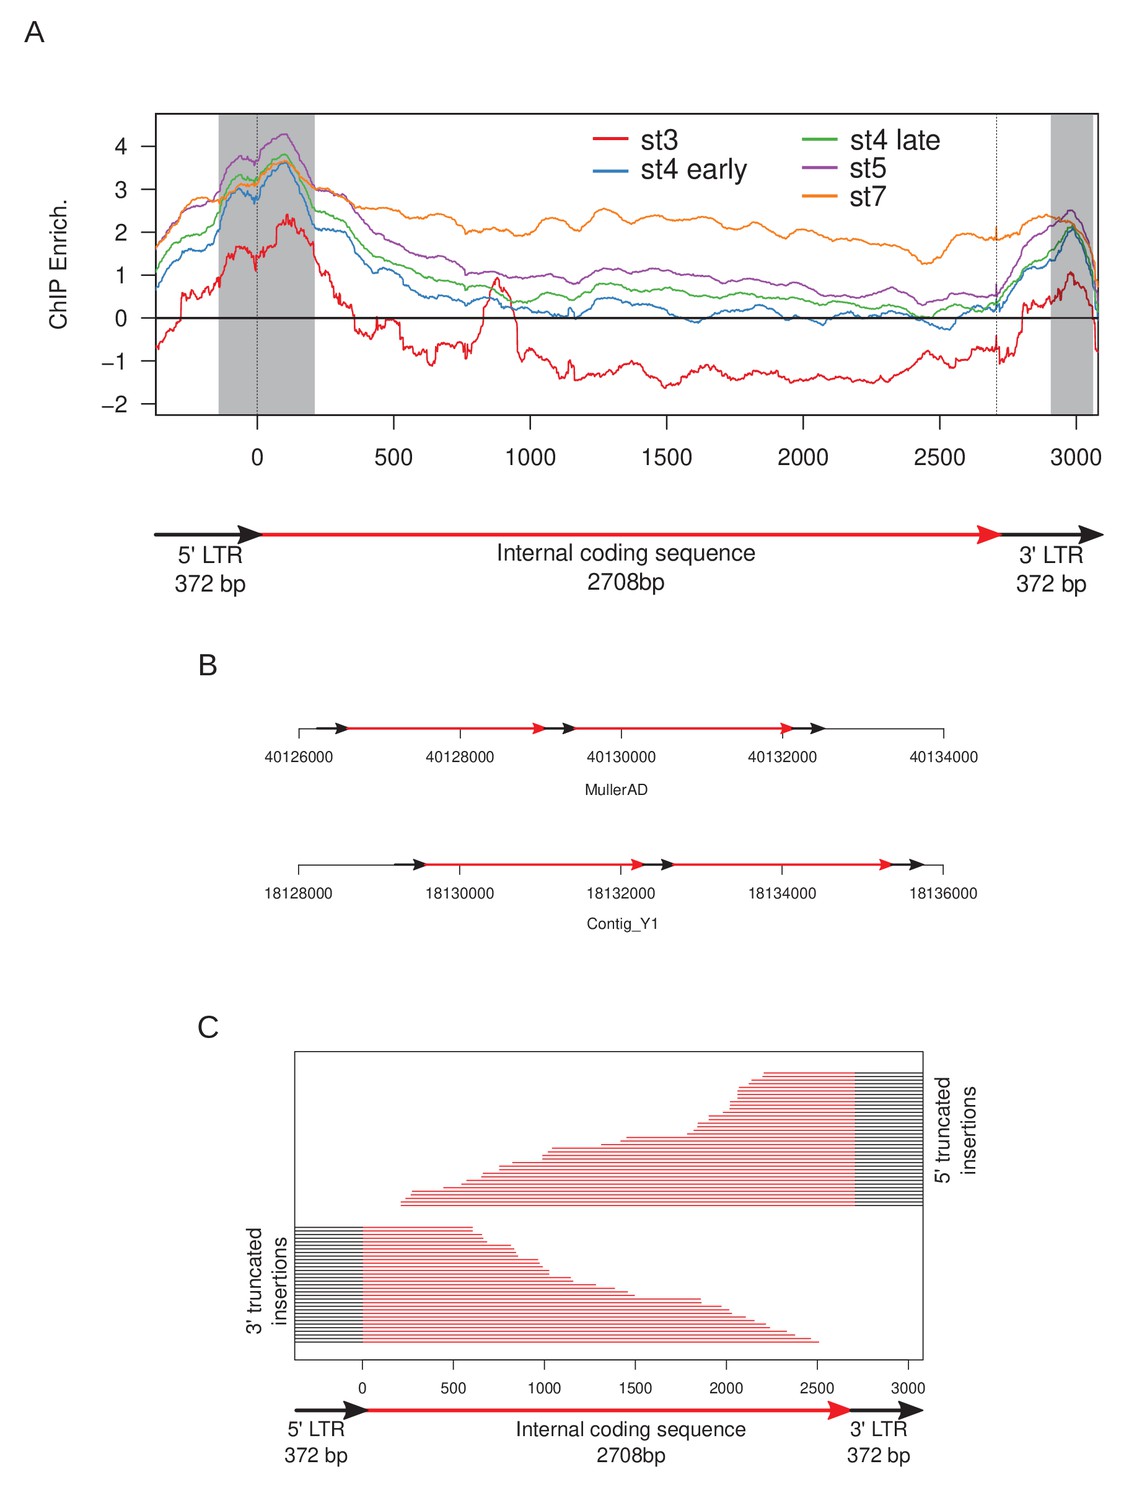
Structure and heterochromatin enrichment at TRAM.
(A) Structure and enrichment of the full length retrotransposon TRAM. The start of the coding sequence is centered at 0. Positions of stage 3 peaks on TRAM elements are highlighted by gray boxes. (B) Examples of head-to-tail tandems of TRAM insertions in the D. miranda genome. (C) Length and structures of 3' and 5' truncated insertions used for Figure 7.
Figure 7—figure supplement 2
H3K9me3 enrichment in 3' TRAM truncations.
Full length elements and truncated elements are in dark and light colors, respectively.
Figure 8

Genomic abundance of early nucleating TEs.
(A) Comparisons between copy number abundance of stage 3 nucleating, early stage 4 nucleating, and all TEs in males and females. (B) Same as (A), but with number of insertions on the neo-Y. Pairwise significance is represented by letters where -upper-case letters denote p-value<0.001 (Wilcoxon rank sum test); A = stage 3 TEs vs. early stage 4 TEs, B = early stage 4 TEs vs. all TEs, and C = stage 3 TEs vs. all TEs.
Additional files
-
Supplementary file 1
ChIP-seq sample information and mapping statistics.
- https://cdn.elifesciences.org/articles/55612/elife-55612-supp1-v2.xlsx
-
Supplementary file 2
Embryonic RNA-seq sample information and mapping statistics.
- https://cdn.elifesciences.org/articles/55612/elife-55612-supp2-v2.xlsx
-
Supplementary file 3
piRNA sequencing mapping statistics.
- https://cdn.elifesciences.org/articles/55612/elife-55612-supp3-v2.xlsx
-
Supplementary file 4
ATAC-seq sample information and mapping statistics.
- https://cdn.elifesciences.org/articles/55612/elife-55612-supp4-v2.xlsx
-
Transparent reporting form
- https://cdn.elifesciences.org/articles/55612/elife-55612-transrepform-v2.docx
Download links
A two-part list of links to download the article, or parts of the article, in various formats.
Downloads (link to download the article as PDF)
Open citations (links to open the citations from this article in various online reference manager services)
Cite this article (links to download the citations from this article in formats compatible with various reference manager tools)
Establishment of H3K9me3-dependent heterochromatin during embryogenesis in Drosophila miranda
eLife 10:e55612.
https://doi.org/10.7554/eLife.55612


