Establishment of H3K9me3-dependent heterochromatin during embryogenesis in Drosophila miranda
Abstract
Heterochromatin is a key architectural feature of eukaryotic genomes crucial for silencing of repetitive elements. During Drosophila embryonic cellularization, heterochromatin rapidly appears over repetitive sequences, but the molecular details of how heterochromatin is established are poorly understood. Here, we map the genome-wide distribution of H3K9me3-dependent heterochromatin in individual embryos of Drosophila miranda at precisely staged developmental time points. We find that canonical H3K9me3 enrichment is established prior to cellularization and matures into stable and broad heterochromatin domains through development. Intriguingly, initial nucleation sites of H3K9me3 enrichment appear as early as embryonic stage 3 over transposable elements (TEs) and progressively broaden, consistent with spreading to neighboring nucleosomes. The earliest nucleation sites are limited to specific regions of a small number of recently active retrotransposon families and often appear over promoter and 5’ regions of LTR retrotransposons, while late nucleation sites develop broadly across the entirety of most TEs. Interestingly, early nucleating TEs are strongly associated with abundant maternal piRNAs and show early zygotic transcription. These results support a model of piRNA-associated co-transcriptional silencing while also suggesting additional mechanisms for site-restricted H3K9me3 nucleation at TEs in pre-cellular Drosophila embryos.
Introduction
The separation of eukaryotic genomes into transcriptionally active euchromatin and silenced heterochromatin is a fundamental aspect of eukaryotic genomes (Allshire and Madhani, 2018). Heterochromatin is the gene-poor, transposon-rich, late-replicating, and tightly packaged chromatin compartment that was first cytologically defined over 90 years ago (Heitz, 1928), in contrast to euchromatin, the gene-rich, lightly packed form of chromatin. These domains show characteristic distributions across eukaryotic genomes and are distinguished by unique sets of histone modifications (Peng and Karpen, 2008; Elgin and Reuter, 2013). Heterochromatin is found predominately at repetitive sequences, which mainly correspond to pericentromeres, the dot and the Y chromosome in flies, and is marked by tri-methylation of histone H3 lysine 9 (H3K9me3) (Elgin and Reuter, 2013).
Heterochromatin formation, and the boundary between heterochromatic and euchromatic domains is established during early development. In Drosophila melanogaster, constitutive heterochromatin is not observed cytologically in the initial zygote, but emerges during blastoderm formation (Vlassova et al., 1991; Lu et al., 1998) (developmental stage 4; see Figure 1A,B). Chromatin assembly during this period is prior to any widespread zygotic transcription and dependent on maternally loaded RNA and proteins (Elgin and Reuter, 2013). Analysis of an inducible reporter gene has found that silencing occurs at the onset of gastrulation (end of stage 6), about 1 hr after heterochromatin is visible cytologically (Lu et al., 1998). The extent of silencing increases as embryonic development progresses, and by stage 15 (dorsal closure, between 11.5 and 13 hr of development), silencing patterns reminiscent of those for third-instar larvae are established (Lu et al., 1998).

The repeat-rich genome of Drosophila miranda as a model to characterize heterochromatin establishment.
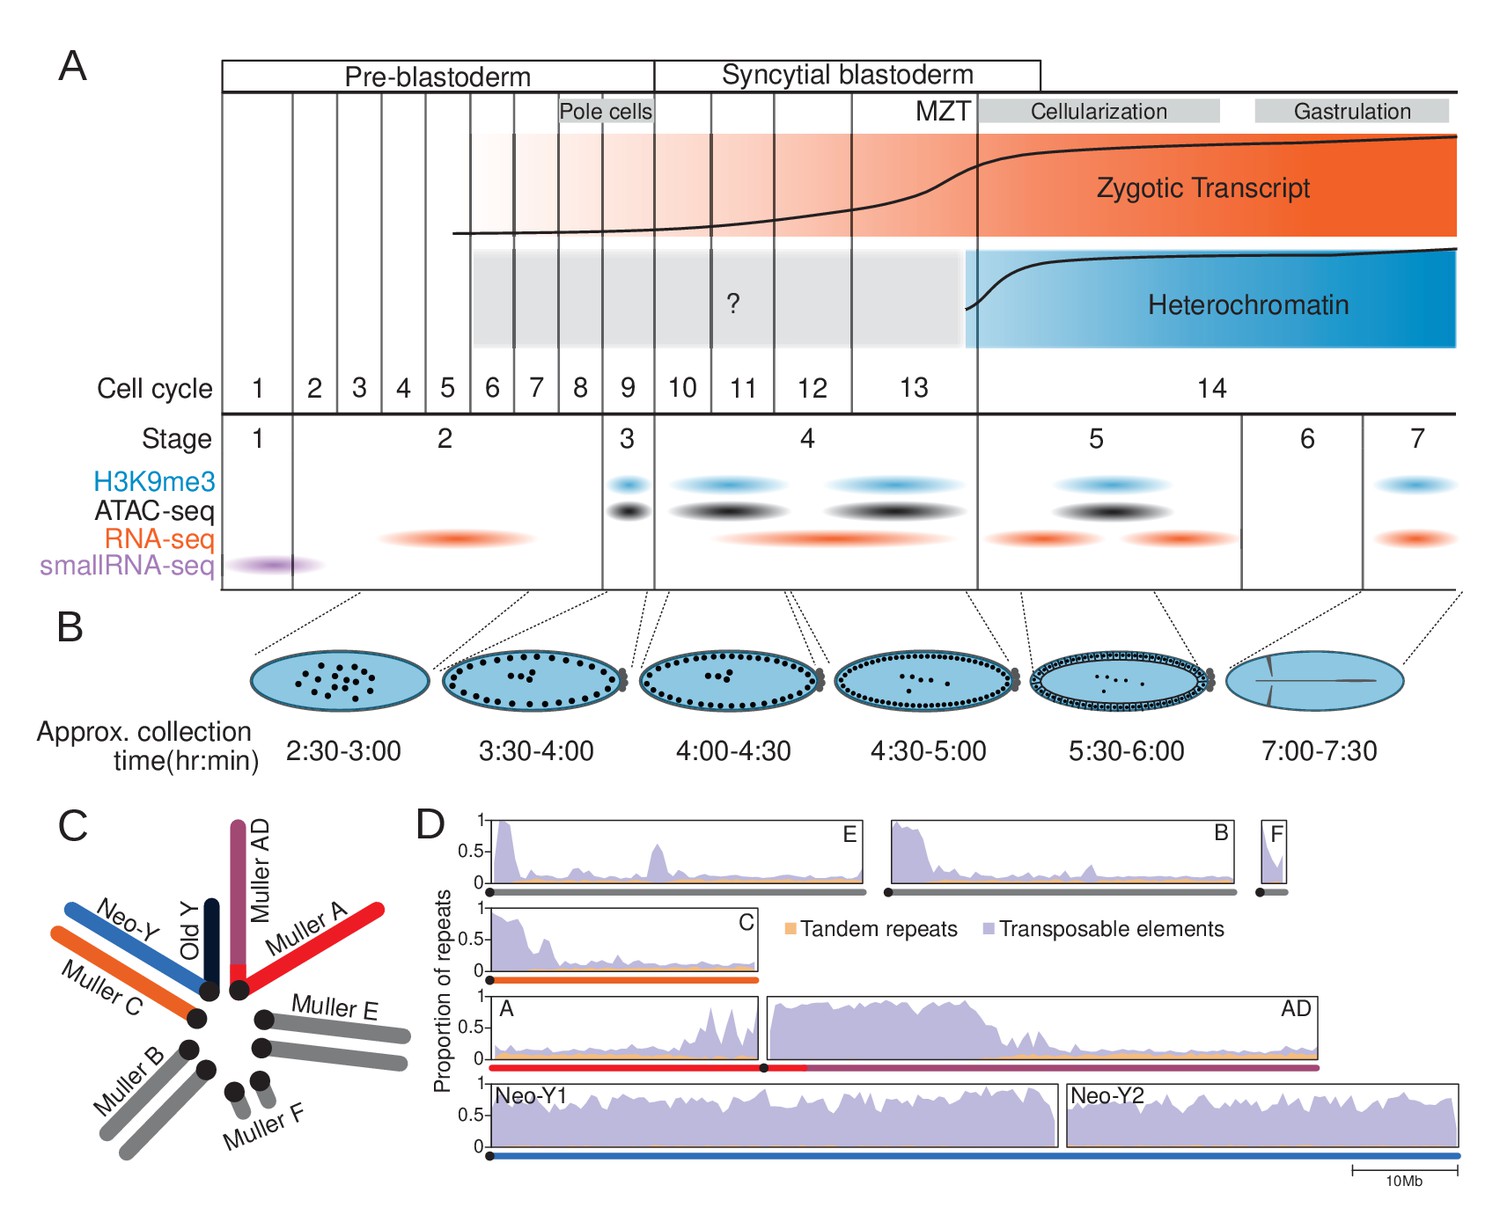
(A) Time course of embryonic development. Major landmarks including the maternal to zygotic transition (MZT) are labeled. The orange and blue track depicts the approximate amount of zygotic expression and heterochromatin, respectively, throughout development. The cell cycle numbers and their corresponding embryonic stages are labeled. (B) Cartoon diagram of the embryonic landmarks used for staging. The approximate time points of embryo collection are labeled under the embryo diagrams. (C) Karyotype of D. miranda male. Muller elements are labeled and the sex chromosomes are color-coded: neo-Y (blue), ancestral Y (dark navy), neo-X (orange), and X (red and purple). (D) Repeat content of the D. miranda genome assembly. The cumulative repeat content for each chromosome is depicted, with tandem repeats in orange and transposable elements in purple; unless otherwise stated, these repeat classes will be distinguished by these colors throughout the manuscript. Karyotypes are drawn below the graphs with the chromosomes color-coded as in (C).
The role of H3K9me3-associated heterochromatin in genome regulation and silencing of repetitive elements is well established. H3K9me3 is deposited by a conserved class of histone methyltransferases (Rea et al., 2000; Nakayama et al., 2001) and provides a high-affinity binding site for HP1 proteins (Bannister et al., 2001; Lachner et al., 2001). HP1 proteins can oligomerize, resulting in local chromatin compaction (Hiragami-Hamada et al., 2016), and help establish heterochromatin domains possibly via phase separation (Larson et al., 2017; Strom et al., 2017, but see Erdel et al., 2020). HP1 proteins can also recruit additional histone methyltransferases, thereby enabling spreading of heterochromatin (Canzio et al., 2013). Thus, H3K9me3 deposition is a crucial step in the formation of heterochromatin and the suppression of repetitive sequences, but the molecular mechanisms of H3K9me3 targeting and recruitment are not fully understood.
Several studies have suggested that small RNA-mediated silencing pathways can initiate the formation of heterochromatin (Holoch and Moazed, 2015; Allshire and Madhani, 2018). This was first identified in fission yeast, where mutations in components of the RNAi pathway showed disrupted heterochromatin silencing in centromeres (Volpe et al., 2002; Hall et al., 2002). Further studies revealed that siRNAs with sequence homology to repeats bind to their nascent transcripts to direct the recruitment of chromatin-associated silencing factors (Kato, 2005; Djupedal et al., 2005; Bühler et al., 2006). In flies and mammals, a different class of small RNAs, PIWI-associated small RNAs (piRNAs; 23-29nt in Drosophila), are involved in the silencing of transposable elements (TEs) (Brennecke et al., 2007; Aravin et al., 2007; Olovnikov et al., 2012; Czech et al., 2018; Ninova et al., 2019). piRNAs are derived from TE sequences and provide heritable libraries that target TE transcripts for degradation (Brennecke et al., 2007; Czech et al., 2018).
Independent of the post-transcriptional cleavage activity (Wang and Elgin, 2011; Darricarrère et al., 2013), the piRNA pathway is required for transcriptional silencing of TE insertions in the ovary. In flies, loss of PIWI causes the loss of H3K9me3-mediated heterochromatic repression (Klenov et al., 2011; Wang and Elgin, 2011; Sienski et al., 2012; Darricarrère et al., 2013; Klenov et al., 2014). Similar to yeast, piRNA-guided heterochromatin formation requires transcription of the target locus (co-transcriptional silencing); Piwi–piRNA complexes bind to complementary, nascent TE transcripts and induce heterochromatin formation by recruiting heterochromatin factors, including histone methyltransferases for H3K9me3 deposition (Sienski et al., 2012; Wang and Elgin, 2011; Le Thomas et al., 2013; Yu et al., 2015; Batki et al., 2019).
In the developing embryo, maternally deposited PIWI is similarly required for the formation of H3K9me3 at the maternal-zygotic transition during late blastoderm (Gu and Elgin, 2013). However, the process and precise mechanism of rapid heterochromatin establishment across a large fraction of the genome such as the pericentromere and the Y chromosome remains poorly understood. Early cytological studies showed that heterochromatin becomes visible during blastoderm (Vlassova et al., 1991; Lu et al., 1998). More recently, in vivo immunofluorescence staining on the developing Drosophila embryo has shown that heterochromatin appears as early as cell cycle 13 (late stage 4) and rapidly increases through blastulation (cell cycle 14, stage 5) and requires the histone methyltransferase SetDB1 (Yuan and O'Farrell, 2016; Seller et al., 2019). However, such imaging approaches lack resolution at genome-scale and are necessarily limited by the concentration and density of the targeted sequence and proteins. Emerging heterochromatin, therefore, may not yield strong enough signal for fluorescent detection. Hence, highly sensitive genome-wide analyses of H3K9me3-dependent heterochromatin dynamics in early embryos are needed.
Here, we investigate the establishment of heterochromatin during early embryogenesis in Drosophila miranda. While this species lacks the genetic tools available in D. melanogaster, several features make D. miranda ideal for studying repetitive sequences and heterochromatin on a genome scale. D. miranda has a large repeat-rich neo-Y chromosome, which formed through the fusion of an autosome (Muller-C) with the ancestral Y around 1.5 million years ago and has since more than doubled in size due to the accumulation of TEs. The high-quality genome assembly has near end-to-end assemblies of most chromosome arms that include large fractions of heterochromatin (Figure 1C–D; Mahajan et al., 2018): roughly 30 Mb of pericentromeric heterochromatin at the X and autosomes, and over 100 Mb of the repeat-rich Y chromosome have been assembled. In contrast, the most repeat-rich genome assembly of D. melanogaster contains only 14.6 Mb of Y-linked sequence scattered across 106 contigs (Chang and Larracuente, 2019). D. miranda’s neo-Y chromosome is predominantly assembled into two massive contigs (53.8 and 37.2 Mb) and harbors an abundance of active single-copy genes interspersed in repeats; the mixture of genes and repeats create nonredundant junctions facilitating sensitive read mapping (Wei et al., 2020). Additionally, unlike D. melanogaster that contains Mb-sized blocks of simple satellite DNA, this species has few simple satellites in its genome (Wei et al., 2018), thus allowing us to map most heterochromatic regions using ChIP-seq technology. To study the formation of H3K9me3-dependend heterochromatin during early development, we adapted an ultra-low input ChIP-seq protocol using single precisely staged embryos (Figure 1A). Our dense sampling during early embryogenesis (genome-wide H3K9me3 profiles for >70 individual embryos) allowed us to infer spatiotemporal heterogeneity in heterochromatin establishment and evaluate the relationship between the nucleation and spreading of H3K9me3 marks to zygotic genome activation and maternally deposited piRNAs.
Results
Genome-wide profiling of H3K9me3 in Drosophila across an embryonic time course
To define the chromatin landscape before, during, and after the establishment of heterochromatin, we collected D. miranda (MSH22) embryos from population cages at 18°C between 210 and 420 min, to target embryonic stage 3 (before the onset of heterochromatin formation), early and late stage 4 (when some heterochromatin is first detected), stage 5 (when heterochromatin becomes cytologically visible), and stage 7 (when heterochromatin exerts its silencing effect), respectively (see Figure 1A and Supplementary file 1). Note that embryonic development is highly stereotypical across the Drosophila genus, with nearly identical morphological landmarks (Kuntz and Eisen, 2014). Embryos were examined under a light microscope to only select embryos of the correct stages, based on major morphological features to classify developmental stages (see Materials and methods, Figure 1B; Lott et al., 2014). For each stage, we collected between 8 and 20 embryos, which were subjected to single-embryo, ultra-low input ChIP-seq library preparation (Brind'Amour et al., 2015), with antibodies against the repressive histone mark H3K9me3. The large numbers of replicates (Supplementary file 1) ensure robust and sensitive profiles of H3K9me3 enrichment across the stages. We initially performed two independent IPs on individual embryos, targeting both H3K9me2 and H3K9me3 (Figure 1—figure supplement 1). Overall, their enrichment profiles are very similar and highly correlated (Figure 1—figure supplement 1). In addition, we spiked the libraries with stage 7 D. melanogaster embryos, so that enrichment profiles can be compared across samples and stages after spike-in normalization (see Materials and methods and Figure 1—figure supplement 2).
Bulk of heterochromatin establishment occurs during early stage 4 of embryonic development
Based on cytology and microscopy, heterochromatin is first detectable at the last cell cycles in stage 4 (that is around nuclear cycle 12/13) and then becomes established rapidly during cellularization at stage 5 (Vlassova et al., 1991; Lu et al., 1998; Yuan and O'Farrell, 2016; Larson et al., 2017; Strom et al., 2017). However, we already see clear H3K9me3 enrichment around the pericentric regions of each chromosome at early stage 4 (that is, nuclear cycle 10/11), followed by subsequent increases in enrichment through stage 7 (Figure 2A). The same pattern of establishment at early stage 4 is also apparent when we inferred regions of the genome with H3K9me3 enrichment peaks; the number of H3K9me3 peaks identified sharply increases from stage 3 (n = 2202) to early stage 4 (n = 51,202), followed by proportionally smaller increases in peak numbers through the later stages (Figure 2B, Figure 2—figure supplement 1). Interestingly, as development progresses, peak sizes broaden and become less sharp (Figure 2B,C, Figure 2—figure supplements 1 and 2). After stage 3, we see a gradual increase of H3K9me3 enrichment around early peaks as embryos age (Figure 2C). Concordantly, regions of the genome where peaks are inferred in late stage 4, stage 5, and stage 7 already show positive H3K9me3 enrichment at early stage 4, on average (Figure 2D), even though they are depleted, on average, at stage 3 (Figure 2D). In fact, nearly 60% of the 116,791 peaks inferred for stage 7 are already enriched for H3K9me3 at early stage 4, even if the enrichment level is below the detection limit of peak calling (Figure 2E). Furthermore, an additional 27% of the peaks also show enrichment at stage 3 (Figure 2E). Similarly, for late stage 4 and stage 5, the majority of the peaks are enriched in early stage 4. Altogether, these results indicate that pericentric heterochromatin establishment in D. miranda likely starts at or before stage 4, followed by increases in heterochromatin levels during subsequent stages.

Developmental trajectory of heterochromatin enrichment and peaks.
(A) Genome-wide H3K9me3 enrichment landscape through five embryonic stages. Karyotypes are depicted below the X-axis, with the centromeres marked by black circles. (B) Width and height of H3K9me3 peaks (points), as determined by MACS2, is plotted in log scale on the X- and Y-axes, respectively. Stages are color labeled with number of peaks in parentheses. Circles outline areas in which the bulk of the points of a stage reside. Unless otherwise stated, the developmental stages will be differentiated consistently with these colors henceforth. (C) Median H3K9me enrichment in log scale is plotted ±1 kb around peaks for each stage. Gray area demarcates the 95% confidence intervals. (D) H3K9me3 enrichment trajectory of peaks called for each stage across development. For every set of peaks called in each stage, the median enrichment value is plotted and connected across all developmental stages with the 95% CI demarcated by vertical lines. For example, red points and lines are the enrichment values around stage 3 peaks across all five stages. Points and CIs are horizontally staggered for clarity. (E) Colored areas in pie chart mark the proportion of stage 7 peaks that are already enriched (>1.5-fold enrichment) in previous stages. (F) Barplot format of (E), but for peaks called in every stage.
Bona fide stage 3 peaks nucleate heterochromatin
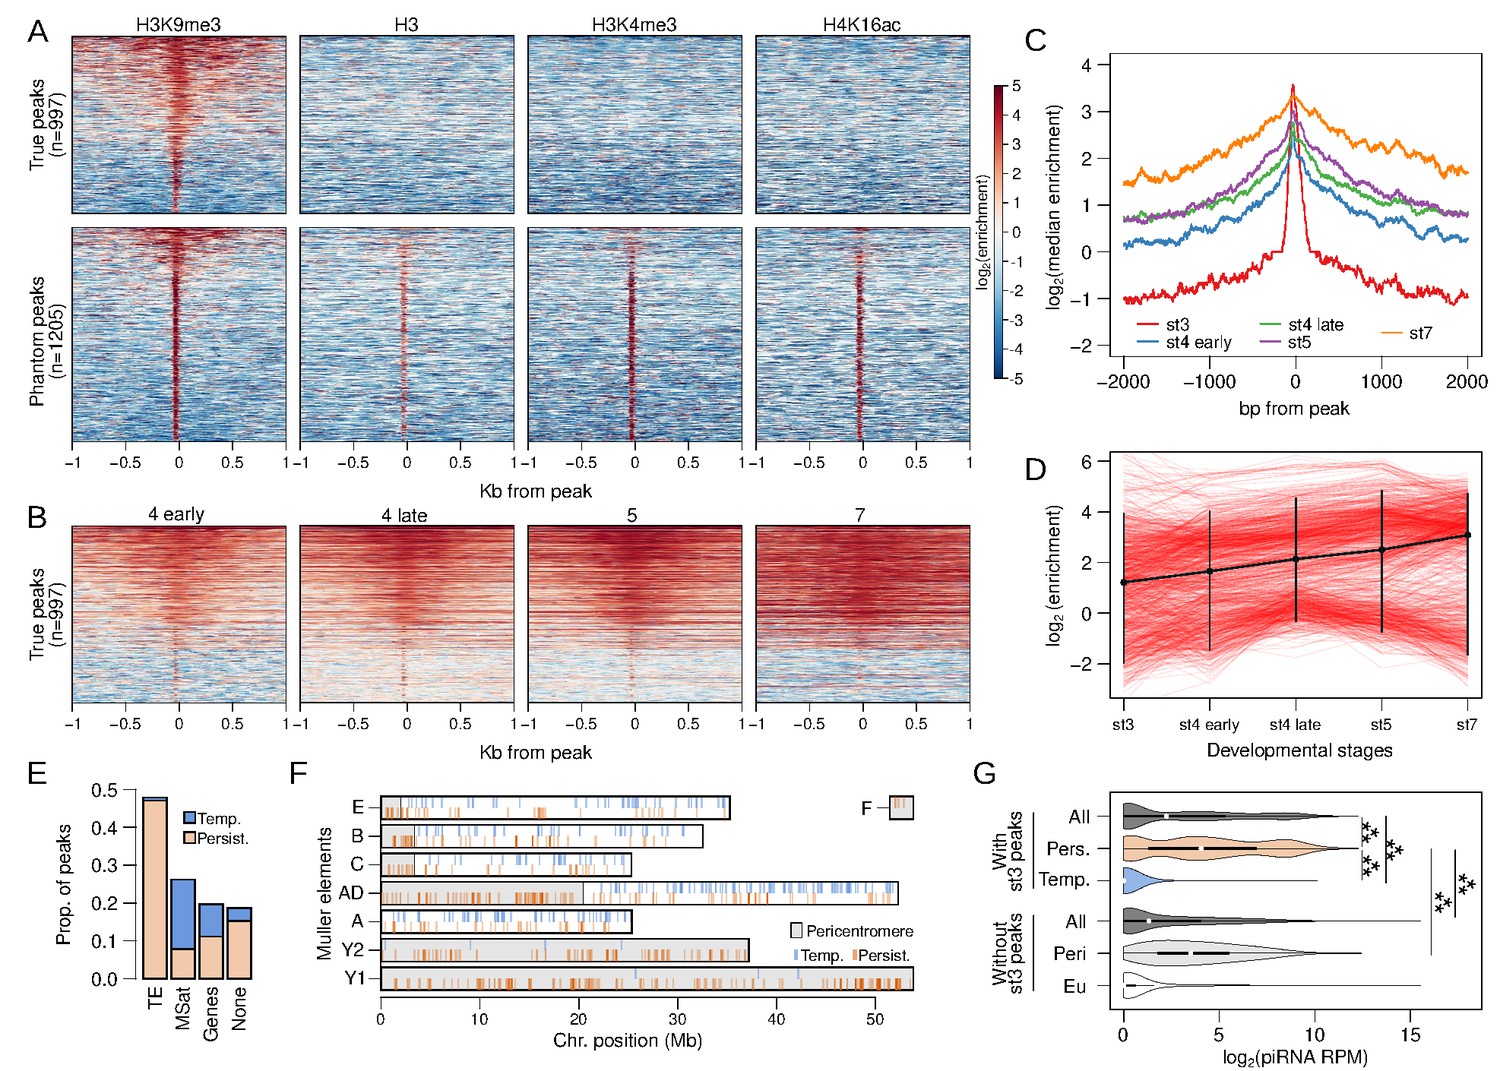
While the bulk of H3K9me3 enrichment appears at early stage 4, we also identified a small number of peaks at stage 3 (n = 2202). which show sharp and narrow enrichment around their center that precipitously drops to depletion less than 100 bp away (Figure 2B,C). This is a strikingly different pattern from peaks called at all other stages that show elevated enrichment that span well over 1 kb away from the peak (Figure 2B,C). To ensure that stage 3 peaks and enrichment are not artifacts due to the small number of nuclei (‘phantom peaks’; Jain et al., 2015), we collected ChIP-seq of stage 3 embryos using three additional antibodies targeting H3, H3K4me3 (an active transcription mark), and H4K16ac (the dosage compensation mark). We find that many of the stage 3 heterochromatin peaks show similarly elevated enrichment in the other preparations, indicating that a subset of the peaks are indeed artifacts (Figure 3A). We therefore removed 1205 peaks that show enrichment in one or more of the other ChIP preparations, resulting in a set of 997 H3K9me3-specific peaks (henceforth stage 3 peaks; Figure 3A, Figure 3—figure supplement 1).

Stage 3 H3K9me3 peaks nucleate heterochromatin.
(A) Separation of genuine stage 3 peaks from non-specific (phantom) stage 3 peaks using ChIP-seq against alternative histone modifications. Heatmaps depict the extent of enrichment around stage 3 H3K9me3 peaks (±1 kb). Peaks are sorted by the average H3K9me3 enrichment around each peak; therefore, all the different ChIP-seq enrichment plots have the same ordering. Top panels are H3K9me3-specific peaks, while bottom panels are non-specific peaks. (B) H3K9me3 enrichment around stage 3 peaks across developmental stages; peaks are ordered as in (A) (top). (C) Median H3K9me3 enrichment across developmental stages around stage 3 peaks. (D) Developmental trajectory of each H3K9me3 peak (red lines). Enrichment of a peak is estimated as enrichment averaged across ±100 bp around each peak. The average across all peaks is in black with error bars representing 95% confidence intervals. (E) Distribution of stage 3 peaks across different annotation categories. (F) Placement of peaks across the genome; gray regions mark the pericentric and heterochromatic regions of the genome. Persistent and temporary peaks are plotted on the bottom and top halves of each chromosome arm, respectively. (G) Distribution of piRNA mapping in 5 kb genomic windows that overlap stage 3 peaks (top) and windows that do not overlap stage 3 peaks (bottom). The two sets of windows are further subdivided into those with persistent (Pers.) and temporary (Temp.) stage 3 peaks and those in (Peri) and outside (Eu) the pericentromeric regions, respectively. ***p<2.2e-16 Wilcoxon rank sum test.
Around stage 3 peaks, H3K9me3 enrichment gradually expands across development (Figure 3B,C), emblematic of the spreading of the heterochromatic domain. Since a single nucleosome is wrapped by ~147 bp of DNA, the narrow width of the stage 3 peaks (median width of 125 bp) suggests that they predominantly represent single nucleosomes that nucleate the deposition of H3K9me3 in neighboring nucleosomes in subsequent stages (Figure 3A,C). 47.8% and 26.2% of the stage 3 peaks overlap with annotated TEs and microsatellites (Figure 3E). Unexpectedly, though, they are found scattered across the genome, as opposed to being concentrated near the pericentric regions (Figure 3F). Interestingly, 25.6% (n = 256) of the stage 3 peaks appear to become depleted of H3K9me3 enrichment over time (Figure 3B,D), possibly indicating that some nucleating sites fail to initiate and/or maintain heterochromatin spreading, but they could also be phantom peaks that remained after filtering. The bulk of these temporary peaks overlap microsatellites (71.4%) and only 3.1% overlap TEs (Figure 3E). In contrast, peaks that persist and expand through development (n = 741) mostly overlap TEs (63.3%), and only 10.5% are found at microsatellites (Figure 3E). Nearly all the temporary peaks are found outside of the pericentromere or the heterochromatic Y (Figure 3F).
H3K9me3 nucleation may be driven by RNA-mediated targeting (Gu and Elgin, 2013). We utilized embryonic RNA-seq data (Lott et al., 2014) and sequenced the piRNAs in 0–1 hr embryos to test for an association between H3K9me3 targeting and silencing of maternal or nascent TE transcripts by small RNAs. We find sparse RNA-seq reads from stage 2 or stage 4 embryos mapping to or around H3K9me3 peaks at embryonic stage 3 or 4 (Figure 3—figure supplement 2). Most of the RNA-seq reads around stage 3 peaks result from maternal transcripts of genes (Figure 3—figure supplement 3), with 40% of the 175 genes overlapping stage 3 peaks producing maternal transcripts. This is similar to the proportion of maternal genes genome-wide (39.8%; Figure 3—figure supplement 3B), arguing against the possibility that maternal transcripts induce nucleation. However, we find that genomic regions containing persistent stage 3 peaks have abundant piRNAs mapping around them (Figure 3G). Median piRNA reads per million (RPM) for 5 kb windows overlapping persistent stage 3 peaks is 15.55 (Figure 3G, Figure 3—figure supplement 4); this is substantially and significantly higher than for the rest of the genome (median RPM = 1.48), and also for pericentromeric windows lacking stage 3 peaks (medium RPM = 10.36; Figure 3G; Wilcoxon rank sum test p<2.2e-16). These results suggest that maternally deposited piRNAs play an important role in early H3K9me3 nucleation and are consistent with the model of piRNA-mediated co-transcriptional silencing (see below).
Temporary stage 3 peaks have almost no piRNAs mapping around them (median RPM = 0, Figure 3G). While this may simply reflect that temporary peaks are residual phantom peaks, it could also suggest that nucleation may involve other mechanisms independent or in addition to PIWI/piRNA-mediated targeting.
Nucleation and spreading at early stage 4 are primarily at TEs and pericentric regions
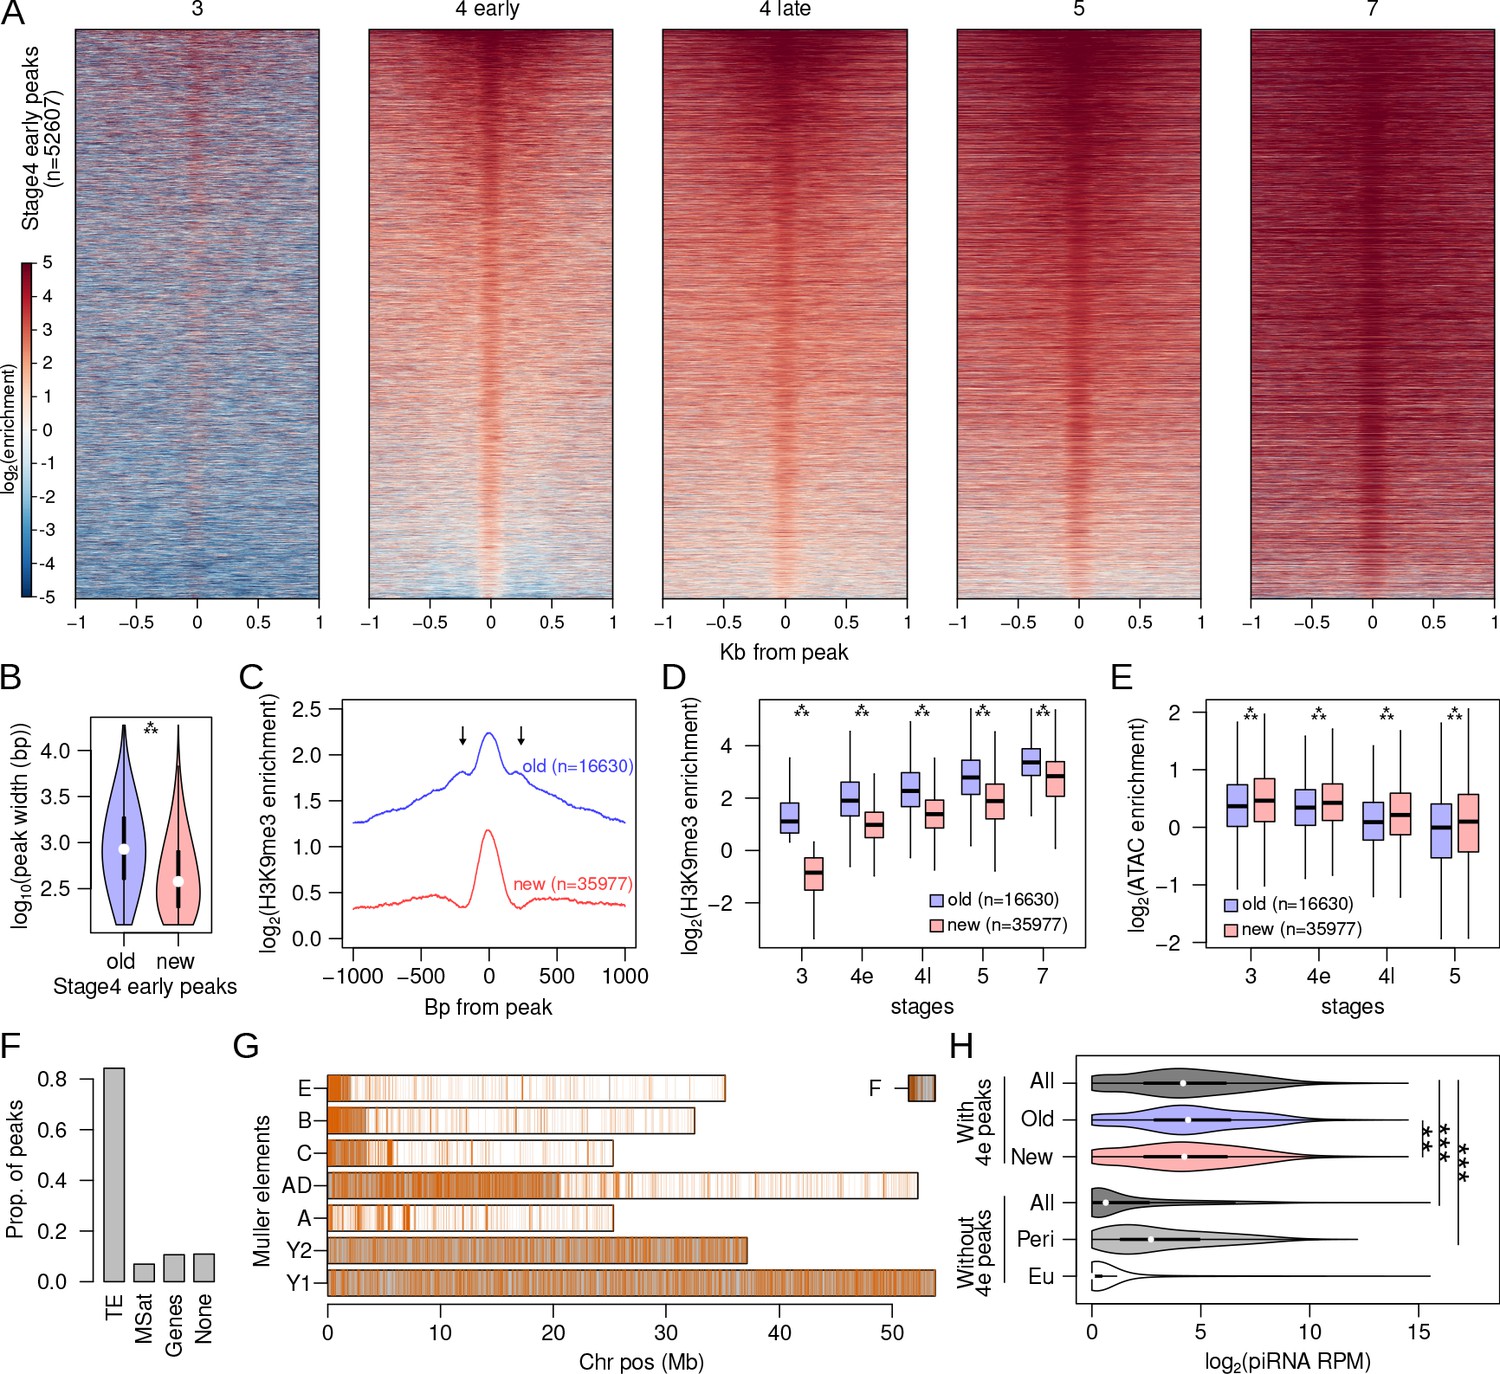
While only about ~1000 H3K9me3 peaks are identified at stage 3, this number drastically increases to 52,607 in the early stage 4 samples (Figure 4A). Early stage 4 peaks show a gradual increase in levels of H3K9me3 enrichment and a local expansion of the H3K9me3 domain across development (Figure 4A, Figure 4—figure supplement 1). Unlike stage 3 peaks, nearly all early stage 4 peaks (97.7%) remain enriched throughout development. To better characterize this rapid burst of nucleation activity, we divided the early stage 4 peaks into those that already show enrichment at stage3 and those that do not, resulting in 16,630 and 35,977 peaks, respectively (Figure 4—figure supplement 2). The former (hence forth, old peaks) contain sites that are in the process of nucleation at stage 3, but their H3K9me3 enrichment is below the threshold used for peak-calling (Figure 4—figure supplement 2A). The latter (hence forth, new peaks) contain sites that began nucleating at stage 4, as they show no prior heterochromatin enrichment (Figure 4—figure supplement 2B).

Rapid nucleation in early stage 4.
(A) H3K9me3 enrichment around (±1 kb) early stage 4 peaks across development. Peaks are sorted by mean enrichment at early stage 4. (B) Peak widths of early stage 4 peaks that show enrichment in stage 3 (old) and peaks that show no enrichment in stage 3 (new); ***p<2.2e-16 (Wilcoxon rank sum test). (C) Median H3K9me3 enrichment around old and new early stage 4 peaks. Arrows mark secondary peaks around the old peaks. (D) H3K9me3 enrichment of old and new early stage 4 peaks across development; ***=p < 2.2e-16 (Wilcoxon rank sum test). (E) Accessibility as measured by ATAC-seq enrichment in old and new peaks; **p<2.2e-16 (Wilcoxon rank sum test). (F) Distribution of new early stage 4 peaks across different annotation categories. (G) Genome-wide distribution of new early stage 4 peaks; gray regions mark the pericentric and heterochromatic regions of the genome. (H) Distribution of piRNA mapping in 5 kb genomic windows that overlap (top) and do not overlap (bottom) early stage 4 peaks. The windows are further subdivided into containing old or new peaks and being located in (Peri) and outside (Eu) the pericentromeric regions, respectively. **p<0.0001, ***p<2.2e-16 Wilcoxon rank sum test.
Consistent with subsequent spreading of H3K9me3 after nucleation, old peaks are on average 847 bp, significantly wider than young peaks which are on average 378 bp (Wilcoxon rank sum test, two-tailed p-value<2.2e-16; Figure 4B). Furthermore, secondary peaks can be observed around the old peaks, indicating the deposition of H3K9me3 to adjacent nucleosomes by histone methyltransferases (Figure 4C). In contrast, the new peaks show a single summit flanked by depletion, consistent with H3K9me3 at single nucleosomes. Both sets of peaks increase in H3K9me3 enrichment across developmental stages with the new peaks having significantly lower enrichment across all stages; however, the difference in enrichment between the two sets of peaks decreases over time (Figure 4D). The gradual increase in H3K9me3 enrichment across stages likely reflects increasing numbers of nuclei/cells in the embryo with H3K9me3 deposited around nucleating sites as heterochromatin becomes stably established, with older peaks reaching saturation as the new peaks catch up. To determine whether increases in H3K9me3 enrichment are associated with expected decreases in chromatin accessibility, we generated ATAC-seq libraries from single embryos for the same developmental stages (absent stage 7). Indeed, we find that both sets of peaks show decreasing accessibility over development, with the old peaks being significantly less accessible across all stages (Figure 4E).
Expectedly, most of the stage 4 peaks (84.2%) overlap with annotated TEs (Figure 4F) and 82.6% of them are concentrated at the pericentromere and the repeat-rich Y chromosome (Figure 4G). These distributions are drastically different from stage 3 peaks, revealing that nucleation at stage 4 is more localized to canonically heterochromatic sites and TEs. Again, we looked for associations of stage 4 peaks with transcripts and piRNAs. As with the stage 3 peaks, very few stage 2 or 4 embryonic RNA-seq reads map to or around the peaks (Figure 4—figure supplement 3). Similar to persistent stage 3 peaks, we find that genomic (5 kb) windows with stage 4 peaks have abundant piRNAs mapping, with median RPM of 17.21 (Figure 4—figure supplement 4). Again, this is significantly higher than both windows without peaks (median RPM = 0.56, Wilcoxon’s rank sum tests, p<2.2e-16) or windows in the pericentromere but without peaks (median RPM = 5.55, Wilcoxon’s rank sum tests, p<2.2e-16; Figure 4H). Furthermore, genomic windows with old stage 4 peaks have slightly but significantly more piRNA (median RPM = 20.36) than new peaks (median RPM = 17.95; Wilcoxon’s rank sum tests, p=6.57e-05; Figure 4H). These results again show that heterochromatin establishment during early embryogenesis is associated with maternal piRNAs and support a model of PIWI/piRNA-mediated targeting of heterochromatin. However, many windows with stage 4 peaks have no piRNAs mapping, and many windows without peaks have high piRNAs mapping (Figure 4H), suggesting that additional signals are likely at play (see below).
Heterochromatin nucleation at TEs is restricted at stage 3 but wide at stage 4
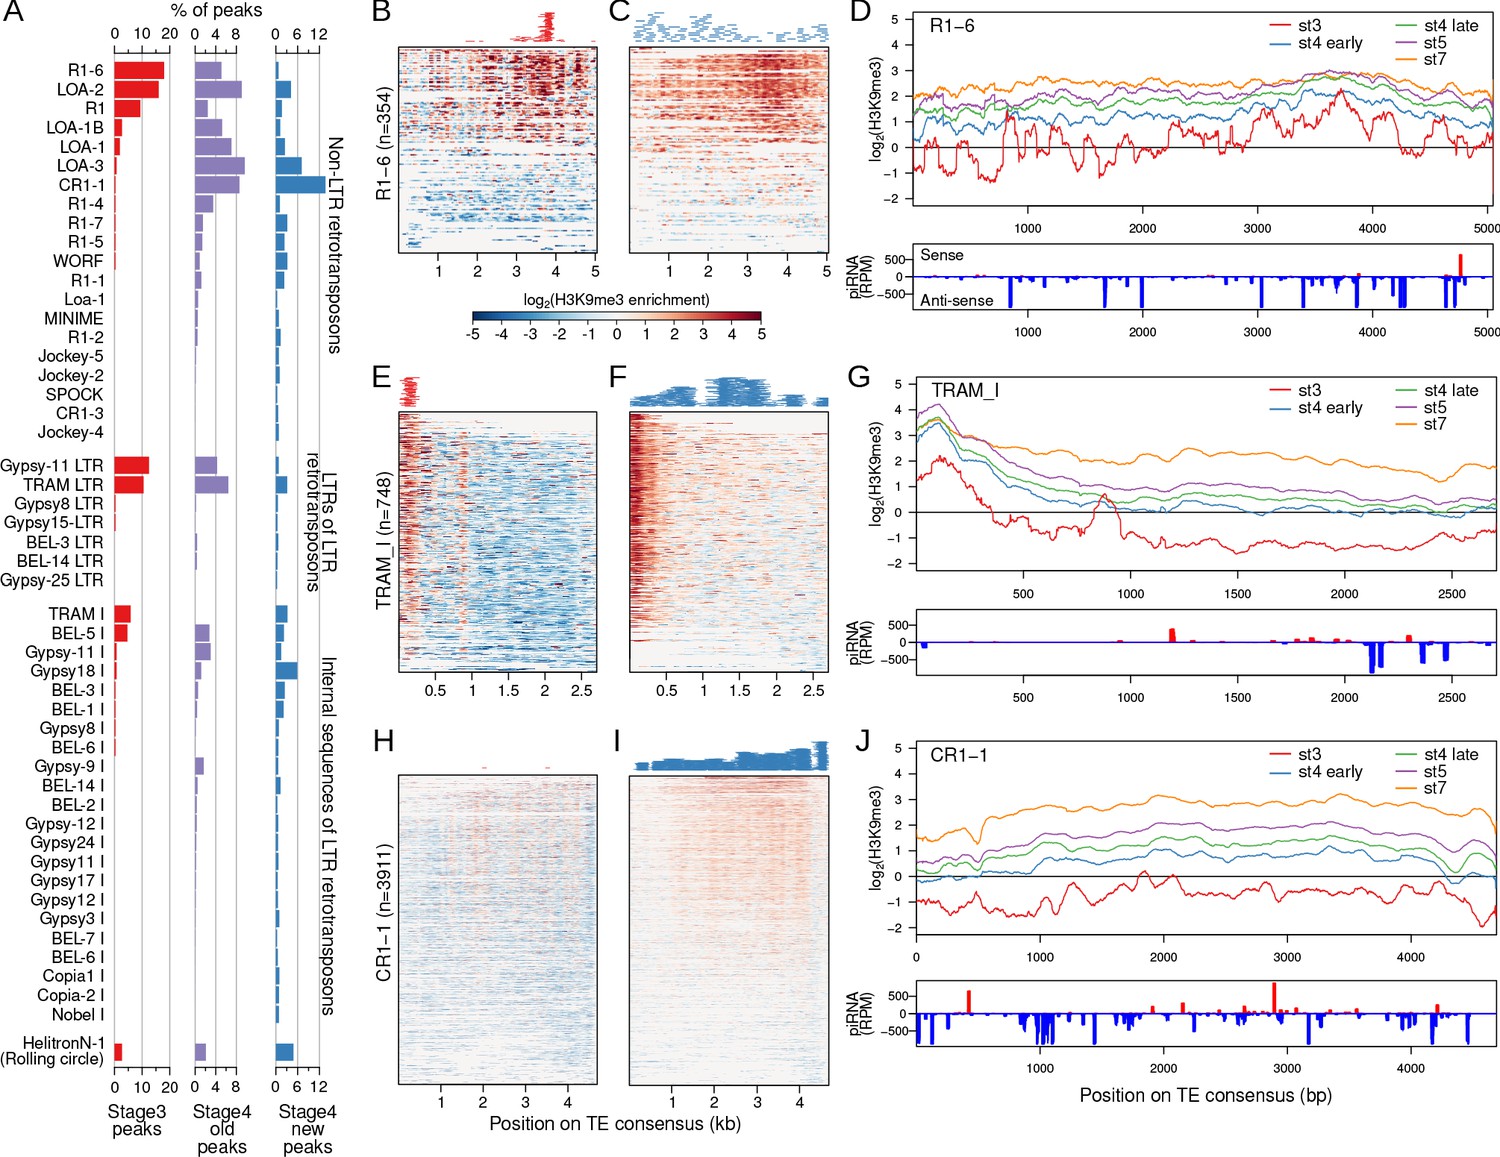
As TEs dominate stage 3 and early stage 4 nucleation sites (Figures 3E and 4F), we further characterized patterns of nucleation and spreading at specific TE families annotated across the genome. Of the 235 entries in the curated TE library of the D. pseudoobscura group (Hill and Betancourt, 2018), only 35 (14.8%) overlap with stage 3 peaks while 189 (80.3%) overlap with the early stage 4 peaks (Figure 5A). Stage 3 peaks reside predominantly in retrotransposons (Figure 5A), and can be found both within non-LTR retrotransposons (e.g. LOA and R1) and LTR retrotransposons (e.g. Bel, Gypsy11, TRAM). In contrast, stage 4 peaks show a very different distribution among TEs (Figure 5A). For example, three TE variants (CR1-1, LOA-3, and Gypsy18) have the most early stage 4 peaks but few stage 3 peaks (Figure 5A), suggesting that some TEs nucleate heterochromatin earlier than others.

Narrow nucleation followed by wide establishment of heterochromatin at TEs.
(A) TEs with annotated insertions overlapping stage 3, stage 4 old peaks, and stage 4 new peaks are listed; barplots depict the proportion of peaks overlapping with each TE. (B) H3K9me3 enrichment at stage 3 at all annotated TE insertions of the TE R1 variant (R1-6). Full length and fragmented annotated insertions are lined up with respect to their positions on the consensus TE sequences. Insertions are sorted by average enrichment. Positions of the called peaks are plotted above the heatmap. (C) Same as (B), but for stage 4 enrichment and new peaks. (D) Top. Mean enrichment of all insertions for the TE across development. Bottom. Sense and anti-sense piRNA mapping across the TE. (E–G) and (H–J), same as (B, C) but for the TEs TRAM and CR1-1, respectively. For more examples of enrichment over TEs, see Figure 5—figure supplements 1 and 2.
H3K9me3 nucleation within TEs could occur at specific positions or be distributed more evenly across the TE. We looked at the placement of H3K9me3 peaks with respect to the full-length TE consensus sequence and overall H3K9me3 enrichment of all the annotated insertions for each TE in the D. miranda genome. For TEs with large numbers of stage 3 peaks, the peaks are typically highly restricted to a specific region of TEs. For example, the vast majority of stage 3 peaks localize between 3500 and 4000 bp of the R1-6 element (Figure 5B). This starkly contrasts from the early stage 4 peaks, which are scattered across the entirety of the R1-6 element (Figure 5C). As expected, the position of the cluster of stage 3 peaks also corresponds to the region with the highest H3K9me3 enrichment across the R1-6 element, producing spikey and heterogeneous H3K9me3 enrichment profiles at stage 3 (Figure 5B–D). However, at later stages, H3K9me3 enrichment becomes more evenly elevated around the peak region, indicative of spreading of heterochromatin for robust silencing during development (Figure 5D). Similarly, the TRAM element shows highly restricted H3K9me3 enrichment and peaks localized to the 5’ (0–300 bp) region at stage 3 followed by broad heterochromatin enrichment at early stage 4 and peaks spread throughout the element (Figure 5E–G). The 5’ region of TRAM, where the early nucleating peaks reside, continues to increase in H3K9me3 over development as enrichment levels at the rest of the TE (Figure 5G). Notably, the 5’ region of nearly all of the 748 TRAM copies found in the D. miranda genome show elevated H3K9me3 enrichment even though only 27 peaks have been called there (Figure 5E), indicating that peak calling is highly conservative and substantially underestimates the number of nucleation sites. This pattern of localized stage 3 nucleation is also observed in other TEs (Figure 5—figure supplement 1) and for LTR-retrotransposons, nucleation appears restricted to the 5’ end of the TE (Figure 5—figure supplement 2).
For TEs like CR1-1 that have few to no stage 3 peaks, H3K9me3 establishment at early stage 4 is nonetheless very broad (Figure 5H–J, Figure 5—figure supplement 1). When looking at H3K9me3 enrichment at stage 3 across all CR1-1 insertions, we noticed low but consistent patterns of localized H3K9me3 enrichment at multiple positions of the TE (e.g. ~1800 bp,~2200 bp, and ~4000 bp); these regions also show some of the most elevated H3K9me3 enrichment at later stages (Figure 5J, Figure 5—figure supplement 1). These patterns suggest that despite the absence of H3K9me3 peak calls at stage 3, localized nucleation likely is in progress at this stage, but possibly in only a subset of nuclei, causing low overall enrichment. Thus, we conclude that nucleation begins first as targeted H3K9me3 enrichment at TE insertions followed by wide H3K9me3 deposition and spreading across the rest of the element.
High maternal piRNA abundance and early zygotic transcription are associated with early nucleation at TEs
The piRNA pathway allows for sequence-specific targeting of TEs for both co-transcriptional silencing and post-transcriptional degradation (Malone and Hannon, 2009). Indeed, we observed that nucleating peaks tend to be found in genomic regions with high piRNA mapping (Figures 3G and 4H). To further evaluate whether piRNAs play a role in the targeted nucleation at TEs, we looked at the amount of maternally deposited sense and anti-sense piRNA mapping specifically to TEs (instead of genomic regions around peaks). Interestingly, we find that TEs with stage 3 peaks generate more maternal sense and anti-sense piRNAs than other TEs (Figure 6A; p=4.2e-06 and p=0.000118, respectively, Wilcoxon rank sum test). TEs with stage 4 peaks are also enriched for piRNAs, but to a lesser extent than stage 3 peaks (Figure 6A). Therefore, TEs generating abundant piRNAs - also tend to be the earliest to be targeted for H3K9me3 nucleation. piRNA abundance is much more strongly and significantly correlated with H3K9me3 enrichment of TEs at the later developmental stages (Figure 6B), which could indicate that piRNAs further facilitate the spreading and maturation of H3K9me3-dependent silencing after early nucleation.

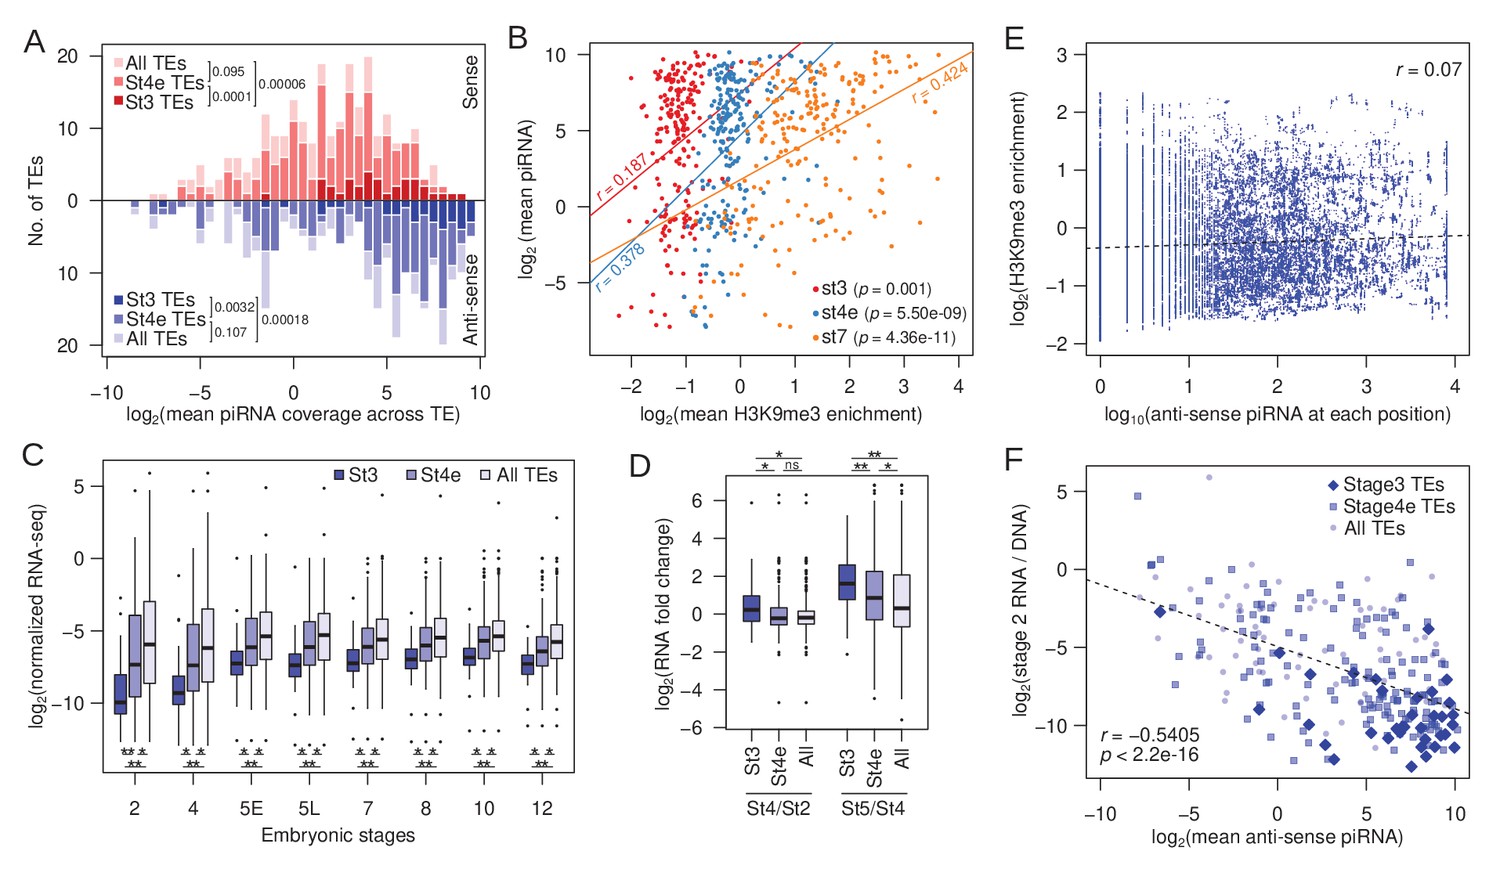
Association between early H3K9me3 nucleation at TEs, maternal piRNA production, and expression.
(A) Distribution of TEs by their average maternally deposited sense (top, red) and anti-sense (bottom, blue) piRNA coverage. TEs with stage 3 peaks (stage 3 TEs), early stage 4 peaks (stage 4e TEs), and all TEs are in decreasing color intensity. p-values of pairwise comparisons determined by Wilcoxon’s rank sum test are marked beside the legends. (B) Correlation between average H3K9me3 enrichment across a TE at different developmental stages and average piRNA abundance. Pearson’s correlation coefficients (r) are labeled beside the regression lines. (C) Average expression of TEs with stage 3 peaks, early stage 4 peaks, and all TEs across embryonic development. Pairwise significance is determined by Wilcoxon’s rank sum rest: *p value<0.05 and **p value<0.001 after multiple-testing correction with false discovery rate. (D) Zygotic expression of different TE classes is approximated by the fold difference between early embryonic stages. Pairwise significance determined as in (C). (E) For each position of stage 3 nucleating TEs, the H3K9me3 enrichment is plotted against the number of piRNA reads mapped. Linear regression is plotted in dotted line and Pearson's correlation coefficient (r) is labeled. (F) Negative correlation between maternally deposited anti-sense piRNA and expression of all TEs (light blue dots), stage 3 TEs (dark blue diamonds), and early stage 4 TEs (blue boxes). Expression of TEs is scaled by copy number by dividing the RNA-seq read counts with DNA-seq read counts. Dotted line demarcates the linear regression and r represents the Pearsons’ correlation coefficient.
Co-transcriptional silencing of repeats in Drosophila requires transcription of TEs (Verdel et al., 2004; Ozata et al., 2019). We, therefore, examined TE expression in developmentally staged (stages 2–12) and sexed single embryo RNA-seq datasets (Lott et al., 2014); note that while these data measure standing levels of transcripts, increases and decreases in RNA transcript levels across stages reflect zygotic transcription, or RNA degradation, respectively. Across all developmental stages, transcript abundances of TEs with stage 3 peaks are significantly lower than the remaining TEs (Figure 6C). The vast majority of transcripts in stage 2 embryos are maternally deposited, and TE expression increases across the board as zygotic expression ramps up (most noticeable between stages 4 and 5, Figure 6C). However, TEs with stage 3 nucleation sites show the highest and earliest increase in transcript abundance (Figure 6C,D). While transcript abundances of most TEs, on average, remain unchanged between stages 2 and 4 (0.97-fold difference), stage 3 nucleating TEs show a 1.41-fold increase in RNA abundance from stage 2 to stage 4 embryos (Figure 6D). Interestingly, TEs with stage 4 nucleation peaks, although showing no change in expression between stages 2 and 4 (1.01-fold difference), start showing evidence of zygotic transcription slightly later, when contrasting transcript abundances between zygotic stages 4 and 5 (Figure 6C,D). These results reveal that early nucleating TEs are among the first to be zygotically transcribed during embryogenesis, consistent with the need for nascent TE transcripts to induce PIWI-associated co-transcriptional silencing (Shimada et al., 2016).
While piRNA abundance is strongly associated with early nucleation, regions with abundant piRNA mapping on TEs do not necessarily correspond to the positions of stage 3 peaks nor elevated H3K9me3 enrichment (Figure 5D,G,J). At any given position along TEs with stage 3 peaks, the amount of piRNA mapping shows little-to-no correlation with H3K9me3 enrichment (Figure 6E). Furthermore, the extent of H3K9me3 enrichment does not correlate with the amount of piRNA mapping around peaks (Figure 6—figure supplement 1). These results argue against a simple targeting model where piRNA/PIWI complexes induce chromatin changes at the exact same sequence as where they associate with nascent transcripts, and suggest that additional targeting mechanism(s) are likely directing restricted H3K9me3 deposition within early nucleating TEs.
Loss of nucleating sites at 5’ LTR diminishes heterochromatin establishment
Early nucleating LTR retrotransposons, such as TRAM, appear to have most of their peaks and elevated H3K9me3 enrichment in their 5’ region (Figure 5B, Figure 5—figure supplement 2). This, along with early zygotic expression, raises the possibility that transcription initiation may be involved in nucleation. TRAM is flanked by two 372 bp long terminal repeats (Steinemann and Steinemann, 1997; Figure 7—figure supplement 1), which contain numerous stage 3 peaks (Figure 5A). For LTR retrotransposons, the 5’ LTR contains the primary promoter (Thompson et al., 2016). Indeed, the 5’ LTR of TRAM is highly enriched for H3K9me3 (Figure 7A, Figure 7—figure supplement 1) and, to a lesser extent, also the 3’ LTR (Figure 7A, Figure 7—figure supplement 1); we suspect the lower 3’ enrichment mostly reflects unavoidable non-unique mapping between identical sequences within the LTR. In addition, LTR retrotransposons can form head-to-tail tandems such that a 3’ LTR is also the 5’ LTR of a downstream element (McGurk and Barbash, 2018; Ke and Voytas 1997), a structure that we indeed find in the D. miranda genome (Figure 7—figure supplement 1). Other LTR retrotransposons show a similar enrichment of stage 3 peaks in their 5’ LTR (i.e. Gypsy-11, Figure 5—figure supplement 2).

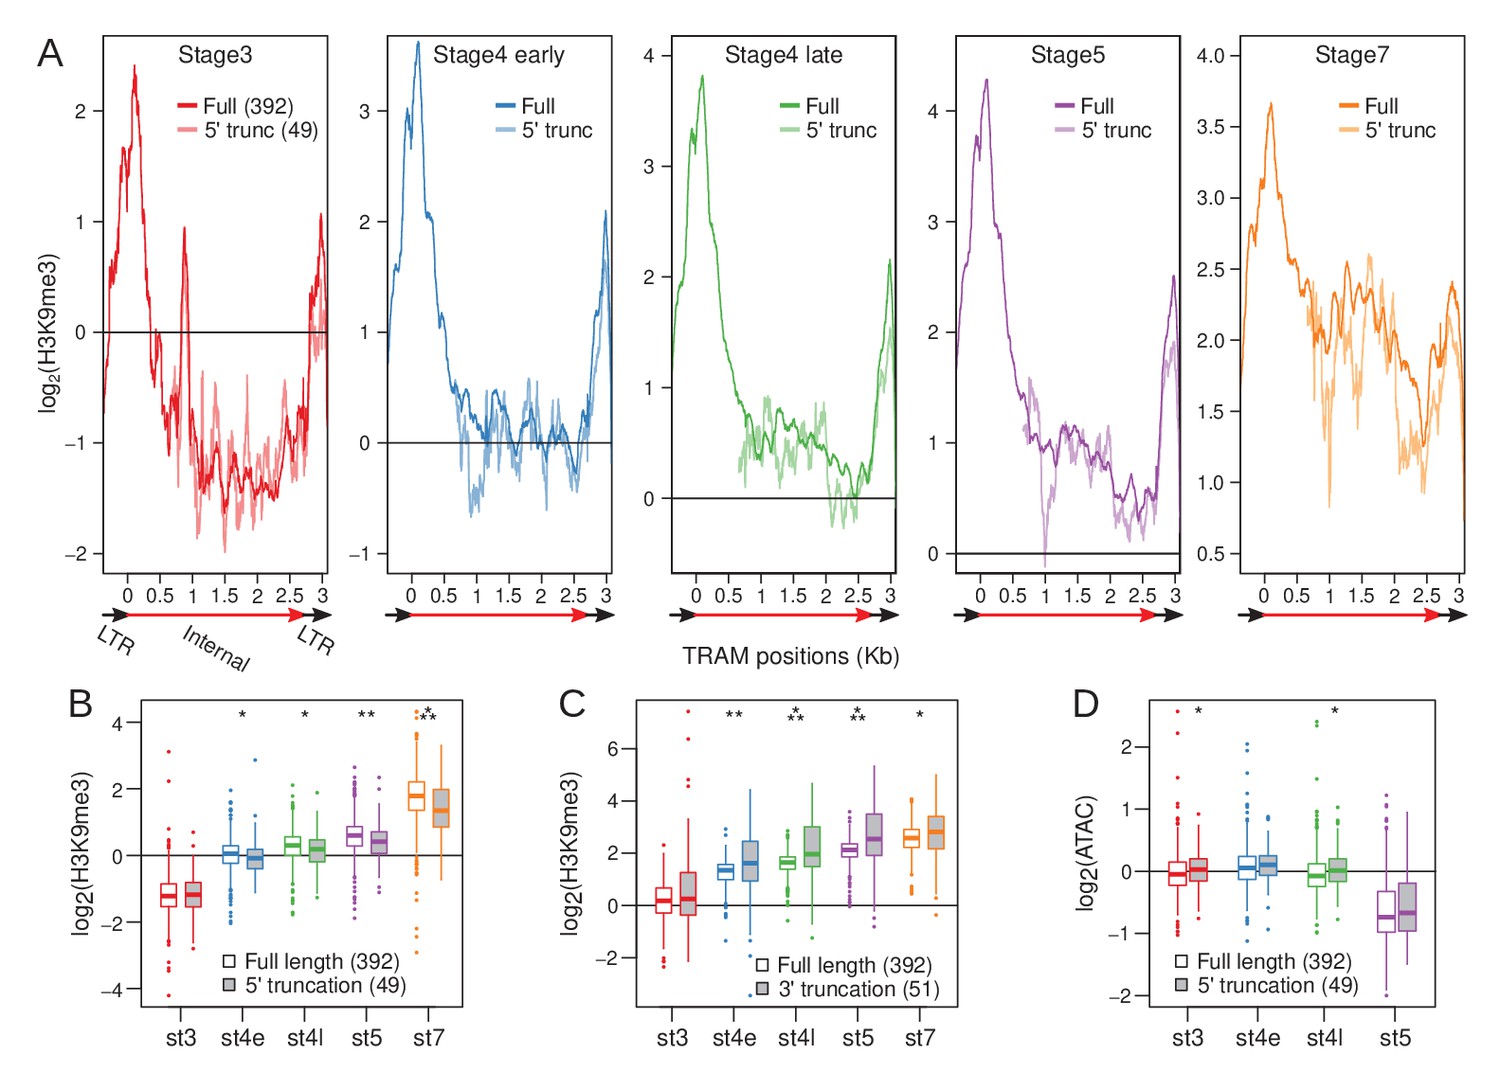
Loss of 5’ LTR and nucleation sites reduce H3K9me3 enrichment at TRAM insertions.
(A) H3K9me3 enrichment averaged across full-length TRAM insertions (sold lines) and 5’ truncated TRAM insertions lacking the 5’ nucleation sites (dotted lines) across developmental stages. Structure of TRAM is labeled below the plots (also see Figure 7—figure supplement 1). Note that the Y-axes change across the plots. (B) Distribution of average H3K9me3 enrichment for full length (boxes with white fill) and 5’ truncated (boxes with gray fill) insertions across development. For each insertion, enrichment is averaged across the last 1 kb of the internal sequence (3’ LTR is excluded). Boxplots depict the distribution of H3K9me3 enrichment across insertions. (C) Same as (B), but averaged across the first 1 kb of the internal sequence of full length and 3’ truncated insertions (5’ LTR is excluded). (D) Same as (B), but with ATAC enrichment instead of H3K9me3 enrichment. *p<0.05, **p<0.005, ***p<0.00005, Wilcoxon’s rank sum test.
To determine whether the loss of the 5’ LTR may perturb the establishment of heterochromatin, we identified TRAM insertions with 5’ truncations (n = 49), abolishing the 5’ LTR and nucleating positions, and compared their H3K9me3 enrichment across development to that of full-length insertions (n = 392) (Figure 7A). We find that 5’ truncated copies are significantly less enriched for H3K9me3 at their homologous regions after stage 3 with the difference in enrichment between 5’ truncated and full-length copies increasing throughout development (Figure 7A,B); at stage 7, full-length inserts are on average 1.36-fold more enriched than 5’ truncated inserts. We note that the difference in enrichment is likely to be a severe underestimate, since non-unique cross-mapping between the different copies (which is inevitable for repeats, especially for a highly abundant recently active one; see below) curtails the difference in read coverage between copies; the difference in enrichment therefore relies on reads that gap insertion junctions which are unique for different insertions. Additionally, we expect heterochromatic spreading from neighboring repeats to further minimize the difference in enrichment.
Notably, diminished H3K9me3 enrichment is not observed from 3’ truncated TRAM copies (n = 51, Figure 7—figure supplement 1) where the 5’ LTR remains intact (Figure 7C, Figure 7—figure supplement 2); in fact, 3’ truncated TRAM copies have elevated enrichment compared to full-length copies as they, by necessity, contain proportionally more of the highly enriched 5’ sequences (Figure 7—figure supplement 2). Further supporting the functional importance of the promoter adjacent nucleating sites for heterochromatin establishment, we find that 5’ truncated insertions of TRAM tend to be more accessible based on ATAC-seq enrichment; albeit, the differences are either marginally significant or insignificant (Figure 7D).
Early nucleating TEs are robustly silenced but were recently active
The amount of piRNA mapping to TEs is significantly anti-correlated with maternally deposited transcript abundance, particularly when scaled by TE copy number (Pearson’s correlation coefficient = −0.54, p<2.2e-16; Figure 6F). TEs with stage 3 nucleation are associated with high piRNAs counts (Figure 6A) and, as expected, significantly overrepresented with lowly expressing TEs (Figure 6C; p=1.582e-08, Wilcoxon’s rank sum test); they remain to be lowly expressed as zygotic transcription increases after stage 4, indicating that early nucleating TEs are among the most repressed TEs (Figure 6C). TEs with stage 4 peaks show intermediate patterns with regards to piRNA counts and expression (Figure 6A,C).
High piRNA production and H3K9me3 enrichment and low transcript abundance of the early nucleating TEs suggest that they are targeted for robust silencing. These TEs may, therefore, have high transposition rates and impose a high fitness burden, creating strong selective pressure to evolve and strengthen epigenetic silencing mechanisms. Indeed, we find that the early nucleating TEs are significantly more abundant in both the male and female D. miranda genomes (Figure 8A). Because genome-wide TE abundance can reflect ancient accumulation and not just recent transposition rates, we also looked at insertions specifically on the neo-Y, which more than doubled in size due to the expansion of TEs since its formation 1.5MY ago (Mahajan et al., 2018). Consistent with recent activity, the neo-Y has on average 1.79-fold more early nucleating TEs than the rest of the genome (Figure 8B). These results reveal that early nucleating TEs have been recently active in the D. miranda lineage, generating a large number of insertions throughout the genome. The strong genomic defense through early nucleation and high piRNA production may therefore have evolved to minimize their deleterious activity.

Genomic abundance of early nucleating TEs.
(A) Comparisons between copy number abundance of stage 3 nucleating, early stage 4 nucleating, and all TEs in males and females. (B) Same as (A), but with number of insertions on the neo-Y. Pairwise significance is represented by letters where -upper-case letters denote p-value<0.001 (Wilcoxon rank sum test); A = stage 3 TEs vs. early stage 4 TEs, B = early stage 4 TEs vs. all TEs, and C = stage 3 TEs vs. all TEs.
Discussion
H3K9me3-dependent heterochromatin nucleation in early development
In metazoans, extensive epigenetic reprogramming occurs during gametogenesis and early embryogenesis where most chromatin marks, including H3K9me3, are erased and re-established later (Ishiuchi et al., 2015; Wang et al., 2018; Laue et al., 2019). H3K9me3 re-establishment in somatic tissues is crucial for normal development in Drosophila and mammals. A number of different pathways have been identified that recruit H3K9 methyltransferases to target loci and include a diversity of guides such as DNA binding proteins and non-coding RNAs. For example, in fission yeast, small interfering RNAs (siRNAs) matching pericentric repeats are required for recruitment of the silencing machinery to pericentric heterochromatin (Volpe et al., 2002; Hall et al., 2002). In mammals, a parallel pathway exists based on DNA sequence-based recognition and silencing of mobile elements by KRAB- zinc-finger DNA-binding proteins. These proteins bind DNA via an array of zinc-fingers and recruit the universal co-repressor KAP1 (KRAB-associated protein 1) through their KRAB domain. In turn, KAP1 recruits histonemethyltransferases to TE insertions to promote deposition of repressive chromatin marks (Wolf et al., 2015).
The role of H3K9me3 in early somatic development has been studied in mouse, and H3K9me3-dependent heterochromatin was shown to undergo dramatic reprogramming during early embryonic development (Wang et al., 2018; Fadloun et al., 2013). Targeting of H3K9me3 during fly embryogenesis is poorly understood. We find that establishment of heterochromatin begins with limited H3K9me3 deposition at single nucleosomes at or before stage 3. These nucleating sites expand gradually by H3K9me3 deposition to neighboring nucleosomes in subsequent stages to form mature heterochromatin. Unexpectedly, we find that early nucleation sites may not be restricted to the pericentric regions and can be lost through development. Nevertheless, the majority of nucleating sites are localized to specific regions of TEs such that across different insertions, the same positions show elevated H3K9me3 enrichment. Interestingly, truncated insertions that lost these positions show significantly reduced H3K9me3 enrichment across the remainder of the TE and maintain elevated accessibility across development, revealing that these nucleating positions are important for subsequent local spreading of heterochromatin.
Potential mechanisms for targeted nucleation in TEs
The restricted positioning of nucleation suggests a targeted mechanism for H3K9me3 deposition. Although one of the key functions of heterochromatin is to induce transcriptional silencing at TEs, a low level of nascent transcription has been implicated in the initial formation of heterochromatin in several organisms (Allshire and Madhani, 2018). Transcription of satellites during embryogenesis has been shown to be required for the formation of heterochromatin in mouse and Drosophila (Probst et al., 2010; Casanova et al., 2013; Mills et al., 2019), and satellite transcription and/or RNAs are necessary for centromere and heterochromatin functions in humans, mice, and flies (Rošić et al., 2014; Johnson et al., 2017; Shirai et al., 2017; Velazquez Camacho et al., 2017; McNulty et al., 2017). Chromatin-associated transcripts may recruit silencing factors to their genomic location (Holoch and Moazed, 2015), and co-transcriptional silencing by PIWIi–piRNA complexes has led to a model where piRNAs provide sequence specificity for PIWI to target nascent TE transcripts and guide co-transcriptional heterochromatin formation at TEs (Holoch and Moazed, 2015). In Drosophila, the piRNA pathway is thought to be primarily active in gonadal tissue, yet mutations of key factors in the pathway, including Piwi, affect heterochromatin formation in somatic tissues (Pal-Bhadra et al., 2004; Gu and Elgin, 2013). Both piRNAs and PIWI protein are maternally loaded into the egg, consistent with maternal piRNA/PIWI complexes guiding initial heterochromatin establishment in the early embryo, which is later maintained independently of piRNAs (Pal-Bhadra et al., 2004; Gu and Elgin, 2013).
Supporting the requirement of nascent transcription for heterochromatin formation, we find that TEs showing early nucleation have significantly higher zygotic expression than the rest during early development (between stages 2 and 4 for TEs with stage 3 peaks, or stages 4 and 5 for TEs with stage 4 peaks). In addition, we find that early nucleating TEs are associated with high abundance of both sense and anti-sense maternally deposited piRNAs. Early zygotic transcription during embryogenesis and high maternal piRNA counts are consistent with this model of co-transcriptional silencing of TEs and highlight the importance of small RNAs in establishing heterochromatin in flies.
While piRNA may guide the recruitment of the co-transcriptional repression machinery, it cannot account for the restricted nucleation of heterochromatin on TE inserts. We find that TEs have specific regions that are targeted first for heterochromatinization, and the positions of abundant piRNA read mapping show little correspondence to the positions of H3K9me3 nucleation along TEs. Our observation that early nucleating TEs also show early zygotic transcription raises the possibility that the act of transcription at these TEs may provide specificity; indeed, extensive chromatin remodeling occurs at promoters during zygotic genome activation (Schulz and Harrison, 2019). Supporting this, the strong H3K9me3 enrichment (and large number of peaks) around the 5’ LTR of TRAM and other LTR-retrotransposons is consistent with a model where histone methyltransferases are recruited to the promoter of the TE insertions perhaps by transcription initiation. Clustering of H3K9me3 to the 5’ end of a subset of TEs was also observed in mice (Walter et al., 2016).
However, this does not appear to be a general rule across all early nucleating TEs, as non-LTR elements like R1-6 and LOA-2 have restricted nucleation sites close to their 3’ end or near the middle of insertions, respectively. These discrepancies may suggest that alternative targeting mechanisms are involved in early heterochromatin deposition in flies. KRAB- zinc-fingers are confined to mammals, but an analogous protein family exists in flies: ZAD- zinc-fingers (ZAD-ZNFs). ZAD-ZNFs are a poorly characterized gene family that has dramatically expanded within insect lineages (Chung et al. 2007; Kasinathan et al., 2020). Approximately half of all ZAD-ZNF genes in D. melanogaster are highly expressed in ovaries and early embryos (Chung et al., 2002) and several interact with heterochromatin (Kasinathan et al., 2020; Swenson et al., 2016). The ZAD-ZNF gene repertoire evolves rapidly across Drosophila species, which has been suggested to be driven by rapid alterations in heterochromatin across flies (Kasinathan et al., 2020). While it remains unclear how these proteins localize to heterochromatin, it raises the possibility that maternally deposited DNA-binding factors can recruit histonemethyltransferases for H3K9me3 deposition in flies. The localized nature of the early nucleating sites is suggestive of a targeting mechanism such as motif recognition by DNA-binding proteins. Future research in Drosophila will show whether specific sequences on TEs are targeted by maternally deposited DNA-binding proteins that act in concert with the piRNA pathway to cause site-specific H3K9me3 deposition at recently active TEs.
Early and robust silencing against highly active TEs
Early nucleating TEs are under robust silencing; they appear sufficiently silenced during oogenesis with the lowest maternal transcript abundance, and their expression remains significantly lower than the remaining TEs as zygotic transcription ramps up. They are also disproportionately associated with high piRNA abundance and early zygotic transcription. What, then, sets these TEs apart and why are they more robustly silenced compared to others? Interestingly, we find that these TE are significantly more abundant with higher copy numbers and insertions across the genome. Elevated copy number on the neo-Y chromosome further indicates that these TEs had high transposition activity within the past 1.5 million years since the formation of the neo-Y. Altogether, these results suggest that the early nucleating TEs have high transposition potential and strong genomic silencing in the form of piRNA defense and targeted nucleation may have evolved to maintain genome integrity. Indeed, many components of the piRNA machinery and heterochromatin/TE regulating proteins are rapidly evolving (Blumenstiel et al., 2016).
In the ongoing arms race between proliferation of selfish repeats and genome defense, early expression during zygotic genome activation can be beneficial for TEs to exploit immature heterochromatin (Wei et al., 2020). However, targeted early H3K9me3 nucleation may provide a strategy of counter-defense that complements piRNA-mediated transcriptional and post-transcriptional silencing.
Materials and methods
Embryo collection and staging
Request a detailed protocolD. miranda adults were allowed to lay for 1 hr in an embryo collection cage at 18°C to pre-clear any old embryos that females may be holding. After pre-clearing, the embryos were aged to their appropriate developmental stage. Embryos were then dechorionated with 50% bleach solution for 1 min and identified according to its morphological features under a light microscope. Embryo developmental time/stage: stage 3 (210 min, polar buds at the posterior pole of the embryo), early stage 4 (240 min, thin ‘halo’ appears as the syncytial blastoderm forms), late stage 4 (270 min, thicker ‘halo’ compared with early stage 4 and no formation of cell membranes), stage 5 (300 min, visible cell membranes as cellularization progresses), stage 7 (420 min, cephalic furrow).
Single embryo chromatin immunoprecipitation and library preparation with spike-in
Request a detailed protocolThe H3K9me3 ULI-nChIP preparation and pull down were done according to a modified version of Brind'Amour et al., 2015. In short, D. miranda embryos single embryos were homogenized into a cell suspension using a 200 µl pipette tip in 20 µl of Nuclei EZ lysis buffer (Sigma-Aldrich, Cat. No. N3408). To fragment the chromatin, 2 U/µl of MNase to were added into each nuclei preparations for 7.5 min at 21°C; reaction was terminated by adding 11 µl of 0.1M EDTA. Simultaneously, D. melanogaster stage 7 embryos were prepared the same way, and 5 µl was added into each D. miranda samples for spike-in. Then the digested nuclei preps were diluted to 400 µl with ChIP buffer (20 mM Tris–HCl pH 8.0, 2 mM EDTA, 150 mM NaCl, 0.1% Triton X-100, 1× Protease inhibitor cocktail) and split into a 40 µl aliquat and 360 µl aliquat for input and ChIP, respectively. Prior to the ChIP pull down, antibody against H3K9me3, (Diagenode, Cat No. C15410056), H4 (Abcam ab1791), H3K4me1 (Diagenode, Cat. No. C15410194), H4K16ac (Millipore, Cat. No. 07–329) were incubated with Dynabeads (ThermoFisher, Cat No. 10002D) for 3 hr to make the antibody-bead complex, followed by overnight incubation with the chromatin preparations. DNA from ChIP and input samples were isolated with Phenol-chloroform using MaXtract High Density tubes (Qiagen, Cat. No. 129046) to maximize sample retrieval, followed by ethanol precipitation and resuspension in 30 µl of nuclease-free water. The resulting DNA extractions were further purified to remove excess salt using Ampure XP beads at 1.8:1 beads-to-sample ratio (54 µl) and eluted in 10 µl of nuclease-free water. Library preparations were done using the SMARTer Thruplex DNA-seq kit from Takara (cat no. R400674). Library concentration was determined using Qubit (Thermofisher), and the library quality was determined using the Bioanalyzer by the Functional Genomics Lab at UC Berkeley.
ChIP sequencing and data processing
Request a detailed protocolAll libraries were (100 bp) paired-end sequenced with the Hi-Seq 4000 at the Vincent J. Coates Genomics Sequencing Lab at UC Berkeley. To differentiate between spike-in and sample from each ChIP-seq library, raw paired-end reads are aligned to a reference file that contains both the D. miranda genome (r2.1) and the D. melanogaster genome (r6.12) using bwa mem (Li and Durbin, 2009) on default settings. Since bwa mem, by default, only reports the highest quality alignment, each read will align to one of the two genomes only once. When there are more than one alignment of equal mapping quality, the read will be randomly assigned to one of the targets. Using a custom Perl script, reads are then differentiated based on which of the two genomes they align to, and ambiguous alignments are discarded. For read mapping statistics, see Supplementary file 1. Reads are then sorted using samtools (Li et al., 2009; Li and Durbin, 2009), and the coverage per site is determined with bedtools genomecoverge (Quinlan and Hall, 2010) (-d -ibam options).
Sex of embryos were inferred from the ratio of the median autosomal coverage: median × coverage of the inputs (Supplementary file 1). Median coverages were inferred from distribution of average coverages in 1 kb sliding windows.
Sample and enrichment normalization
Request a detailed protocolFor normalization without spike-in, we first took the average coverage of the ChIP and input samples in 1 kb windows and then determined the median of all the autosomal windows to obtain the median autosomal coverage. The per-site coverages in the ChIP and input samples were then divided by their respective median autosomal coverage, thus normalizing for library size. The per-site enrichment is then estimated as:
Enrichment = (ChIP/ChIP median + 0.01) / (input/input median + 0.01), with 0.01 being a small pseudo-count.
For normalization with spike-in, we first generated a reference spike-in enrichment profile by using the same procedure as above for all spike-in ChIPs and spike-in inputs in 1 kb windows, and then took the average log2 enrichment across all spike-ins, generating a reference. This reference is meant to be a standard to which all other spike-ins will be normalized, and the extent of normalization in the spike-ins will be applied to the actual samples. To do so, we used a method akin to quantile normalization, whereby the distribution of the spike-in sample is matched with that of the reference. However, instead of matching the distributions identically as with typical quantile normalization, we binned the enrichment values into quantiles of 0.1, allowing us to match the quantiles by bins. For example, if the 98.1th quantile has a log2 enrichment of 3.2 and 4.0 in the spike-in sample and reference, respectively, all points of the spike-in within the quantile will be increased by 0.8. Since the spike-in and the actual sample should have the same pull-down efficiency, this then allows us to determine the extent of normalization to apply to each log2 enrichment in the actual latter; for example, points with log2 enrichment of 3.2 will similarly be elevated by 0.8 in the sample.
ChIP-seq peak calling
Request a detailed protocolWe used macs2 (Zhang et al., 2008) to call H3K9me3 enrichment peaks. For each stage containing multiple replicates, we called peaks using sorted bam files with the spike-in reads removed, where the spike-in reads are removed with the command below: macs2 callpeak -t replicate1.chip.sort.bam replicate2.chip.sort.bam... -c replicate1.input.sort.bam replicate2.input.sort.bam... -n output_name -g 1.8e8 --call-summits.
For peak calling in individual replicates, only the chip and corresponding input bam files are used for the -t and -c parameters. Peaks in different replicates that are less than 100 bp away from each other are deemed the same.
Enrichment analysis around peaks
Request a detailed protocolFor each developmental stage, we averaged the H3K9me3 enrichment per site (or bin) across the replicates to generate a representative enrichment. To determine the developmental progression of enrichment around peaks, we averaged the representative enrichment at 100 bp upstream and downstream of the summit of the peak (reported by macs2) for each stage. Regions are deemed enriched if log2(enrichment) > 0.5. Enrichment on the neo-Y is averaged from only male embryos. For the enrichment heatmaps, we took the per-base enrichment 1000 bp upstream and downstream of the summits and sorted the peaks from highest enrichment to lowest enrichment. We then plotted each base as a dot using colors that scale with the enrichment with a custom R script. Colors are generated using the R package RColorBrewer. Heatmaps around peaks of ATAC-seq, RNA-seq, and DNA-seq are also generating using this method.
Repeat annotations, contents, and overlap with peaks
Request a detailed protocolWe used Repeatmasker (Smith et al., 2021) with a TE index specific to the obscura group (the Drosophila lineage to which D. miranda belongs) from Hill and Betancourt, 2018. Simple repeats were identified using the simple repeat setting in Repeatmasker, which lists them and can be identified in the annotation file (.gff) as (motif)n where the ‘motif’ is the repeating unit (e.g. (AGAT)n). To determine the %repeat content, we used the repeat masker annotation and determined the number of bases annotated by either a TE or a simple repeat in nonoverlapping sliding windows. To determine overlap between annotated repeats and H3K9me3 peaks, we used bedtools intersect -a annotatedrepeats.gff -b macs2.peaks -wa -wb. Distance between repeats and peaks is inferred using the R package IRange (Lawrence et al., 2013).
H3K9me3 enrichment at full length and truncated annotated TE insertions
Request a detailed protocolThe Repeatmasker annotation (gff) provides the positions of the TE insertions in the genome as well as the positions matching the TE consensus sequence; for each TE entry, these coordinates are used to create a table of enrichment values where each row is an annotated insertion in the genome and each column is a position of the consensus from the repeat index. Because the LTR and internal sequences of LTR retrotransposons are separate entries in the repeat index, we identified full-length insertions of TRAM in the genome by identifying internal sequences flanked by LTRs requiring that all three features must have the same direction (all forward/reverse) and are within 10 bp of each other. To identify 5’ and 3’ truncated insertions, we identified internal sequences where the respective LTRs are either missing or greater than 5 kb away. For statistical comparisons, we averaged the H3K9me3 enrichment across the last 1 kb of the element of each full length and truncated insert and compared the distribution of averaged enrichment between full length and 5’ insertions. The opposite was done for 3’ truncated insertions, where we averaged across the first 1 kb.
DNA-seq and RNA-seq data analysis
Request a detailed protocolSexed DNA-seq and RNA-seq data are from Mahajan et al., 2018 and Lott et al., 2014. Raw reads were aligned using bwa mem on default settings to either the D. miranda genome or the Repeat index (Hill and Betancourt, 2018) and sorted with samtools. After samtools sort, the per-base coverage is determined with bedtools genomeCoverageBed and then normalized by the number of mapped reads in the library. For copy-number-scaled TE transcript abundance, we tallied the RNA-seq and DNA-seq read count mapping to each TE entry in the repeat library; the former was normalized by the median read count at autosomal genes and the latter normalized by the median autosomal coverage. Mapping statistics for the RNA-seq samples can be found in supplementary file 2. For TE expression scaled by copy number, RNA-seq read counts were then divided by the DNA-seq read counts for each TE.
Embryo collection for piRNA sequencing and piRNA isolation
Request a detailed protocolFlies were allowed to lay on molasses plates with yeast paste for 1 hr, and embryos were immediately flash frozen in liquid nitrogen and stored at −80°C. We used Trizol (Invitrogen) and GlycoBlue (Invitrogen) to extract and isolate total RNA. piRNA is isolated using NaIO4 reaction and beta elimination with a protocol modified from (Kirino and Mourelatos 2007; Ohara et al. 2007; Cao et al. 2009; Simon et al. 2011; Abe et al. 2014; Gebert et al. 2015). We started with 20 µg total RNA in 13.5 µl water and added 4 µl 5× borate buffer (148 mM borax, 148 mM boric acid, pH 8.6) and 2.5 µl freshly dissolved 200 mM sodium periodate. After 10 min of incubation at room temperature, the reaction is quenched with 2 µl gylcerol for an additional 10 min. We poked holes in the tops of the tubes with sterile needles, then vacuum dried the reaction for 1 hr. We then added 50 µl 1× borax buffer (30 mM borax, 40 mM boric acid, 50 mM NaOH, pH 9.5, and 200 mM sodium periodate) and incubated the samples for 90 min at 45°C. For RNA precipiration, we added 1.33 µl GlycoBlue (Invitrogen) and 200 µl ice cold 100% EtOH and place the samples in −80°C overnight. We centrifuged down the samples at 4°C, maximum speed, for 15 min, removed the supernatant, and let the RNA pellet dry, and resuspended the RNA in 20 µl H2O.
Twenty microliters of RNA prepared as described above was resolved on a 15% TBE-urea gel (Invitrogen). Custom 18-nt and 30-nt ladders were used to size select 19–29 nt long RNA, which was purified and used as input for library preparation using the Illumina TruSeq Small RNA Library Preparation Kit to ligate adapters, reverse transcribe and amplify libraries, and purify the cDNA constructs. The protocol included an additional size selection step after library preparation on a 6% TBE gel (Invitrogen). Fifty base-pair single-end sequencing of our samples was performed on an Illumina HiSeq 4000 at the Vincent J. Coates Genomic Sequencing Laboratory at UC Berkeley.
piRNA-seq data analysis
Request a detailed protocolAdapters were trimmed from the reads using trim_galore (http://www.bioinformatics.babraham.ac.uk/projects/trim_galore/). We mapped the reads to the D. miranda genome and the repeat index using the small RNA-specific aligner ShortStack (v3.8.5) (Johnson et al., 2016) with settings --bowtie_m all --ranmax none --nohp. Using samtools view and awk, we then extracted reads that are 23–29 bp in length. For mapping to the repeat index, we further used samtools view to separate forward and reverse mapping reads with the –F 16 and –f 16, respectively. We then used bedtools genomeCoverage to obtain piRNA coverage at each position in the genome or repeat index. piRNA reads mapping statistics can be found in Supplementary file 3. To determine the amount of piRNAs mapping to 5 kb windows across the genome, we used bedtools coverage. Overlap (and lack of) between the resulting bed files and peaks are then determined using bedtools intersect. RPM is calculated as the number of reads mapping to window/position divided by million of 23–29 bp piRNA reads mapped.
ATAC-seq sample preparation
Request a detailed protocolSingle-staged embryos were collected as above. ATAC-seq preparation was done according to a modified protocol of Buenrostro et al., 2015. Embryos were homogenized into a cell suspension using a 200 µl pipette tip in 20 µl of Nuclei EZ lysis buffer (Sigma-Aldrich, Catalog No. N3408). The supernatant was removed after centrifugation at 4°C. The nuclei were the resuspended in the transposition buffer (2× reaction buffer, Illumina Cat #FC-121–1030, Nextera Tn5 Transposase, Illumina Cat #FC-121–1030) and PCR amplified (KAPA HiFi HotStart ReadyMix, cat# KK2600) for 12 cycles. PCR products were cleaned up with AMPure XP beads (cat# A63881) at 1:1 concentration. Samples were sequenced with the Novaseq 6000 S1 with 100 bp pair-end reads at the Vincent J. Coates Genomic Sequencing Lab at UC Berkeley.
ATAC-seq data analysis
Request a detailed protocolPair-end reads are adapter trimmed with trimgalore and aligned to the reference genome with bwa mem on default settings. After sorting with samtools, we used bedtools genomeCoverageBed with the -pc flag for fragment count instead of read count, generating the per base fragment coverage. The fragment coverage for each sample is then normalized by the median autosomal coverage (Supplementary file 4). The sex of the embryos is then determined based on the coverage on the sex chromosomes; i.e., males will have ~0.5× coverage on the X and Y chromosomes. Since our analyses focused on repetitive heterochromatin where read coverage deviates highly due to copy number differences, we controlled for copy number by dividing the ATAC-seq fragment counts by fragment counts of sex-matched DNA-seq samples, generating ATAC enrichment. This also simultaneously controls for the coverage differences of sex chromosomes between males and females.
Data availability
Request a detailed protocolAll ChIP-seq and ATAC-seq data generated have been deposited on SRA under BioProject PRJNA601450. Intermediate files, including ChIP enrichment files and peak calls, are uploaded on Dryad. R and perl scripts for spike in normalization, generating enrichment around peaks, and enrichment heatmaps are available on KW’s github page (https://github.com/weikevinhc/heterochromatin.git, swh:1:rev:8a5f9761033beeccda8d6ed600cc67e45400c6f2); Wei, 2021.
Data availability
All ChIP-seq and ATAC-seq data generated have been deposited on Genebank under BioProject PRJNA601450. Intermediate files, including ChIP enrichment files and peak calls, are uploaded on Dryad. R and perl scripts for spike in normalization, generating enrichment around peaks, and enrichment heatmaps are available on KW's github page (https://github.com/weikevinhc/heterochromatin.git (copy archived at https://archive.softwareheritage.org/swh:1:rev:8a5f9761033beeccda8d6ed600cc67e45400c6f2)).
-
NCBI BioProjectID PRJNA601450. Restricted nucleation and piRNA-mediated establishment of H3K9me3-dependent heterochromatin during embryogenesis in Drosophila miranda.
-
DryadData from: Establishment of H3K9me3-dependent heterochromatin during embryogenesis in Drosophila miranda.https://doi.org/10.6078/D1TH7J
-
NCBI BioProjectID PRJNA232085. Sex-specific embryonic gene expression in species with newly evolved sex chromosomes.
References
-
Ten principles of heterochromatin formation and functionNature Reviews Molecular Cell Biology 19:229–244.https://doi.org/10.1038/nrm.2017.119
-
The nascent RNA binding complex SFiNX licenses piRNA-guided heterochromatin formationNature Structural & Molecular Biology 26:720–731.https://doi.org/10.1038/s41594-019-0270-6
-
What drives positive selection in the Drosophila piRNA machinery? the genomic autoimmunity hypothesisThe Yale Journal of Biology and Medicine 89:499–512.
-
Atac‐seq: a method for assaying chromatin accessibility genome‐wideCurrent Protocols in Molecular Biology 109:21.29.1.https://doi.org/10.1002/0471142727.mb2129s109
-
piRNA-Guided genome defense: from biogenesis to silencingAnnual Review of Genetics 52:131–157.https://doi.org/10.1146/annurev-genet-120417-031441
-
Position-effect variegation, heterochromatin formation, and gene silencing in DrosophilaCold Spring Harbor Perspectives in Biology 5:a017780.https://doi.org/10.1101/cshperspect.a017780
-
Chromatin signatures and retrotransposon profiling in mouse embryos reveal regulation of LINE-1 by RNANature Structural & Molecular Biology 20:332–338.https://doi.org/10.1038/nsmb.2495
-
RNA-mediated epigenetic regulation of gene expressionNature Reviews Genetics 16:71–84.https://doi.org/10.1038/nrg3863
-
Early embryonic-like cells are induced by downregulating replication-dependent chromatin assemblyNature Structural & Molecular Biology 22:662–671.https://doi.org/10.1038/nsmb.3066
-
Active promoters give rise to false positive 'Phantom Peaks' in ChIP-seq experimentsNucleic Acids Research 43:6959–6968.https://doi.org/10.1093/nar/gkv637
-
Improved placement of Multi-mapping small RNAsG3: Genes, Genomes, Genetics 6:2103–2111.https://doi.org/10.1534/g3.116.030452
-
Impact of nuclear piwi elimination on chromatin state in Drosophila melanogaster ovariesNucleic Acids Research 42:6208–6218.https://doi.org/10.1093/nar/gku268
-
Software for computing and annotating genomic rangesPLOS Computational Biology 9:e1003118.https://doi.org/10.1371/journal.pcbi.1003118
-
The sequence alignment/Map format and SAMtoolsBioinformatics 25:2078–2079.https://doi.org/10.1093/bioinformatics/btp352
-
Developmental regulation of heterochromatin-mediated gene silencing in DrosophilaDevelopment 125:2223–2234.
-
Small RNA in the nucleus: the RNA-chromatin ping-pongCurrent Opinion in Genetics & Development 22:164–171.https://doi.org/10.1016/j.gde.2012.01.002
-
PIWI-interacting RNAs: small RNAs with big functionsNature Reviews Genetics 20:89–108.https://doi.org/10.1038/s41576-018-0073-3
-
Epigenetic regulation of heterochromatic DNA stabilityCurrent Opinion in Genetics & Development 18:204–211.https://doi.org/10.1016/j.gde.2008.01.021
-
Repetitive centromeric satellite RNA is essential for kinetochore formation and cell divisionJournal of Cell Biology 207:335–349.https://doi.org/10.1083/jcb.201404097
-
Mechanisms regulating zygotic genome activationNature Reviews Genetics 20:221–234.https://doi.org/10.1038/s41576-018-0087-x
-
The enigma of Y chromosome degeneration: tram, a novel retrotransposon is preferentially located on the Neo-Y chromosome of Drosophila mirandaGenetics 145:261–266.
-
Constitutive heterochromatin in early embryogenesis of Drosophila melanogasterMolecular and General Genetics MGG 229:316–318.https://doi.org/10.1007/BF00272172
-
Variable rates of simple satellite gains across the Drosophila phylogenyMolecular Biology and Evolution 35:925–941.https://doi.org/10.1093/molbev/msy005
-
Model-based analysis of ChIP-Seq (MACS)Genome Biology 9:R137.https://doi.org/10.1186/gb-2008-9-9-r137
Decision letter
-
Irene E ChioloReviewing Editor; University of Southern California, United States
-
Jessica K TylerSenior Editor; Weill Cornell Medicine, United States
In the interests of transparency, eLife publishes the most substantive revision requests and the accompanying author responses.
Acceptance summary:
In this study, the authors characterize H3K9me3 establishment during embryonic development in D. miranda. They identify a subset of H3K9me3 peaks, frequently proximal to transposon-targeted by piRNAs, that progressively broaden into stable heterochromatin at Stage 7 of development. Thus, they propose that early peaks of H3K9me3 represent nucleation sites for stable heterochromatin domains, and that piRNA-associated co-transcriptional silencing is involved in their establishment. They also identify a small number of active retrotransposon families corresponding to the earliest nucleation sites. An additional value of this study is the provided collection of H3K9me3 profiles in narrow developmental stages of D. miranda.
Decision letter after peer review:
Thank you for submitting your article "Sparse nucleation and piRNA-mediated establishment of H3K9me3-dependent heterochromatin during Drosophila development" for consideration by eLife. Your article has been reviewed by 3 peer reviewers, and the evaluation has been overseen by a Reviewing Editor and Jessica Tyler as the Senior Editor. The reviewers have opted to remain anonymous.
The reviewers have discussed the reviews with one another and the Reviewing Editor has drafted this decision to help you prepare a revised submission.
As the editors have judged that your manuscript is of interest, but as described below that additional experiments are required before it is published, we would like to draw your attention to changes in our revision policy that we have made in response to COVID-19 (https://elifesciences.org/articles/57162). First, because many researchers have temporarily lost access to the labs, we will give authors as much time as they need to submit revised manuscripts. We are also offering, if you choose, to post the manuscript to bioRxiv (if it is not already there) along with this decision letter and a formal designation that the manuscript is 'in revision at eLife'. Please let us know if you would like to pursue this option. (If your work is more suitable for medRxiv, you will need to post the preprint yourself, as the mechanisms for us to do so are still in development.)
Summary:
In this study, the authors characterize H3K9me3 establishment during embryonic development in D. miranda. The authors find that at Stage 3 there are multiple, frequently stochastic, H3K9me3 peaks. A subset of these sites, frequently proximal to transposon-targeted by piRNAs, are characterized by stable heterochromatin at Stage 7 of development. Thus, they propose that early peaks of H3K9me3 represent nucleation sites for stable heterochromatin domains, and that piRNAs are involved in their establishment.
The reviewers recognize the value of these studies particularly with respect to providing a collection of H3K9me3 profiles in narrow developmental stages. However, they also points to major issues that question the validity of the conclusions and need to be addressed for publication in eLife.
Essential revisions:
1) All reviewers are concerned that 'stage 3' peaks might be 'phantom peaks'. These typically appear near open regions such as promoters and enhancers even when normalized to input. This is a well-known issue (PMID:26117547), and these peaks are particularly apparent when actual peaks are sparse (such as in stage 3 embryos). A clear demonstration that 'stage 3' peaks are not phantom peaks is essential to support the validity of the authors' claims and for publication in eLife.
Experiments suggested by the reviewers to address this point include:
– Providing ChIP-seq data from embryos without the target of interest, in this case H3K9 histone methyltransferase mutants;
– Providing parallel H3K9me3 and "mock" IPs, e.g., with IgG, to test whether these peaks are a technical artifacts.
3) A clear characterization of embryo staging for D. miranda is required. In contrast to D. melanogaster, the biology of early embryogenesis in D.miranda is not well studied and the authors should first demonstrate by immunocytology that their staging really is correct in respect to the drawings provided in Figure 1B.
4) Limiting the ChIP-seq analysis to H3K9me3 could mask the establishment of silencing. The conclusion that so-called 'temporary H3K9me3 peaks' indicate regions not establishing heterochromatin might be a misinterpretation because it is not shown whether these are only initiated by H3K9me3 but maintained in their heterochromatic state by H3K9me2 indexing. This would be resolved by investigating H3K9me2 peaks during development.
Related to this point, the authors should show also H3K9me3 staining in salivary glands of D. miranda, as the two markers might look distinct.
5) No direct evidence is provided to support the claim that piRNAs has a role in heterochromatin formation. The claim is based on the observation that 'persistent' H3K9me3 peaks are proximal to piRNA-enriched TEs, but the authors should either provide direct evidence (such as by deleting or introducing piRNA-enriched TEs into the genome near some of the stage 3 peaks and see how this affects heterochromatin formation), or significantly tone down their claims, including by removing this conclusion from the title.
6) The reviewers have additional concerns about data analysis/interpretation, most of which can potentially be addressed by text changes or additional data analyses. Specifically:
a. Figure 5B: The spreading of H3K9me3 appears to follow a different pattern in different replicates. In repl. 7-8, the sharp H3K9me3 peaks remain sharp at stage7. This suggests that heterochromatin spreading does not take place around these peaks. On the contrary, repl 1-2 show that almost half of the less robust H3K9me3 peaks expand into their surrounding regions at stage7. The authors should try to explain why heterochromatin spreading is observed only in a few replicates and how do they reconcile their model with the observation that sharp peaks appear to result in less spreading. This would also influence the interpretations of Figure 6 D and Sup. 7.
b. The authors showed the patterns of stage3 H3K9me3 peaks vary depending on replicates. Does this epigenetic variegation during stage3 affect the final landscape of H3K9me3 after heterochromatin formation is completed? Although the stage3 H3K9me3 peaks are not identical between replicates, all the replicates may share the regions where the peaks are observed; in that case heterochromatin formation takes place at similar regions, which would result in very similar H3K9me3 patterns at stage7. Did the author compare the patterns of H3K9me3 at stage7 between replicates-are they identical, or different?
c. What is happening to the peaks and the surrounding regions where signals are invisible (the lower parts of each panel) in Fig6 F and G? Are the signals completely absent, or do they have weak signals with a similar tendency as observed at the peaks of the upper parts? If former is the case, how do the authors apply their model to those peaks?
d. The spike-in normalization is potentially problematic. From methods: "when there is more than one alignment of equal mapping quality, the read will be randomly assigned to one of the targets" – wouldn't this cause reads derived from real H3K9me3 peaks from D. melanogaster to get assigned to identical sequences of D. miranda due to the randomization? Are the results (especially for stage 3 peaks) reproducible without spike-ins? Will the results hold if all reads mapping to D. melanogaster are discarded prior to mapping to D. miranda?
Another reviewer notes that additional caveats might arise from using D. melanogaster embryos for spike-in normalization. In D. melanogaster, heterochromatin formation by H3K9me2 and H3K9me3 becomes visible around cycle 9-10. In stage 7 embryos gastrulation is already progressed in D. melanogaster and spike-in normalization with these embryos might be problematic if earlier embryos of D. miranda (cycle 10-13) are compared as well as by the significant differences in repeated sequences between the two species.
e. The authors note that the early non-persistent peaks are highly variable, only appearing in a few of the libraries. Two key questions arise: could the random assignment of reads to different mapping sites cause peaks and could the number of microsatellite copies in the genome be underestimated in the assembly? Random assignment of repetitive sequences to mapping sites might result in stochastic appearance of peaks, especially if there are many repeat copies and few reads. Would these peaks continue to be strong and stochastic if reads were mapped to all sites weighted by mapping site number? The authors mention that some peaks are present with unique mapping, but don't mention whether uniquely mapping peaks are similarly or less stochastic than ones that map to multiple loci. Do the authors ever observe "apparent" depletion at any of these sites compared to input (i.e., if peaks are due to random assignment there should also be "random peaks" in the input)? How certain are the authors about the exact copy number of the microsatellites? If microsatellite copies are underestimated, then peaks could appear due to "apparent" oversampling. While the authors attempted to account for this issue using DNA-seq libraries, the combination of random assignment of reads and unmapped microsatellite sequences might lead to apparent enrichments, which could appear stronger or more wide-spread due to unidentified microsatellite copies.
f. The authors argue that "technical noise does not account for the observation that peaks are enriched for microsatellites, and only a small fraction of repeats are enriched with H3K9me3 at stage 3". However, given how widespread microsatellites are across the genome (>200,000 loci), I wonder if the overlap with the stage 3 H3K9me3 is by random chance. Would random sampling of the genome with equal number of genomic regions as the stage 3 H3K9me3 TR-associated peaks result in similar overlap with TRs? If it is not random, what is special about the occupied TRs compared to the remaining ~99% of TRs in the genome – e.g., do they have higher accessibility, transcription, specific sequence?
g. While piRNA-initiated heterochromatin spreads, it is hard to imagine how a single nucleosome (143bp or 124bp genomic length) can be targeted by a TE that is hundreds or even up to 10 kb away. Spreading from this distance would result in broad peaks (like the authors observe at later stages) and not targeting of distant specific individual nucleosomes.
h. The authors should also more carefully interpret accessibility differences using ATAC-seq because significant transitions in chromatin indexing during early embryonic development in D. melanogaster were recently demonstrated occurring before and during heterochromatin establishment. This might also occur in D. miranda and could contribute to the findings reported.
7) Several citations are missing. The reviewers are particularly concerned about:
– Missing references to studies highlighting heterochromatin establishment in D. melanogaster, including studies on the role of H3K9me2 in gene silencing and heterochromatin formation.
– Poor citation of studies on piRNA-mediated H3K9me3 establishment.
– Missing citations of the literature of D. miranda, to justify why the study was done in this organism (e.g., it might be interesting to compare the model species D. melanogaster with the evolutionary very distant species D. miranda with interesting specificities like sex chromosome evolution).
8) The fact that this study as performed in D. miranda should be better clarified, including mentioning it in the title. The authors should also clarify what is new in this study compared to what has already been resolved in D. melanogaster.
[Editors' note: further revisions were suggested prior to acceptance, as described below.]
Thank you for resubmitting your work entitled "Establishment of H3K9me3-dependent heterochromatin during embryogenesis in Drosophilamiranda" for further consideration by eLife. Your revised article has been evaluated by Jessica Tyler (Senior Editor) and a Reviewing Editor.
Both reviewers agree that the study is interesting and conducted with rigor, supporting its publication. The manuscript has been improved but there are some remaining issues that need to be addressed. No additional experiments are required, but some data reanalysis might be needed. The reviewers also raise significant concerns about data presentation and interpretation, and about missing or incorrect citations, which need to be addressed before publication. Please carefully address the points raised by the reviewers in a revised version of the manuscript, with a specific attention to the comments highlighted here.
Both reviewers have issues with the authors' claims about the role of piRNAs in heterochromatin nucleation. Specifically, the concern refers to the claim that on one hand piRNAs are important for nucleation, but on the other hand piRNAs do not map at sites where the nucleations occur. The reviewers also offer somewhat different interpretation of the presented data, suggesting that he point the authors would like to make is not clear. I am copying here the comments on this point, which require significant revision of the main text, a clearer model/conclusion, and editing of the abstract.
Reviewer 2: Based on the fact that piRNA mappings along the TEs show no correlation with nucleation sites the authors speculate that some other mechanism might be responsible for nucleation (transcription itself or Zn-finger proteins) and piRNAs induce spreading. While this can certainly not be excluded, I am not sure where the expectation that a complex that binds nascent transcript would induce changes on the DNA at the same sequence as where it associates with the RNA comes from. In fact that seems relatively unlikely to me. Instead, I would think that recruitment of the complex on nascent transcript will induce nucleation in the proximity and that other factors (e.g., location of txn initiation or binding of other chromatin factors) determine where chromatin modification nucleates. Antisense piRNAs are mostly derived from piRNA clusters, which contain fragments of TEs, often lacking intact promoters (keeping all the TE promoters would increase transcriptional interference within the cluster). Thus, if nucleation occurs at promoters (as the authors observe for several TEs), piRNAs might predominantly not be able to target this region as clusters might be deprived of TSSs.
Reviewer 4: The correlation between piRNAs and H3K9me3 peaks seems marginal if at all. The last sentence of the abstract, while most likely true, seems a gross over-interpretation of the results. While I can well imagine how small RNA at one stage guide H3K9me3 at a later stage, the absence of correlation with H3K9me3 peaks make this scenario a long stretch. Therefore, the reasoning in the manuscript becomes pretty confusing. That maternally deposited piRNAs may be instrumental in suppressing this group of TEs is interesting and well possible but hard to conclude from the presented data.
On the piRNA data presentation: I don't see the value in showing correlation lines and r-values in figures 6D, E, F, 4H when there is no correlation visible. 3H, S9 (x-axis = kb from peak?) make the reader wonder how piRNA distribution look like further (than 2kb) away from the peak of H3K9me3. Is there any accumulation around peaks? Perhaps piRNA accumulation and distribution could be better grasped in browser shots like S5 and S7 with an additional piRNA track?
What is the y-axis unit in Figure 5D, G, J? For small RNAs, it is common to calculate normalized read counts in RPM (reads per total mio mapped). However, 5000RPM would be a lot?! (10,000RPM = 1% of the library) Readers need to be able to judge expression strength and depth.
Figure 6 is confusing: while it looks like lots of piRNAs map to stage 3 TEs in panel A and B, panel D (and E) shows no correlation whatsoever. Maybe it could be pointed out more clearly that A+B are about distinct TEs, while D+E are about H3K9me3 position within an element? I took the conclusion that piRNAs "mark" stage 3 high copy number TEs from panel F.
On the other hand, the authors speculate that specificity for nucleation might be provided by the act of transcription of TEs (line 396-98), which from an evolutionary arms race perspective I really don't like, as TEs like to evade repression and thus would likely change their expression profile to later stages if very early transcription initiation is the cause of more robust silencing.
Additional comments that need careful consideration, text rewriting, and potentially some re-analyses:
1) I am a little confused by the logic of how transcription is responsible for K9me3 peak initiation when the authors describe that both for stage 3 and stage 4 nucleating peaks the transcript level increases later, at stage 4 and 4-5, respectively. To me the data suggests that nucleation induces transcription (admittedly, this is going against the assumed function of K9me3) rather than the other way around.
2) Around line 308 the authors describe that the weak fold difference in K9me3 levels between the truncated and full length copies is likely a sever underestimation because non-unique mappings are distributed evenly amongst copies. Why did the authors not look at unique mappers?
3) In Figure 7B-C it is perplexing that the H3K9me3 enrichment in the last 1kb of internal sequence of TEs is higher in the full-length, while in the first 1kb internal sequence it is higher in the truncated copies. How do the authors explain this difference?
4) The H3K9me3 patterns along TEs are intriguing and very interesting. The authors may want to group and present TEs by class, at least discuss them by class in the text. This may explain "discrepancies" between transposon families. It seems LTR-retroelements show 5'-nucleation while non-LTR elements have a 3'-bias? The findings could be further elevated by discussing patterns in other organisms, perhaps data in D. melanogaster is available? In mouse and primates, 5'-nucleation has been observed by: Rebollo, 2011 Plos Genetics; Wolf, 2015 Genes Dev; Walter, 2016 eLife; Imbeault 2017 Nature; Wolf, 2020 eLife.
In mouse and human, this nucleation is often (but perhaps not always) guided by ZFP which the authors point out are not conserved in flies. Given the similar patterns, this may still point to a highly conserved targeting mechanism for H3K9me3.
H3K9me3 induction at several LTR-retroelements in mouse have been shown to initiate at their highly conserved tRNA primer binding site and spread from there (Rebollo, 2011 Plos Genetics; Wolf, 2015 Genes Dev). It would be helpful if the authors state more precisely what they defined as a "5'-truncation". How many nucleotides were missing in these copies? Only 5'-LTRs or perhaps additional nucleotides from the 5'-UTR?
5) Much of the RNA expression data is plotted like one would plot chromatin peaks and a bit odd presentation of "no expression". In Figure S6 and 3G (upper third coordinates) there are a couple of loci that are expressed throughout stages. What are they? Are they independent of H3K9me3 and are they a specific transposon family? Genic? The obtained RNAseq data should be more accessible, which portions of the genome are expressed at the stages sampled? Perhaps some pie charts or supplemental tables of where in the genome reads map to at which stage could provide an overview of what the RNAseq actually revealed other than negative correlation with H3K9me3 at select loci.
6) Many references are missing (especially for piRNAs and k9me nucleation) as detailed in the 'recommendations for the authors' section. The authors also identify several errors or missing text in the main text and figure, as clarified in the 'Recommendations for the authors' section that follows.
Reviewer #2 (Recommendations for the authors):
The resubmitted version of the manuscript makes less profound claims than the original one. This is mostly due to the fact that many of the original peaks they found in early embryos turned out to be artifacts. Based on the current results, the main claims are that nucleation at TEs starts as early as stage 3 of embryonic development and that early nucleation is predominantly on active TEs (often at their promoters) and leads to more robust H3K9 methylation at later stages. The authors find that early nucleating TEs are highly targeted by maternal piRNAs and show early zygotic transcription consistent with the prevailing model that piRNA-induced transcriptional silencing requires transcription.
The new version of the manuscript is toned down and makes claims that are consistent with the data. The authors have addressed all the concerns except for proper references, although this mainly is due to removing a large fraction of the previous data that was fund to be a technical artifact and by toning down claims that were based on correlations. Whether these current results are still sufficiently interesting for publication in eLife is not my responsibility to decide. I do find the observation of very early nucleation, which is consistent with piRNA-mediated early establishment of K9-methylation over TEs, interesting and, although not very surprising, still worth publishing.
I have a few remaining comments, which mostly indicate some level of sloppiness and the lack of familiarity with the piRNA field as well as some disagreement with the author's interpretations of the data.
1) I am a little confused by the logic of how transcription is responsible for K9me3 peak initiation when the authors describe that both for stage 3 and stage 4 nucleating peaks the transcript level increases later, at stage 4 and 4-5, respectively. To me the data suggests that nucleation induces transcription (admittedly, this is going against the assumed function of K9me3) rather than the other way around.
2) Based on the fact that piRNA mappings along the TEs show no correlation with nucleation sites the authors speculate that some other mechanism might be responsible for nucleation (transcription itself or Zn-finger proteins) and piRNAs induce spreading. While this can certainly not be excluded, I am not sure where the expectation that a complex that binds nascent transcript would induce changes on the DNA at the same sequence as where it associates with the RNA comes from. In fact that seems relatively unlikely to me. Instead, I would think that recruitment of the complex on nascent transcript will induce nucleation in the proximity and that other factors (e.g., location of txn initiation or binding of other chromatin factors) determine where chromatin modification nucleates. Antisense piRNAs are mostly derived from piRNA clusters, which contain fragments of TEs, often lacking intact promoters (keeping all the TE promoters would increase transcriptional interference within the cluster). Thus, if nucleation occurs at promoters (as the authors observe for several TEs), piRNAs might predominantly not be able to target this region as clusters might be deprived of TSSs.
On the other hand, the authors speculate that specificity for nucleation might be provided by the act of transcription of TEs (line 396-98), which from an evolutionary arms race perspective I really don't like, as TEs like to evade repression and thus would likely change their expression profile to later stages if very early transcription initiation is the cause of more robust silencing.
3) Around line 308 the authors describe that the weak fold difference in K9me3 levels between the truncated and full-length copies is likely a sever underestimation because non-unique mappings are distributed evenly amongst copies. Why did the authors not look at unique mappers?
4) In Figure 7B-C it is perplexing that the H3K9me3 enrichment in the last 1kb of internal sequence of TEs is higher in the full-length, while in the first 1kb internal sequence it is higher in the truncated copies. How do the authors explain this difference?
5) References remain insufficient and often wrong or at least not referring to the primary/first discovery. It is very apparent that the authors have not obtained a broad knowledge of the piRNA field and/or have done a sloppy job with the references even after this was raised in the first round of review. Here are some examples:
– Line 42: While I am not sure why the authors bring phase separation into this story, if they do, they should also be aware of counter-arguments to HP1 inducing phase separation (Erdel et al., 2020. PMID: 32101700).
– Line 51-53: The authors refer to results in flies and mice but only reference a single fly paper. Shortly after (line 57), they cite 3 papers (not correctly formatted) for Piwi causing H3K9 methylation, yet one of them, Derricarrere et al., only showed that Piwi cleavage activity is needed and did not provide any analysis of its role in H3K9 methylation, while some relevant papers are missing.
– Line 59-61: The authors say that the piRNA-Piwi complex recruits heterochromatin factors, including histone methyltransferases for H3K9me3 deposition. The papers cited refer to Piwi inducing H3K9me3, without either of them showing recruitment of the HMT. On the other hand, they miss citing the paper that comes closest to showing recruitment mechanism of the HMT. In addition, they cite one of two papers describing Panx (why not the paper by Brennecke?) and one on the SFINX complex (this time only the Brennecke paper out of 4 parallel papers), the first a factor of unknown function and the 2nd an RNA binding complex. This seems like a random choice of factors (excluding Arx, the RDC complex, etc.) and a random choice of references for those.
6) Figures and figure legends:
– Figure legend 5: panel "C" is missing.
– Color scheme in Figure 4H is missing?
– Figure 7B-D it would help if the panels would indicate what the difference is so one does not have to look in the figure legend.
– For suppl. figure 5 and 7Y axis label is missing. Are these different stages?
– For suppl. figure 11 the colors are not indicated (for the different stages, so one hast to look at the main figures to know what stage is which color). Also, the "position of called peaks" indicated at the top of panels would need to be mentioned in the figure legends in all figures.
Just a suggestion: While the figures are very nice in color (and consistent throughout the manuscript), the color choices are making it essentially impossible to look at the data on a black and white printout. While this is by itself not a huge issue, I generally prefer plots that do not depend on color printouts. E.g., in Figure 3E-F the two colors look identical in BandW and, accordingly, it is impossible to determine what the lower and upper half of the chromosome arm markings are in 3F. If the colors are left the same, it would help to better describe this in the figure legends. Numerous other examples of colors being hard to evaluate in BandW are found, that I do not list.
Reviewer #4 (Recommendations for the authors):
Summary:
Wei et al., determined genome-wide repressive histone H3 lysine K9 trimethylation (H3K9me3) marks during precisely timed developmental stages in Drosophila miranda embryos. Heterochromatin formation by H3K9me3 was profiled starting 3.5 hours post fertilization (9 cell divisions, "stage 3") up to gastrulation (14 cell divisions, "stage 7"). While a proportion of stage 3 were transient, early stage 4 H3K9me3 peaks seem to nucleate and correlate very well with repressive chromatin spreading in later stages.
The authors profile RNA expression at several stages as well as maternally deposited small RNAs right after fertilization ("stage 1"). The RNA expression data confirms silencing of loci that nucleate heterochromatin formation at stage 4. Wei et al. find abundant PIWI-interacting RNAs (piRNAs) that target transposon sequences and examine their potential to guide H3K9me3 deposition as previously observed in Drosphila melanogaster and other organisms. Transposons that have repressive H3K9me3 marks at stage 3 are piRNA targets, suggesting maternally deposited piRNAs may guide this early heterochromatin induction. However, piRNA target sites do not correlate with H3K9me3 positions at these loci, making the link between stage 1 piRNAs and transcriptional silencing at stage 3 rather speculative.
The detailed H3K9me3 data in D. miranda reveals interesting patterns of heterochromatin establishment over transposable elements (TEs). Several LTR-retrotransposons exhibit nucleation at their 5'-end, while other non-LTR elements show early enrichment at their 3'-ends. This is similar and interesting when compared to 5'-nucleation patterns of H3K9me3 during epigenetic reprogramming at TEs in mammals.
1) The H3K9me3 patterns along TEs are intriguing and very interesting. The authors may want to group and present TEs by class, at least discuss them by class in the text. This may explain "discrepancies" between transposon families. It seems LTR-retroelements show 5'-nucleation while non-LTR elements have a 3'-bias? The findings could be further elevated by discussing patterns in other organisms, perhaps data in D. melanogaster is available? In mouse and primates, 5'-nucleation has been observed by: Rebollo, 2011 Plos Genetics; Wolf, 2015 Genes Dev; Walter, 2016 eLife; Imbeault, 2017 Nature; Wolf, 2020 eLife.
In mouse and human, this nucleation is often (but perhaps not always) guided by ZFP which the authors point out are not conserved in flies. Given the similar patterns, this may still point to a highly conserved targeting mechanism for H3K9me3.
H3K9me3 induction at several LTR-retroelements in mouse have been shown to initiate at their highly conserved tRNA primer binding site and spread from there (Rebollo, 2011 Plos Genetics; Wolf, 2015 Genes Dev). It would be helpful if the authors state more precisely what they defined as a "5'-truncation". How many nucleotides were missing in these copies? Only 5'-LTRs or perhaps additional nucleotides from the 5'-UTR?
2) The correlation between piRNAs and H3K9me3 peaks seems marginal if at all. The last sentence of the abstract, while most likely true, seems a gross over-interpretation of the results. While I can well imagine how small RNA at one stage guide H3K9me3 at a later stage, the absence of correlation with H3K9me3 peaks make this scenario a long stretch. Therefore, the reasoning in the manuscript becomes pretty confusing. That maternally deposited piRNAs may be instrumental in suppressing this group of TEs is interesting and well possible but hard to conclude from the presented data.
On the piRNA data presentation: I don't see the value in showing correlation lines and r-values in figures 6D, E, F, 4H when there is no correlation visible. 3H, S9 (x-axis = kb from peak?) make the reader wonder how piRNA distribution look like further (than 2kb) away from the peak of H3K9me3. Is there any accumulation around peaks? Perhaps piRNA accumulation and distribution could be better grasped in browser shots like S5 and S7 with an additional piRNA track?
What is the y-axis unit in Figure 5D, G, J? For small RNAs, it is common to calculate normalized read counts in RPM (reads per total mio mapped). However, 5000RPM would be a lot?! (10,000RPM = 1% of the library) Readers need to be able to judge expression strength and depth.
Figure 6 is confusing: while it looks like lots of piRNAs map to stage 3 TEs in panel A and B, panel D (and E) shows no correlation whatsoever. Maybe it could be pointed out more clearly that A+B are about distinct TEs, while D+E are about H3K9me3 position within an element? I took the conclusion that piRNAs "mark" stage 3 high copy number TEs from panel F.
3) Much of the RNA expression data is plotted like one would plot chromatin peaks and a bit odd presentation of "no expression". In Figure S6 and 3G (upper third coordinates) there are a couple of loci that are expressed throughout stages. What are they? Are they independent of H3K9me3 and are they a specific transposon family? Genic? The obtained RNAseq data should be more accessible, which portions of the genome are expressed at the stages sampled? Perhaps some pie charts or supplemental tables of where in the genome reads map to at which stage could provide an overview of what the RNAseq actually revealed other than negative correlation with H3K9me3 at select loci.
4) The piRNA references are outdated and additional references would make the authors point only stronger.
– Line 53 and 256 (and others): There are excellent reviews on transcriptional silencing through the piRNA pathway that are much more recent than 2009, e.g. Ninova, 2019 Dev; Olovnikov, 2012 Curr Opin Genet Dev; Ozata, 2019 Nature Rev Genetics
– Line 53: Brennecke et al., 2007 was a foundational paper to characterize piRNA cluster and PIWI-mediated post-transcriptional silencing of TEs in Drosophila but does not show transcriptional silencing. Several other studies later did which would be more accurate to cite here, if the authors don't want to cite a review. E.g.:
Drosophila: Sienski et al., 2012 Cell (cited elsewhere); Le Thomas et al., 2013 Genes Dev (cited elsewhere); Huang et al., 2013 Dev Cell; Mammals: Watanabe 2011 Science; Aravin 2008 Mol Cell; Pezic, 2014 Genes Dev; C. elegans: Gu et al., 2012 Nature Genetics
– Line 345: If the point is metazoan, gametogenesis and preimplantation… add such references to Wang et al., 2018. E.g. Tang et al., 2016 Nat Rev Genet; Laue et al., 2019 Nature Comm (zebrafish); Ishiuchi et al., 2021 NSMB; Saitou et al., 2012 Dev (review)
https://doi.org/10.7554/eLife.55612.sa1Author response
Essential revisions:
1) All reviewers are concerned that 'stage 3' peaks might be 'phantom peaks'. These typically appear near open regions such as promoters and enhancers even when normalized to input. This is a well-known issue (PMID:26117547), and these peaks are particularly apparent when actual peaks are sparse (such as in stage 3 embryos). A clear demonstration that 'stage 3' peaks are not phantom peaks is essential to support the validity of the authors' claims and for publication in eLife.
Experiments suggested by the reviewers to address this point include:
- providing ChIP-seq data from embryos without the target of interest, in this case H3K9 histone methyltransferase mutants;
- providing parallel H3K9me3 and "mock" IPs, e.g., with IgG, to test whether these peaks are a technical artifacts.
We are glad this point was brought to our attention. As suggested, we performed additional ChIP analysis using different antibodies, and indeed, a substantial number of stage 3 peaks (especially temporary peaks) are indeed phantom peaks. We therefore have considerably re‐worked our current paper and re‐analyzed all of our data. Indeed, elimination of the former phantom peaks has allowed us to uncover nucleation sites in transposable elements that target initial H3K9me3 deposition, followed by spreading around those nucleation sites.
3) A clear characterization of embryo staging for D. miranda is required. In contrast to D. melanogaster, the biology of early embryogenesis in D.miranda is not well studied and the authors should first demonstrate by immunocytology that their staging really is correct in respect to the drawings provided in Figure 1B.
We have previously done careful developmental staging of D. miranda (and its sister species D. pseudoobscura) (Lott et al., PLoS Genetics 2014), which our current staging is based on. In Lott et al., our collaborators and us clearly showed that the overall developmental program is the same between D. melanogaster and D. miranda – i.e. the zygotic genome became activated at the same developmental stages as in both species. Furthermore, Kuntz and Eisen, (PLoS Genetics 2014) showed that across the Drosophila genus, embryonic development is highly stereotypical with consistent timing of developmental landmarks. These two papers are now cited to make this clear.
4) Limiting the ChIP-seq analysis to H3K9me3 could mask the establishment of silencing. The conclusion that so-called 'temporary H3K9me3 peaks' indicate regions not establishing heterochromatin might be a misinterpretation because it is not shown whether these are only initiated by H3K9me3 but maintained in their heterochromatic state by H3K9me2 indexing. This would be resolved by investigating H3K9me2 peaks during development.
Silencing could indeed be achieved by other means, including H3K9me2, and we made sure not to claim otherwise. Importantly, we no longer focus on temporary H3K9me3 peaks, and instead focus on how H3K9me3 is established during early embryogenesis. Note, we now show (supplementary figure 1) that H3K9me2 enrichment is almost identical to H3K9me3, albeit at later developmental stages (stage 5), but with much lower enrichment, as the H3K9me2 antibody is likely less sensitive for the purpose of ChIPseq.
Related to this point, the authors should show also H3K9me3 staining in salivary glands of D. miranda, as the two markers might look distinct.
We previously published salivary gland squashes of D. miranda, stained for H3K9me2 and HP1a (Zhou et al., PLoS Biol 2013; Figure 1). As expected for heterochromatin, these regions don’t polytenize and all the staining is observed in the chromocenter in females (apart from the heterochromatic island on Mulller B and E which correspond to former centromeres, and were described in previous publications; Mahajan et al., 2018 PLoS Bio, Bracewell et al., eLife 2019; these islands are also found in our H3K9me3 profiles; see Figure 2A). In males, the euchromatic parts of the neo‐Y show some structure and are interspersed by heterochromatin, but it is not possible to localize anything on these messy chromosome squashes (see Zhou et al., PLoS Biol 2013; or Bachtrog, MBE, 2003, Figure 4 for an attempt to map TEs on the neoY). As mentioned, we have also done H3K9me2 ChIP‐seq at embryonic stage 5, which shows highly similar enrichment pattern to H3K9me3 (supplementary figure 1).
5) No direct evidence is provided to support the claim that piRNAs has a role in heterochromatin formation. The claim is based on the observation that 'persistent' H3K9me3 peaks are proximal to piRNA-enriched TEs, but the authors should either provide direct evidence (such as by deleting or introducing piRNA-enriched TEs into the genome near some of the stage 3 peaks and see how this affects heterochromatin formation), or significantly tone down their claims, including by removing this conclusion from the title.
We tone down our claims, and also changed the title. Please note that D. miranda is a non‐model species, and it is currently not possible to do any of these experiments. We have extended our analyses of piRNA (sense and antisense piRNA) mapping to TEs and expression analysis, and show that early nucleating TEs are highly targeted by maternal piRNAs and show early zygotic transcription, consistent with a model of co‐transcriptional silencing of TEs by small RNAs.
6) The reviewers have additional concerns about data analysis/interpretation, most of which can potentially be addressed by text changes or additional data analyses. Specifically:
a. Figure 5B: The spreading of H3K9me3 appears to follow a different pattern in different replicates. In repl. 7-8, the sharp H3K9me3 peaks remain sharp at stage7. This suggests that heterochromatin spreading does not take place around these peaks. On the contrary, repl 1-2 show that almost half of the less robust H3K9me3 peaks expand into their surrounding regions at stage7. The authors should try to explain why heterochromatin spreading is observed only in a few replicates and how do they reconcile their model with the observation that sharp peaks appear to result in less spreading. This would also influence the interpretations of Figure 6 D and Sup. 7.
We have removed this figure and the corresponding analyses, and we no longer draw conclusions based on between replicates analyses. Also, we have de‐emphasized the difference between persistent and temporary peaks.
b. The authors showed the patterns of stage3 H3K9me3 peaks vary depending on replicates. Does this epigenetic variegation during stage3 affect the final landscape of H3K9me3 after heterochromatin formation is completed? Although the stage3 H3K9me3 peaks are not identical between replicates, all the replicates may share the regions where the peaks are observed; in that case heterochromatin formation takes place at similar regions, which would result in very similar H3K9me3 patterns at stage7. Did the author compare the patterns of H3K9me3 at stage7 between replicates-are they identical, or different?
See previous reply.
c. What is happening to the peaks and the surrounding regions where signals are invisible (the lower parts of each panel) in Fig6 F and G? Are the signals completely absent, or do they have weak signals with a similar tendency as observed at the peaks of the upper parts? If former is the case, how do the authors apply their model to those peaks?
These plots/analyses are no longer employed.
d. The spike-in normalization is potentially problematic. From methods: "when there is more than one alignment of equal mapping quality, the read will be randomly assigned to one of the targets" – wouldn't this cause reads derived from real H3K9me3 peaks from D. melanogaster to get assigned to identical sequences of D. miranda due to the randomization? Are the results (especially for stage 3 peaks) reproducible without spike-ins? Will the results hold if all reads mapping to D. melanogaster are discarded prior to mapping to D. miranda?
In our mapping strategy, only regions of the genomes with 100% sequence homology will result in misassignments between the genomes. This is very rare given that the species have over 20 million years of divergence. In fact, using our strategy to map and assign a D. miranda male WGS sample, only 0.08% of reads are misassigned to the D. melanogaster genome (19,064/22,080,589 reads). Reciprocally, if we map a D. melanogaster male sample to the D. miranda genome, the incorrect assignment rate is 0.035% (14,396/40,672,211 reads). The issue with sequential mapping is that reads originating from regions with moderate homology between the species will successfully map to the other species, and we avoid this by mapping reads to a concatenated genome. Mapping the D. miranda male sample to the D. melanogster genome, we get mapping rates of 8.86% (1,957,202/22,080,589 reads), which means that these reads would be tossed regardless of the fact that they map better to the D. miranda genome. Even if we filter the reads by a very stringent mapping quality score (MAPQ >= 50), the mapping rate is 5.47% (1,208,224/22,080,589).
Another reviewer notes that additional caveats might arise from using D. melanogaster embryos for spike-in normalization. In D. melanogaster, heterochromatin formation by H3K9me2 and H3K9me3 becomes visible around cycle 9-10. In stage 7 embryos gastrulation is already progressed in D. melanogaster and spike-in normalization with these embryos might be problematic if earlier embryos of D. miranda (cycle 10-13) are compared as well as by the significant differences in repeated sequences between the two species.
In Vlassova et al., 1991, C‐banding shows differentiation of heterochromatin and euchromatin during blastoderm embryos but the nuclear cycle is not well defined. Based on Yuan and O’Farrell, (2016), H3K9me2 and H3K9me3 only becomes cytologically visible at interphase 12 and 13, respectively. Our use of a spike‐in was to ensure that the enrichment in our D. miranda samples can be compared and normalized to a standard. Using later stages where the H3K9me3 signal is robust is actually preferable because it provides more consistent signal of enrichment in the spike‐in. We are unsure as to why differing repeat content between the species would be problematic; in fact, it is beneficial when mapping ChIP‐seq reads, as it avoids problems with putative cross‐mapping between species.
e. The authors note that the early non-persistent peaks are highly variable, only appearing in a few of the libraries. Two key questions arise: could the random assignment of reads to different mapping sites cause peaks and could the number of microsatellite copies in the genome be underestimated in the assembly? Random assignment of repetitive sequences to mapping sites might result in stochastic appearance of peaks, especially if there are many repeat copies and few reads. Would these peaks continue to be strong and stochastic if reads were mapped to all sites weighted by mapping site number? The authors mention that some peaks are present with unique mapping, but don't mention whether uniquely mapping peaks are similarly or less stochastic than ones that map to multiple loci. Do the authors ever observe "apparent" depletion at any of these sites compared to input (i.e., if peaks are due to random assignment there should also be "random peaks" in the input)? How certain are the authors about the exact copy number of the microsatellites? If microsatellite copies are underestimated, then peaks could appear due to "apparent" oversampling. While the authors attempted to account for this issue using DNA-seq libraries, the combination of random assignment of reads and unmapped microsatellite sequences might lead to apparent enrichments, which could appear stronger or more wide-spread due to unidentified microsatellite copies.
This part has been removed from the manuscript (see our reply to 6a). Random assignment of reads at repetitive sequences will actually cause less stochasticity in peaks. For example, if there are two identical repetitive regions and only one region has enrichment, stochastic mapping will cause similar number of reads to be assigned to both copies causing two similar looking peaks. By necessity, repetitive sequences create a lot of reads which will therefore be more evenly assigned across copies by chance.
f. The authors argue that "technical noise does not account for the observation that peaks are enriched for microsatellites, and only a small fraction of repeats are enriched with H3K9me3 at stage 3". However, given how widespread microsatellites are across the genome (>200,000 loci), I wonder if the overlap with the stage 3 H3K9me3 is by random chance. Would random sampling of the genome with equal number of genomic regions as the stage 3 H3K9me3 TR-associated peaks result in similar overlap with TRs? If it is not random, what is special about the occupied TRs compared to the remaining ~99% of TRs in the genome – e.g., do they have higher accessibility, transcription, specific sequence?
This part has been removed from the manuscript (see our reply to 6a).
g. While piRNA-initiated heterochromatin spreads, it is hard to imagine how a single nucleosome (143bp or 124bp genomic length) can be targeted by a TE that is hundreds or even up to 10 kb away. Spreading from this distance would result in broad peaks (like the authors observe at later stages) and not targeting of distant specific individual nucleosomes.
The majority of the earliest nucleation sites at stage 3 (figure 3E) are found within TEs, and our paper now focuses on these.
h. The authors should also more carefully interpret accessibility differences using ATAC-seq because significant transitions in chromatin indexing during early embryonic development in D. melanogaster were recently demonstrated occurring before and during heterochromatin establishment. This might also occur in D. miranda and could contribute to the findings reported.
We have redone and repurposed the ATAC‐seq analyses because of these issues. We generated ATACseq from single embryos at the same developmental stages as the ChIP‐Seq. The use of single embryo here is to account for coverage differences between sex chromosomes in male and female embryos. We used the metric ATAC‐enrichment, which is number of ATAC‐seq reads divided by number of DNA‐seq reads. This accounts for the difference in read coverage of sex chromosomes and copy number in repeats. We now use ATAC‐enrichment to assess whether heterochromatic peaks and regions around it become less accessible over development.
7) Several citations are missing. The reviewers are particularly concerned about:
– Missing references to studies highlighting heterochromatin establishment in D. melanogaster, including studies on the role of H3K9me2 in gene silencing and heterochromatin formation.
– Poor citation of studies on piRNA-mediated H3K9me3 establishment.
– Missing citations of the literature of D. miranda, to justify why the study was done in this organism (e.g., it might be interesting to compare the model species D. melanogaster with the evolutionary very distant species D. miranda with interesting specificities like sex chromosome evolution).
We have included several more references throughout the paper, and especially in the introduction, to address this concern.
8) The fact that this study as performed in D. miranda should be better clarified, including mentioning it in the title. The authors should also clarify what is new in this study compared to what has already been resolved in D. melanogaster.
We have changed the title, and now expanded on the benefits of the D. miranda genome for studying repeats and heterochromatin (page 3 and 4 in the introduction).
[Editors' note: further revisions were suggested prior to acceptance, as described below.]
Both reviewers agree that the study is interesting and conducted with rigor, supporting its publication. The manuscript has been improved but there are some remaining issues that need to be addressed. No additional experiments are required, but some data reanalysis might be needed. The reviewers also raise significant concerns about data presentation and interpretation, and about missing or incorrect citations, which need to be addressed before publication. Please carefully address the points raised by the reviewers in a revised version of the manuscript, with a specific attention to the comments highlighted here.
Both reviewers have issues with the authors' claims about the role of piRNAs in heterochromatin nucleation. Specifically, the concern refers to the claim that on one hand piRNAs are important for nucleation, but on the other hand piRNAs do not map at sites where the nucleations occur. The reviewers also offer somewhat different interpretation of the presented data, suggesting that he point the authors would like to make is not clear. I am copying here the comments on this point, which require significant revision of the main text, a clearer model/conclusion, and editing of the abstract.
We agree that our wording on the role of piRNAs in heterochromatin nucleation was a bit confusing. We have reworded several sentences in the manuscript, and include new panels in Figure 3 and Figure 4, to clarify our observations and interpretations (which have been clearly spelled out by reviewer 2 as well). We find that piRNA’s are highly enriched in genomic regions containing H3K9me3 nucleation sites (Figure 3G, Figure 4H). In addition, the association between early nucleation and abundant piRNA at specific TEs (Figure 6A) as well as inferred zygotic transcription of these TEs (Figure 6C, D) is consistent with the proposed model of co‐transcriptional silencing of TEs, where PIWI/piRNA complexes bind to nascent TE transcripts and induce heterochromatin in the proximity. We de‐emphasize the fact that early H3K9me3 peaks and the positions of piRNA’s don’t overlap, since, as reviewer 2 points out as well, this may not be expected, and does not mean that piRNAs are not important in targeting heterochromatin. What we were trying to say in our manuscript is that heterochromatin nucleation happens at particular sequences on TEs (as shown in Figure 5), and this site‐specificity is not driven by piRNA. Thus, we favor a model where
PIWI/piRNAs recruit the heterochromatin machinery to nascent transcripts, and targeted nucleation at particular sequences nearby is then driven by other factors (possibly transcription initiation for TRAM TE, Figure 5, Figure 7). We are also cognizant that our results do not directly show these things, so we have toned down our wording in presenting these results in the abstract and main text.
Reviewer 2: Based on the fact that piRNA mappings along the TEs show no correlation with nucleation sites the authors speculate that some other mechanism might be responsible for nucleation (transcription itself or Zn-finger proteins) and piRNAs induce spreading. While this can certainly not be excluded, I am not sure where the expectation that a complex that binds nascent transcript would induce changes on the DNA at the same sequence as where it associates with the RNA comes from. In fact that seems relatively unlikely to me. Instead, I would think that recruitment of the complex on nascent transcript will induce nucleation in the proximity and that other factors (e.g., location of txn initiation or binding of other chromatin factors) determine where chromatin modification nucleates. Antisense piRNAs are mostly derived from piRNA clusters, which contain fragments of TEs, often lacking intact promoters (keeping all the TE promoters would increase transcriptional interference within the cluster). Thus, if nucleation occurs at promoters (as the authors observe for several TEs), piRNAs might predominantly not be able to target this region as clusters might be deprived of TSSs.
Thank you for pointing this out. We agree that it is not quite clear what the expectation should be regarding piRNA reads mapping and nucleation sites even if piRNA is the targeting mechanism to TEs. We fully agree that piRNA may direct the recruitment of HMTs to nascent transcript bringing it to the proximity of TE; nucleation at specific positions may then be signaled by other features (e.g. TSS or Znf). As mentioned above, what we were trying to say is that it is not piRNA that confer the sequence-specificity for heterochromatin formation, and we have reworded our manuscript to make this point more clear.
Reviewer 4: The correlation between piRNAs and H3K9me3 peaks seems marginal if at all. The last sentence of the abstract, while most likely true, seems a gross over-interpretation of the results. While I can well imagine how small RNA at one stage guide H3K9me3 at a later stage, the absence of correlation with H3K9me3 peaks make this scenario a long stretch. Therefore, the reasoning in the manuscript becomes pretty confusing. That maternally deposited piRNAs may be instrumental in suppressing this group of TEs is interesting and well possible but hard to conclude from the presented data.
As pointed out above, we have rephrased several statements and added new figure panels to make our point more clearly. We see several lines of evidence linking piRNA and TEs suppression: We find that genomic regions that contain early nucleating sites are enriched for piRNA’s (Figure 3G, Figure 4H). Further, we find that early nucleating TEs are highly enriched for high sense and anti‐sense maternal piRNA (Figure 6A) and that piRNA abundance is significantly correlated with the extent of H3K9me3 enrichment across TEs and this correlation becomes stronger over developmental stages (Figure 6B). This in conjunction with our finding that early nucleating TEs show early zygotic transcription (Figure 6C) led us to suggest that maternally deposited piRNAs are important for the co‐transcriptional silencing of TEs via H3K9me3 deposition, which is consistent with previously suggested models. As suggested by reviewer 2 (and we are in full agreement), these results can be interpreted as (or is consistent with the model) piRNAmediated recruitment to nascent transcripts which brings the machinery in close proximity to other features on or around TE insertions (TSS or ZNF) that direct nucleation. Nevertheless, we have toned down our conclusion/interpretation: The last sentence of the abstract now reads:
“These results support the model of piRNA‐associated co‐transcriptional silencing while also raising the possibility of additional mechanisms for site‐restricted H3K9me3 nucleation at TEs during early Drosophila embryogenesis.”
On the piRNA data presentation: I don't see the value in showing correlation lines and r-values in figures 6D, E, F, 4H when there is no correlation visible. 3H, S9 (x-axis = kb from peak?) make the reader wonder how piRNA distribution look like further (than 2kb) away from the peak of H3K9me3. Is there any accumulation around peaks? Perhaps piRNA accumulation and distribution could be better grasped in browser shots like S5 and S7 with an additional piRNA track?
For figures 3H, S9, 6D, we show the regression lines and Pearson’s correlation coefficients precisely to show the lack of correlation. However, for figures 6E and F, we do not agree that the correlations are of no value. For 6F, there is a visually clear and strongly statistically significant negative correlation between piRNA abundance and TE transcript abundance; this is visible even without the regression line. For 6E, we show increasing correlation between mean enrichment across TE and mean piRNA mapping to the TE. The associations here are visibly noisy but the correlations are strong for the later developmental stages (4e and 7) as per the p‐values and correlation coefficients.
We also added piRNA distribution of up to 10kb around the peaks in Figure 3 —figure supplement 4 and Figure 4 —figure supplement 3B, which do not show piRNA enrichment around peaks (or specific positions near peaks), but as pointed out above, genomic regions containing H3K9me3 peaks are strongly enriched for piRNA (Figure 3G, Figure 4H). Tracks of sense and antisense piRNA mapping within TEs are found in Figure 5D,G and J.
What is the y-axis unit in Figure 5D, G, J? For small RNAs, it is common to calculate normalized read counts in RPM (reads per total mio mapped). However, 5000RPM would be a lot?! (10,000RPM = 1% of the library) Readers need to be able to judge expression strength and depth.
It is (was) the piRNA read coverage across the TE. It is now converted to RPM.
Figure 6 is confusing: while it looks like lots of piRNAs map to stage 3 TEs in panel A and B, panel D (and E) shows no correlation whatsoever. Maybe it could be pointed out more clearly that A+B are about distinct TEs, while D+E are about H3K9me3 position within an element? I took the conclusion that piRNAs "mark" stage 3 high copy number TEs from panel F.
We have made the distinction between 6A, D and F more clear in the figure and the figure legends.
Indeed, 6D (now E) is looking at piRNA mapping and H3K9me3 at specific positions of TEs while the rest are for aggregate and averaged abundance of piRNA/enrichment/transcript abundance across the entire TE.
On the other hand, the authors speculate that specificity for nucleation might be provided by the act of transcription of TEs (line 396-98), which from an evolutionary arms race perspective I really don't like, as TEs like to evade repression and thus would likely change their expression profile to later stages if very early transcription initiation is the cause of more robust silencing.
For a TE to transpose, it needs to be transcribed. We are not trying to say that early transcription per se is responsible for silencing, but the current model of co‐transcriptional silencing of TEs invokes nascent transcript for piRNAs to target their genomic region. We are showing that TEs that are early transcribed are exactly the ones that are silenced the earliest (TEs with stage 3 peaks also show zygotic transcription between stage 2 and 4). For the TEs that nucleate after stage3 (stage4 TEs in figure 6), they show increase in expression between stage 4 and stage 5 (Figure 6C). We interpret this to mean that even if a TE like TRAM evolve to become late expressing, the same mechanism for transcription‐associated nucleation is likely also present. These results are consistent with the current model for cotranscriptional silencing of TEs where piRNA and PIWI target TE nascent transcripts (Ozata et al., 2019). From an arms‐race stand point, we would actually speculate that early expressing TEs may have more time to remain highly expressed prior to full heterochromatin establishment, despite having early nucleation.
Additional comments that need careful consideration, text rewriting, and potentially some re-analyses:
1) I am a little confused by the logic of how transcription is responsible for K9me3 peak initiation when the authors describe that both for stage 3 and stage 4 nucleating peaks the transcript level increases later, at stage 4 and 4-5, respectively. To me the data suggests that nucleation induces transcription (admittedly, this is going against the assumed function of K9me3) rather than the other way around.
The model of co‐transcriptional silencing of TEs involves targeting of the PIWI/piRNA complex to nascent transcripts, which in turn recruits the silencing machinery, including HMT, that induce H3K9me3. Thus, transcription is in fact necessary for heterochromatin formation, and has been experimentally demonstrated in other organisms (but, as far as we know, not yet in Drosophila).
2) Around line 308 the authors describe that the weak fold difference in K9me3 levels between the truncated and full length copies is likely a sever underestimation because non-unique mappings are distributed evenly amongst copies. Why did the authors not look at unique mappers?
Unfortunately, if we use only unique‐mapping reads, less than 5% of the full-length insertions show uniquely‐mapping reads through the body of the TE.
3) In Figure 7B-C it is perplexing that the H3K9me3 enrichment in the last 1kb of internal sequence of TEs is higher in the full-length, while in the first 1kb internal sequence it is higher in the truncated copies. How do the authors explain this difference?
For these boxplots, we are averaging across only parts of the elements in both the full length and (most of the) truncated elements; this is meant to provide comparison between homologous regions between the truncated and full‐length copies. For 7B (5’truncations), we are averaging across 1000‐2708bp of the internal coding sequence of both of the full‐length insertions. However, for 7C (3’ truncations), we are averaging across 1‐1708bp of full‐length elements. Because of this, the enrichment in 7C includes the 5’ nucleation (elevated H3K9me3) sites thus elevating the averaged enrichment, while those in 7B lack the 5’ nucleation sites thus lowering the averaged enrichment.
4) The H3K9me3 patterns along TEs are intriguing and very interesting. The authors may want to group and present TEs by class, at least discuss them by class in the text. This may explain "discrepancies" between transposon families. It seems LTR-retroelements show 5'-nucleation while non-LTR elements have a 3'-bias? The findings could be further elevated by discussing patterns in other organisms, perhaps data in D. melanogaster is available? In mouse and primates, 5'-nucleation has been observed by: Rebollo, 2011 Plos Genetics; Wolf, 2015 Genes Dev; Walter, 2016 eLife; Imbeault 2017 Nature; Wolf, 2020 eLife.
We have now grouped TEs by their classes in Figure 5A. We also grouped LTR retrotransposons with 5’ nucleation in supplementary figure 10 and non‐LTR retrotransposons in supplementary figure 11. While some LTRs (TRAM, BEL‐5 and Gypsy‐11) show clear 5’ nucleation, we are unsure whether this can be generalized to all LTRs. For the non‐LTR retrotransposons, we see nucleation in various positions. The R1 variant in figure 5 show nucleation near 3’, however another variant in Supp figure 11 shows nucleation near 5’. The LOA‐2 element has nucleation near the 5’ but is still ~1kb away. We have added an observed 5’ bias in mice in the discussion.
In mouse and human, this nucleation is often (but perhaps not always) guided by ZFP which the authors point out are not conserved in flies. Given the similar patterns, this may still point to a highly conserved targeting mechanism for H3K9me3.
True. This is why we talk about ZAD‐ZNF in Drosophila in the discussion.
H3K9me3 induction at several LTR-retroelements in mouse have been shown to initiate at their highly conserved tRNA primer binding site and spread from there (Rebollo, 2011 Plos Genetics; Wolf, 2015 Genes Dev). It would be helpful if the authors state more precisely what they defined as a "5'-truncation". How many nucleotides were missing in these copies? Only 5'-LTRs or perhaps additional nucleotides from the 5'-UTR?
Insertions with 5’ and 3’ truncations are those that have the respective LTRs removed and at least has 500bp of the remainder of the internal sequence. We have now added Figure 7 – supplement figure 1C showing the lengths and structures of the truncated copies.
5) Much of the RNA expression data is plotted like one would plot chromatin peaks and a bit odd presentation of "no expression". In Figure S6 and 3G (upper third coordinates) there are a couple of loci that are expressed throughout stages. What are they? Are they independent of H3K9me3 and are they a specific transposon family? Genic? The obtained RNAseq data should be more accessible, which portions of the genome are expressed at the stages sampled? Perhaps some pie charts or supplemental tables of where in the genome reads map to at which stage could provide an overview of what the RNAseq actually revealed other than negative correlation with H3K9me3 at select loci.
We added Figure 3 – supplement 3, which shows a heatmap of the transcript abundance (in TPM) of genes that overlap with stage 3 peaks across development. 40% of these genes are maternally deposited and appear as those streaks in the figures mentioned (Figure 3G and Figure 3 – supplement figure 2 which was previously S6). Figure 3 – supplement 3B shows the breakdown (in pie chart) of the proportion of the genes overlapping stage 3 peaks that have maternal transcripts compared to that of all genes. Consistent with our conclusion that maternal transcripts of these genes are unlikely to contribute to early stage 3 nucleation, no difference (40% vs 39.8%) was observed. We also now added a supplementary file 2 documenting the mapping statistics (to TEs, genes) of the RNA‐seq data, and adjusted the color scheme of the heatmaps to make them more clear.
6) Many references are missing (especially for piRNAs and k9me nucleation) as detailed in the 'recommendations for the authors' section. The authors also identify several errors or missing text in the main text and figure, as clarified in the 'Recommendations for the authors' section that follows.
We have added all the recommended literature (see below).
Reviewer #2 (Recommendations for the authors):
The resubmitted version of the manuscript makes less profound claims than the original one. This is mostly due to the fact that many of the original peaks they found in early embryos turned out to be artifacts. Based on the current results, the main claims are that nucleation at TEs starts as early as stage 3 of embryonic development and that early nucleation is predominantly on active TEs (often at their promoters) and leads to more robust H3K9 methylation at later stages. The authors find that early nucleating TEs are highly targeted by maternal piRNAs and show early zygotic transcription consistent with the prevailing model that piRNA-induced transcriptional silencing requires transcription.
The new version of the manuscript is toned down and makes claims that are consistent with the data. The authors have addressed all the concerns except for proper references, although this mainly is due to removing a large fraction of the previous data that was fund to be a technical artifact and by toning down claims that were based on correlations. Whether these current results are still sufficiently interesting for publication in eLife is not my responsibility to decide. I do find the observation of very early nucleation, which is consistent with piRNA-mediated early establishment of K9-methylation over TEs, interesting and, although not very surprising, still worth publishing.
I have a few remaining comments, which mostly indicate some level of sloppiness and the lack of familiarity with the piRNA field as well as some disagreement with the author's interpretations of the data.
1) I am a little confused by the logic of how transcription is responsible for K9me3 peak initiation when the authors describe that both for stage 3 and stage 4 nucleating peaks the transcript level increases later, at stage 4 and 4-5, respectively. To me the data suggests that nucleation induces transcription (admittedly, this is going against the assumed function of K9me3) rather than the other way around.
Addressed above.
2) Based on the fact that piRNA mappings along the TEs show no correlation with nucleation sites the authors speculate that some other mechanism might be responsible for nucleation (transcription itself or Zn-finger proteins) and piRNAs induce spreading. While this can certainly not be excluded, I am not sure where the expectation that a complex that binds nascent transcript would induce changes on the DNA at the same sequence as where it associates with the RNA comes from. In fact that seems relatively unlikely to me. Instead, I would think that recruitment of the complex on nascent transcript will induce nucleation in the proximity and that other factors (e.g., location of txn initiation or binding of other chromatin factors) determine where chromatin modification nucleates. Antisense piRNAs are mostly derived from piRNA clusters, which contain fragments of TEs, often lacking intact promoters (keeping all the TE promoters would increase transcriptional interference within the cluster). Thus, if nucleation occurs at promoters (as the authors observe for several TEs), piRNAs might predominantly not be able to target this region as clusters might be deprived of TSSs.
Addressed above.
On the other hand, the authors speculate that specificity for nucleation might be provided by the act of transcription of TEs (line 396-98), which from an evolutionary arms race perspective I really don't like, as TEs like to evade repression and thus would likely change their expression profile to later stages if very early transcription initiation is the cause of more robust silencing.
Addressed above.
3) Around line 308 the authors describe that the weak fold difference in K9me3 levels between the truncated and full-length copies is likely a sever underestimation because non-unique mappings are distributed evenly amongst copies. Why did the authors not look at unique mappers?
Addressed above.
4) In Figure 7B-C it is perplexing that the H3K9me3 enrichment in the last 1kb of internal sequence of TEs is higher in the full-length, while in the first 1kb internal sequence it is higher in the truncated copies. How do the authors explain this difference?
Addressed above.
5) References remain insufficient and often wrong or at least not referring to the primary/first discovery. It is very apparent that the authors have not obtained a broad knowledge of the piRNA field and/or have done a sloppy job with the references even after this was raised in the first round of review. Here are some examples:
– Line 42: While I am not sure why the authors bring phase separation into this story, if they do, they should also be aware of counter-arguments to HP1 inducing phase separation (Erdel et al., 2020. PMID: 32101700).
We include the citation.
– Line 51-53: The authors refer to results in flies and mice but only reference a single fly paper. Shortly after (line 57), they cite 3 papers (not correctly formatted) for Piwi causing H3K9 methylation, yet one of them, Derricarrere et al., only showed that Piwi cleavage activity is needed and did not provide any analysis of its role in H3K9 methylation, while some relevant papers are missing.
We include more citations. Citation of Derricarrere et al., was meant for “Independent of the posttranscriptional cleavage activity” at the beginning of the sentence. We have moved the citation to right after it.
– Line 59-61: The authors say that the piRNA-Piwi complex recruits heterochromatin factors, including histone methyltransferases for H3K9me3 deposition. The papers cited refer to Piwi inducing H3K9me3, without either of them showing recruitment of the HMT. On the other hand, they miss citing the paper that comes closest to showing recruitment mechanism of the HMT. In addition, they cite one of two papers describing Panx (why not the paper by Brennecke?) and one on the SFINX complex (this time only the Brennecke paper out of 4 parallel papers), the first a factor of unknown function and the 2nd an RNA binding complex. This seems like a random choice of factors (excluding Arx, the RDC complex, etc.) and a random choice of references for those.
We include more citations.
6) Figures and figure legends:
– Figure legend 5: panel "C" is missing.
Added.
– Color scheme in Figure 4H is missing?
Added.
– Figure 7B-D it would help if the panels would indicate what the difference is so one does not have to look in the figure legend.
Added.
– For suppl. figure 5 and 7Y axis label is missing. Are these different stages?
Y‐axes and stage labels are now added.
– For suppl. figure 11 the colors are not indicated (for the different stages, so one hast to look at the main figures to know what stage is which color). Also, the "position of called peaks" indicated at the top of panels would need to be mentioned in the figure legends in all figures.
Added color legends and positions of called stage 3 peaks are now indicated by gray boxes.
Just a suggestion: While the figures are very nice in color (and consistent throughout the manuscript), the color choices are making it essentially impossible to look at the data on a black and white printout. While this is by itself not a huge issue, I generally prefer plots that do not depend on color printouts. E.g., in Figure 3E-F the two colors look identical in BandW and, accordingly, it is impossible to determine what the lower and upper half of the chromosome arm markings are in 3F. If the colors are left the same, it would help to better describe this in the figure legends. Numerous other examples of colors being hard to evaluate in BandW are found, that I do not list.
Unfortunately given the number of stages to compare using other means of discriminating them (like dotted lines or different shaped points) just end up being even harder to interpret. We changed the colors in 3E and F for better discrimination. For F the two colors are actually plotted separately – one on top and one on the bottom.
Reviewer #4 (Recommendations for the authors):
1) The H3K9me3 patterns along TEs are intriguing and very interesting. The authors may want to group and present TEs by class, at least discuss them by class in the text. This may explain "discrepancies" between transposon families. It seems LTR-retroelements show 5'-nucleation while non-LTR elements have a 3'-bias? The findings could be further elevated by discussing patterns in other organisms, perhaps data in D. melanogaster is available? In mouse and primates, 5'-nucleation has been observed by: Rebollo, 2011 Plos Genetics; Wolf, 2015 Genes Dev; Walter, 2016 eLife; Imbeault, 2017 Nature; Wolf, 2020 eLife.
In mouse and human, this nucleation is often (but perhaps not always) guided by ZFP which the authors point out are not conserved in flies. Given the similar patterns, this may still point to a highly conserved targeting mechanism for H3K9me3.
H3K9me3 induction at several LTR-retroelements in mouse have been shown to initiate at their highly conserved tRNA primer binding site and spread from there (Rebollo, 2011 Plos Genetics; Wolf, 2015 Genes Dev). It would be helpful if the authors state more precisely what they defined as a "5'-truncation". How many nucleotides were missing in these copies? Only 5'-LTRs or perhaps additional nucleotides from the 5'-UTR?
Addressed above.
2) The correlation between piRNAs and H3K9me3 peaks seems marginal if at all. The last sentence of the abstract, while most likely true, seems a gross over-interpretation of the results. While I can well imagine how small RNA at one stage guide H3K9me3 at a later stage, the absence of correlation with H3K9me3 peaks make this scenario a long stretch. Therefore, the reasoning in the manuscript becomes pretty confusing. That maternally deposited piRNAs may be instrumental in suppressing this group of TEs is interesting and well possible but hard to conclude from the presented data.
On the piRNA data presentation: I don't see the value in showing correlation lines and r-values in figures 6D, E, F, 4H when there is no correlation visible. 3H, S9 (x-axis = kb from peak?) make the reader wonder how piRNA distribution look like further (than 2kb) away from the peak of H3K9me3. Is there any accumulation arounds peaks? Perhaps piRNA accumulation and distribution could be better grasped in browser shots like S5 and S7 with an additional piRNA track?
Addressed above.
What is the y-axis unit in Figure 5D, G, J? For small RNAs, it is common to calculate normalized read counts in RPM (reads per total mio mapped). However, 5000RPM would be a lot?! (10,000RPM = 1% of the library) Readers need to be able to judge expression strength and depth.
Addressed above.
Figure 6 is confusing: while it looks like lots of piRNAs map to stage 3 TEs in panel A and B, panel D (and E) shows no correlation whatsoever. Maybe it could be pointed out more clearly that A+B are about distinct TEs, while D+E are about H3K9me3 position within an element? I took the conclusion that piRNAs "mark" stage 3 high copy number TEs from panel F.
Addressed above.
3) Much of the RNA expression data is plotted like one would plot chromatin peaks and a bit odd presentation of "no expression". In Figure S6 and 3G (upper third coordinates) there are a couple of loci that are expressed throughout stages. What are they? Are they independent of H3K9me3 and are they a specific transposon family? Genic? The obtained RNAseq data should be more accessible, which portions of the genome are expressed at the stages sampled? Perhaps some pie charts or supplemental tables of where in the genome reads map to at which stage could provide an overview of what the RNAseq actually revealed other than negative correlation with H3K9me3 at select loci.
Addressed above.
4) The piRNA references are outdated and additional references would make the authors point only stronger.
– Line 53 and 256 (and others): There are excellent reviews on transcriptional silencing through the piRNA pathway that are much more recent than 2009, e.g. Ninova, 2019 Dev; Olovnikov, 2012 Curr Opin Genet Dev; Ozata, 2019 Nature Rev Genetics.
References added.
– Line 53: Brennecke et al., 2007 was a foundational paper to characterize piRNA cluster and PIWI-mediated post-transcriptional silencing of TEs in Drosophila but does not show transcriptional silencing. Several other studies later did which would be more accurate to cite here, if the authors don't want to cite a review. E.g.:
Drosophila: Sienski et al., 2012 Cell (cited elsewhere); Le Thomas et al., 2013 Genes Dev (cited elsewhere); Huang et al., 2013 Dev Cell; Mammals: Watanabe 2011 Science; Aravin 2008 Mol Cell; Pezic, 2014 Genes Dev; C. elegans: Gu et al., 2012 Nature Genetics
We added several references.
– Line 345: If the point is metazoan, gametogenesis and preimplantation… add such references to Wang et al., 2018. E.g. Tang et al., 2016 Nat Rev Genet; Laue et al., 2019 Nature Comm (zebrafish); Ishiuchi et al., 2021 NSMB; Saitou et al., 2012 Dev (review)
References added.
https://doi.org/10.7554/eLife.55612.sa2Article and author information
Author details
Funding
National Institutes of Health (R56AG057029)
- Doris Bachtrog
National Institutes of Health (R01GM101255)
- Doris Bachtrog
National Institutes of Health (R01GM076007)
- Doris Bachtrog
The funders had no role in study design, data collection and interpretation, or the decision to submit the work for publication.
Acknowledgements
We thank Dr. Lauren Gibilisco for technical guidance with piRNA library preparation and analyses and Dr. Sally Elgin for comments on manuscript draft. We also thank the four anonymous reviewers for their valuable suggestions and critiques. Publication made possible in part by support from the Berkeley Research Impact Initiative (BRII) sponsored by the UC Berkeley Library.
Senior Editor
- Jessica K Tyler, Weill Cornell Medicine, United States
Reviewing Editor
- Irene E Chiolo, University of Southern California, United States
Version history
- Received: January 30, 2020
- Accepted: June 14, 2021
- Accepted Manuscript published: June 15, 2021 (version 1)
- Version of Record published: July 16, 2021 (version 2)
Copyright
© 2021, Wei et al.
This article is distributed under the terms of the Creative Commons Attribution License, which permits unrestricted use and redistribution provided that the original author and source are credited.
Metrics
-
- 2,372
- Page views
-
- 280
- Downloads
-
- 12
- Citations
Article citation count generated by polling the highest count across the following sources: Crossref, PubMed Central, Scopus.
Download links
Downloads (link to download the article as PDF)
Open citations (links to open the citations from this article in various online reference manager services)
Cite this article (links to download the citations from this article in formats compatible with various reference manager tools)
Further reading
-
- Genetics and Genomics
- Microbiology and Infectious Disease
Plasmids enable the dissemination of antimicrobial resistance (AMR) in common Enterobacterales pathogens, representing a major public health challenge. However, the extent of plasmid sharing and evolution between Enterobacterales causing human infections and other niches remains unclear, including the emergence of resistance plasmids. Dense, unselected sampling is essential to developing our understanding of plasmid epidemiology and designing appropriate interventions to limit the emergence and dissemination of plasmid-associated AMR. We established a geographically and temporally restricted collection of human bloodstream infection (BSI)-associated, livestock-associated (cattle, pig, poultry, and sheep faeces, farm soils) and wastewater treatment work (WwTW)-associated (influent, effluent, waterways upstream/downstream of effluent outlets) Enterobacterales. Isolates were collected between 2008 and 2020 from sites <60 km apart in Oxfordshire, UK. Pangenome analysis of plasmid clusters revealed shared ‘backbones’, with phylogenies suggesting an intertwined ecology where well-conserved plasmid backbones carry diverse accessory functions, including AMR genes. Many plasmid ‘backbones’ were seen across species and niches, raising the possibility that plasmid movement between these followed by rapid accessory gene change could be relatively common. Overall, the signature of identical plasmid sharing is likely to be a highly transient one, implying that plasmid movement might be occurring at greater rates than previously estimated, raising a challenge for future genomic One Health studies.
-
- Evolutionary Biology
- Genetics and Genomics
Microbial plankton play a central role in marine biogeochemical cycles, but the timing in which abundant lineages diversified into ocean environments remains unclear. Here, we reconstructed the timeline in which major clades of bacteria and archaea colonized the ocean using a high-resolution benchmarked phylogenetic tree that allows for simultaneous and direct comparison of the ages of multiple divergent lineages. Our findings show that the diversification of the most prevalent marine clades spans throughout a period of 2.2 Ga, with most clades colonizing the ocean during the last 800 million years. The oldest clades – SAR202, SAR324, Ca. Marinimicrobia, and Marine Group II – diversified around the time of the Great Oxidation Event, during which oxygen concentration increased but remained at microaerophilic levels throughout the Mid-Proterozoic, consistent with the prevalence of some clades within these groups in oxygen minimum zones today. We found the diversification of the prevalent heterotrophic marine clades SAR11, SAR116, SAR92, SAR86, and Roseobacter as well as the Marine Group I to occur near to the Neoproterozoic Oxygenation Event (0.8–0.4 Ga). The diversification of these clades is concomitant with an overall increase of oxygen and nutrients in the ocean at this time, as well as the diversification of eukaryotic algae, consistent with the previous hypothesis that the diversification of heterotrophic bacteria is linked to the emergence of large eukaryotic phytoplankton. The youngest clades correspond to the widespread phototrophic clades Prochlorococcus, Synechococcus, and Crocosphaera, whose diversification happened after the Phanerozoic Oxidation Event (0.45–0.4 Ga), in which oxygen concentrations had already reached their modern levels in the atmosphere and the ocean. Our work clarifies the timing at which abundant lineages of bacteria and archaea colonized the ocean, thereby providing key insights into the evolutionary history of lineages that comprise the majority of prokaryotic biomass in the modern ocean.