Mucosal-associated invariant T (MAIT) cells mediate protective host responses in sepsis
- Division of Infectious Diseases, University of Utah, United States
- Molecular Medicine Program, University of Utah, United States
- Division of Pulmonary and Critical Care, University of Utah, United States
- Division of Microbiology and Immunology, Department of Pathology, University of Utah, United States
- Division of General Internal Medicine, Department of Internal Medicine, University of Utah, United States
- George E. Wahlen VAMC Department of Internal Medicine and GRECC, University of Utah, United States
Figures
Figure 1
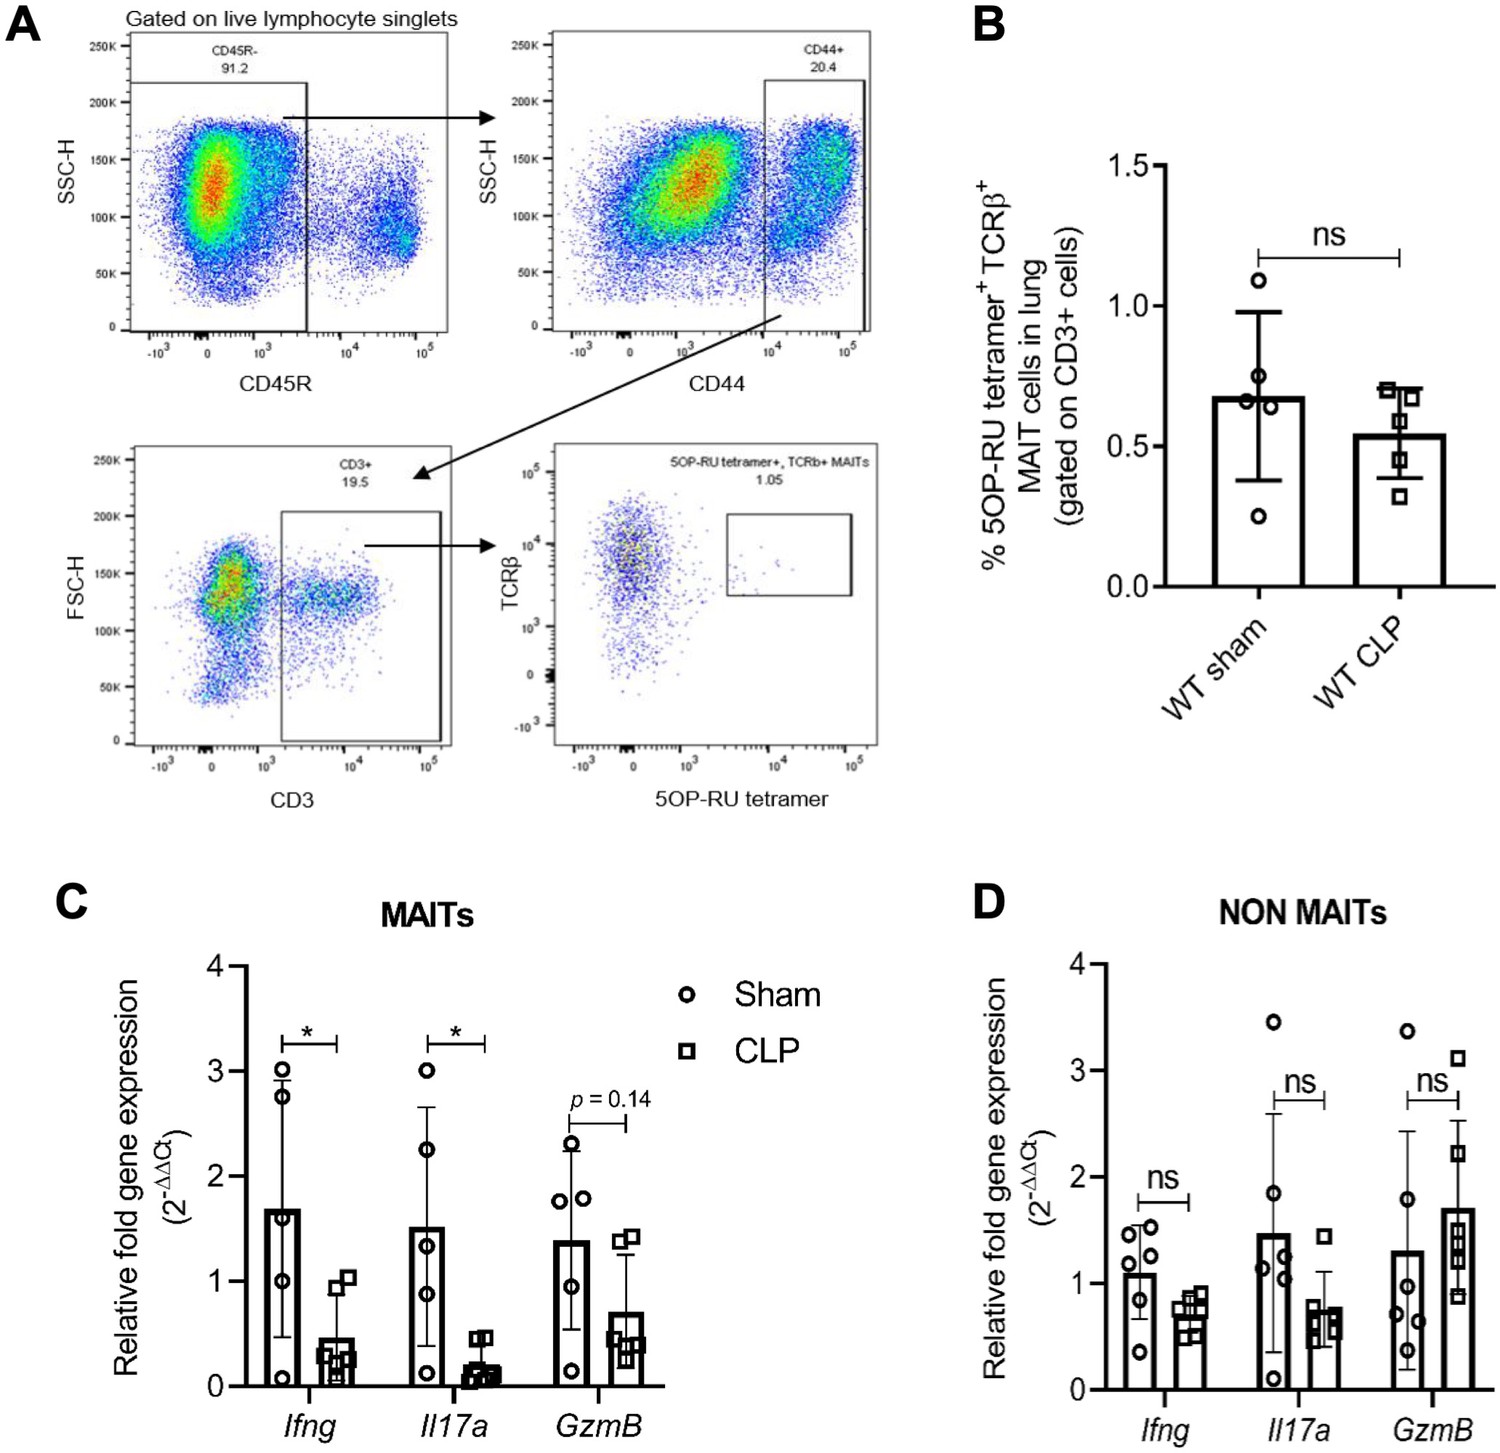
Sepsis induces MAIT-specific changes in inflammatory cytokine expression.
(A) Gating strategy for isolation of MAIT cells. In the first plot, lymphocytes with CD45R- B cells were excluded by electronic gating and CD44+ CD3+ T cells were gated to define MAIT cells as TCRβ+ MR1-5OP-RU-tetramer+ cells. (B) Percentage of TCRβ+ MR1-tetramer+ MAIT cells, of CD3+ T cells in WT mice after 18 hr of CLP or sham operation. (C) Gene expression in MAIT cells isolated using flow cytometric sorting of homogenized lung tissue after CLP or sham operation (n = 5 per group), as determined by qRT-PCR for Ifng, Il17a, and GzmB genes, (D) Ifng, Il17a, and GzmB mRNA expression in non-MAIT (MR1-tetramer- TCRβ+) CD3+ T cell populations. Data are expressed as mean ± SD, and an unpaired t-test was used for comparisons (data passed the Shapiro-Wilk normality test).
Figure 2
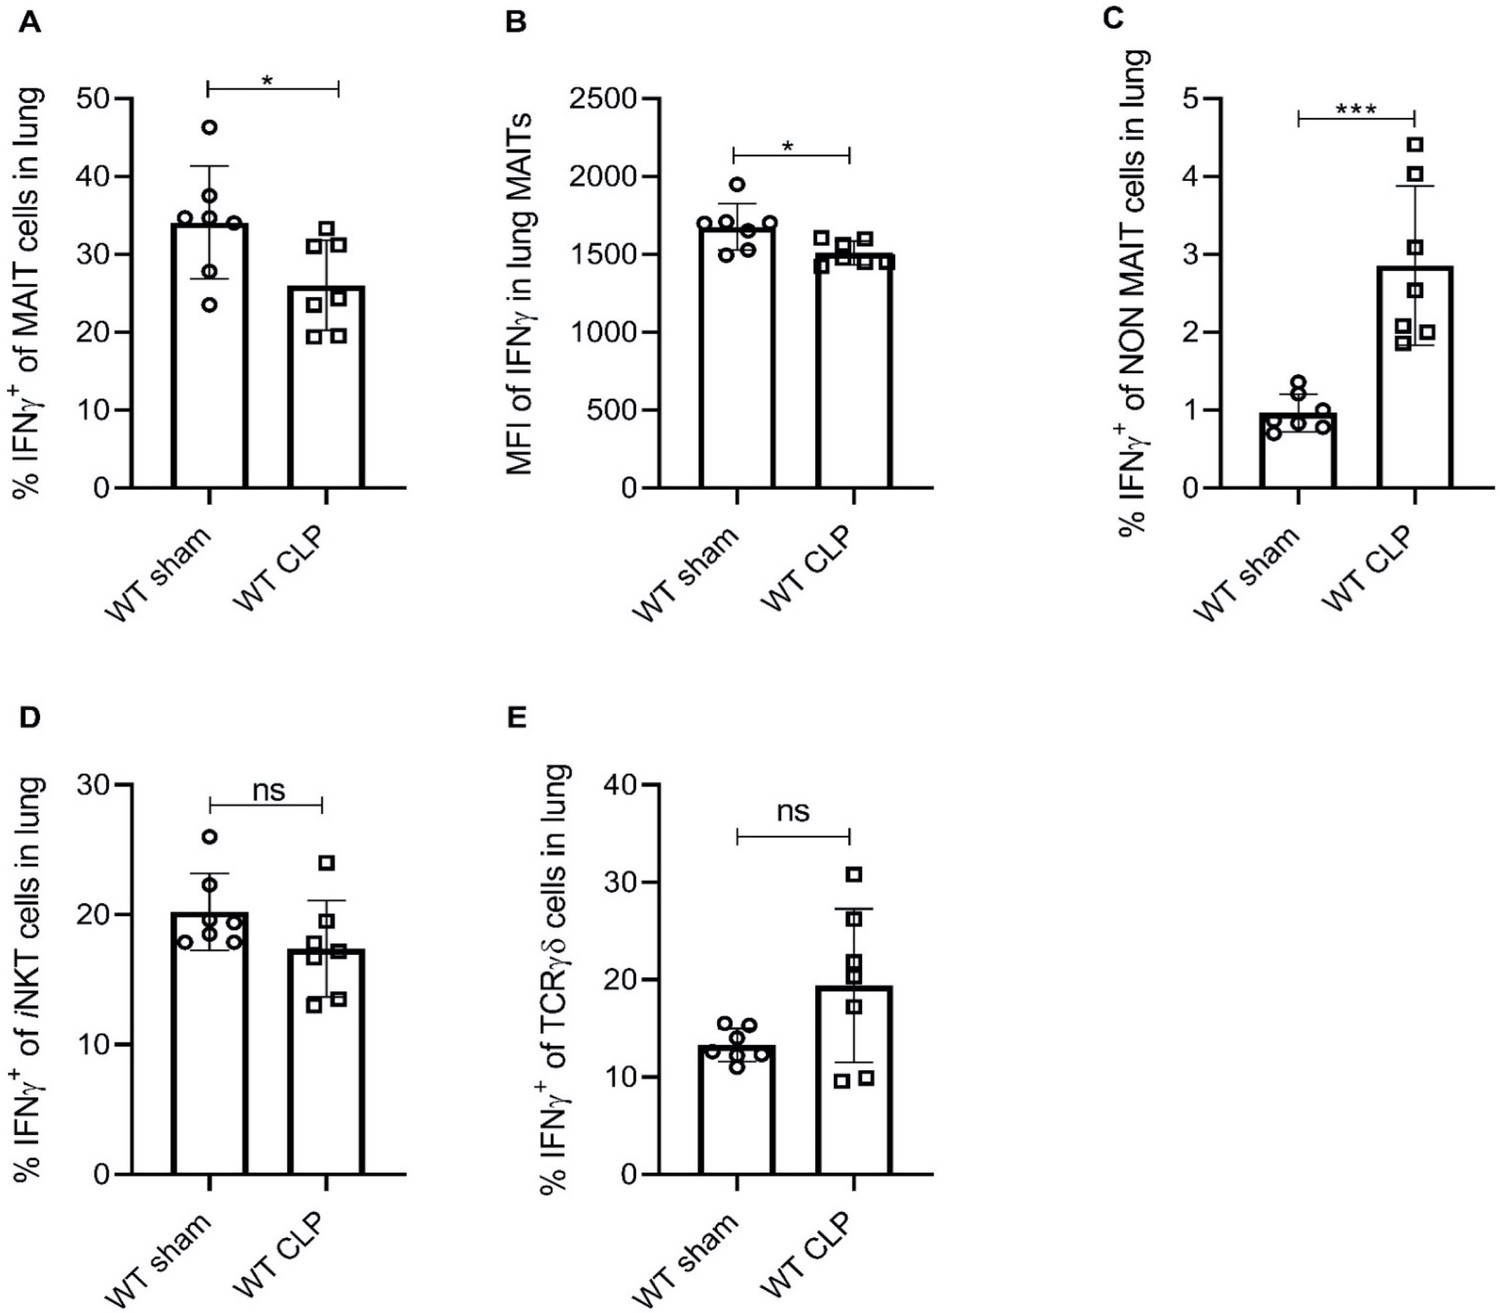
Sepsis induces lower IFNγ production in MAIT cells.
(A) Percentage frequencies of IFNγ expression in MAIT cells of lung tissue, 18 hr after CLP or sham operation (n = 7 per group), as determined by intracellular cytokine staining and flow cytometry. (B) MFI of IFNγ staining in MAIT cells. (C) Percentage frequencies of IFNγ expression in non-MAIT cells of lung tissue. (D and E) Percentage frequencies of IFNγ expression in iNKT and TCRγδ cells. Data are expressed as mean ± SD, and an unpaired t-test was used for comparisons (data passed the Shapiro-Wilk normality test).
Figure 3 with 1 supplement
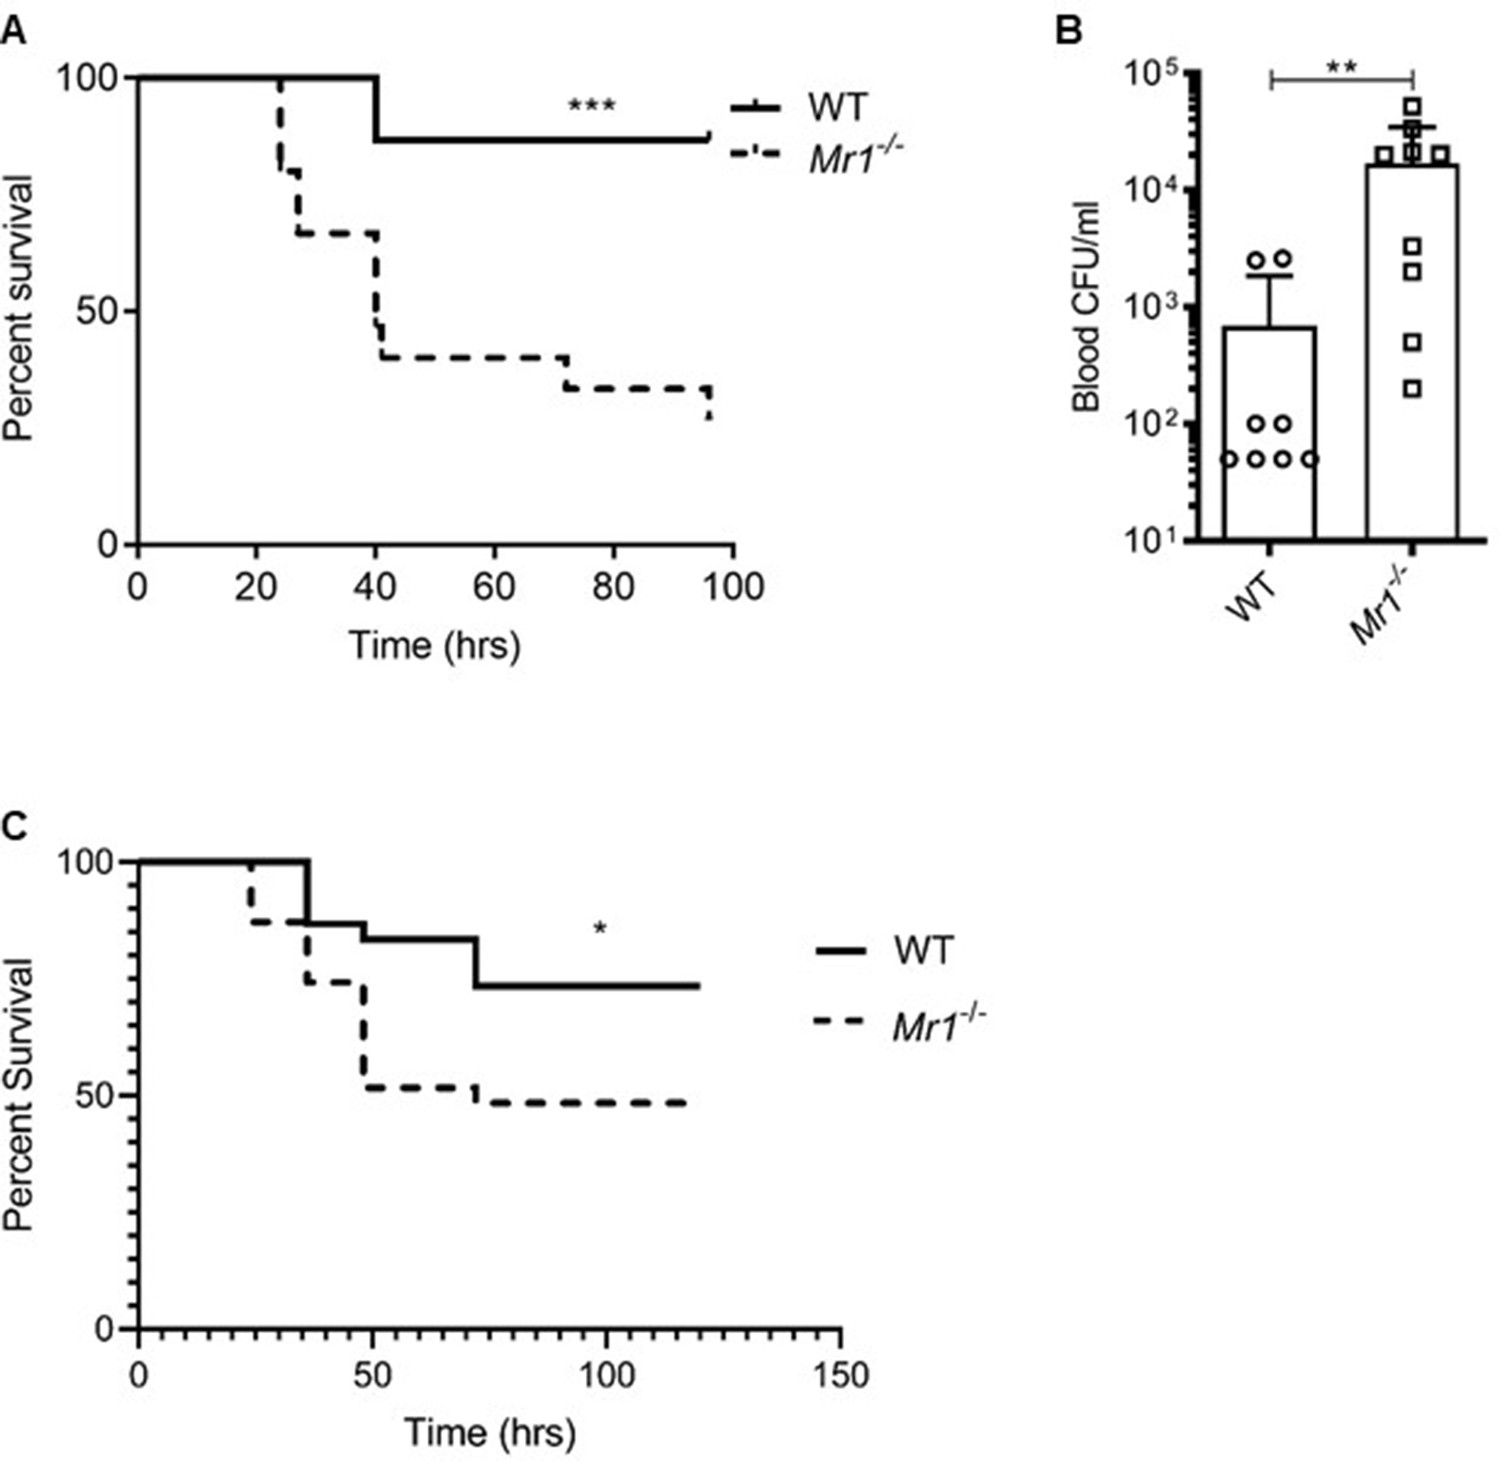
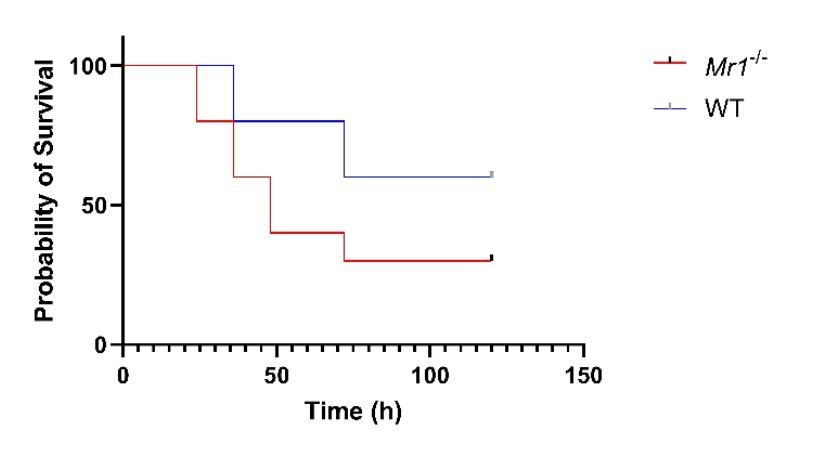
Mr1-/- mice had higher sepsis-induced mortality and bacterial burden compared to wild type mice.
(A) Age-matched Mr1-/- and WT mice (n = 15 per group) underwent CLP to induce polymicrobial sepsis. Survival was recorded over a period of 4–5 days (WT versus Mr1-/- mice, ***p=0.0007). Data represent two independent experiments. Statistical analysis was performed using the Log-rank (Mantel-Cox) test. (B) Blood was collected from WT and Mr1-/- mice (n = 8–10 per group) 18 hr post-CLP, and serial dilutions were plated on Luria Broth (LB) agar plates. Colony-forming units (CFU) were determined 24 hr after plating and were expressed as CFU/mL. Statistical analysis was performed using the Mann-Whitney test. (C) The bedding transfer procedure (detailed in Materials and methods section) was used to exchange gut microbiome between age-matched Mr1-/- and WT mice (total n = 31 for Mr1-/- mice and total n = 30 for WT mice) before inducing sepsis by CLP. Survival was recorded over a period of 4–5 days (WT versus Mr1-/- mice, *p=0.03). Data represent three independent experiments. Statistical analysis was performed using the Log-rank (Mantel-Cox) test.
Figure 3—figure supplement 1
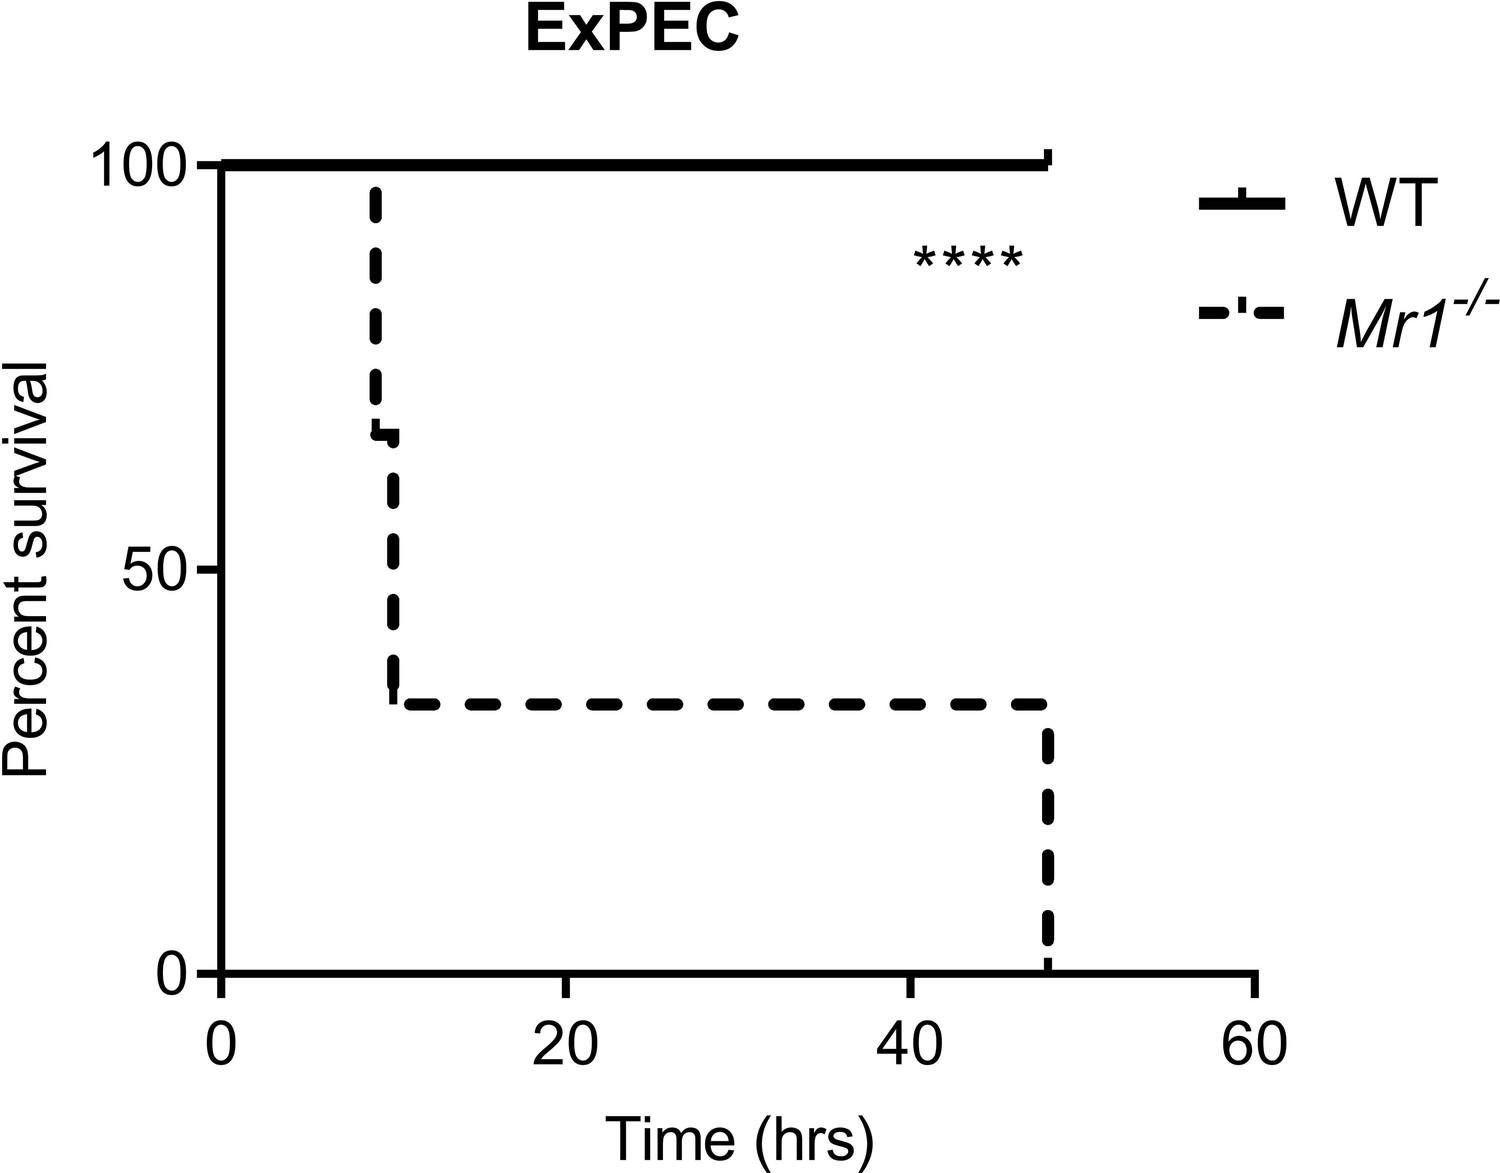
Mr1-/- mice had significantly higher mortality from ExPEC sepsis, compared to WT mice.
Graph shows survival curves after intraperitoneal injection with 1 × 10⁶ CFU of extraintestinal pathogenic Escherichia coli (ExPEC) F11 strain. Statistical analysis was performed using the Log-rank (Mantel-Cox) test.
Figure 4 with 3 supplements

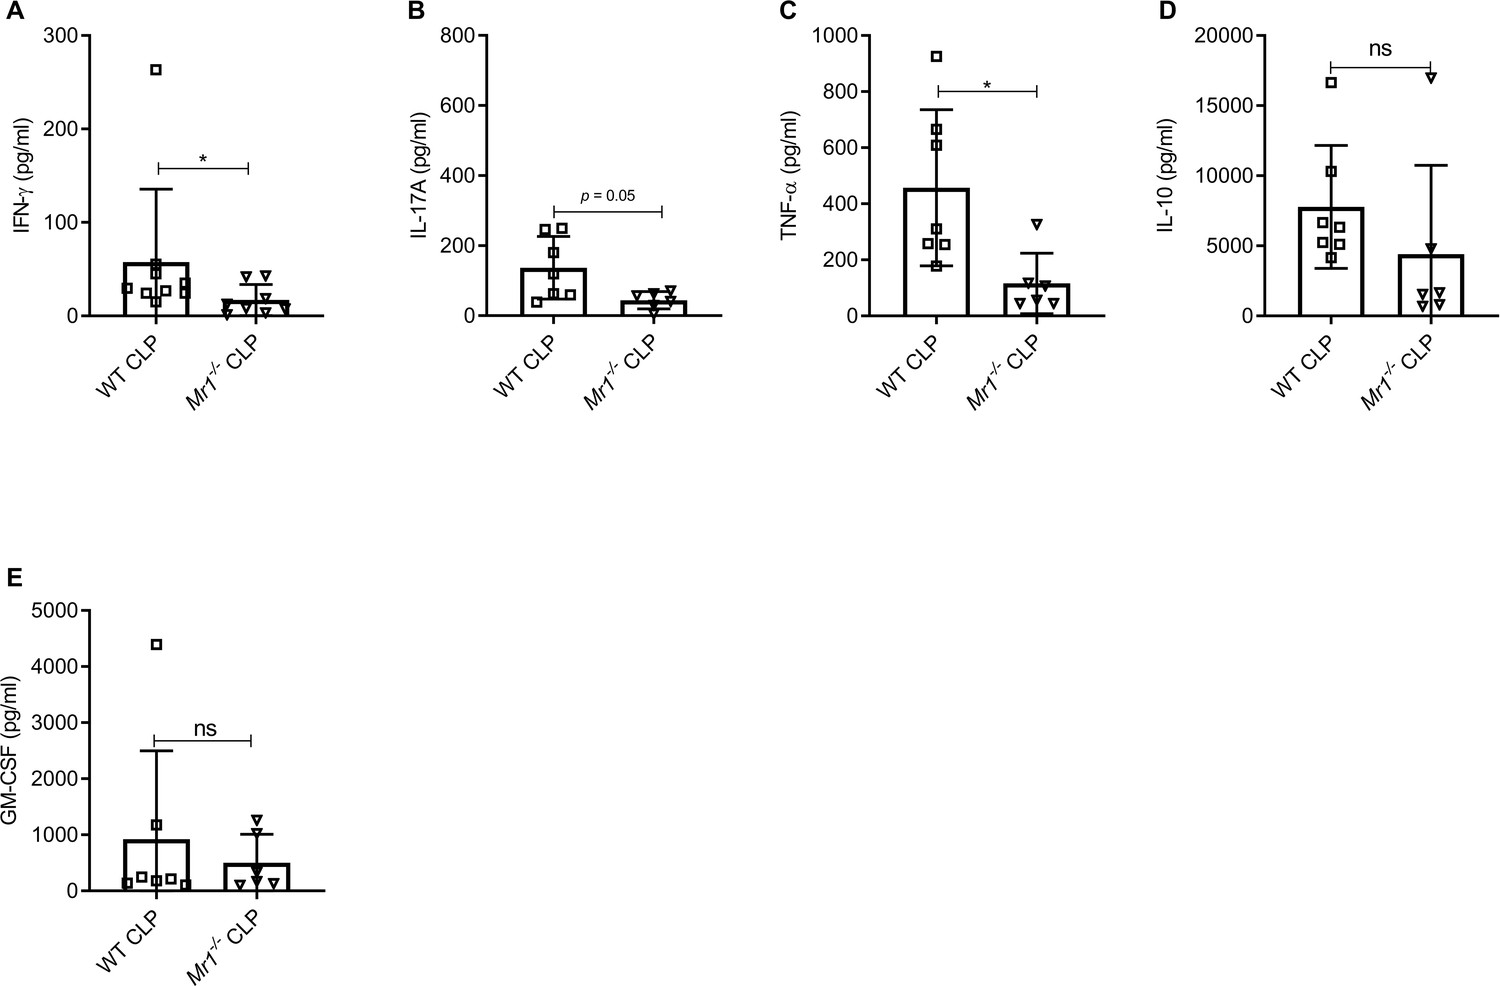
Mr1-/- mice had significantly lower levels of cytokines in the lung tissue at 18 hr post-CLP.
Levels of (A) IFN-γ, (B) IL-17A, (C) TNF-α, (D) IL-10, and (E) GM-CSF were assessed in the lungs isolated from WT and Mr1-/- mice at 18 hr post-CLP or sham operation, using a bead-based immunoassay kit. Bars represent the mean cytokine levels ± SD. The graphs represent two independent experiments (WT n = 8, Mr1-/- n = 7). The statistical significance was determined by the nonparametric Mann–Whitney test.
Figure 4—figure supplement 1
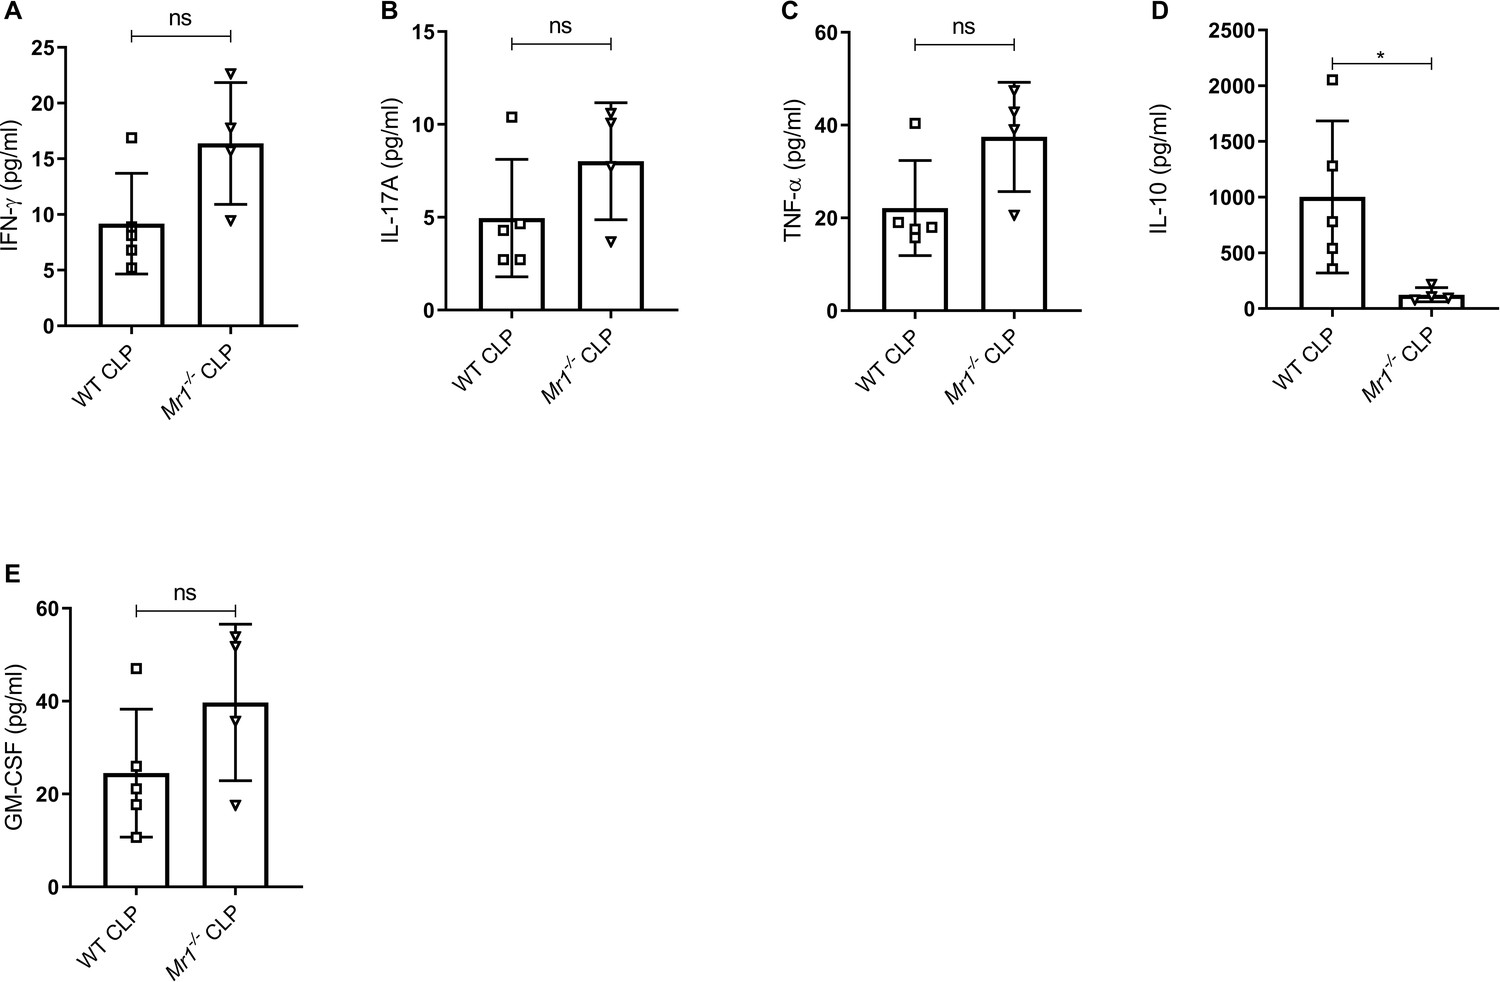
Mr1-/- mice had reduced IFNγ and TNFα but similar levels of other cytokines in serum at 18 hr post-CLP.
Levels of (A) IFN-γ, (B) IL-17A, (C) TNF-α, (D) IL-10, and (E) GM-CSF were assessed in the serum of WT and Mr1-/- mice at 18 hr post-CLP using a bead-based immunoassay kit. Bars represent the mean cytokine levels ± SD. The graphs represent the average of two independent experiments (WT n = 7–8, Mr1-/- n = 6–7). The statistical significance was determined by the nonparametric Mann–Whitney test.
Figure 4—figure supplement 2
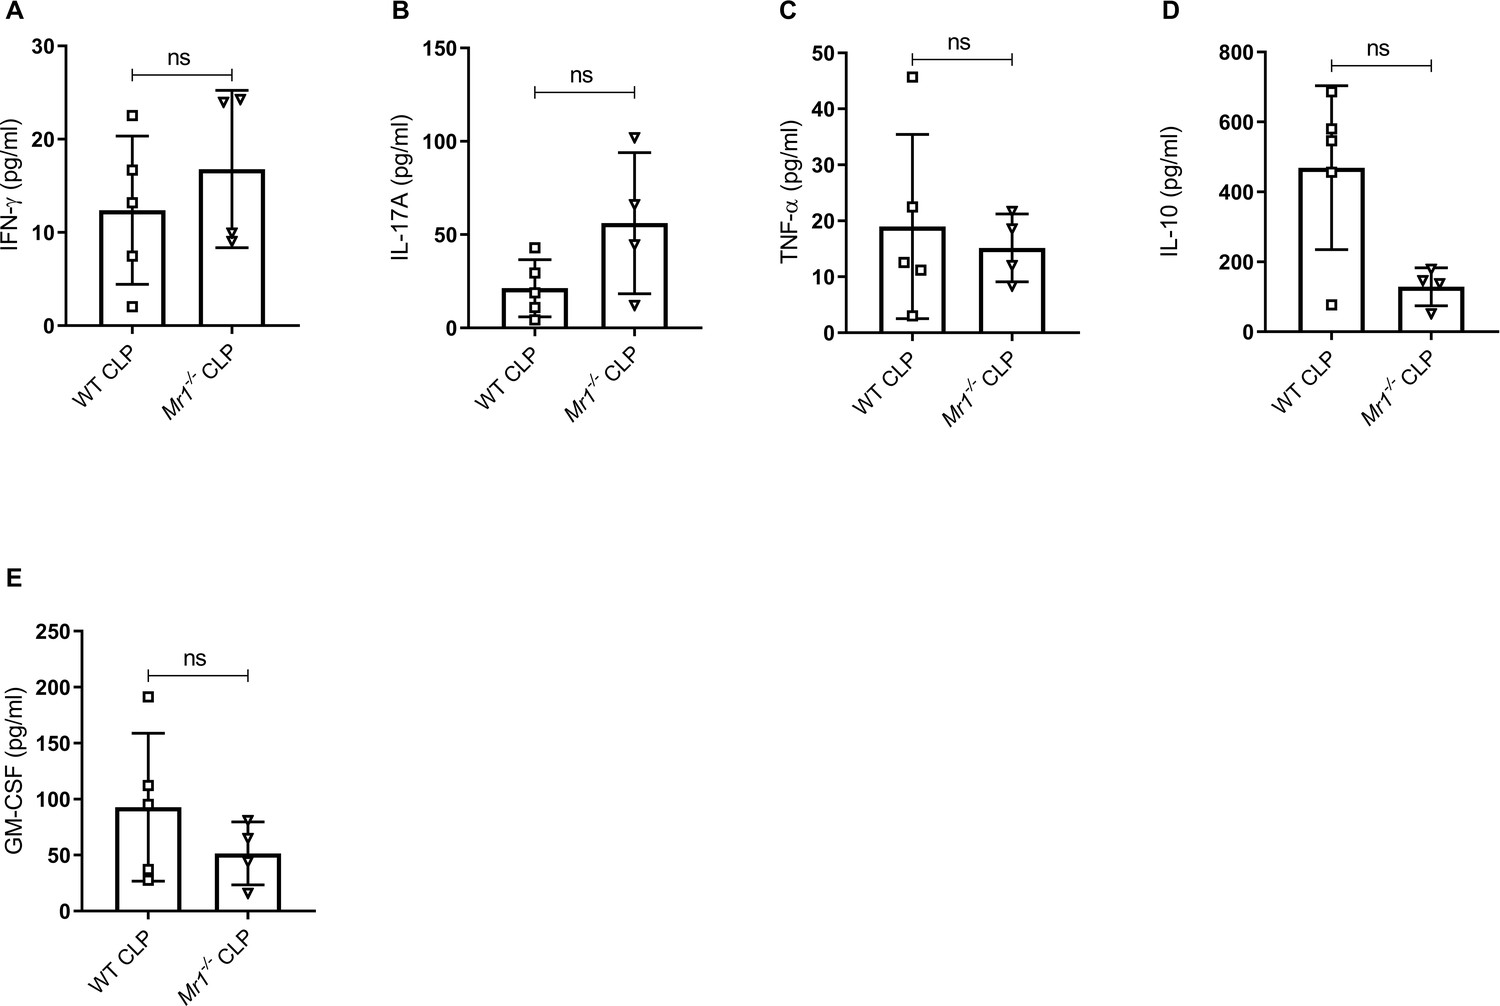
Mr1-/- mice had reduced IL-10 but similar levels of other cytokines in the liver at 18 hr post-CLP.
Levels of (A) IFN-γ, (B) IL-17A, (C) TNF-α, (D) IL-10, and (E) GM-CSF were assessed in the liver of WT and Mr1-/- mice at 18 hr post-CLP using a bead-based immunoassay kit. Bars represent the mean cytokine levels ± SD. The graphs represents one experiment (WT n = 5, Mr1-/- n = 4). The statistical significance was determined by the nonparametric Mann–Whitney test.
Figure 4—figure supplement 3
Mr1-/- mice had similar levels of other cytokines in the gut at 18 hr post-CLP.
Levels of (A) IFN-γ, (B) IL-17A, (C) TNF-α, (D) IL-10, and (E) GM-CSF were assessed in gut of WT and Mr1-/- mice at 18 hr post-CLP using a bead-based immunoassay kit. Bars represent the mean cytokine levels ± SD. The graphs represent one experiment (WT n = 5, Mr1-/- n = 4). The statistical significance was determined by the nonparametric Mann–Whitney test.
Figure 5 with 2 supplements
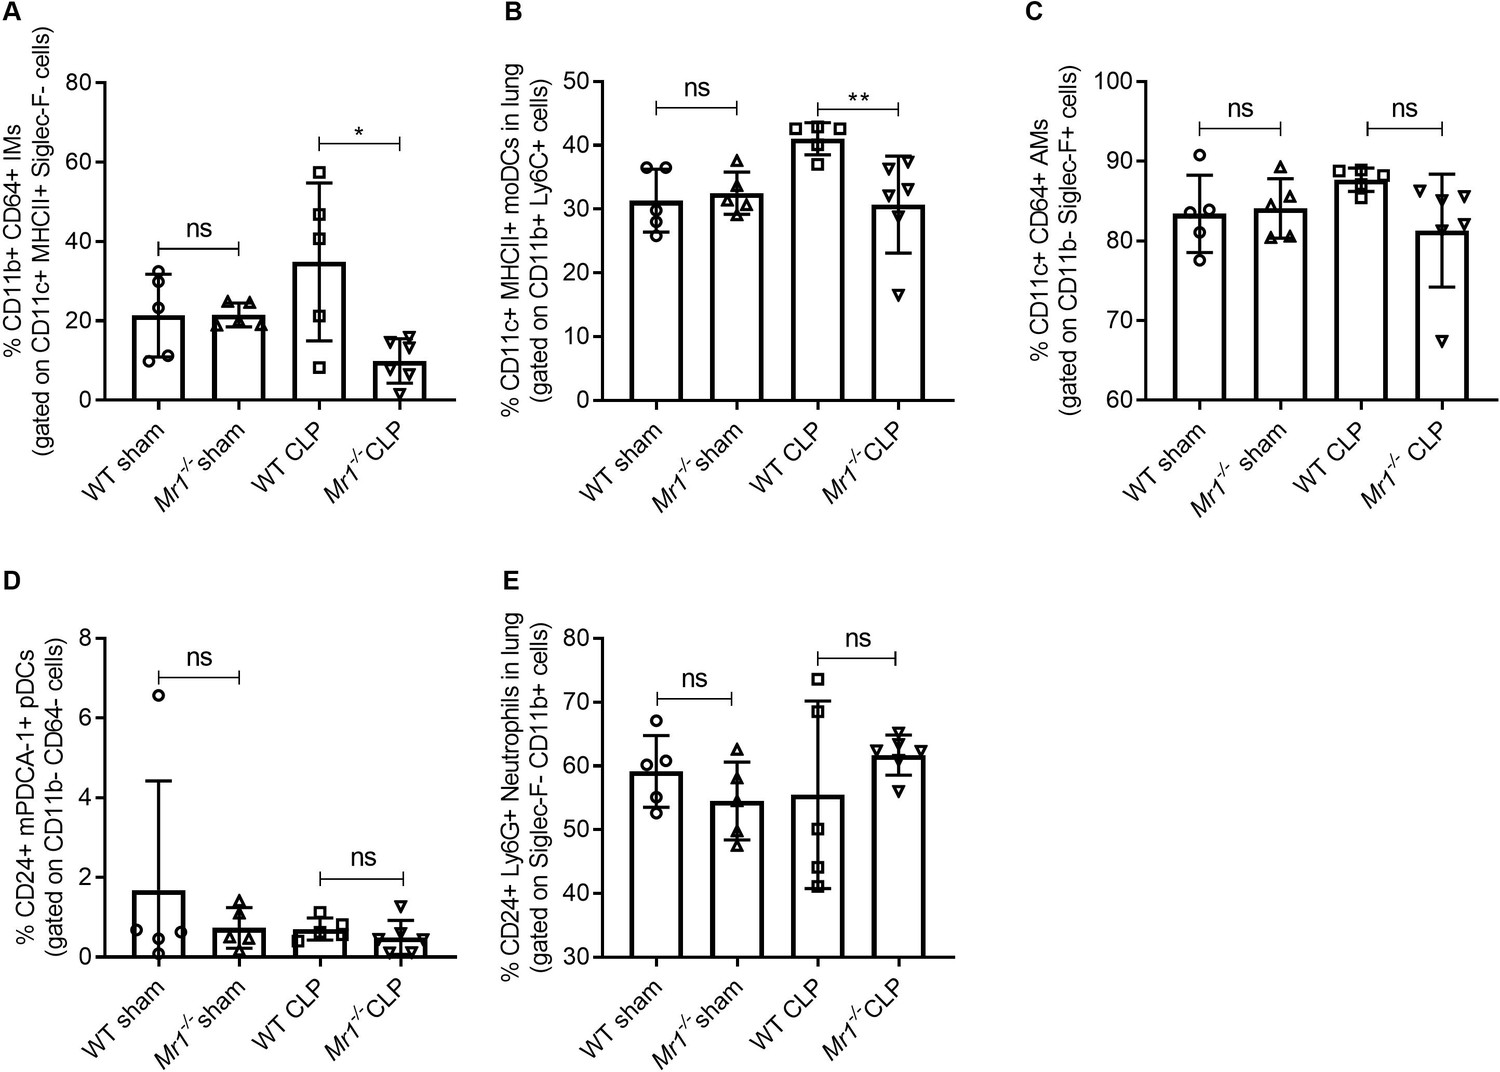
Lower frequencies of interstitial macrophages and monocytic dendritic cells in the lungs of Mr1-/- mice at 18 hr post-CLP.
Lung cells were obtained from WT (n = 5) and Mr1-/- mice (n = 5–6) at 18 hr post-CLP or sham operation, stained for surface markers, and analyzed using flow cytometry. Percentage frequencies of (A) interstitial macrophages, (B) monocytic dendritic cells, (C) alveolar macrophages, (D) plasmacytoid dendritic cells, and (E) neutrophils were compared between the groups by the nonparametric Mann–Whitney test. Data were expressed as mean ± SD of two independent experiments.
Figure 5—figure supplement 1
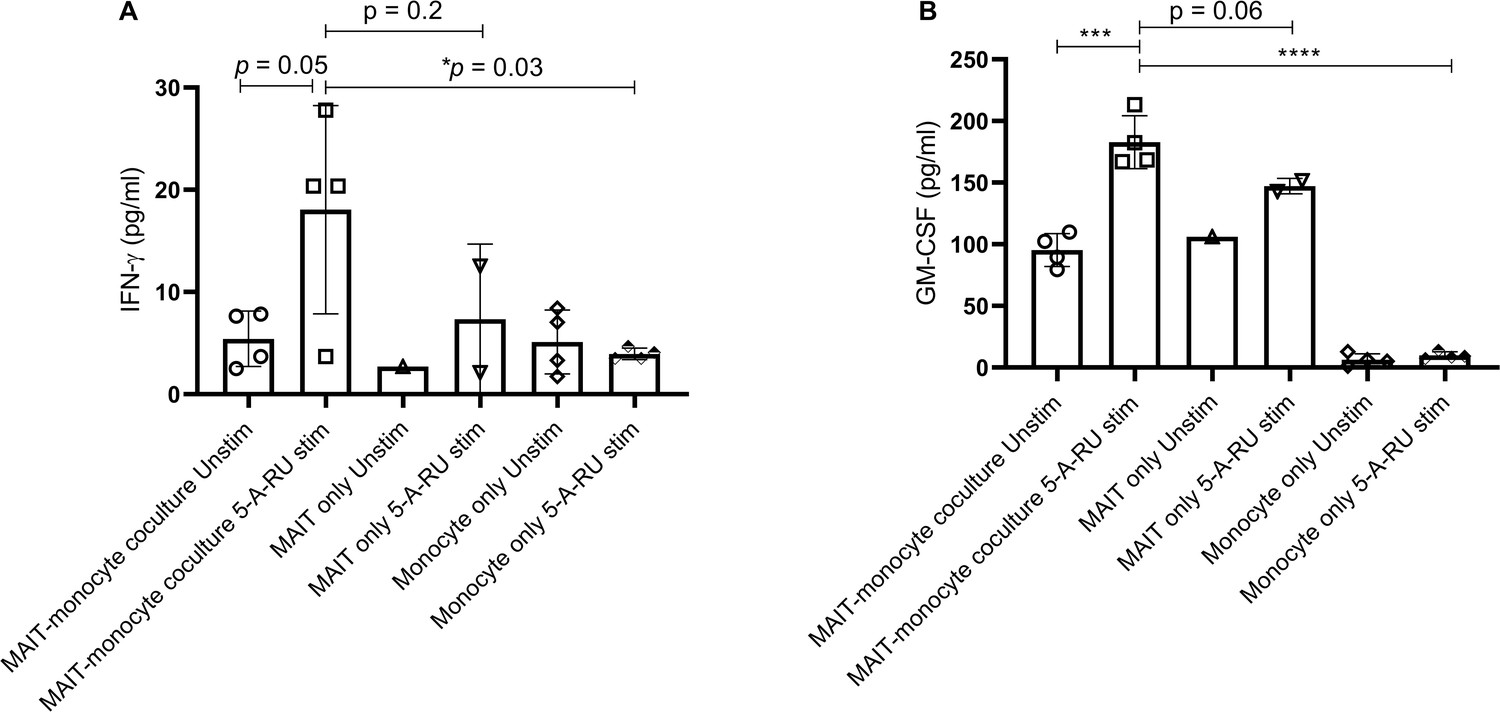
Higher amounts of IFN-γ and GM-CSF production in ex vivo stimulated MAIT-monocytes coculture.
Ex vivo expanded lung MAITs were cultured with Ly6C+ CD11b+ monocytes isolated from the lungs of WT mice for 18 hr. Levels of (A) IFN-γ and (B) GM-CSF in supernatants were measured using BioLegend ELISA MAX standard sets for mouse IFN-γ and mouse GM-CSF. Data shown are mean ± SD, and statistical significance was determined using the unpaired t-test (data passed the Shapiro-Wilk normality test).
Figure 5—figure supplement 2
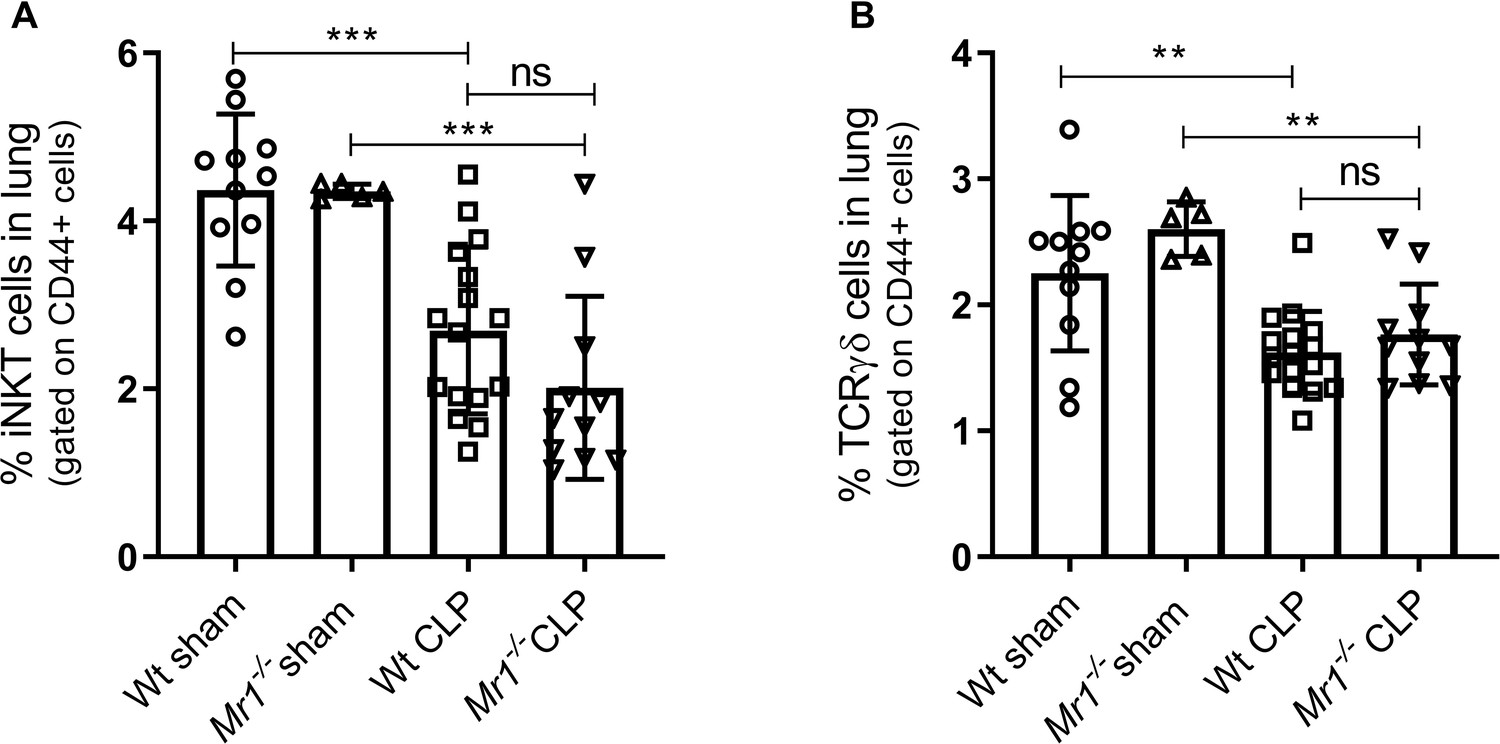
Frequencies of other unconventional T cells such as invariant natural killer T cells (iNKT) and γδ T cells post-CLP.
Lung cells were obtained from WT and Mr1-/- mice at 18 hr post-CLP or sham operation, stained for surface markers and analyzed using flow cytometry. Percentage frequencies of (A) iNKT cells and (B) γδ T cells were compared between the groups using one-way ANOVA with Tukey’s multiple comparison test.
Figure 6

Altered frequency and phenotype of human MAIT cells in sepsis compared to healthy donors (HD).
(A) Gating strategy for isolation of MAIT cells from PBMCs. (B) Percentage of MR1-tetramer+ MAIT cells in CD3+ T cells, (C) Representative flow plots and percentage of MAIT cells in paired Day 1 and Day 90 septic patients (n = 12 per group), (D) Representative flow plots and surface expression of activation markers as a percentage of MAIT cells, (E) Surface expression of inhibitory receptors, as a percentage of MAIT cells. Data were expressed as mean ± SD of two independent experiments. The Mann-Whitney test was used to compare HD with septic patients and the Wilcoxon test was used for comparisons of paired D1 and D90 samples. ***p<0.001, **p<0.01, *p<0.05. NS, p>0.05.
Figure 7
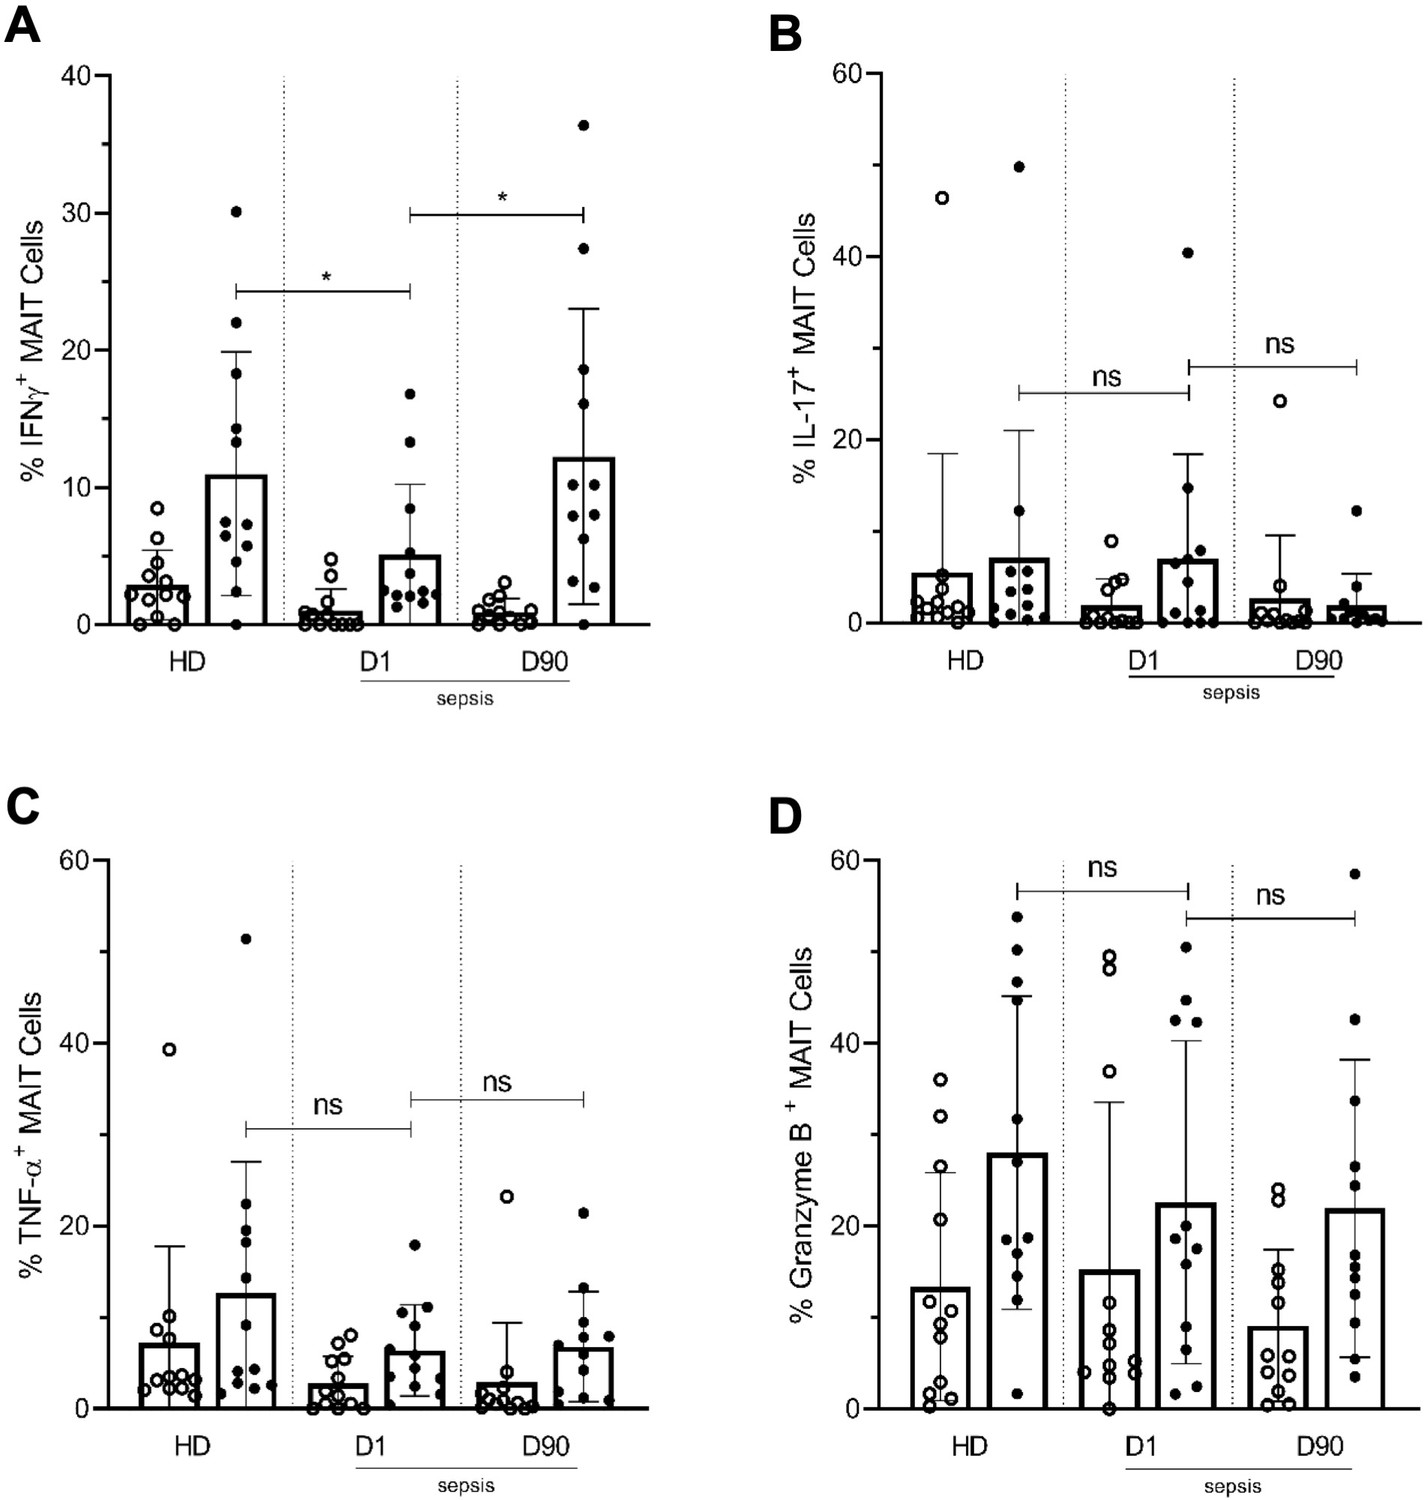
Lower frequencies of IFNγ+ MAIT cells in day one septic patients compared to HD and Day 90 paired septic patients.
PBMCs obtained from septic patients and healthy donors (n = 12 per group) were stimulated with E. coli at moi of 10 and intracellular expression of (A) IFN-γ, (B) IL-17, (C) TNF-α, and (D) granzyme B by MAIT cells were analyzed using flow cytometry (open circle shows unstimulated and closed circle shows stimulated data). Data were expressed as mean ± SD of two independent experiments. The Mann-Whitney test was used for comparisons of HD with septic patients and the Wilcoxon test was used for comparisons of paired D1 and D90 samples. ***p<0.001, **p<0.01, *p<0.05. NS, p>0.05.
Author response image 1
Tables
Key resources table
| Reagent type (species) or resource | Designation | Source or reference | Identifiers | Additional information |
|---|---|---|---|---|
| Antibody | FITC anti-mouse CD3 antibody (rat monoclonal) | BioLegend | Cat# 100203 | (1:50) |
| Antibody | Brilliant Violet 510 anti-mouse NK-1.1 (mouse monoclonal) | BioLegend | Cat# 108738 | (1:50) |
| Antibody | BV711 anti-mouse CD49b (hamster monoclonal) | BD | Cat# 740704 | (1:100) |
| Antibody | PE/Cyanine7 anti-mouse TCR γ/δ (hamster monoclonal) | BioLegend | Cat# 118123 | (1:100) |
| Antibody | BV421 anti-mouse TCRβ (hamster monoclonal) | BioLegend | Cat# 109229 | (1:100) |
| Antibody | PE/Cyanine5 anti-mouse/human CD45R/B220 (rat monoclonal) | BioLegend | Cat# 103209 | (1:100) |
| Antibody | Brilliant Violet 650 anti-mouse/human CD44 (rat monoclonal) | BioLegend | Cat# 103049 | (1:100) |
| Antibody | Alexa Fluor 700 anti-mouse CD45 (rat monoclonal) | BioLegend | Cat# 103127 | (1:200) |
| Antibody | FITC anti-mouse/human CD11b (rat monoclonal) | BioLegend | Cat# 101205 | (1:200) |
| Antibody | PE/Cyanine7 anti-mouse CD11c (hamster monoclonal) | BioLegend | Cat# 117317 | (1:100) |
| Antibody | BV711 anti-mouse Siglec-F (rat monoclonal) | BD | Cat# 740764 | (1:100) |
| Antibody | Brilliant Violet 605 anti-mouse CD64 (FcγRI) (mouse monoclonal) | BioLegend | Cat# 139323 | (1:50) |
| Antibody | PE anti-mouse CD24 (rat monoclonal) | BioLegend | Cat# 101807 | (1:100) |
| Antibody | PerCP/Cyanine5.5 anti-mouse Ly-6G (rat monoclonal) | BioLegend | Cat# 127616 | (1:100) |
| Antibody | BV510 anti-mouse CD103 (hamster monoclonal) | BioLegend | Cat# 121423 | (1:50) |
| Antibody | APC anti-mouse CD86 (rat monoclonal) | BioLegend | Cat# 105011 | (1:100) |
| Antibody | PE/Dazzle 594 anti-mouse Ly-6C (rat monoclonal) | BioLegend | Cat# 128043 | (1:100) |
| Antibody | Brilliant Violet 421 anti-mouse I-A/I-E (rat monoclonal) | BioLegend | Cat# 107631 | (1:100) |
| Antibody | Alexa Fluor 700 anti-human CD137 (4-1BB) (mouse monoclonal) | BioLegend | Cat# 309816 | (1:100) |
| Antibody | BUV395 Mouse Anti-Human CD3 | BD | Cat# 563548 | (1:200) |
| Antibody | Anti-human CD8 Monoclonal Antibody (3B5), PE-Cyanine5.5 | Thermo Fisher Scientific | Cat# MHCD0818 | (1:200) |
| Antibody | BUV496 Mouse Anti-Human CD4 | BD | Cat# 612937 | (1:100) |
| Antibody | Brilliant Violet 711 anti-human TCR Vα7.2 (mouse monoclonal) | BioLegend | Cat# 351731 | (1:50) |
| Antibody | Brilliant Violet 785 anti-human CD223 (LAG-3) (mouse monoclonal) | BioLegend | Cat# 369321 | (1:50) |
| Antibody | Brilliant Violet 650 anti-human CD25 (mouse monoclonal) | BioLegend | Cat# 302633 | (1:100) |
| Antibody | Brilliant Violet 605 anti-human CD279 (PD-1) (mouse monoclonal) | BioLegend | Cat# 329923 | (1:100) |
| Antibody | Brilliant Violet 510 anti-human CD161 (mouse monoclonal) | BioLegend | Cat# 339921 | (1:100) |
| Antibody | PE/Cyanine5 anti-human CD69 (mouse monoclonal) | BioLegend | Cat# 310907 | (1:100) |
| Antibody | FITC anti-human HLA-DR | BioLegend | Cat# 980402 | (1:50) |
| Antibody | Brilliant Violet 421 anti-human CD366 (Tim-3) (mouse monoclonal) | BioLegend | Cat# 345007 | (1:50) |
| Antibody | PE/Cyanine7 anti-human CD38 (mouse monoclonal) | BioLegend | Cat# 303515 | (1:100) |
| Antibody | FITC anti-human IL-17A Antibody (mouse monoclonal) | BioLegend | Cat# 512303 | (1:100) |
| Antibody | PE/Cyanine7 anti-human IFN-γ (mouse monoclonal) | BioLegend | Cat# 502527 | (1:200) |
| Antibody | Anti–human TNF alpha Monoclonal Antibody (MAb11), eFluor 450 | Thermo Fisher Scientific | Cat# 48-7349-42 | (1:100) |
| Antibody | Alexa Fluor 700 anti-human/mouse Granzyme B | BioLegend | Cat# 372221 | (1:100) |
Additional files
Download links
A two-part list of links to download the article, or parts of the article, in various formats.
Downloads (link to download the article as PDF)
Open citations (links to open the citations from this article in various online reference manager services)
Cite this article (links to download the citations from this article in formats compatible with various reference manager tools)
Mucosal-associated invariant T (MAIT) cells mediate protective host responses in sepsis
eLife 9:e55615.
https://doi.org/10.7554/eLife.55615


