A unified computational model for cortical post-synaptic plasticity
- Simula Research Laboratory, Norway
- Department of Biosciences, University of Oslo, Norway
- Faculty of Science and Technology, Norwegian University of Life Sciences, Norway
- Department of Physics, University of Oslo, Norway
- The Krasnow Institute for Advanced Study, George Mason University, United States
Figures
Figure 1
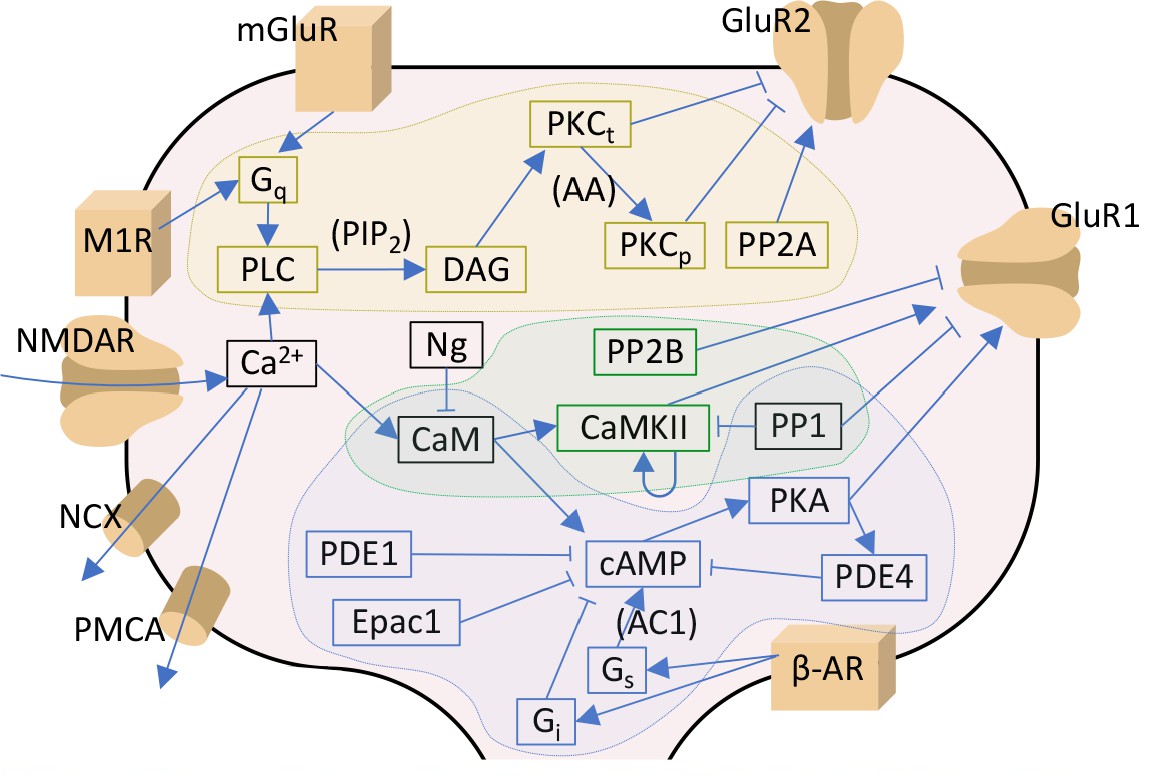
Signalling pathways included in the model.
The PKA-pathway-related proteins and signalling molecules are highlighted by blue, PKC-pathway molecules by yellow, and CaMKII-pathway molecules by green colours. Reactions associated with a molecular species in parenthesis indicate a dependency on the denoted species — for details, see Table 3. Acronyms: β-AR – β-adrenergic receptor; AC1 and AC8 – adenylyl cyclase type 1 or 8; CaM – calmodulin; CaMKII – calmodulin-dependent protein kinase II; cAMP – cyclic adenosine monophosphate; DAG – diacylglycerol; Epac1 – exchange factor directly activated by cAMP 1; Gi, Gq and Gs – G-protein type I, Q, or S; GluR1 and GluR2 – AMPAR subunit 1 or 2; mGluR – metabotropic glutamate receptor; M1R – cholinergic receptor M1; NCX – Na+-Ca2+ exchanger; Ng – neurogranin; NMDAR – NMDA receptor; PDE1 and PDE4 – phosphodiesterase type 1 or 4; PIP2 – phosphatidylinositol 4;5-bisphosphate; PKA – protein kinase A; PKCt and PKCp – transiently or persistently active protein kinase C; PLC – phospholipase C; PMCA – plasma membrane Ca2+ ATPase; PP1 – protein phosphatase 1; PP2A – protein phosphatase 2A; PP2B – protein phosphatase 2B (calcineurin). In this work, the NMDARs are considered only in section 'Paired pre- and post-synaptic stimulation induces PKA- and PKC-dependent spike-timing-dependent plasticity (STDP) in GluR1-GluR2-balanced synapses': in the rest of the work, Ca2+ is directly injected as a square-pulse current into the spine.
Figure 2

Ca2+ activates CaMKII, PKA, and PKC pathways.
(A) Illustration of the stimulus protocols with Ca2+ flux amplitudes 150 (green), 200 (cyan), and 250 (purple) particles/ms. (B–F) Time courses of Ca2+ (in nM) bound to buffers (B), pumps (C), PKC-pathway proteins (D), or CaM (E), and the concentration of free Ca2+ ions (F), according to NeuroRD (solid; averaged across eight samples) or NEURON (dashed) simulations. Colours indicate the Ca2+ flux used (see A). (B) Number of Ca2+ ions bound to Ca2+ buffers, that is immobile buffer and calbindin. (C) Number of Ca2+ ions bound to Ca2+ pumps and exchangers, that is PMCA and NCX. (D) Number of Ca2+ ions bound to PKC-pathway proteins PLC and PLA2. (E) Number of Ca2+ ions bound to CaM, in all its forms. (F) Cytosolic Ca2+ concentration (mM) (G) Degrees of activation of different Ca2+-binding proteins in a steady state (5 min after onset of Ca2+ input) as a function of the magnitude of Ca2+ flux. The x-axis shows the amplitude of the Ca2+ input (see panel A), and the y-axis shows the ratio of the underlying species in a Ca2+-bound form over the total number of the proteins. For CaM, only the CaM molecules bound by four Ca2+ ions are considered activated — in PLC, PLA2, and DGL, binding of only one Ca2+ ion is needed for activation. Here, the measured quantity of active PLC includes both Gq-bound and non-Gq-bound CaPLC. Inset: zoomed-in view on the red area. (H) Ratio of the steady-state concentration of PKA catalytic subunit over the theoretical maximum where all PKA molecules were dissociated into residuals and catalytic subunits. Colour of the curve indicates the amplitude of the β-adrenergic ligand flux (particles/ms). (I) Fraction of phosphorylated CaMKII subunits. (J) Fraction of (transiently or persistently) activated PKC. Colour of the curve indicates the amplitude of the cholinergic and glutamatergic ligand flux (particles/ms). The grey area in panels (G–J) represents Ca2+ inputs that cause cytosolic Ca2+ concentration to reach extremely high levels (>1 mM) that are likely to lead to apoptosis.
Figure 3 with 4 supplements
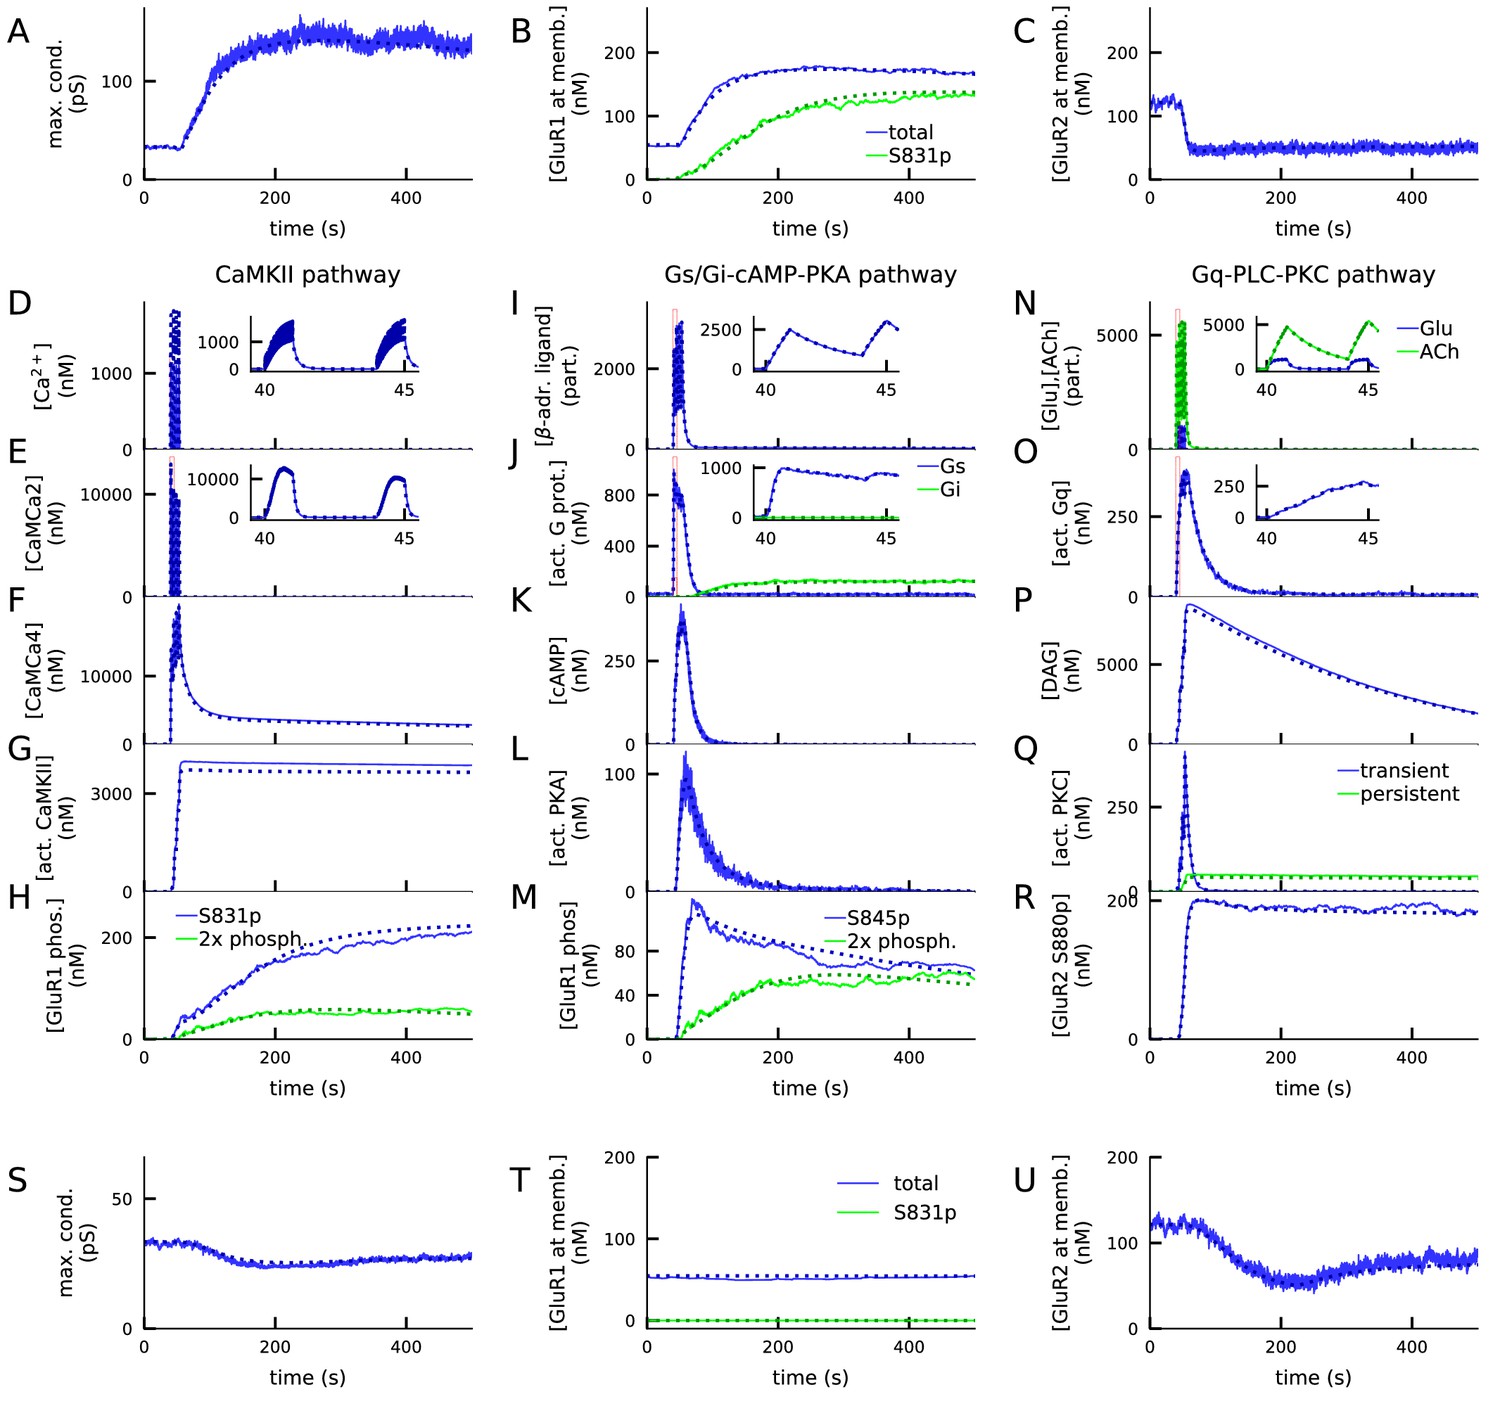
4xHFS activates CaMKII, PKA, and PKC pathways and leads to LTP (A–R), while LFS activates the PKC pathway and leads to LTD (S–U).
(A) Total synaptic conductance in response to 4xHFS, determined by the numbers of membrane-inserted GluR1s and GluR2s — see Equation 5. The stimulation starts at 40 s and lasts until 53 s. (B–C) Concentration of membrane-inserted GluR1s (B) and GluR2s (C) in response to 4xHFS. (D–H) Concentration of different species in the CaMKII pathway, namely, intracellular unbound Ca2+ (D), CaM bound with two Ca2+ ions (E), CaM bound with four Ca2+ ions (active CaM; F), phosphorylated CaMKII, bound or unbound by CaMCa4 (G), and S831-phosphorylated and double-phosphorylated GluR1 subunits (H) in response to 4xHFS. (I–M) Concentration of different species in the cAMP-PKA pathway, namely, β-adrenergic ligand in all its forms (I), activated (GTP-bound but not bound to ATP) Gs and Gi proteins (J), intracellular cAMP (K), catalytic subunit of PKA (L), and S845-phosphorylated and double-phosphorylated GluR1 subunits (M) in response to 4xHFS. (N–R) Concentration of different species in the PLC-PKC pathway, namely, glutamate and acetylcholine in all their forms (N), activated (GTP-bound but not bound to DAG) Gq proteins (O), intracellular DAG (P), activated PKC (Q), and S880-phosphorylated GluR2 subunits (R) in response to 4xHFS. S: Total synaptic conductance in response to LFS. (T–U) Concentration of membrane-inserted GluR1s (T) and GluR2s (U) in response to LFS, which starts at 40 s and lasts until 220 s. The solid lines represent stochastic (NeuroRD) simulation results, while the dashed lines represent data from deterministic (NEURON RxD) simulations. β-adrenergic ligands, glutamate, and acetylcholine are measured in numbers of particles as they reside both at the membrane (when bound to receptors) and at the extracellular subspace near the spine membrane (when unbound); other species measured in concentration.
Figure 3—figure supplement 1
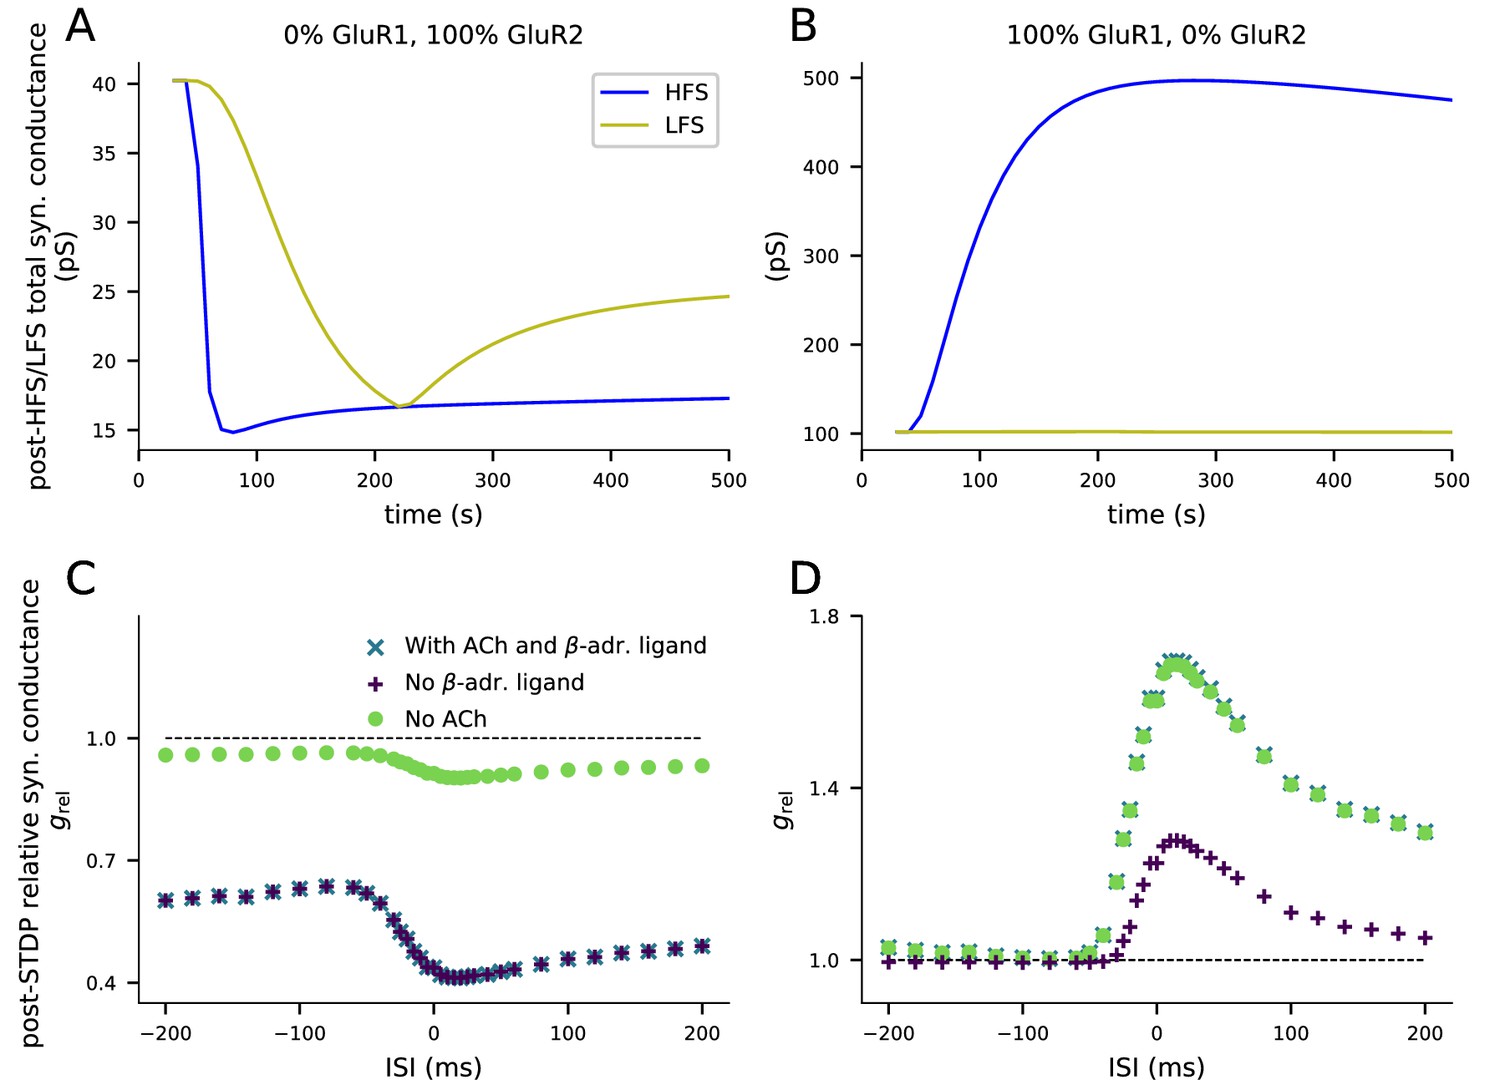
Both GluR1 and GluR2 are needed for bidirectional plasticity.
(A) When GluR1 subunits are absent, 4xHFS induces LTD instead of LTP. (B) When GluR2 subunits are absent, LFS does not lead to changes in synaptic conductance. (C) When GluR1 subunits are absent, the paired-stimulus protocol induces acetylcholine-mediated LTD but not β-adrenergic ligand-mediated pairing interval-dependent LTP. (D) When GluR2 subunits are absent, the paired-stimulus protocol induces β-adrenergic ligand-mediated pairing interval-dependent LTP, but not acetylcholine-dependent LTD. (A–B) The y-axis shows the total synaptic conductance, and the x-axis shows the time. The 4xHFS stimulation lasts from 40 to 53 s, and the LFS stimulation from 40 to 220 s. See Figure 3 for details. (C–D) The y-axis shows the relative synaptic conductance, and the x-axis shows the inter-stimulus interval (ISI). See Figure 5 for details.
Figure 3—figure supplement 2
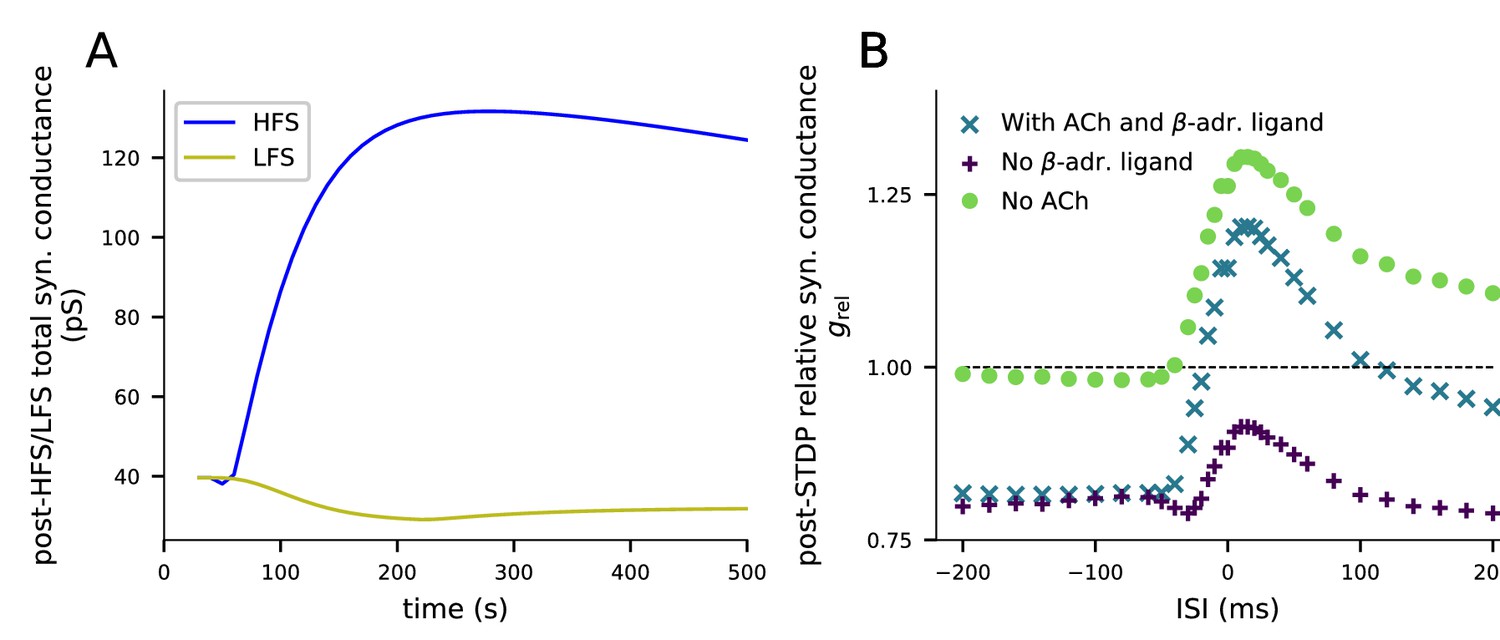
An alternative dimers-of-like-dimers rule of tetramer formation reproduces the HFS-induced LTP, LFS-induced LTD, and STDP predictions obtained with the default tetramer formation rule.
(A) Plasticity induced by HFS and LFS. The y-axis shows the total synaptic conductance, and the x-axis shows the time. The 4xHFS stimulation lasts from 40 to 53 s, and the LFS stimulation from 40 to 220 s. See Figure 3 for details. (B) Plasticity induced by pairing protocol in the presence of various neuromodulators. The y-axis shows the relative synaptic conductance, and the x-axis shows the inter-stimulus interval (ISI). See Figure 5 for details. In all these experiments, a dimers-of-like-dimers rule of tetramer formation was used. 35% of the GluR subunits were GluR1 type and 65% GluR2.
Figure 3—figure supplement 3
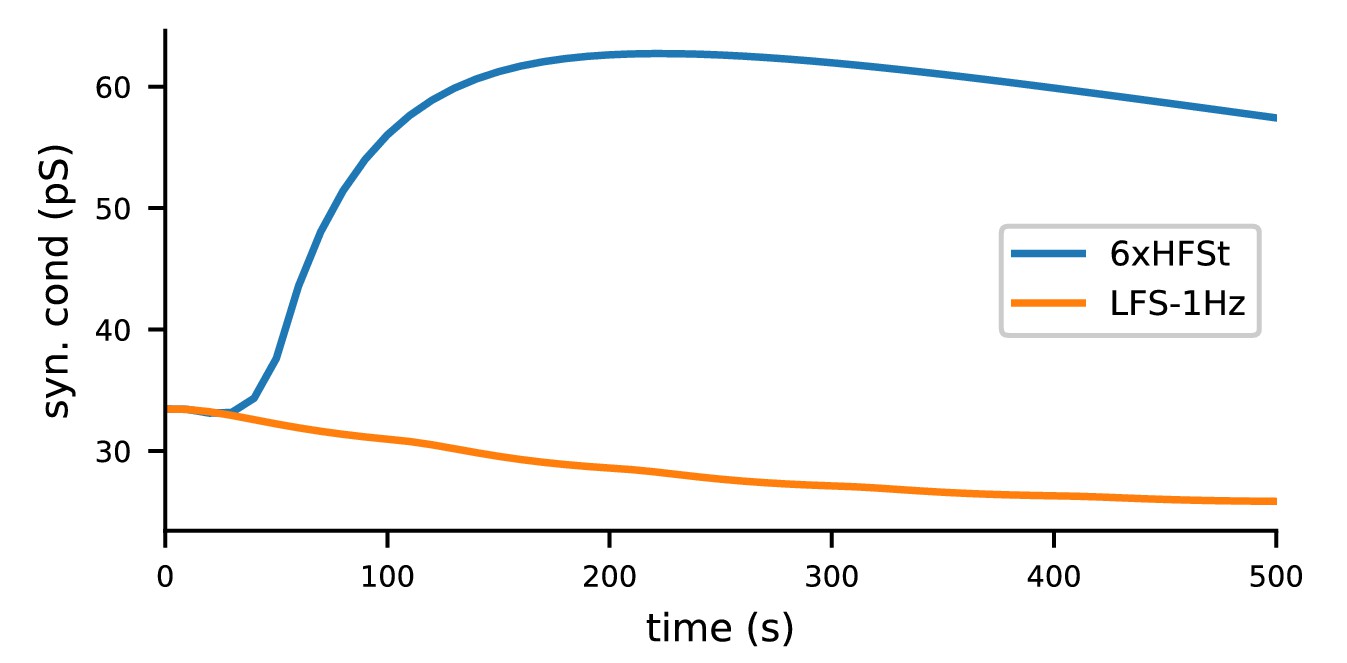
The biochemical signalling network model, given the NMDAR-conducted Ca2+ inputs from the multicompartmental neuron model of layer 2/3 pyramidal cell under 1.3 mM extracellular [Mg2+], predicts LTP for 6xHFSt and LTD for LFS-1Hz.
The 6xHFSt protocol lasts from 0 to 60 s, while the LFS-1Hz protocol lasts from 0 to 1800s (data shown until 500 s). See Materials and methods, section 'Modelling the Ca2+ inputs and neuromodulatory inputs' for details on the stimulation protocols and the multicompartmental neuron model. All initial concentrations of the biochemical model were the same as in Figure 3.
Figure 3—figure supplement 4
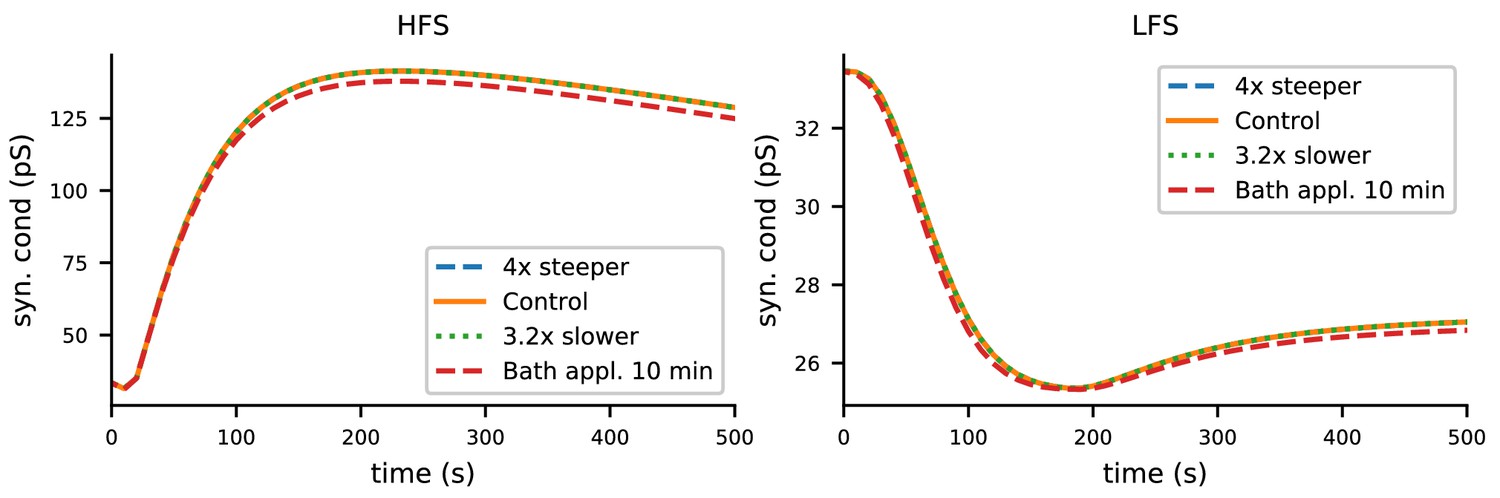
The biochemical signalling network model robustly predicts LTP for HFS and LTD for LTP with altered durations of neuromodulatory inputs.
In the control case, the pre-synaptic input-associated fluxes of β-adrenergic and cholinergic ligands were 10 and 20 particles/ms, respectively, and the duration of each pulse was 3 ms. Here, the ligand inputs were made four times steeper by reducing the duration to 0.75 ms and the increasing the amplitudes to 40 (β-adrenergic) and 80 (cholinergic) particles/ms (blue), or 3.2 times less steep by increasing the duration to 9.6 ms and reducing the amplitudes to 3.125 (β-adrenergic) and 6.25 (cholinergic) particles/ms (green). Both alterations gave LTP and LTD responses that were indistinguishable from those of the control case. The red dashed line shows the LTP and LTD responses where the pre-synaptic input-associated fluxes of β-adrenergic and cholinergic ligands were replaced by a 10 min pulses of amplitudes 0.4 (β-adrenergic) and 0.8 (cholinergic) particles/ms, respectively, initiated 6 min prior to the pre-synaptic inputs to mimic the bath application of corresponding agents.
Figure 4

4xHFS-induced LTP is dependent on β-adrenergic ligands and LFS-induced LTD is dependent on activation of mGluRs or cholinergic receptors.
(A–D) 4xHFS-induced LTP in the control case (dark purple), without Ca2+ inputs (blue), without β-adrenergic ligands (green), and under blockade of PKC pathway-activation (mGluRs or cholinergic receptors; yellow). (E–H) LFS-induced LTD in the control case (dark purple), under the blockade of mGluR activation (blue), and under blockade of both mGluRs or cholinergic receptors (yellow). (A, E) Total synaptic conductance. (B, F) Membrane expression of GluR1. (C, G) Membrane expression of GluR2. (D, H) The fraction of membrane-inserted GluR1 over all membrane-inserted GluR subunits (left), the probability of an AMPAR tetramer being homomeric GluR1 (middle), and the relative contribution of homomeric GluR1 subunits to the total conductance (i.e., summed conductance of homomeric GluR1 tetramers divided by the summed conductance of all tetramers; right). The bars represent the values at the end of the 4xHFS (D) or LFS (H) simulation with (dark purple) and without (yellow) PLC-activating ligands.
Figure 5 with 1 supplement
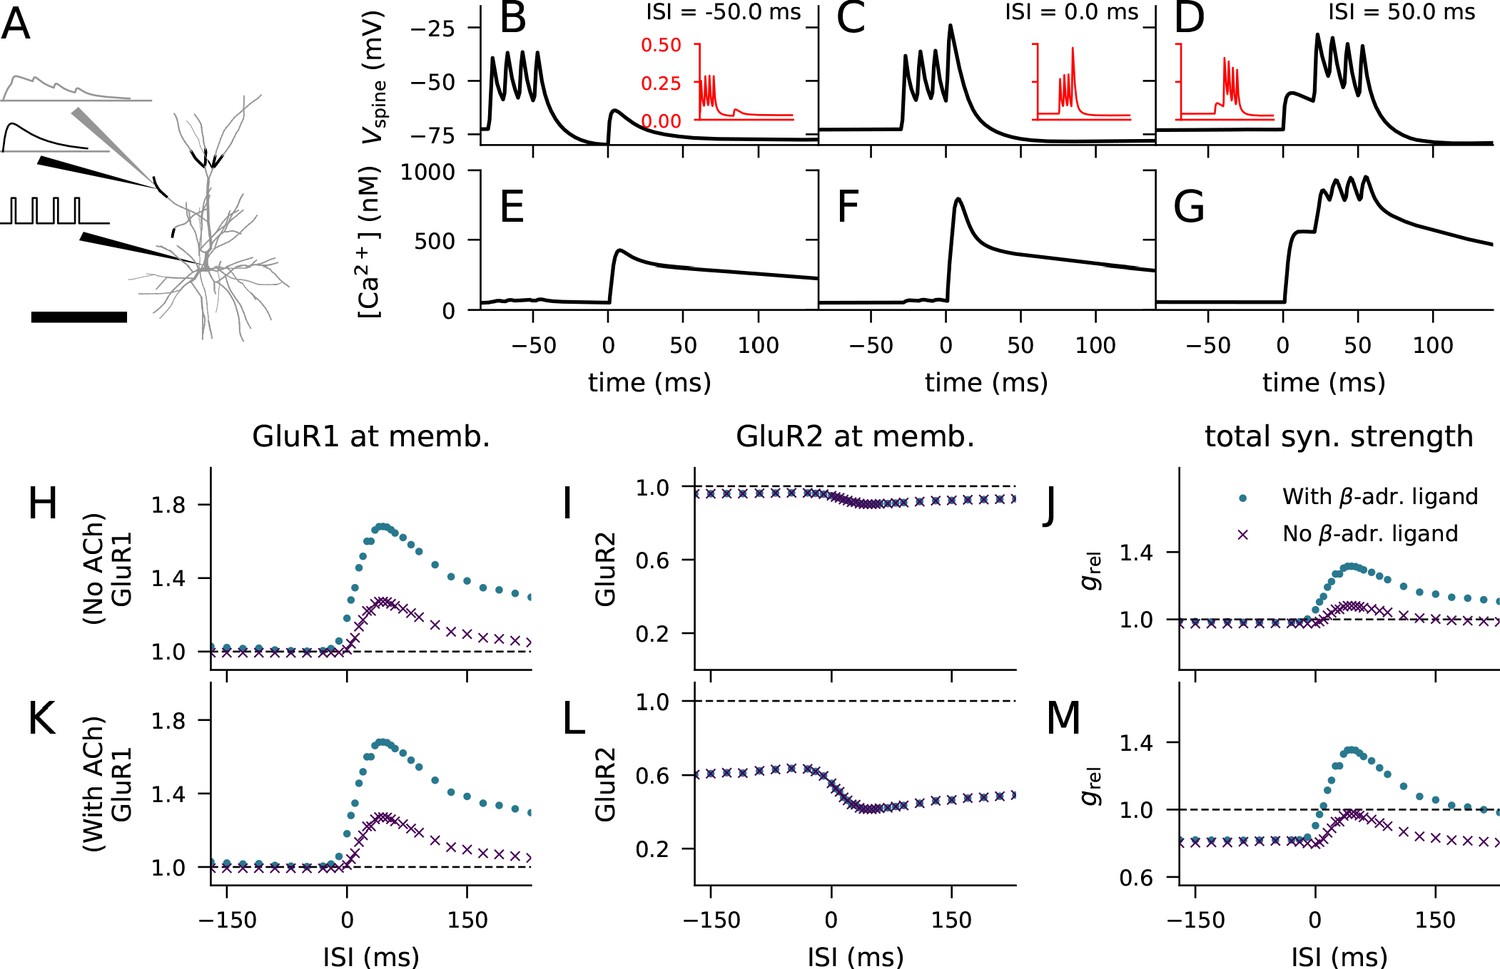
Layer 2/3 pyramidal cell plasticity in response to STDP protocol depends on neuromodulatory state and pairing interval.
(A) Layer 2/3 pyramidal cell morphology (grey, thin), locations of synaptic input highlighted (black, thick). Inset: Illustration of the inputs (black) and the recorded synaptic intracellular Ca2+ (grey). Scale bar 200 μm. (B–D) Membrane potential at the dendritic spine when the pre-synaptic stimulation onset is 50 ms after (B), at the same time as (C), or 50 ms prior to (D) the onset of the last somatic stimulus. Inset (red): Mg2+-gate variable as a function of time, ranging from −80 ms to 140 ms in a similar manner as the data in the main panel. (E–G) Concentration of free Ca2+ in the dendritic spine according to the biochemical spine model when the pre-synaptic stimulation onset is 50 ms after (B), at the same time as (C), or 50 ms prior to (D) the onset of the last somatic stimulus. (H–J) No LTD was induced by the stimulation protocol (1 Hz paired with post-synaptic stimulation for 2 min) in the absence of M1-receptor activation, but pairing-interval-dependent LTP was induced in presence of β-adrenergic inputs. (K–M) Pairing-interval-dependent LTD was induced when the synaptic input was coupled with cholinergic inputs, and STDP was induced when both cholinergic and β-adrenergic inputs were present. (H, K) Relative concentration of GluR1 at the membrane 16 min after the stimulation onset (normalised by concentration of membrane-inserted GluR1 at rest). (I, L) Relative concentration of GluR2 at the membrane 16 min after the stimulation onset (normalised by concentration of membrane-inserted GluR2 at rest). (J, M) Relative synaptic conductance (Equation 5) 16 min after the stimulation onset (normalised by synaptic conductance at rest).
Figure 5—figure supplement 1
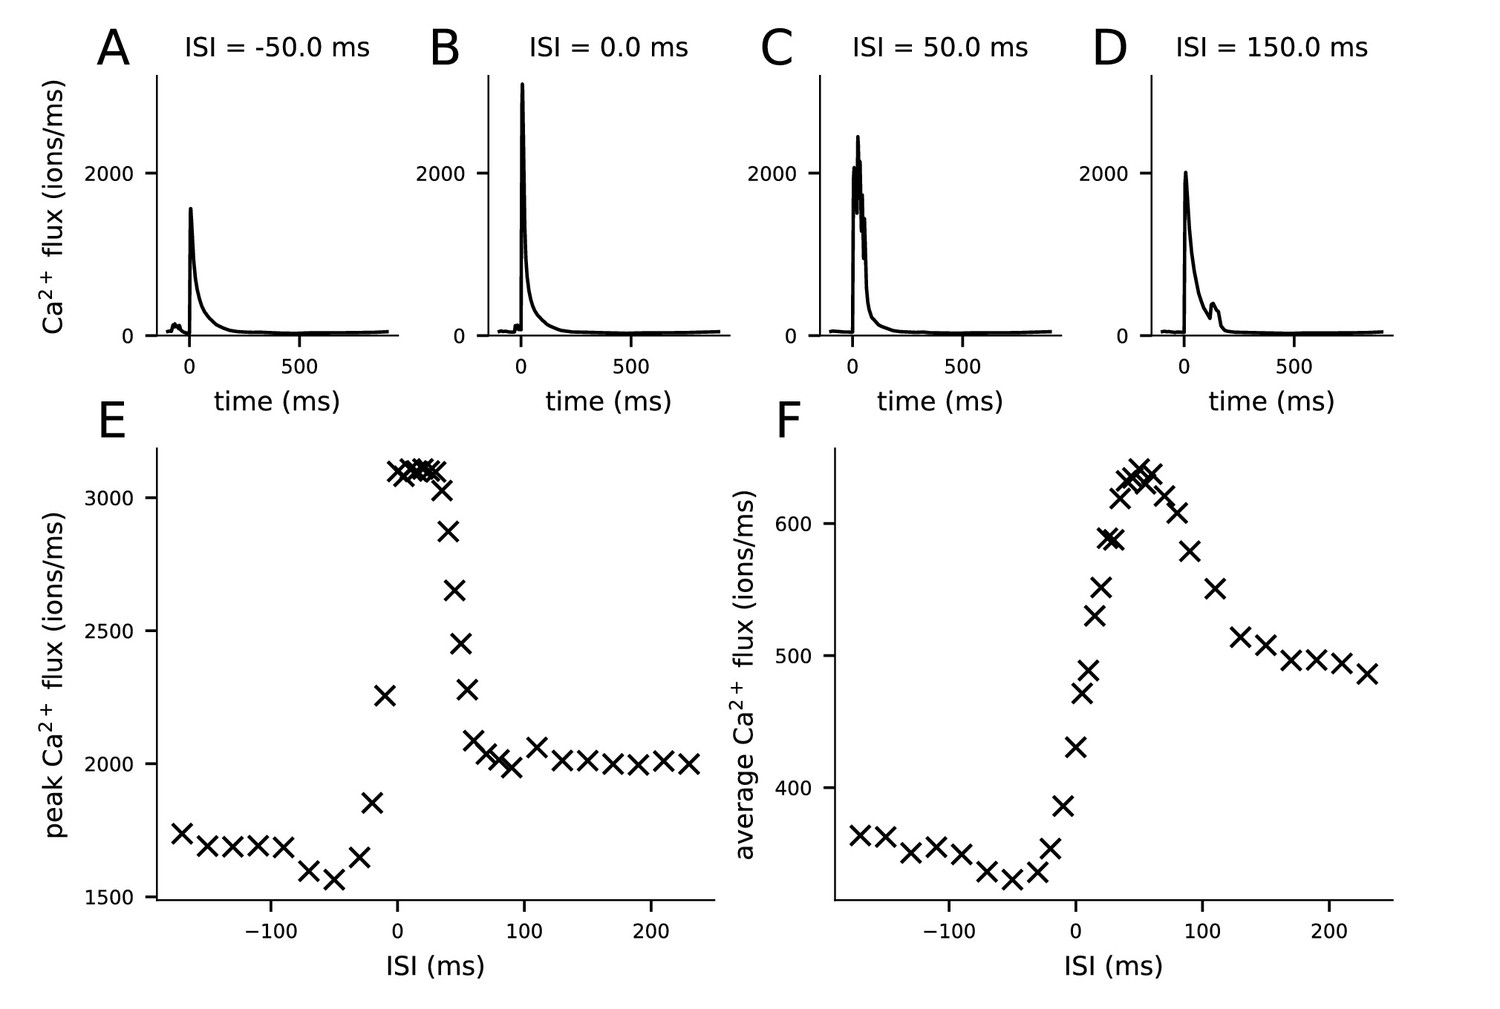
Ca2+ fluxes predicted by the multicompartmental layer 2/3 pyramidal cell model depend on the inter-stimulus interval (ISI).
(A–D) The Ca2+ flux time course during the pairing protocol (from 100 ms before to 900 ms after the pre-synaptic stimulus) entering the post-synaptic spine through NMDA receptors when the onset of the last of the four post-synaptic stimuli is 50 ms before (A), coincident with (B), 50 ms after (C), or 150 ms after (D) the onset of the pre-synaptic stimulus. (E) Peak Ca2+ flux (from the data of panels A–D) for different ISIs. (F) Average Ca2+ flux (averaged across the time points of panels A–D, i.e., −100 to 900 ms) for different ISIs.
Figure 6 with 1 supplement
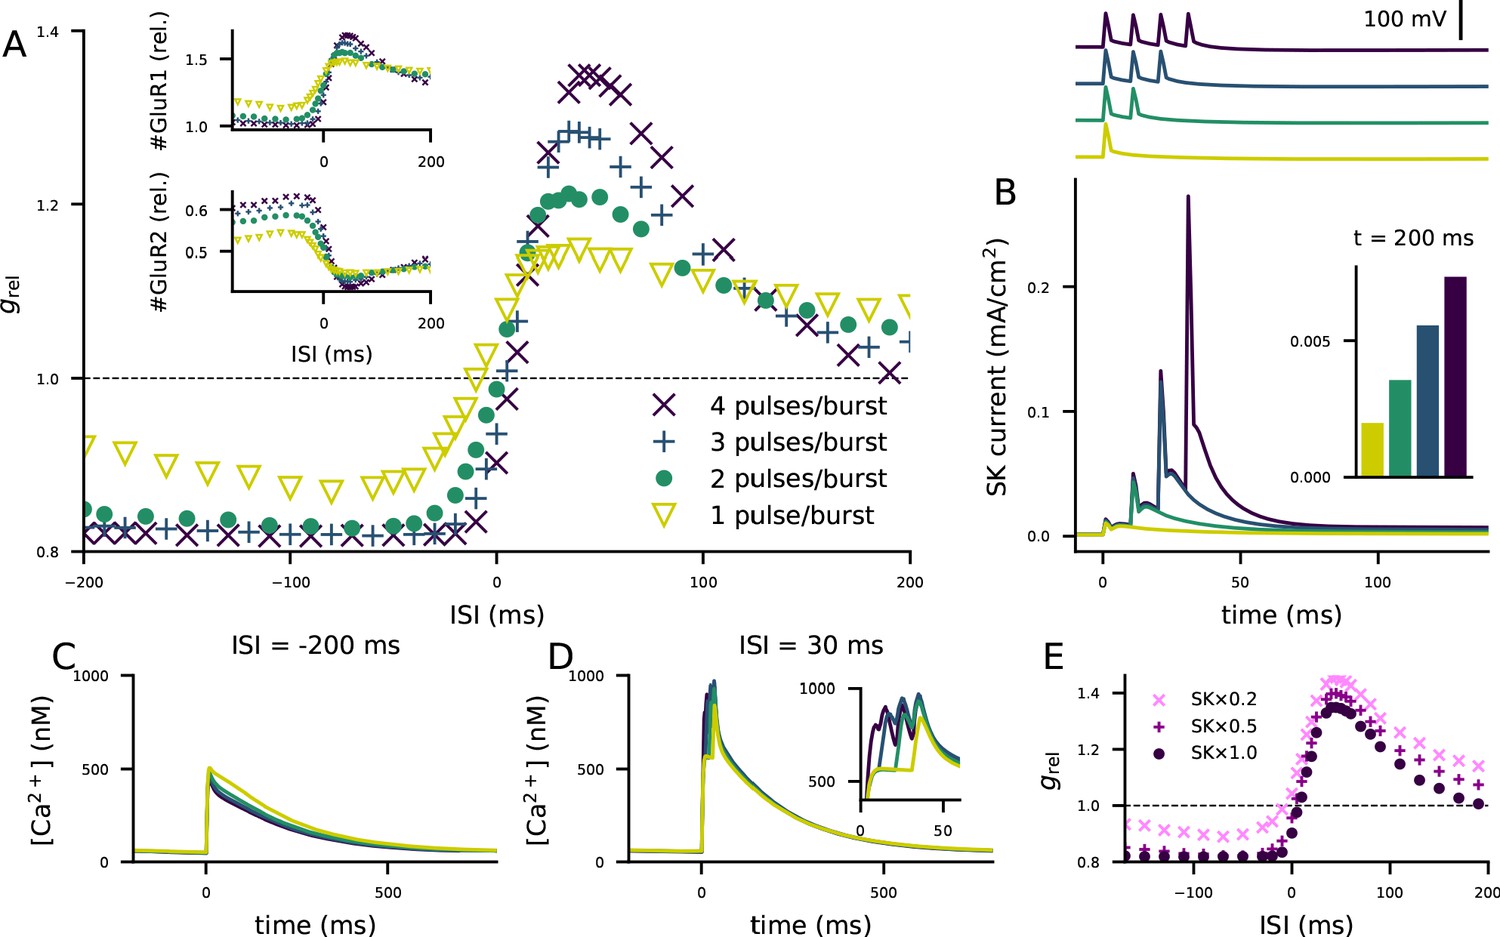
The STDP curve of layer 2/3 pyramidal cells is affected by the number of post-synaptic stimulus pulses associated with the pre-synaptic input.
(A) The STDP curves of Figure 5M when the number of spikes per post-synaptic burst was 1 (yellow), 2 (green), 3 (blue), or 4 (as in Figure 5; dark purple). Inset: relative concentrations of membrane-inserted GluR1 (top) or GluR2 (bottom) subunits — see Figure 5K–L for reference. (B) Top: somatic membrane potential time course (aligned according to the onset of the first stimulus) for different numbers of post-synaptic stimulus pulses. Bottom: somatic SK current-density time course in the four conditions. Inset: the SK current densities 200 ms after the onset of the first post-synaptic stimulus. (C–D) Ca2+ flux to the dendritic spine when the pre-synaptic stimulation onset is 200 ms after (C) or 30 ms before (D) the onset of the last post-synaptic stimulus. (E) The STDP curves of Figure 5M when the number of spikes per post-synaptic burst was four but the somatic SK conductance parameter was either normal (dark purple), 50% smaller (magenta), or 80% smaller (pink).
Figure 6—figure supplement 1
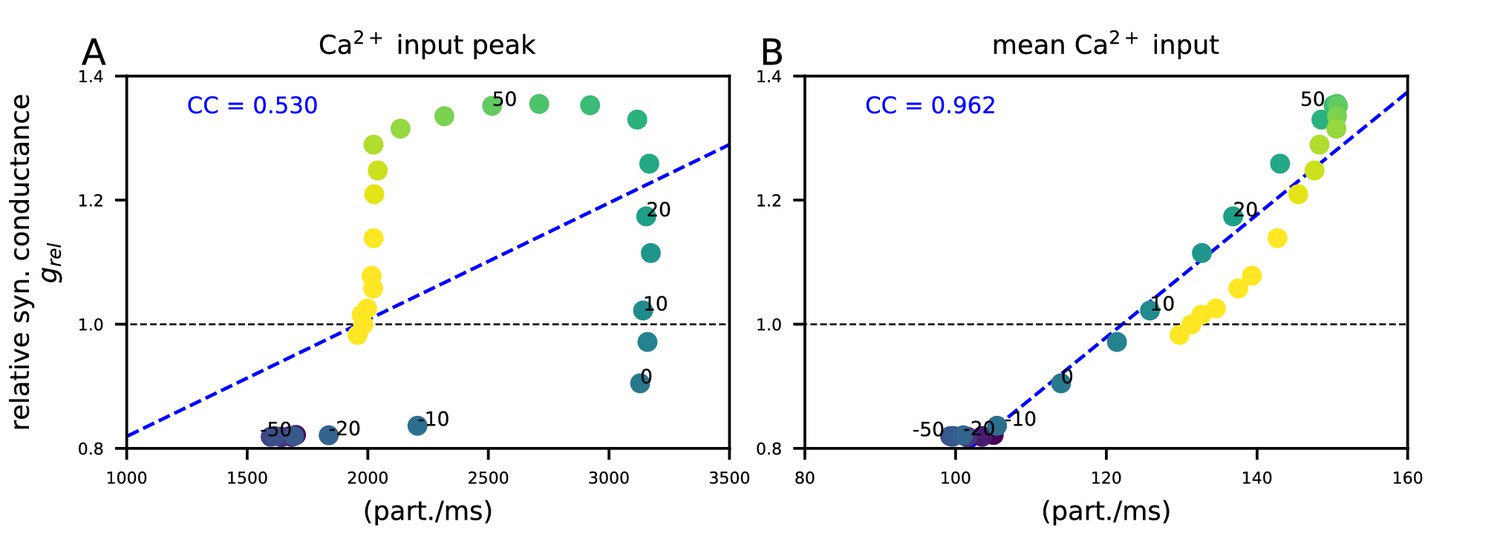
The post-STDP synaptic conductance is weakly correlated with the peak of the Ca2+ input but strongly correlated with the mean Ca2+ input during the inter-stimulus interval.
The y-axis shows the post-STDP synaptic conductance (in presence of β-adrenergic and cholinergic neuromodulation) relative to baseline as in Figure 5M. (A) The x-axis shows the peak Ca2+ input (in particles/ms) for different ISIs (see Figure 5D–F and Figure 5—figure supplement 1E). (B) The x-axis shows the time integral of Ca2+ input of Figure 5D–F from −500 to 500 ms, normalized by 1000 ms (see Figure 5—figure supplement 1F). Different colours represent different ISIs between −200 and 200 ms (intervals 0,±10,±20, and ±50 labeled for reference). The blue dashed line shows the linear regression, and the blue text shows the corresponding Pearson correlation coefficient.
Figure 7 with 1 supplement
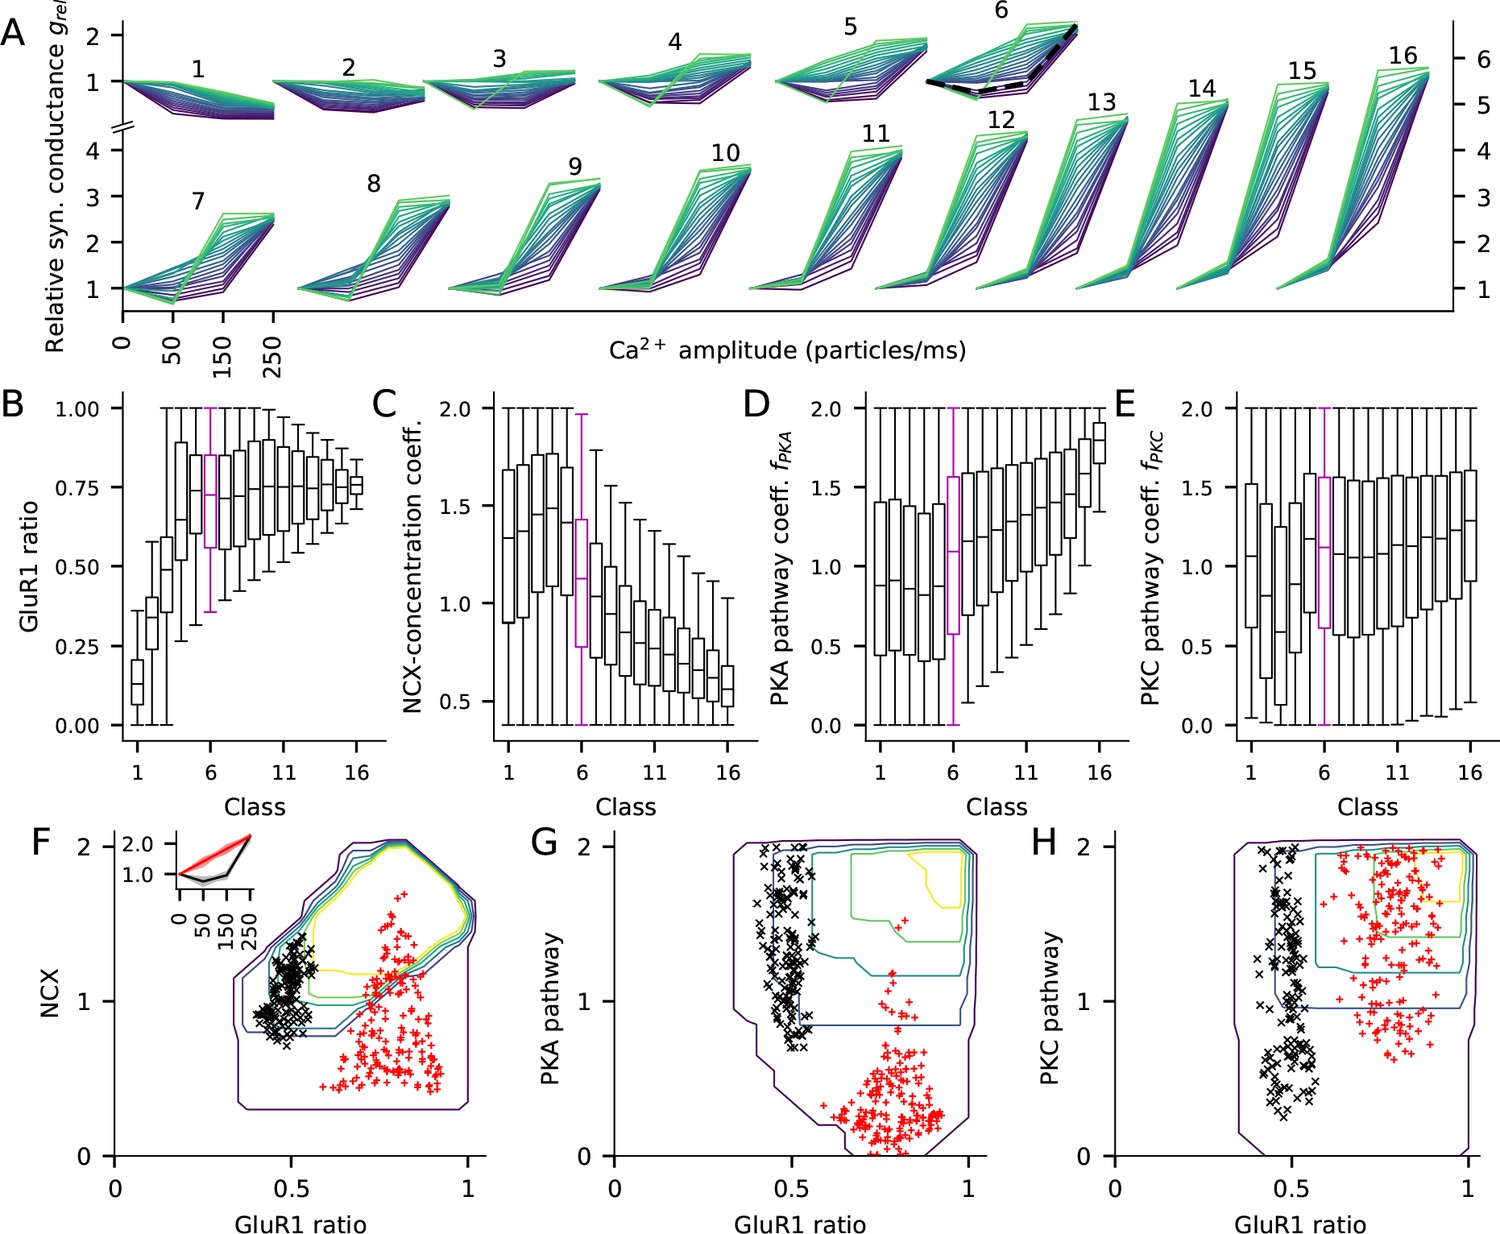
The fraction of GluR1s, number of Ca2+ extrusion proteins, and the concentrations of PKA and PKC-pathway proteins in the post-synaptic spine determine the type of LTP/LTD in the post-synaptic spine.
(A) The LTP/LTD curves for all 16 classes. Four values of Ca2+ input amplitude were considered: 0, 50, 150, and 250 particles/ms (x-axis; repeated and overlaid for space). The y-axis shows the relative synaptic conductance, that is, total synaptic conductance 15 min after the onset of the Ca2+ input divided by the total synaptic conductance before the Ca2+ input. 20 representative parameter sets are displayed from each class, coloured from purple (lowest relative synaptic conductance response for medium Ca2+ input) to green (highest conductance). The black, dashed trace in class six represents the model with the default concentration parameters. (B–E) Distribution of model parameters, that is, GluR1 ratio (B), NCX-concentration coefficient (C), PKA pathway-concentration coefficient (D), and PKC pathway-concentration coefficient in the 16 classes. Class 6 (purple) highlighted for further analysis. F–H: GluR1 ratio plotted against NCX-concentration coefficient (F), (G), and (H) in class 6. The contours represent the distribution of parameters (N = 5837) that produced class-6 plasticity. No parameters yielding class-6 plasticity were found beyond the purple contour, and the inner contours cover the parameter space where the distribution is higher than 0%, 20%, 40%, 60% or 80% of the maximal density value. The black and red markers represent parameter sets that produced two plasticity subclasses, namely, one where the total deviance (summed absolute difference) from the BCM-type plasticity produced by the default parameter set (black, N = 145) or from a linearly increasing LTP (red, N = 183) was less than 0.2 (a.u.). Inset: The LTP/LTD plasticity curves of the two subclasses. The thick lines represent the centre of the subclasses (black: relative conductances in response to 50, 150, and 250 Ca2+ ions/ms: 0.76, 0.96, 2.24; red: relative conductances in response to 50, 150, and 250 Ca2+ ions/ms: 1.41, 1.83, 2.24).
Figure 7—figure supplement 1

The PKC-pathway parameter distributions differ between clusters separated by their response to low (50 particles/ms) Ca2+ input.
Here, the experiment of Figure 7 is repeated by clustering the parameters sets based on the relative synaptic conductance after a steady-state Ca2+ flux of 50 particles/ms (250 particles/ms in Figure 7) to highlight the contribution of the PKC-pathway parameter. (A) The LTP/LTD curves for all 16 classes (classes 1’—16’). Four values of Ca2+ input amplitude were considered: 0, 50, 150, and 250 particles/ms (x-axis; repeated and overlaid for space). The y-axis shows the relative synaptic conductance, that is, total synaptic conductance 15 min after the onset of the Ca2+ input divided by the total synaptic conductance before the Ca2+ input. 20 representative parameter sets are displayed from each class, coloured from purple (lowest relative synaptic conductance response for medium Ca2+ input) to green (highest conductance). The black, dashed trace in class 6’ (note that this is a different group than class six in Figure 7) represents the model with the default concentration parameters. (B–E) Distribution of model parameters, that is, GluR1 ratio (B), NCX-concentration coefficient (C), PKA pathway-concentration coefficient (D), and PKC pathway-concentration coefficient in the 16 classes. Class 6’ (purple) highlighted for further analysis. (F–H) GluR1 ratio plotted against NCX-concentration coefficient (F), (G), and (H) in class 6’. The contours represent the distribution of parameters (N = 7275) that produced class-6’ plasticity. No parameters yielding class-6’ plasticity were found beyond the purple contour, and the inner contours cover the parameter space where the distribution is higher than 0%, 20%, 40%, 60% or 80% of the maximal density value. The black and red markers represent parameter sets that produced two plasticity subclasses, namely, one where the total deviance (summed absolute difference) from the BCM-type plasticity produced by the default parameter set (black, N = 98) or from a linearly decreasing LTP (red, N = 44) was less than 0.2 (a.u.). Inset: The LTP/LTD plasticity curves of the two subclasses. The thick lines represent the centre of the subclasses (black: relative conductances in response to 50, 150, and 250 Ca2+ ions/ms: 0.76, 0.96, 2.24; red: relative conductances in response to 50, 150, and 250 Ca2+ ions/ms: 0.76, 0.52, 0.27).
Figure 8
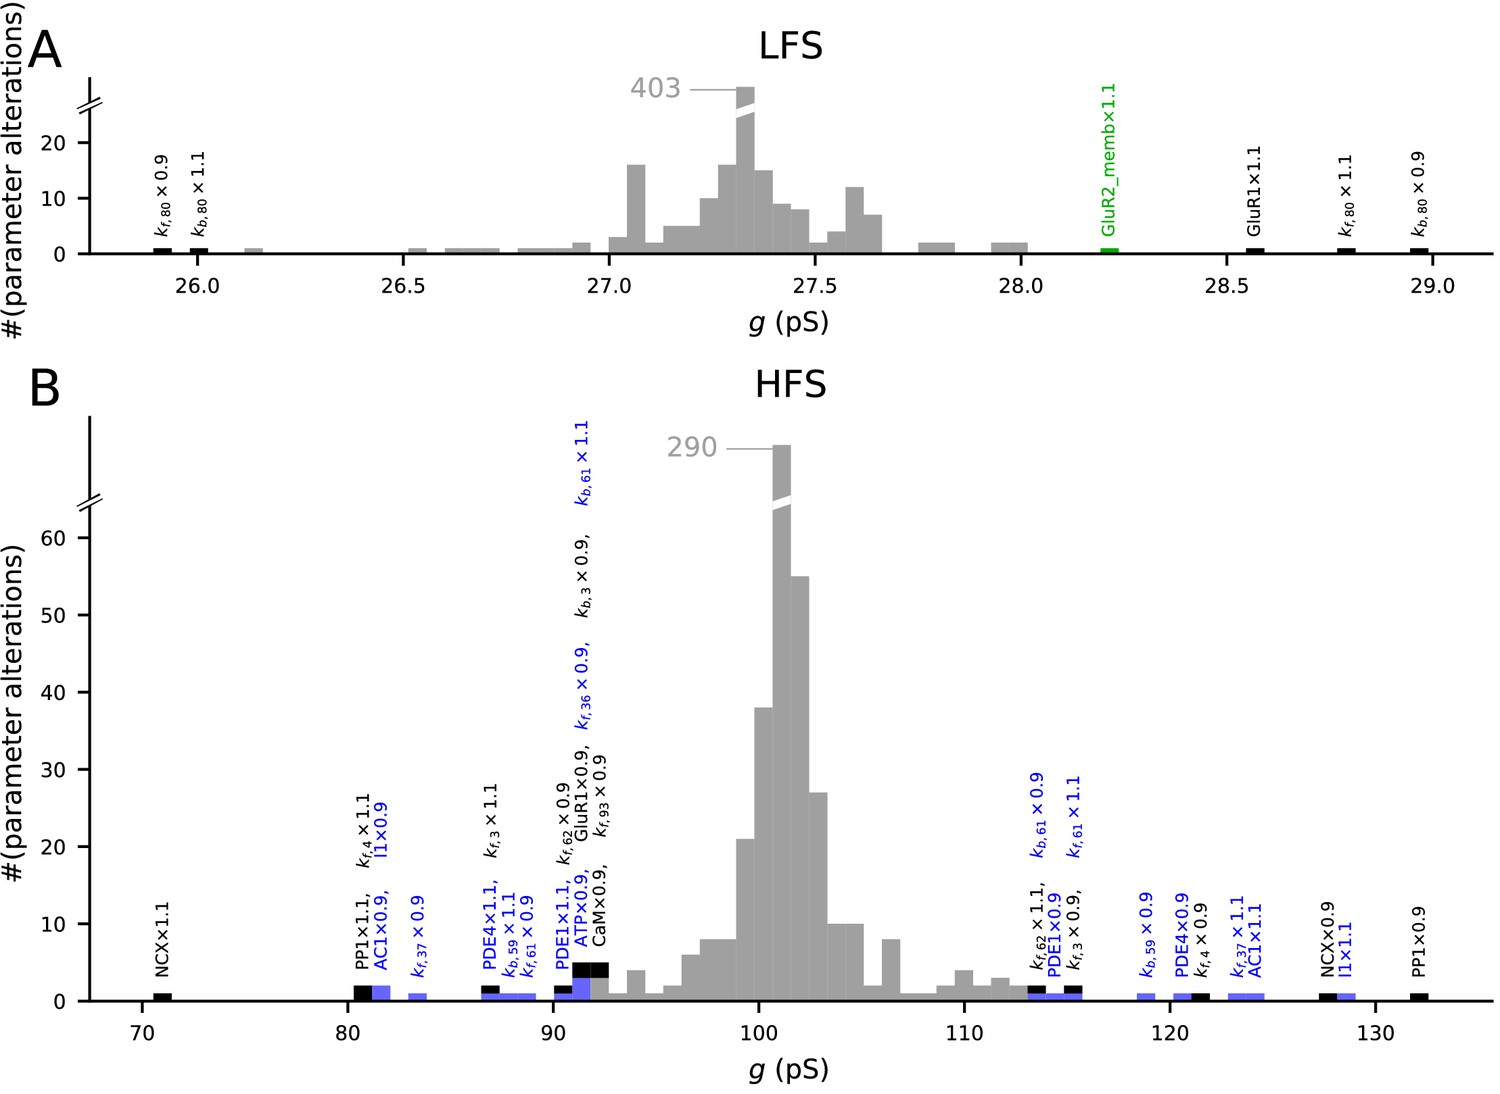
The model predictions of LTP and LTD are robust to small changes in model parameters.
Values of initial concentrations (47 parameters) or reaction rates (223 parameters) were changed one at the time by −10% or +10%, and the resulting synaptic conductance 16 min after LFS (A) or 4xHFS (B) protocol was measured (NEURON RxD simulations). The initial synaptic conductance is 33.4 pS (see Figure 3A,S), although some parameter changes mildly affected this value (data not shown). The x-axis shows the post-LFS (A) or post-HFS (B) synaptic conductance, and the y-axis shows the number of parameter alterations. Majority of the parameter changes had small effect on plasticity (grey bars), but changes in initial concentrations of 10 species and 12 reaction rates caused >15% change in the amplitude of LTP or LTD — these changes are represented by black (multi-pathway parameters), blue (PKA-pathway-related parameters), and green (PKC-pathway-related parameters) bars. The underlying parameter changes are printed above the corresponding bar.
Figure 9 with 11 supplements
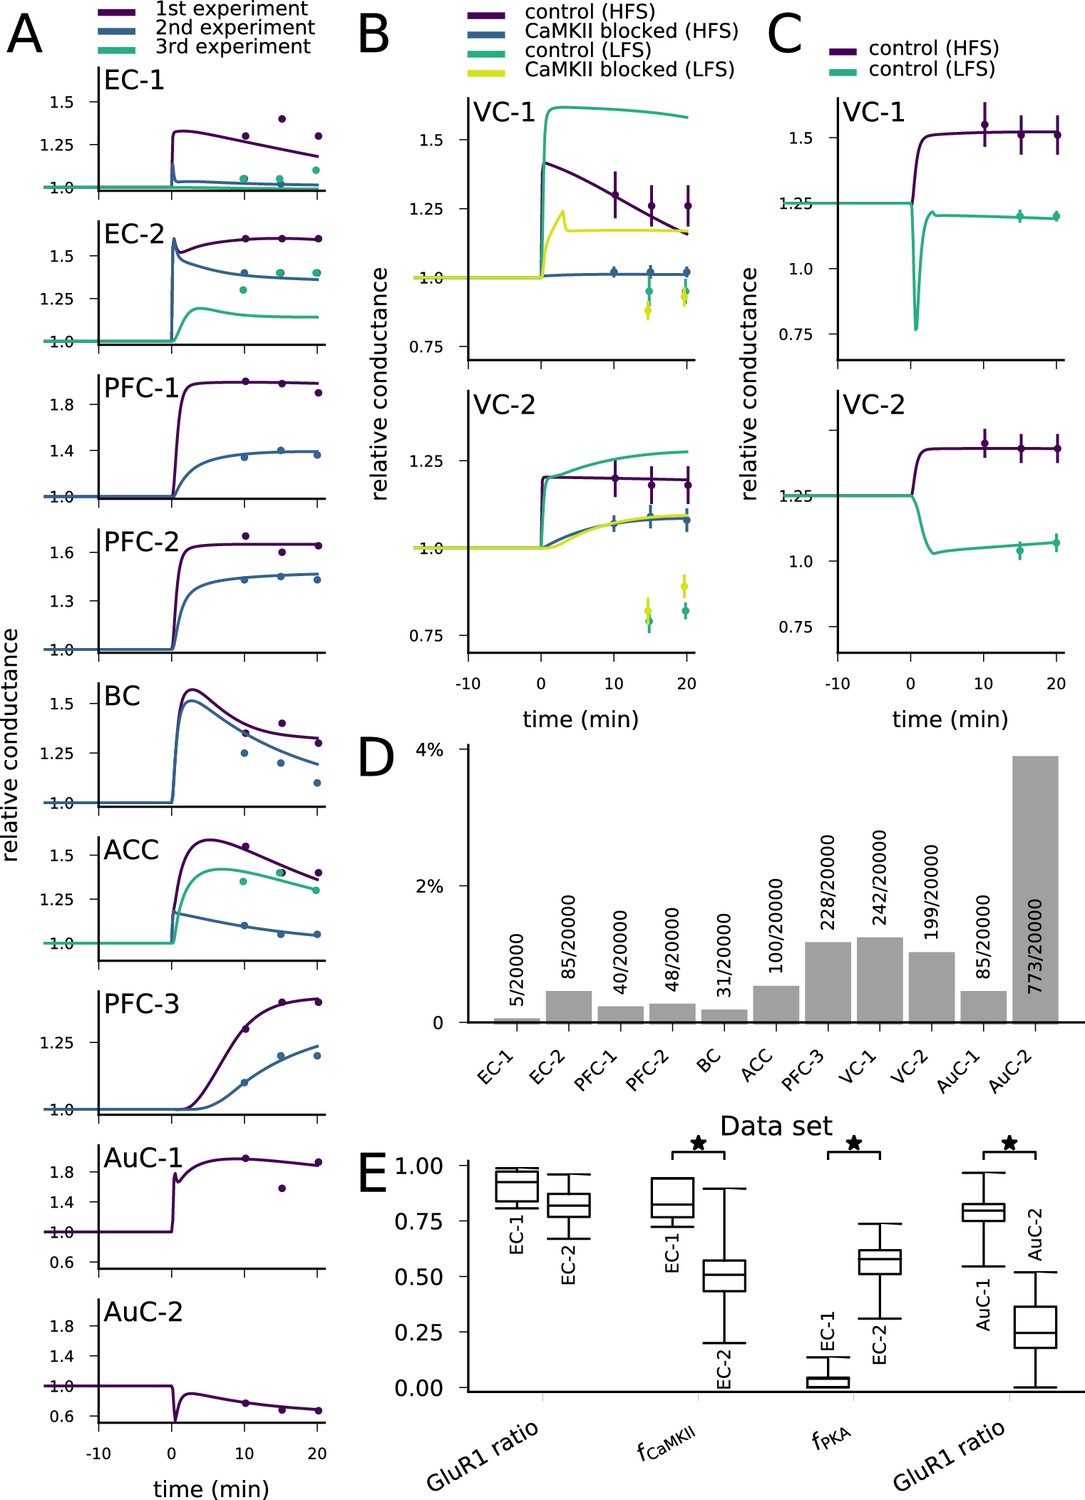
The model can be fit to LTP/LTD data from different cortical areas.
(A) The model could be fit to LTP/LTD data from data sets EC-1 (top), EC-2, PFC-1, PFC-2, BC, ACC, PFC-3, AuC-1, and AuC-2 (bottom). The curves represent the model predictions of the best-fit parameter sets, and the dots represent the experimental data from Table 2. For data sets other than AuC-1 and AuC-2, several experiments with various chemical agents or genetic mutations were performed for each neuron population: these are ordered as in Table 2 (e.g., in data set EC-1, purple (1 st experiment) corresponds to control, blue (2nd experiment) to CaMKII-blocked experiment, and green (3rd experiment) to the experiment where post-synaptic Ca2+ was blocked). (B) The model could not be fit to the complete LTP/LTD data from data sets VC-1 (top) and VC-2 (bottom). The best parameter sets correctly predicted the LTP/LTD in up to two experiments (e.g., the selected parameter sets reproduce the HFS data with and without CaMKII inhibitor, but failed to reproduce the LFS data). (C) The model could be fit to the LTP/LTD data from data sets VC-1 (top) and VC-2 (bottom) when CaMKII-blocked experiments were ignored. The vertical bars in (B) and (C) represent the SD from the experimental data. (D) Proportion of accepted parameter sets across the 20 generations of multi-objective optimisation (20’000 parameter sets in total) in each data set. (E) Box plots of selected parameters in the acceptable parameter sets of data sets EC-1 and EC-2 (three left-most pairs) and AuC-1 and AuC-2 (right-most pair). Values of and are linearly scaled such that the values 0 and 1 correspond to 0 and double the original value of the underlying parameters, respectively (CaM and CaMKII for , and R, Gs, AC1, and AC8 for , see Materials and methods, section 'Parameter alterations and model fitting'). The medians were significantly different in the compared data sets (U-test, p-value<0.001).
Figure 9—figure supplement 1
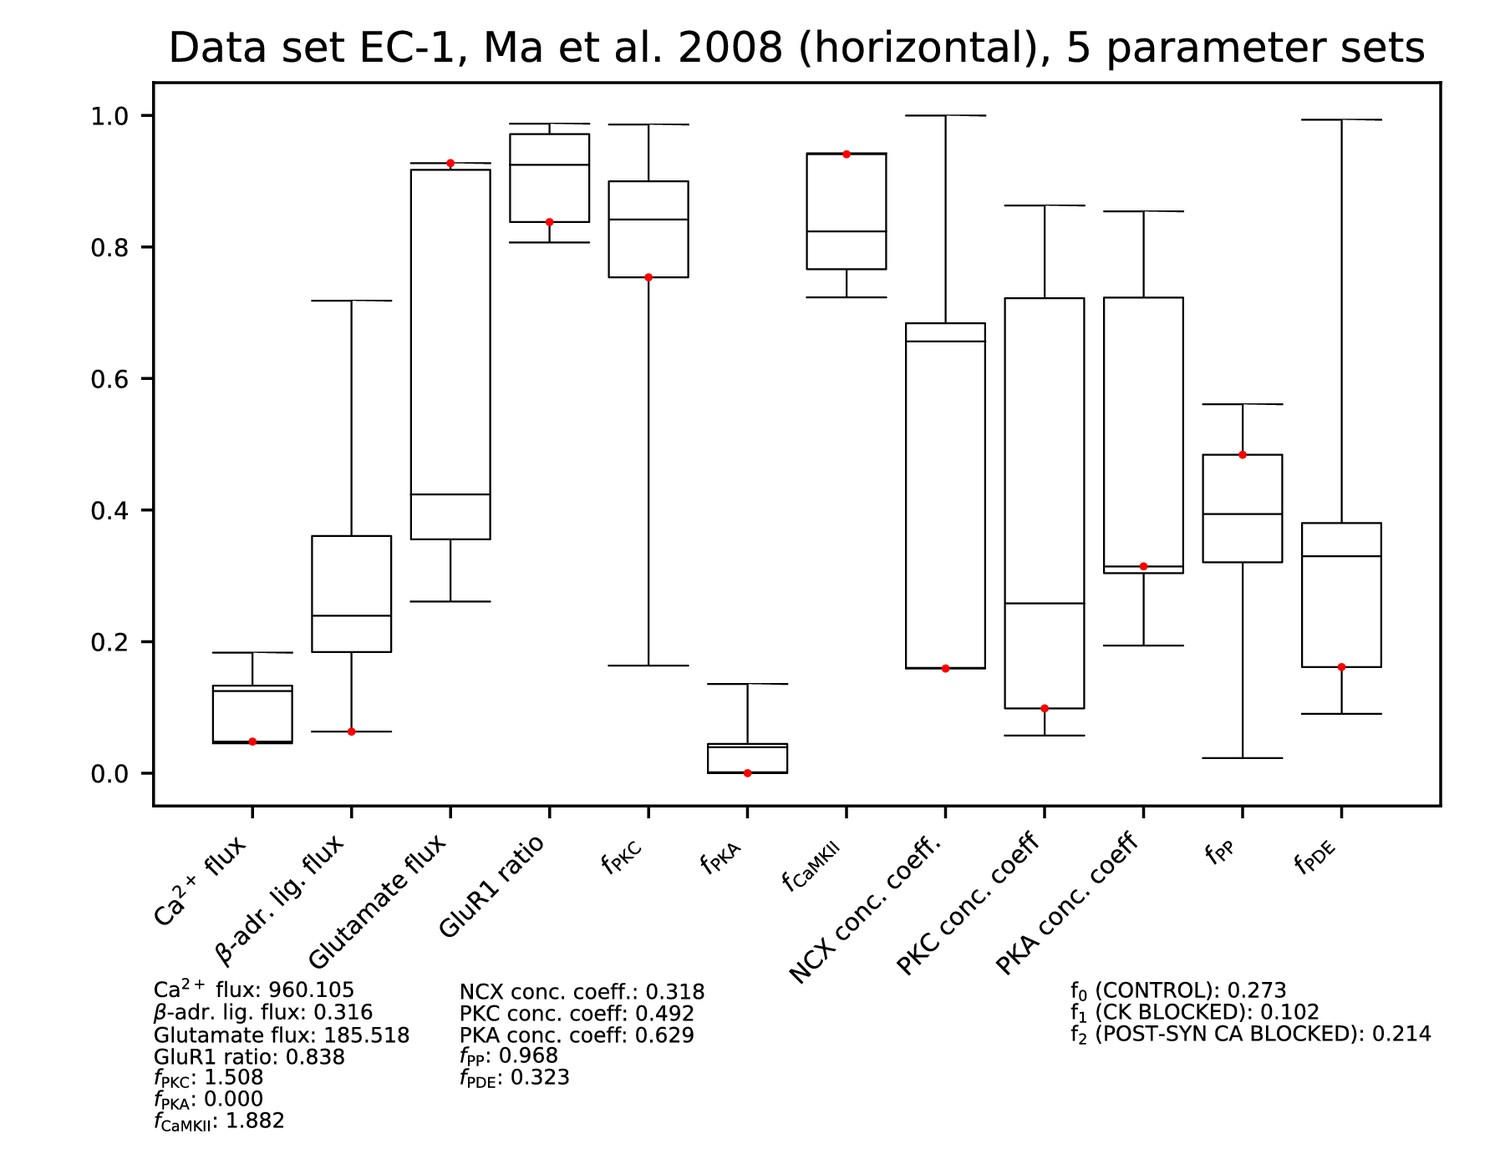
Parameters for data set EC-1.
Ranges of each parameter among the accepted parameter sets from the fitting of Figure 9. All parameters are linearly scaled between 0 and 1, which represent the minimal and maximal value of the corresponding model parameter. The values of the parameters reproducing the data of Figure 9A and C are presented by red dots, and their exact (non-scaled) values are listed below the figure. The values of the error functions corresponding to the listed parameter set are displayed in the right-most column for each experiment.
Figure 9—figure supplement 2
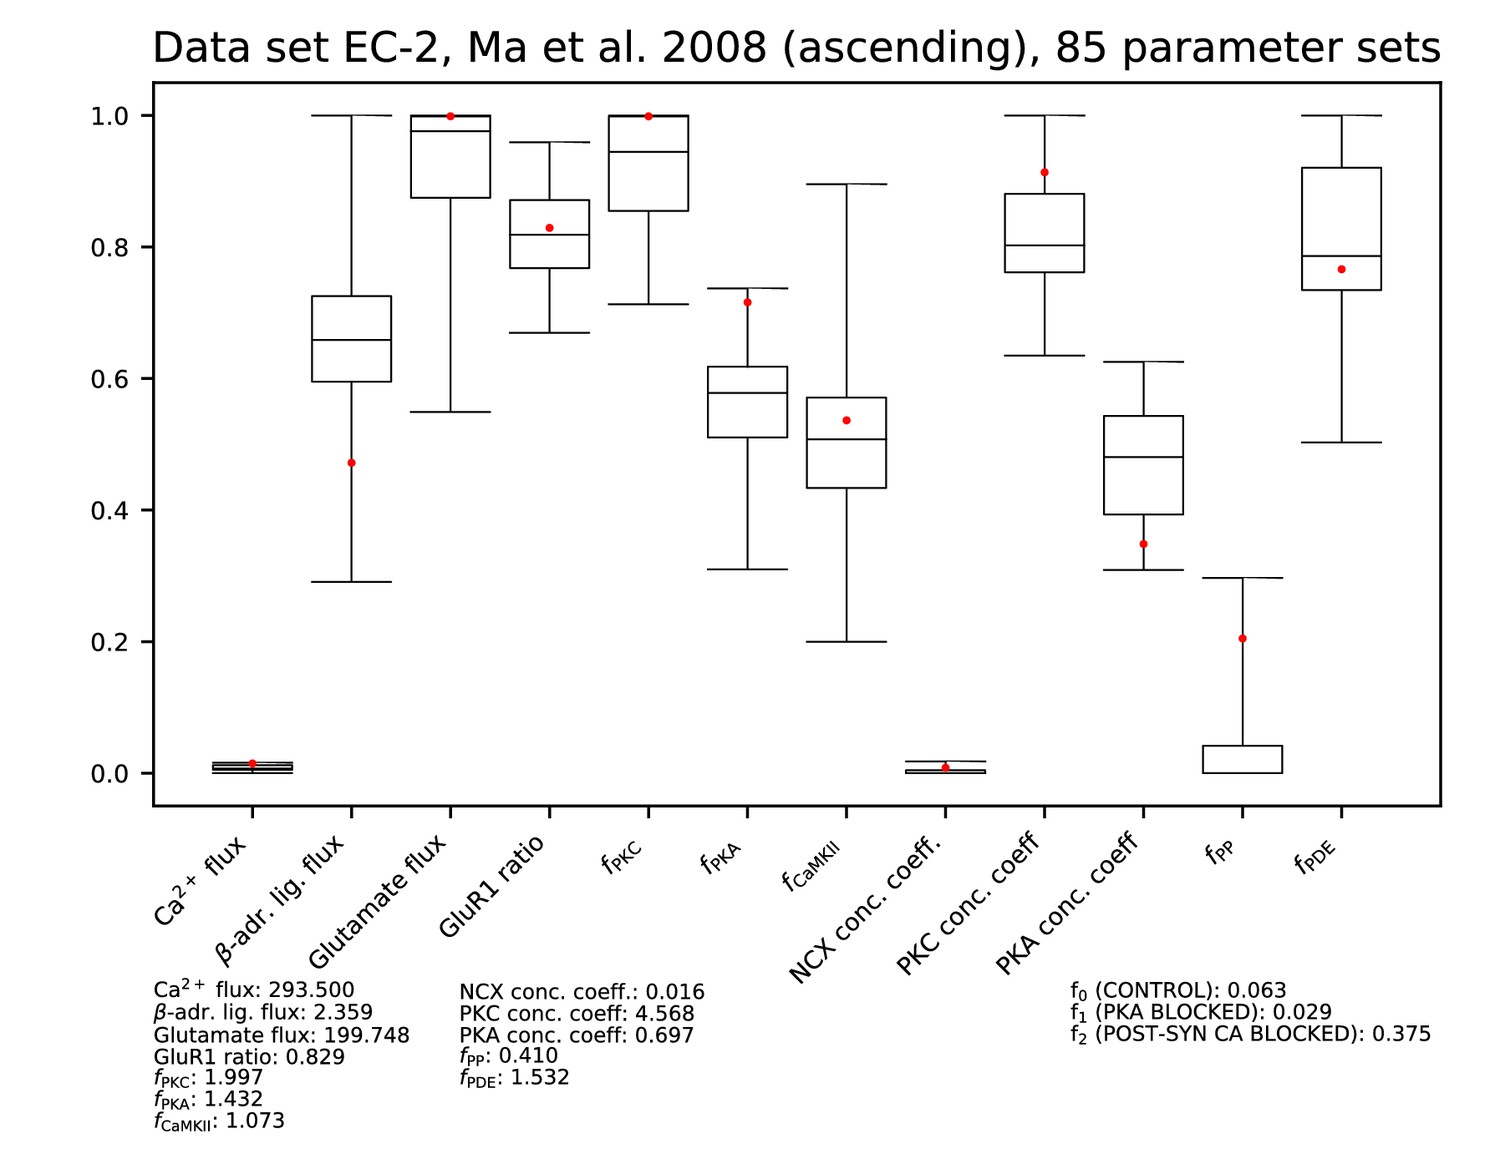
Parameters for data set EC-2.
See Figure 9—figure supplement 1 for details.
Figure 9—figure supplement 3
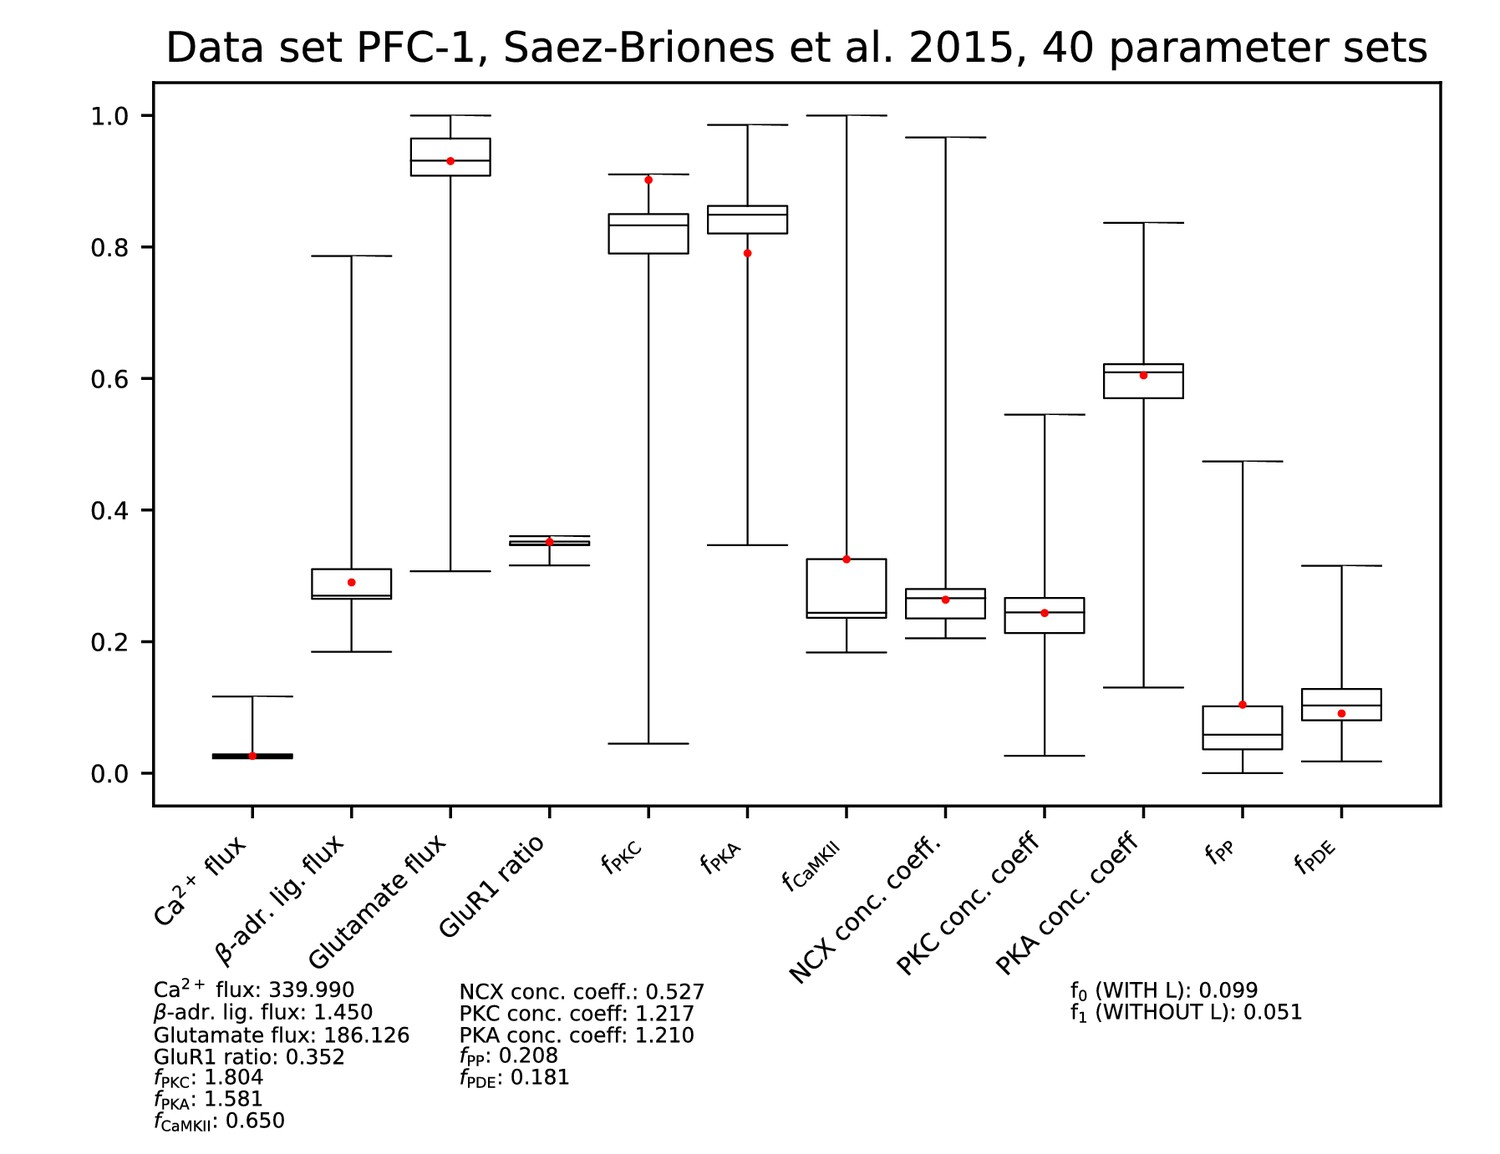
Parameters for data set PFC-1.
See Figure 9—figure supplement 1 for details.
Figure 9—figure supplement 4

Parameters for data set PFC-2.
See Figure 9—figure supplement 1 for details.
Figure 9—figure supplement 5
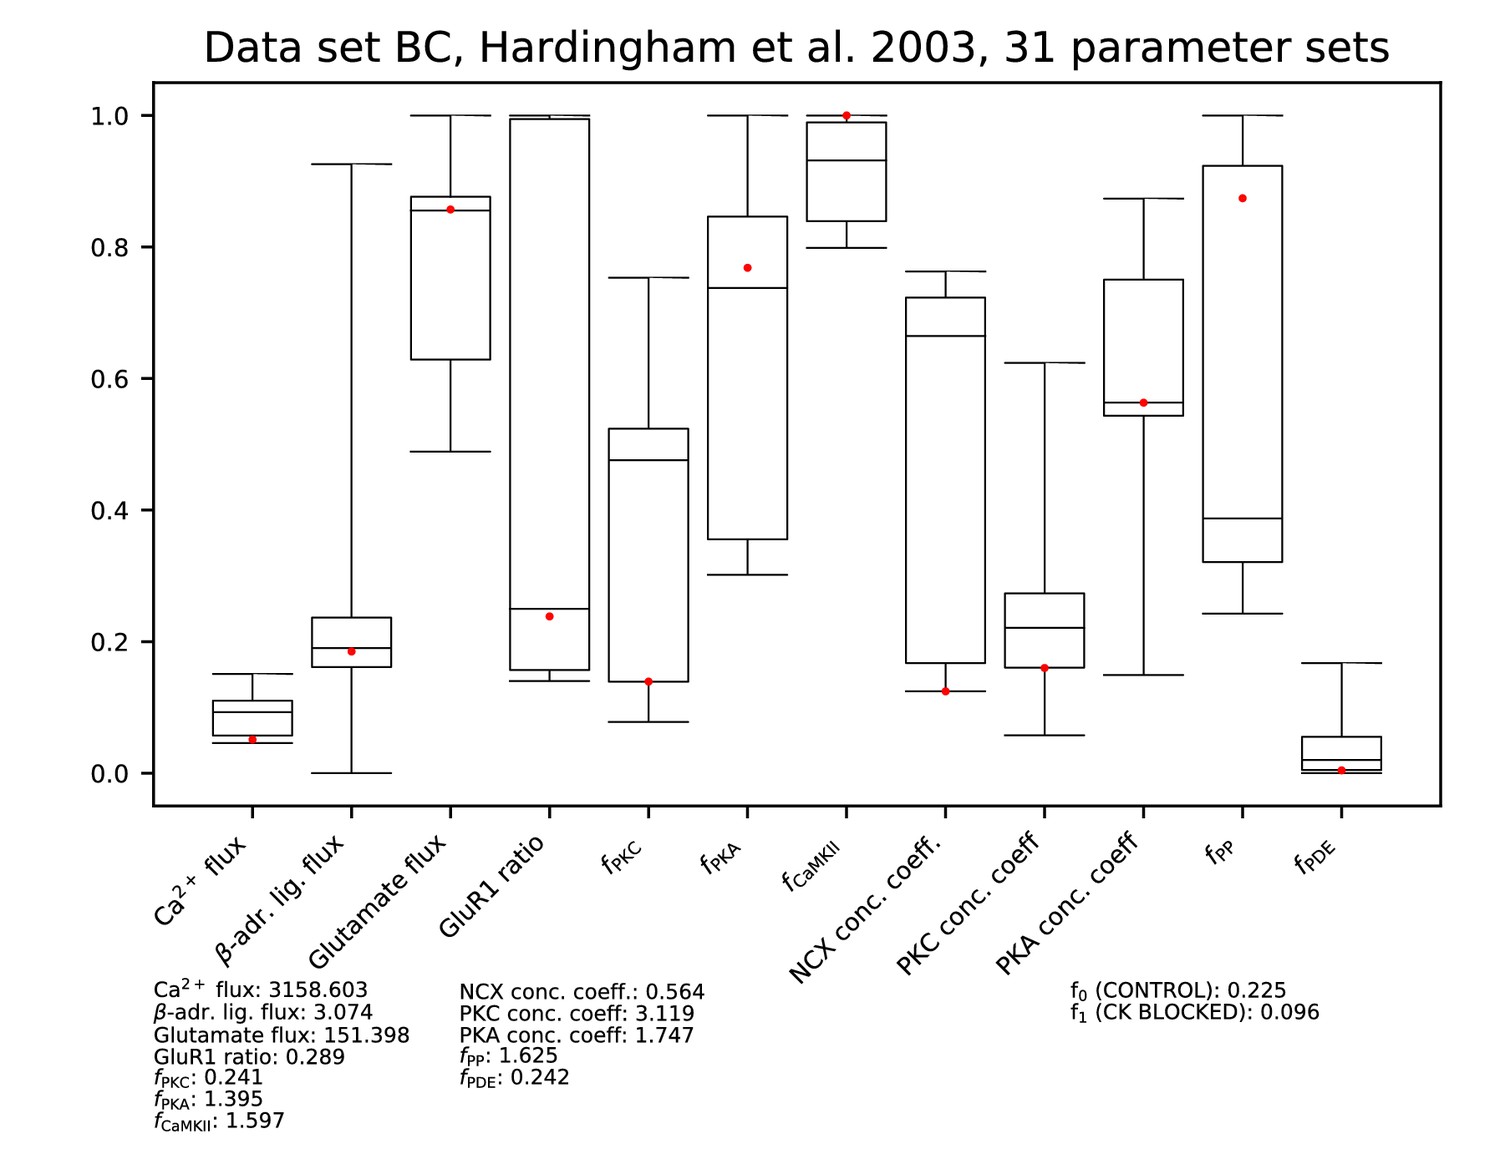
Parameters for data set BC.
See Figure 9—figure supplement 1 for details.
Figure 9—figure supplement 6
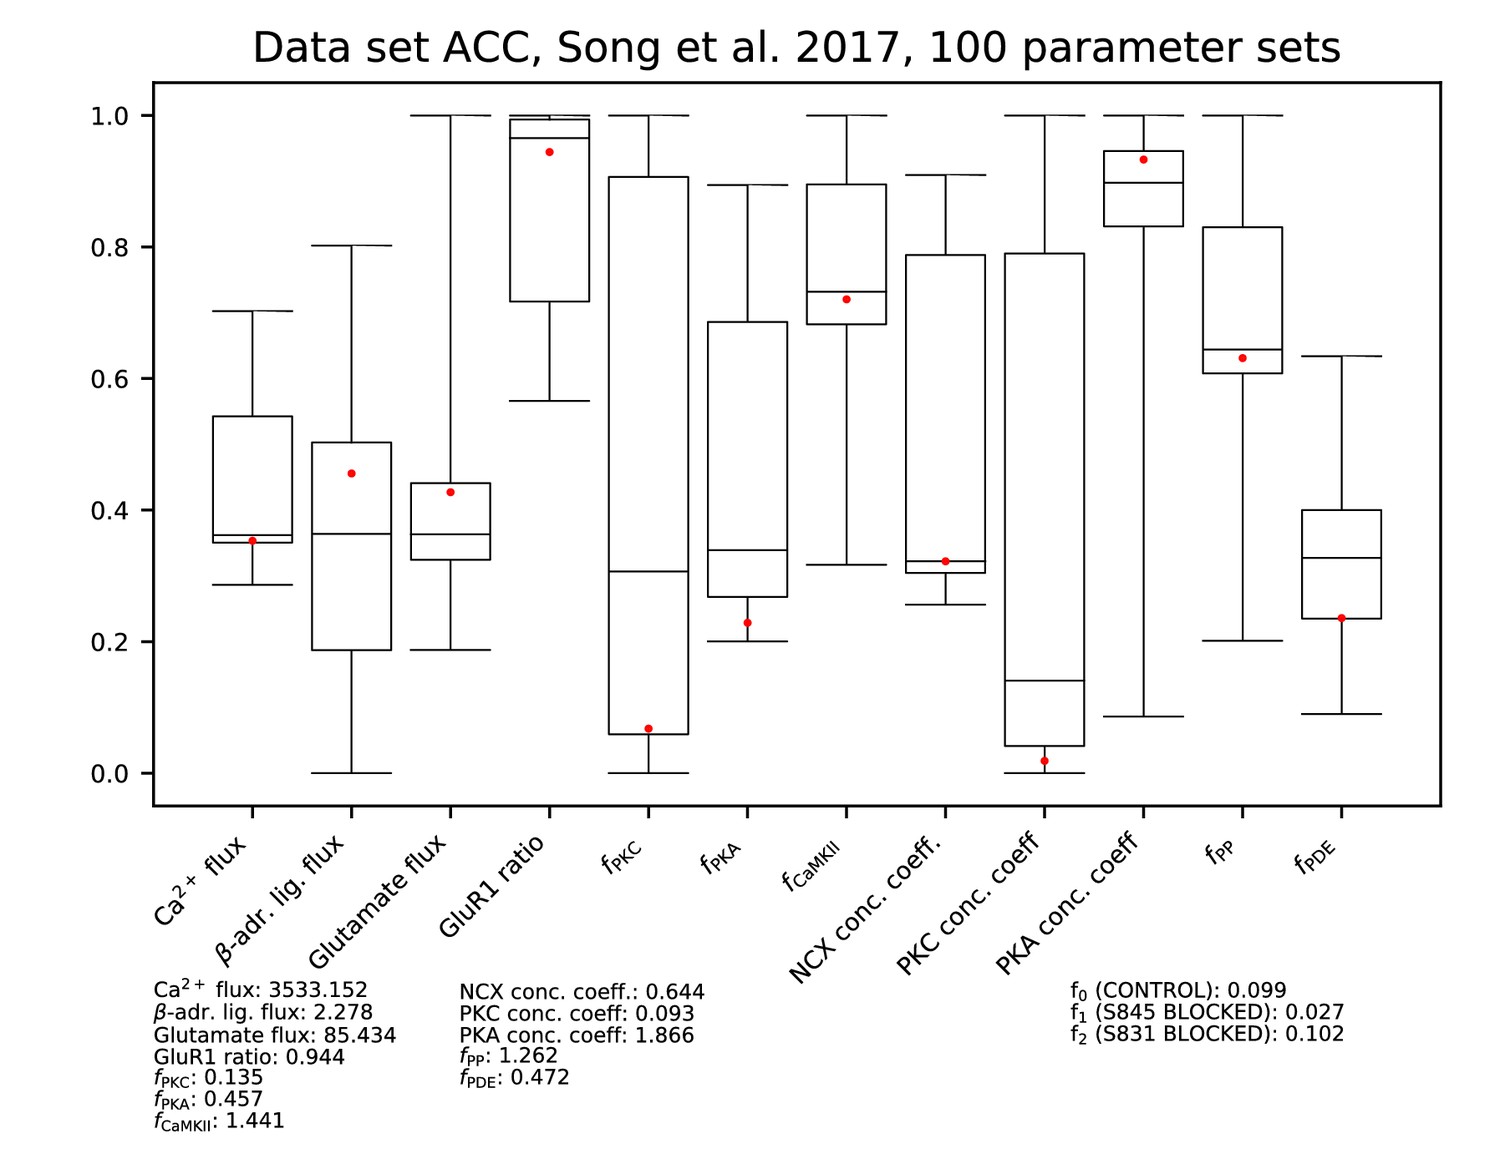
Parameters for data set ACC.
See Figure 9—figure supplement 1 for details.
Figure 9—figure supplement 7
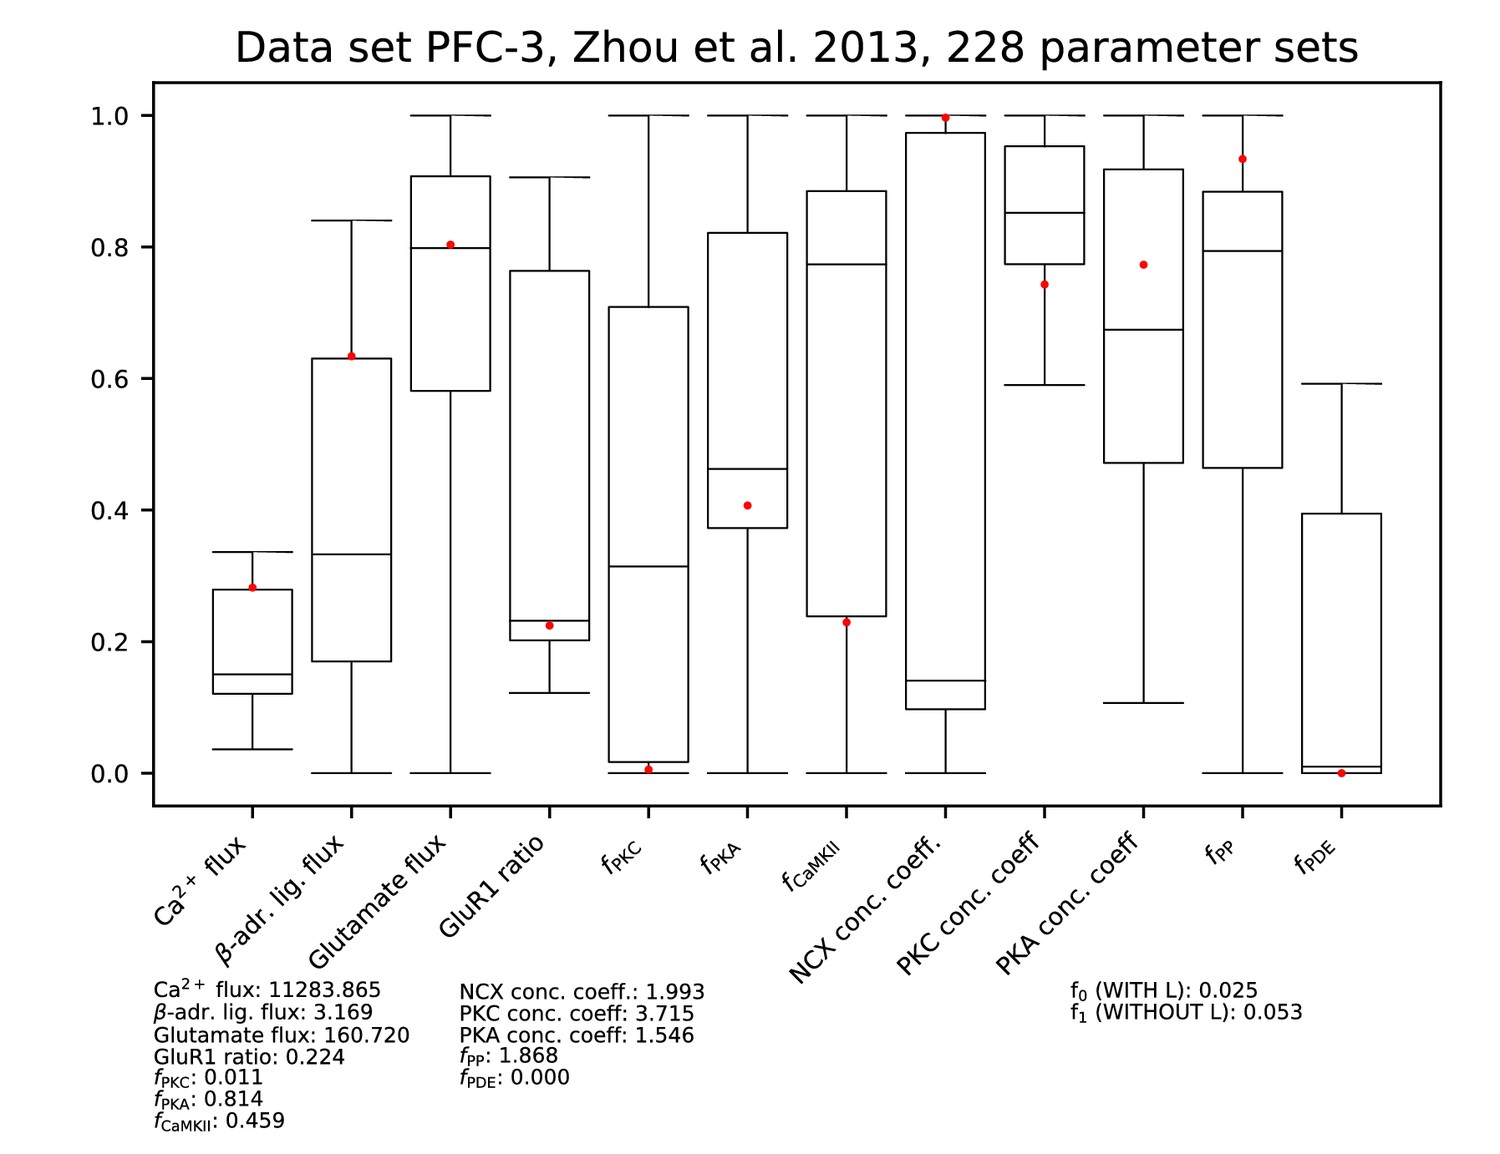
Parameters for data set PFC-3.
See Figure 9—figure supplement 1 for details.
Figure 9—figure supplement 8
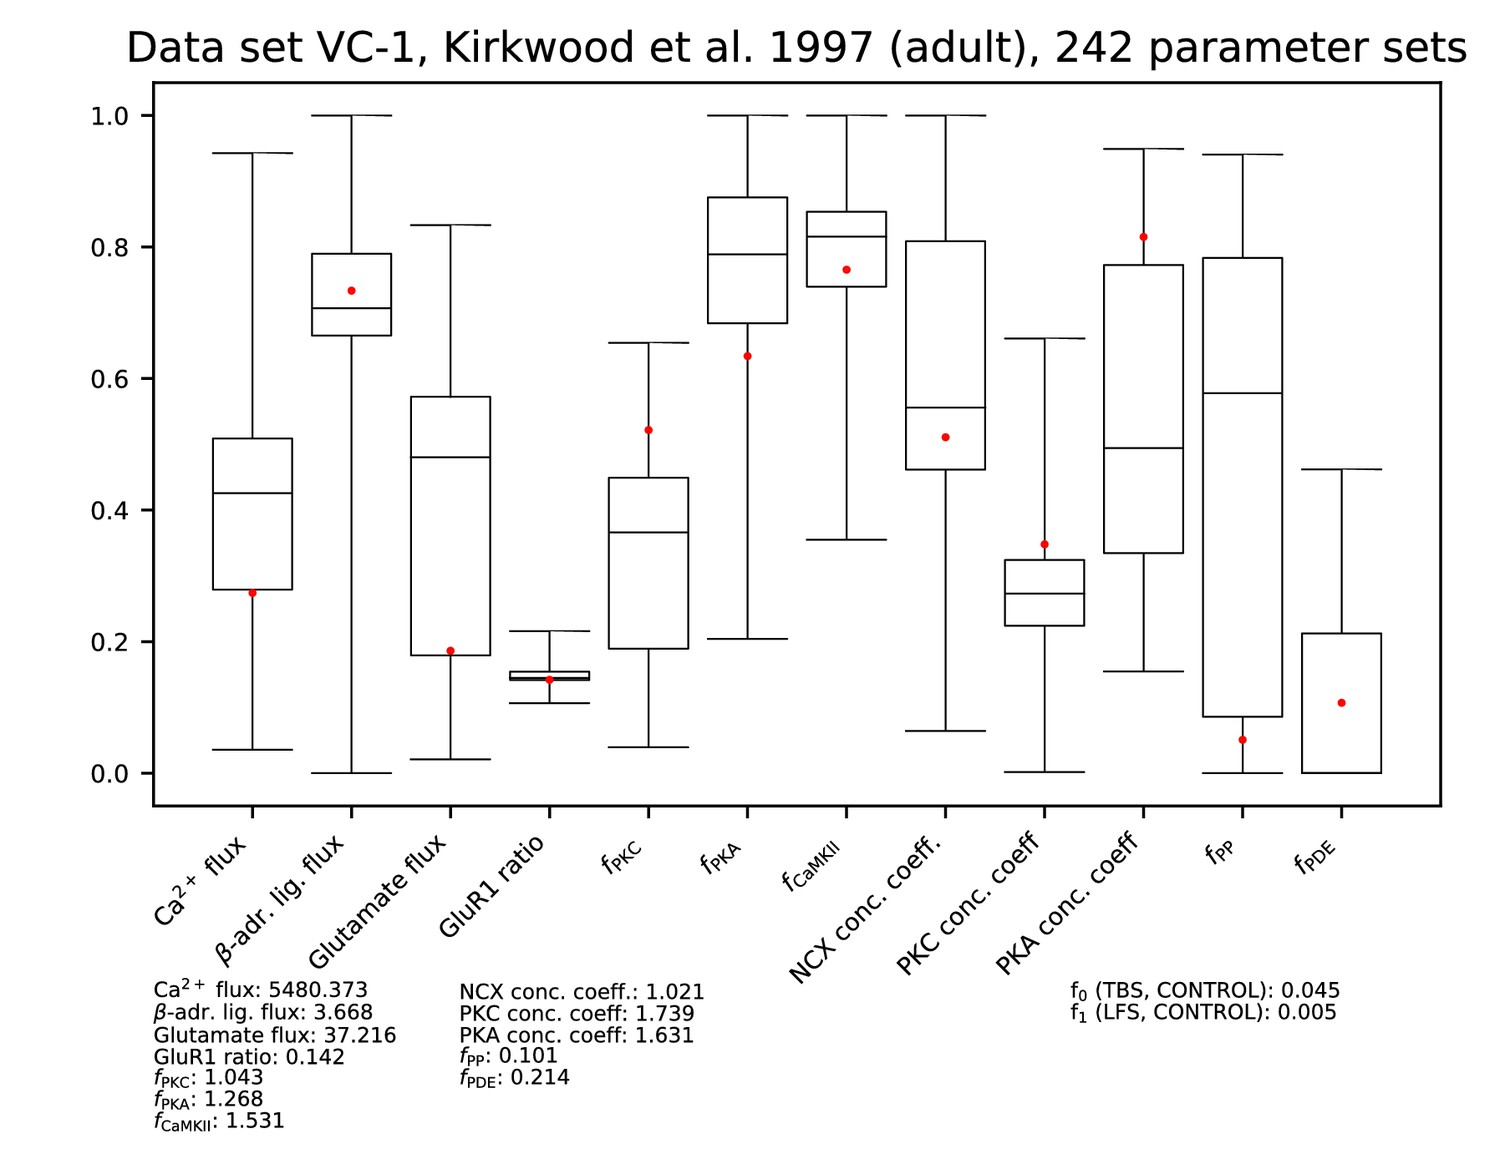
Parameters for data set VC-1.
See Figure 9—figure supplement 1 for details.
Figure 9—figure supplement 9
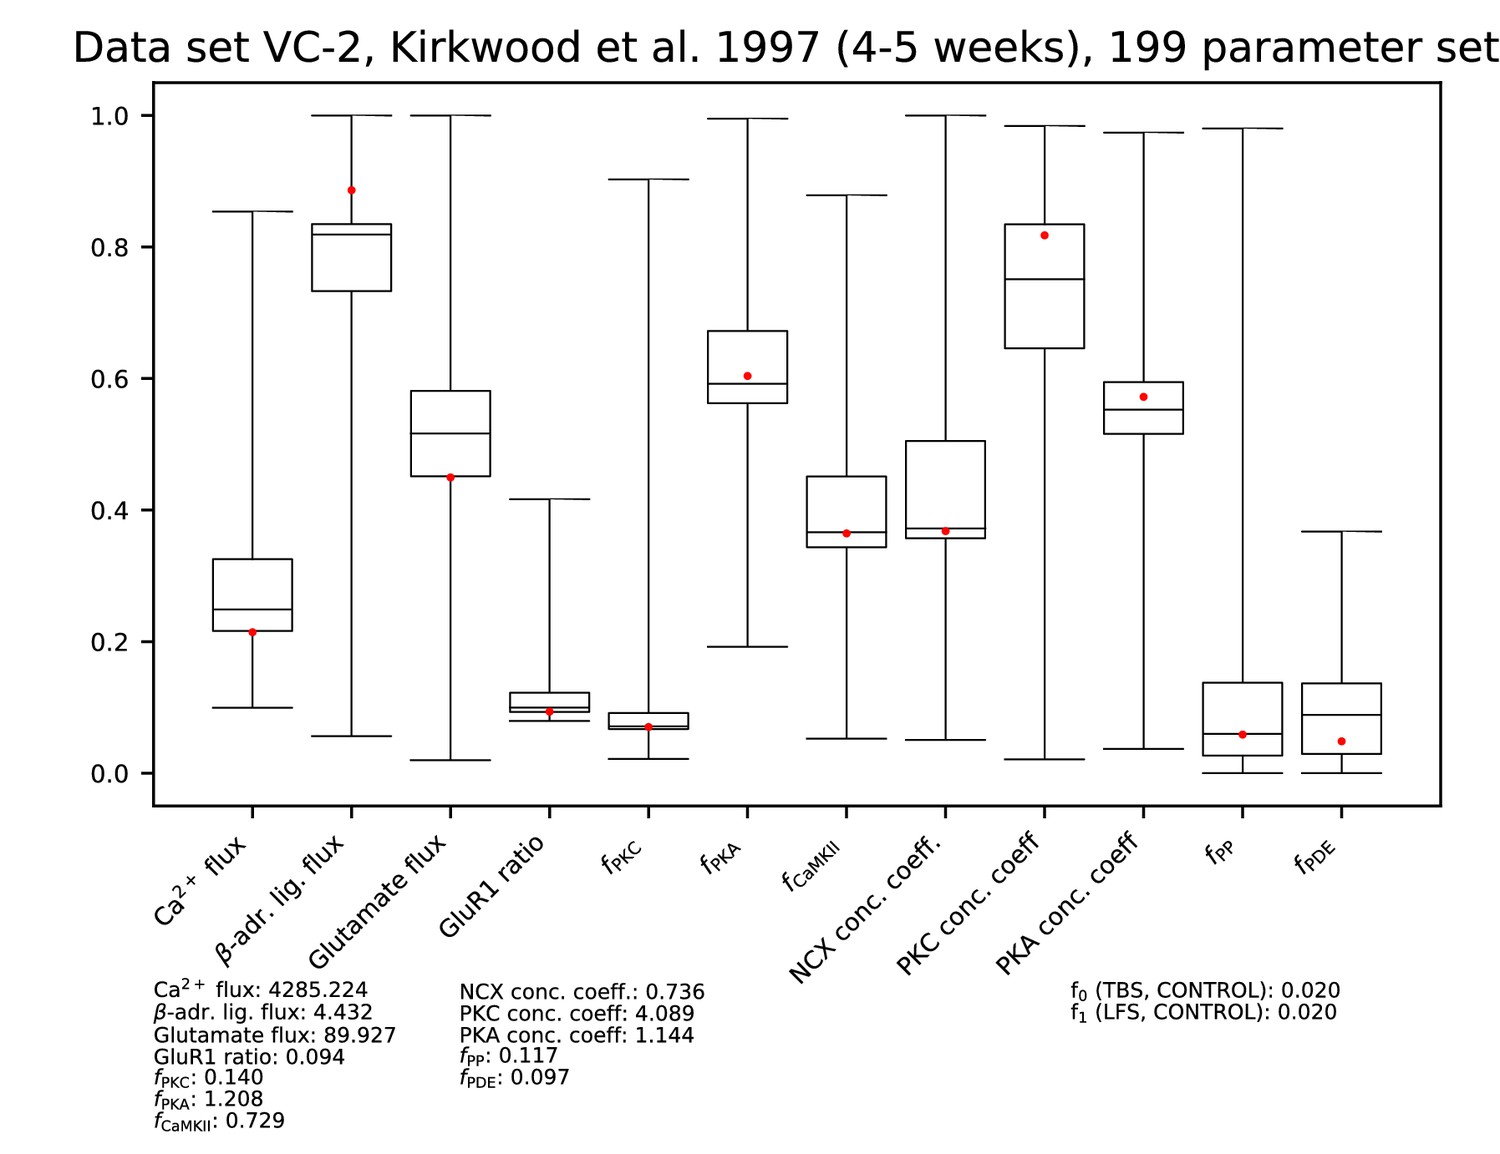
Parameters for data set VC-2.
See Figure 9—figure supplement 1 for details.
Figure 9—figure supplement 10
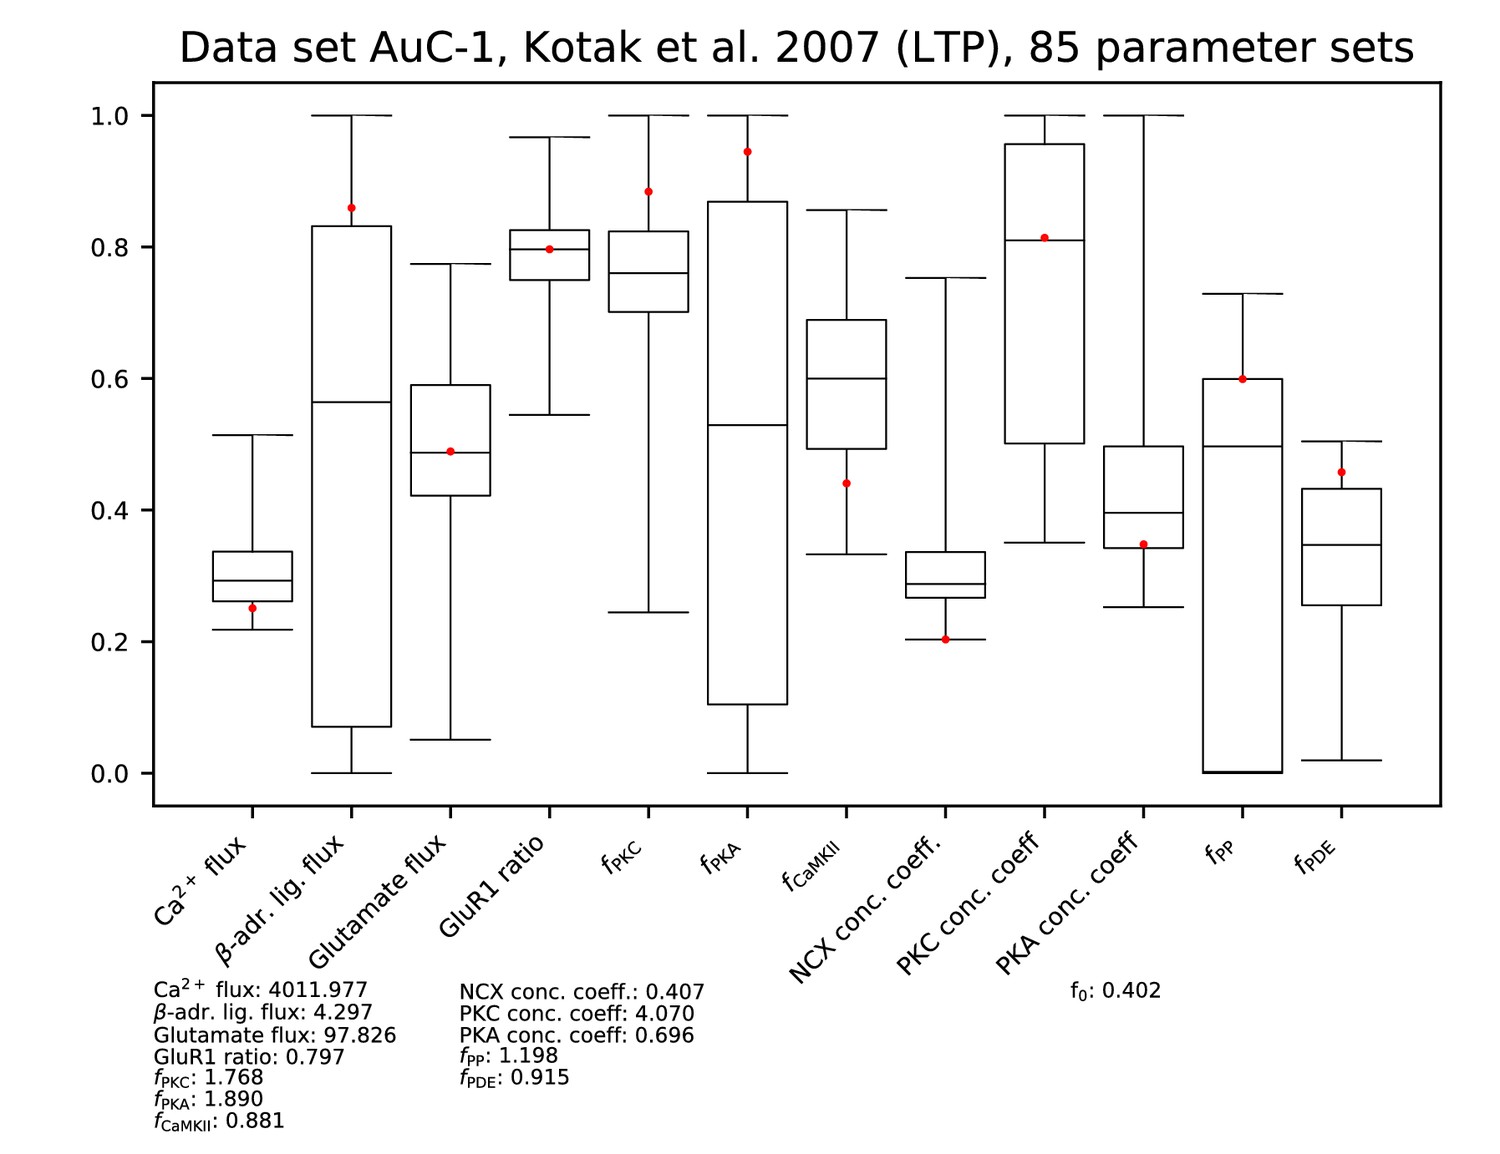
Parameters for data set AC-1.
See Figure 9—figure supplement 1 for details.
Figure 9—figure supplement 11
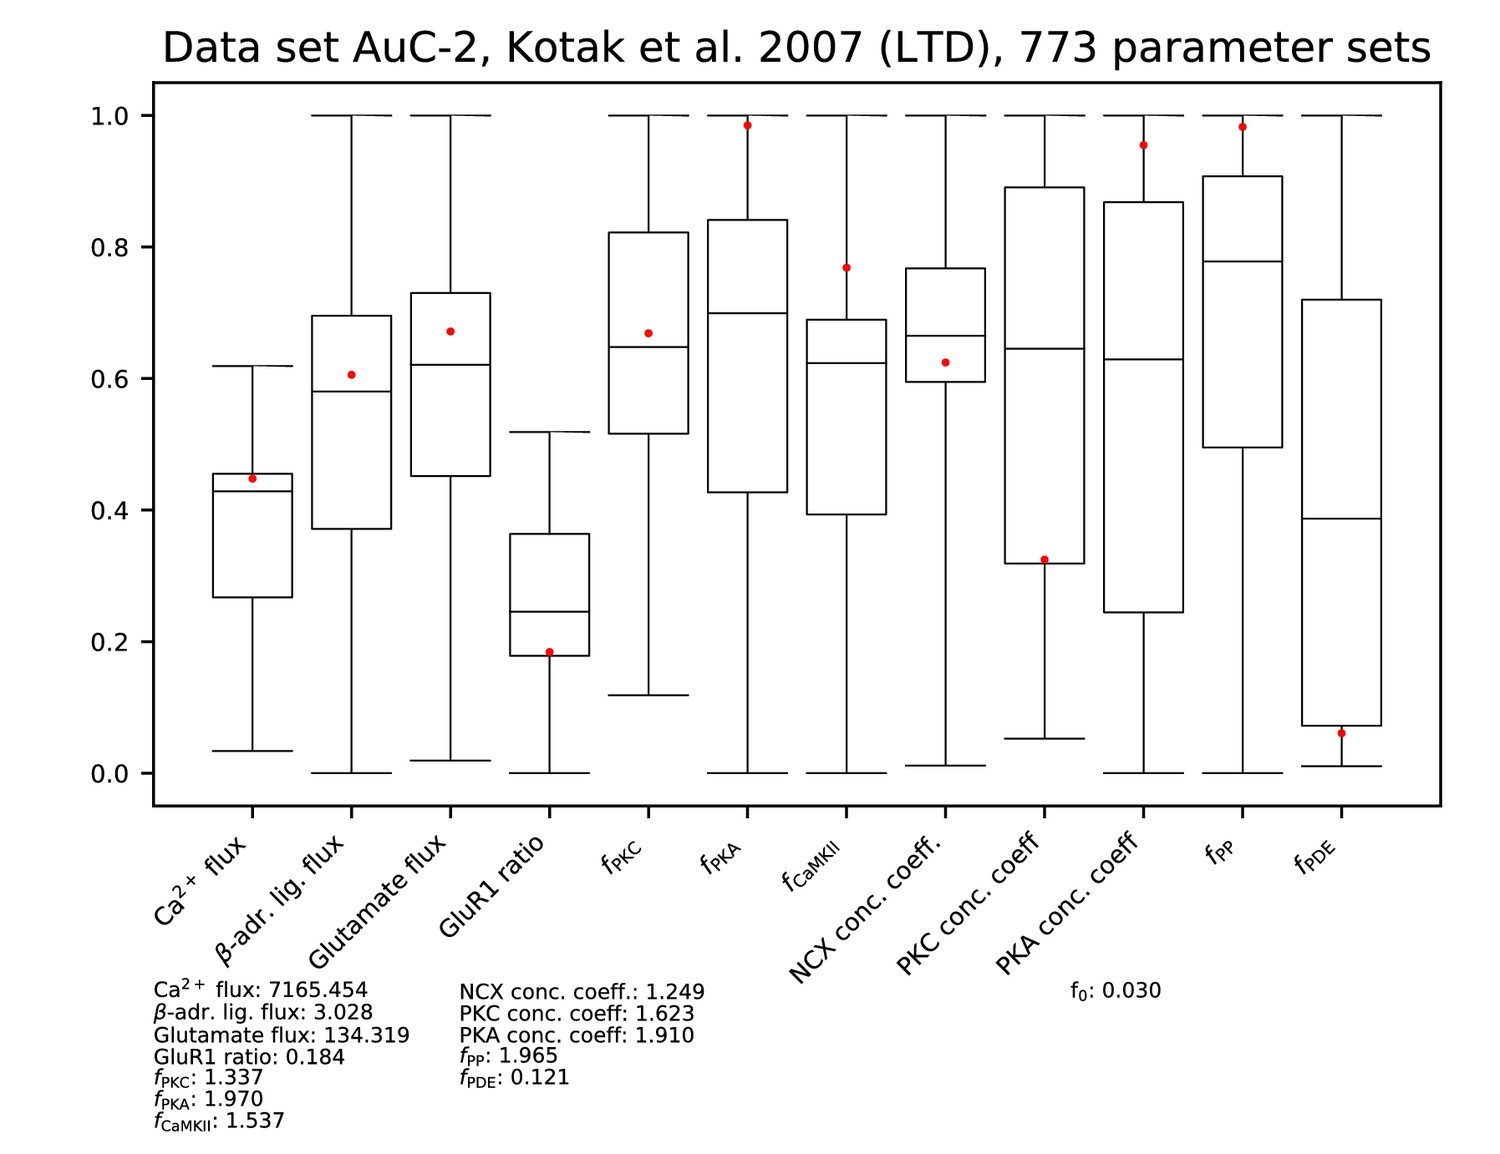
Parameters for data set AC-2.
See Figure 9—figure supplement 1 for details.
Figure 10
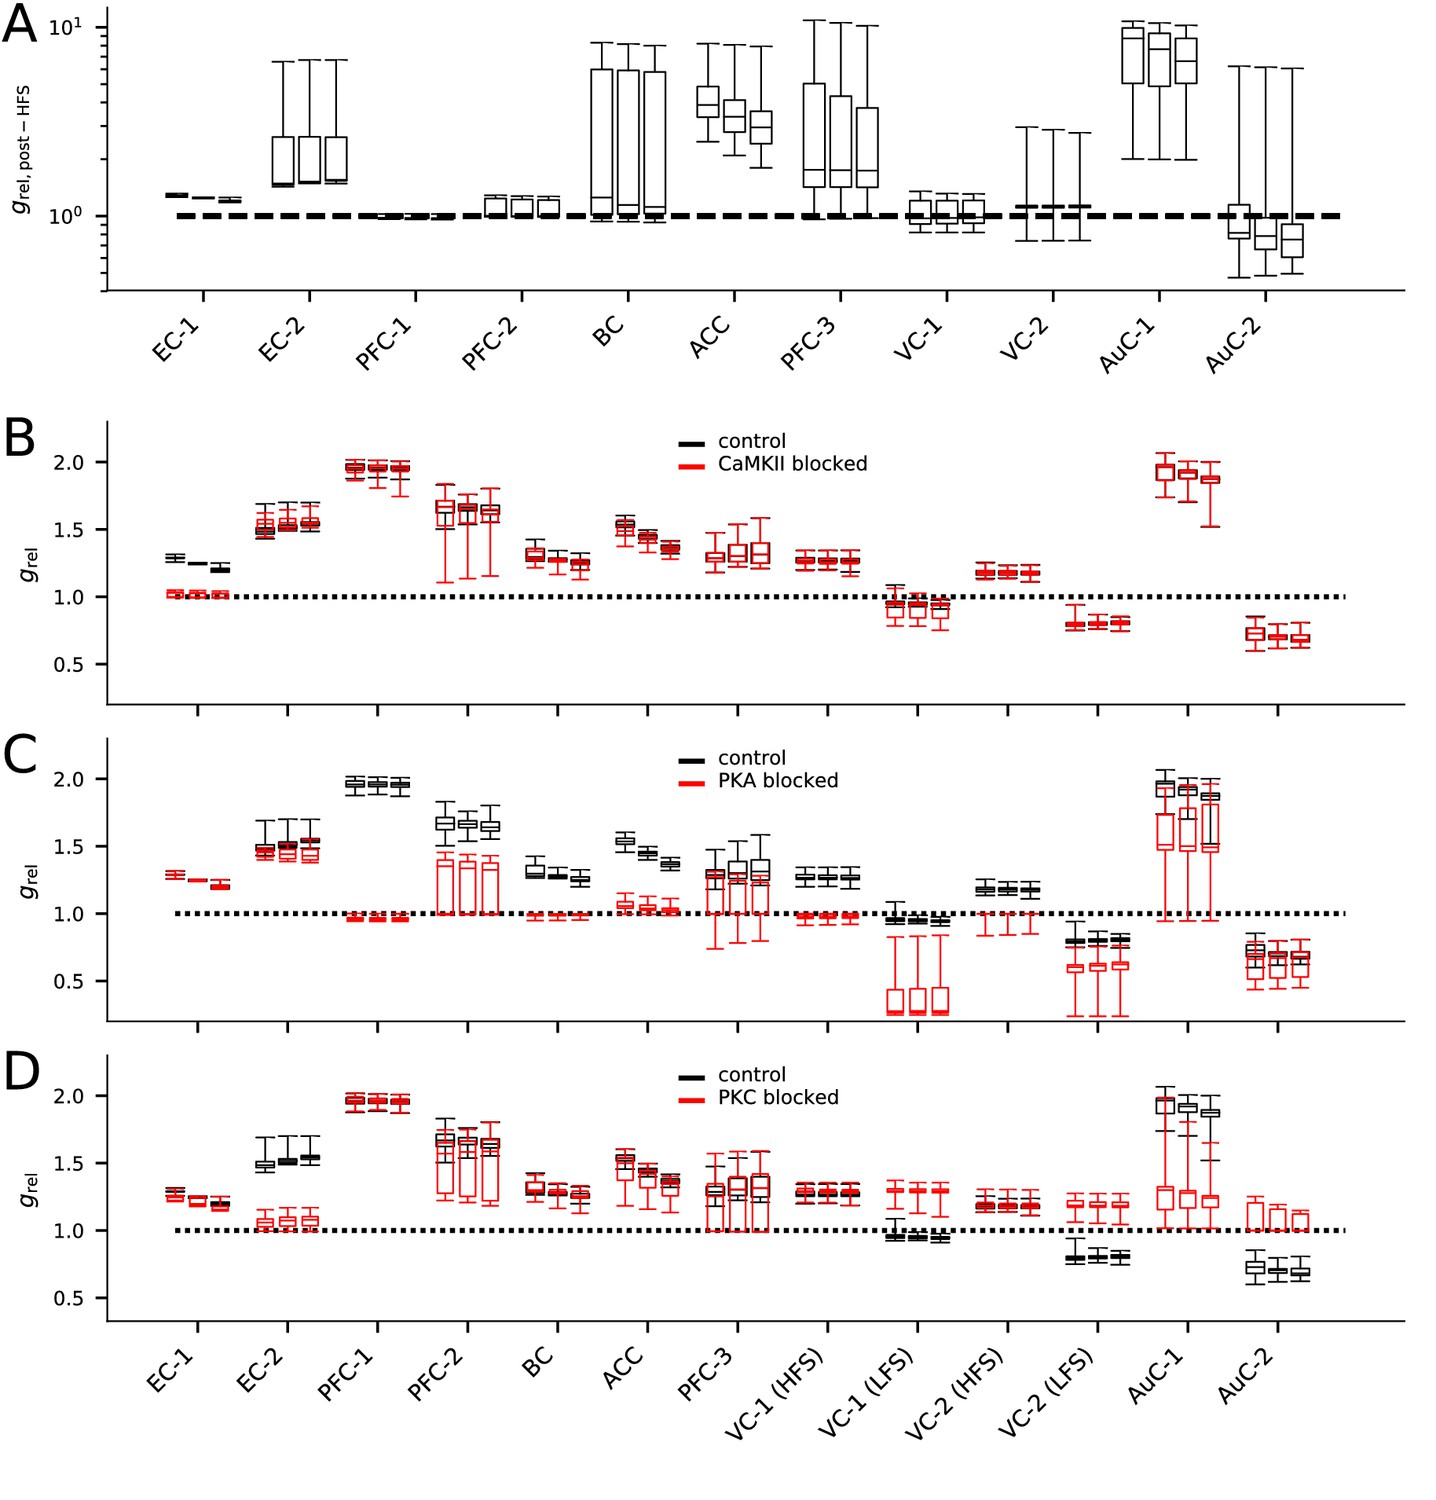
The models describing plasticity in different cortical areas predict diverse responses to modified stimulation protocol and stimulation under chemical blockers.
(A) The predicted responses of the 20 best models in each data set to HFS (100 pulses at 100 Hz) stimulation. (B–D) The predicted responses of the 20 best models in each data set to the applied stimulation protocol (see Table 2) when CaMKII (B), PKA (C), or PKC (D) activity was blocked (red) or under control condition (black).
Figure 11 with 2 supplements
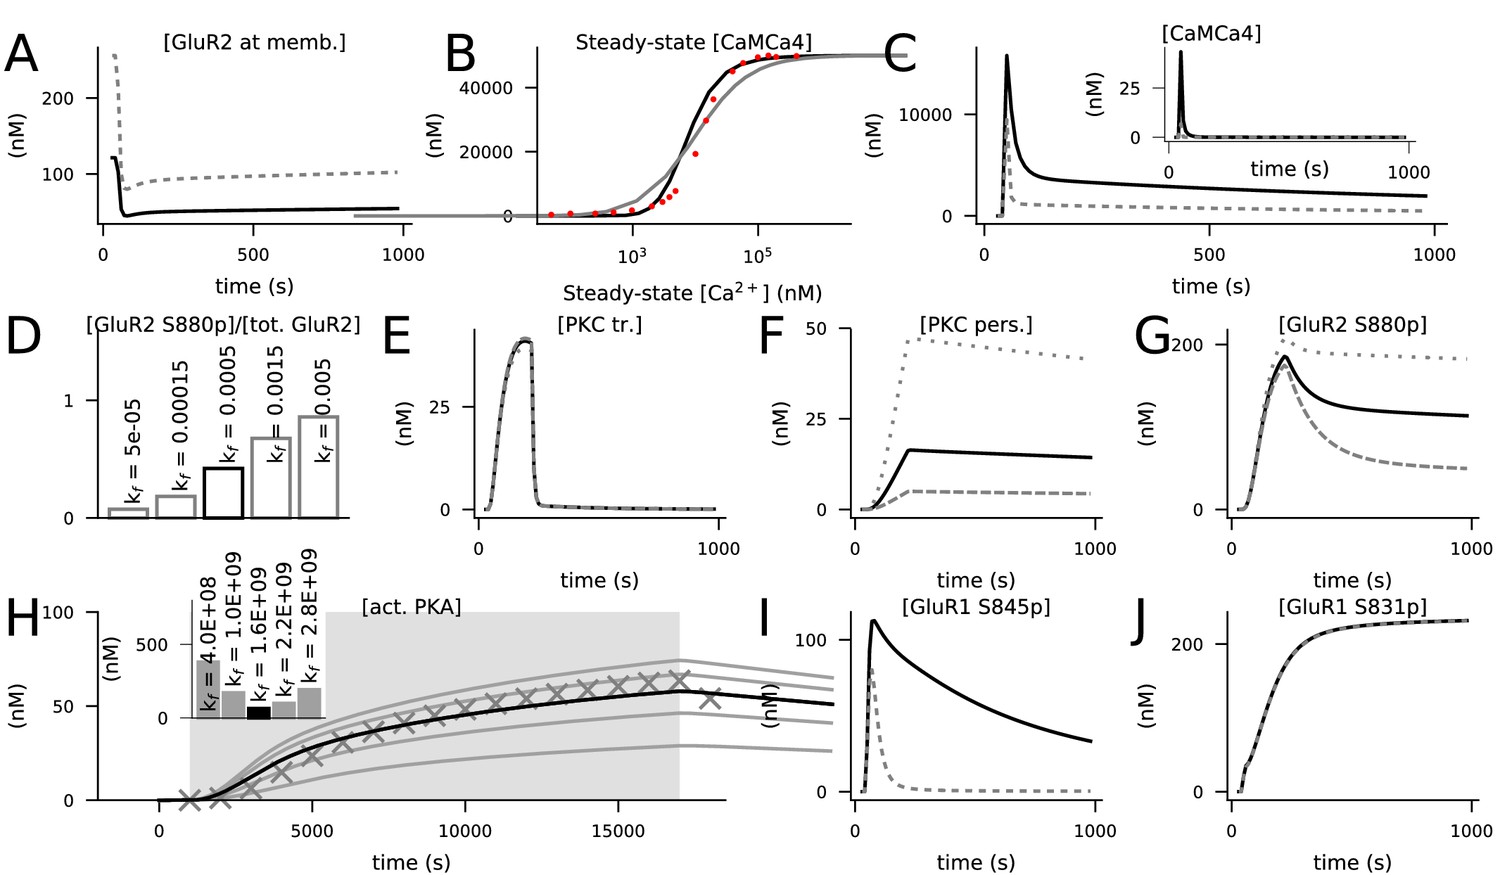
Calibration of the model.
Black curves represent the final model, while grey lines represent predictions of models where previous model components or tentative parameter values were used. (A) Concentration of membrane-inserted GluR2 in 4xHFS when the forward rate of the membrane insertion of non-phosphorylated GluR2 was 0.0055 1/ms Gallimore et al., 2018 (grey) or 0.00025 1/ms (black). The rate 0.00025 1/ms caused a resting-state concentration of 121 nM for the membrane-bound GluR2 subunits, which is 45% of the total GluR2 concentration (270 nM). (B) Steady-state concentration of activated (bound by four Ca2+ ions) CaM in response to a prolonged Ca2+ input amplitude when the two-step (grey) or three-step (black) activation of CaM by Ca2+ was used. The x-axis shows the corresponding steady-state concentration of free Ca2+. Here, the initial concentrations of molecular species were as in Li et al., 2020, namely, 50 μM for CaM, Ng, PP2B, and CaMKII and 0 μM for all other species. Red dots show experimental data from Hoffman et al., 2014. (C) Concentration time course of non-protein-bound activated CaM (inset) or total activated CaM (main figure) in response to 4xHFS when the two-step (grey) or three-step (black) activation of CaM by Ca2+ was used. (D) Percentage of S880-phosphorylated GluR2 15 min after LFS when different forward rates of the activation of persistent PKC (kf between 0.00005 and 0.005 1/(nM ms)) were used. The value kf = 0.0005 1/(nM ms) gave a percentage of 47%, in close agreement with Ashby et al., 2004. (E–G) The dynamics of transiently active PKC (E) were not strongly influenced by the forward rate of the activation of persistent PKC (reaction 140), but those of persistently active PKC (F) and S880-phosphorylated GluR2 (G) were significantly affected. Black curves show the data corresponding to kf = 0.0005 1/(nM ms), while the grey lines show the data corresponding to kf = 0.00015 1/(nM ms) (dashed) and kf = 0.0015 1/(nM ms) (dotted). (H) Predicted responses of an isolated PKA activation model (reactions 59 and 93) to a 16 s cAMP input (dim grey background) when different values of the forward rate of PKA binding with four cAMP molecules were used. The curves show the concentration of the catalytic PKA subunit when different forward rates of PKA–cAMP binding (from bottom to top: 0.4 ×10⁹, 1.0×10 9, 1.6 ×10⁹, 2.2×10 9, and 2.8 ×10⁹ 1/(nM4ms)) were used. The markers show the corresponding data when the two-step PKA–cAMP binding model of Jȩdrzejewska-Szmek et al., 2017 was used. Inset: summed absolute differences between the tentative data (curves) and simulated data from the previous model (markers). The model with the forward rate of kf = 1.6 × 10⁹ 1/(nM4ms) gave the closest correspondence to the model of Jȩdrzejewska-Szmek et al., 2017. (I) Concentration of S845-phosphorylated GluR1 in response to 4xHFS when the single-step (reaction 59, black) or two-step (from Jȩdrzejewska-Szmek et al., 2017, grey) PKA–cAMP binding was used. (J) Concentration of S831-phosphorylated GluR1 in response to 4xHFS when PKC did (black) or did not (grey, overlaid) phosphorylated S831 in GluR1s.
Figure 11—figure supplement 1
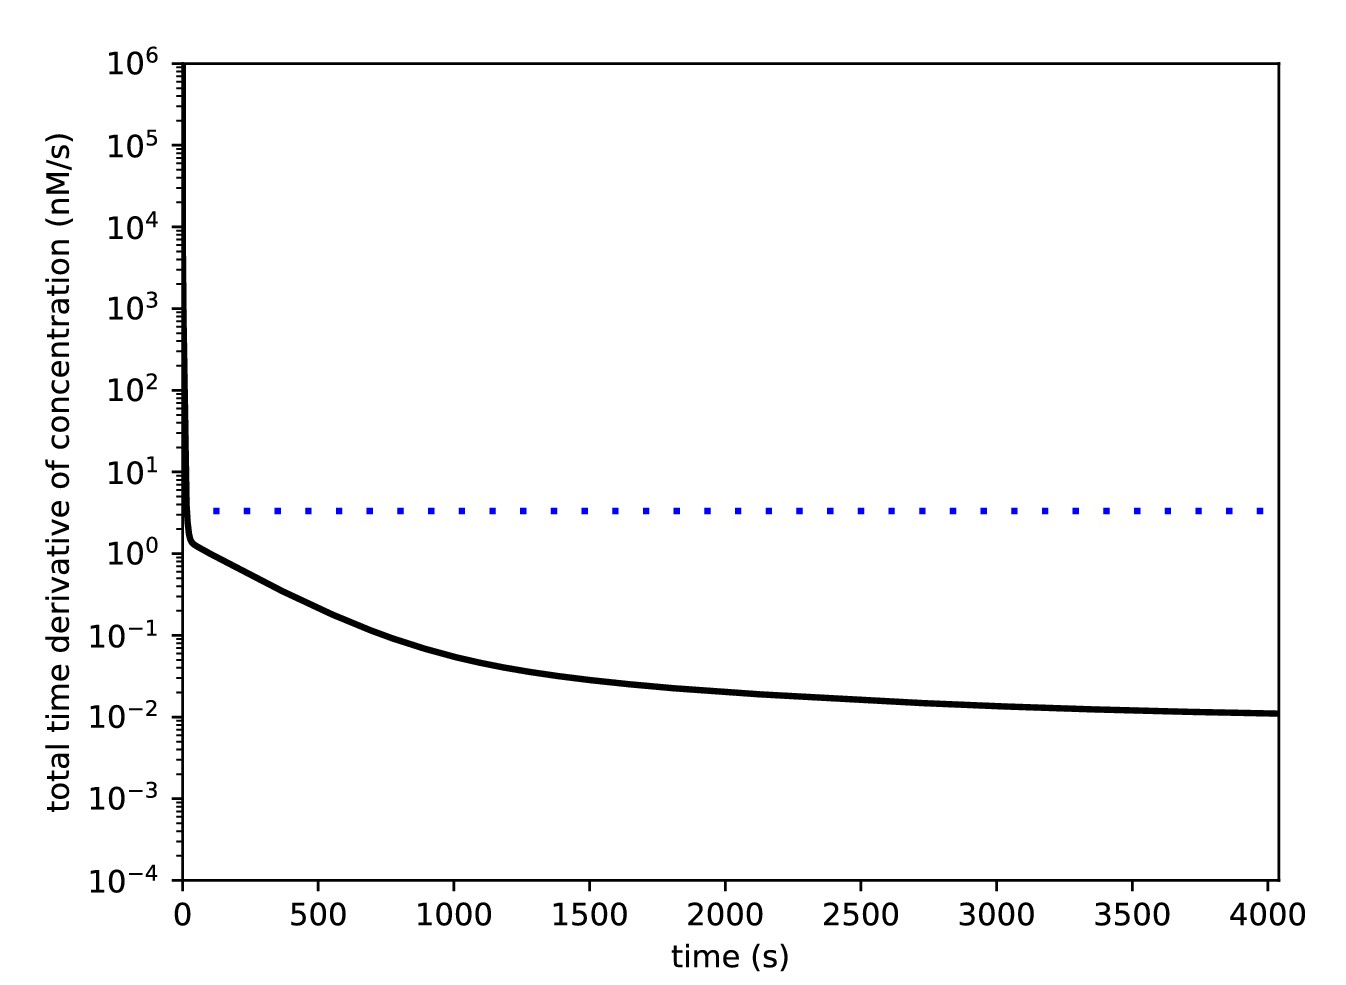
1 hr of simulation without inputs is sufficient to obtain a steady state.
The model was run for 4040 s without inputs. The absolute values of the time derivatives for each molecular species were determined, and the black curve shows the sum of these derivatives (nM/sec) across the species. The dashed blue line shows the concentration derivative value that corresponds to a change of one molecule/sec in a spine of volume 0.5 μm3.
Figure 11—figure supplement 2
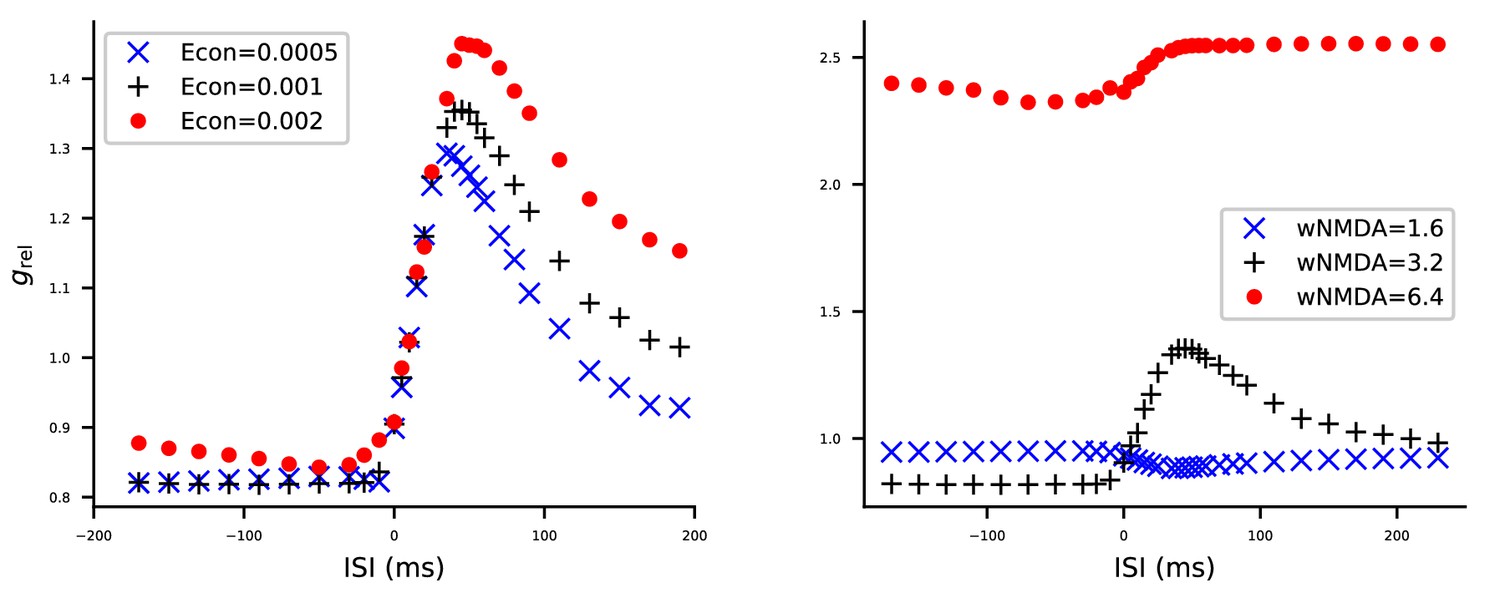
The model STDP model is robust to changes in AMPA conductance but sensitive to changes in NMDA condutance in the multicompartmental layer 2/3 pyramidal cell model.
The model of Figure 5 was simulated with altered AMPAR (A) or NMDAR (B) conductances, and the effects on STDP curves were measured. See Figure 5 for details. (A) Half (blue) or double (red) the original value (black) of the AMPAR conductances were used. (B) Half (blue) or double (red) the original value (black) of the NMDAR conductances were used.
Tables
Table 1
Pathways contributing to cortical synaptic plasticity.
(A) Experimental evidence on the requirement of various molecular species for specific types of synaptic regulation in different cortical areas. (B) Model components needed for describing the modes of plasticity listed in (A). References are made to previous computational models describing these pathways. The types of phosphorylation of AMPAR subunit that mediate the plasticity are printed in bold.
| (A) | ||||
|---|---|---|---|---|
| Pathway components | Type of neurons | Type of regulation | Pre-/post-synaptic | References |
| CaMKII | Cingulate cortex | Esophageal acid-induced sensitisation | post-syn. | Banerjee et al., 2013 |
| CaMKII | Prefrontal cortex, pyramidal neurons | 5-HT1-induced modulation of AMPA currents | post-syn. | Cai et al., 2002 |
| -adr. receptors, PKA | Visual cortex, layer 4 pyramidal cells | Potentiation of AMPA currents | post-syn. | Seol et al., 2007 |
| M1 receptors, PKC | Visual cortex, layer 4 pyramidal cells | Depression of AMPA currents | post-syn. | Seol et al., 2007 |
| D1–PKA | Prefrontal cortex, pyramidal neurons | Potentiation of AMPA currents | post-syn. | Sun et al., 2005 |
| -adr. receptors | Frontal cortex | Potentiation of field EPSPs | n/a | Sáez-Briones et al., 2015 |
| PKC | Cultured cortical neurons | Internalisation of AMPARs | post-syn. | Chung et al., 2000 |
| ERK | Visual cortex | Potentiation of field EPSPs | n/a | Di Cristo et al., 2001 |
| (B) | ||||
| Molecular pathway | Cell type and references | |||
| Ca2+ → CaM → CaMKII | Hippocampal CA1 neuron Bhalla and Iyengar, 1999; Jȩdrzejewska-Szmek et al., 2017, generic Hayer and Bhalla, 2005, | |||
| cerebellar Purkinje cells Gallimore et al., 2018, striatal spiny projection neuron Blackwell et al., 2019 | ||||
| CaMKII → GluR1 S831p | Hippocampal CA1 neuron Jȩdrzejewska-Szmek et al., 2017 | |||
| -adrenergic receptors → cAMP | Hippocampal CA1 neuron Jȩdrzejewska-Szmek et al., 2017 | |||
| cAMP → PKA | Hippocampal CA1 neuron Bhalla and Iyengar, 1999; Jȩdrzejewska-Szmek et al., 2017, cerebellar Purkinje | |||
| cells Gallimore et al., 2018 | ||||
| PKA → GluR1 S845p | Hippocampal CA1 neuron Jȩdrzejewska-Szmek et al., 2017 | |||
| M1 receptors → PLC | Cerebellar Purkinje cells Gallimore et al., 2018 | |||
| PLC → PKC | Hippocampal CA1 neuron Bhalla and Iyengar, 1999, striatal spiny projection neuron | |||
| Kim et al., 2013; Blackwell et al., 2019 | ||||
| cerebellar Purkinje cells Kotaleski et al., 2002; Gallimore et al., 2018 | ||||
| PKC → GluR2 S880p | Cerebellar Purkinje cells Gallimore et al., 2018 | |||
Table 2
List of LTP/LTD experiments in the cortex.
The first column labels the experimental data set and names the underlying study. The second column shows the considered synaptic pathway and the third column shows whether the observed LTP/LTD had a pre- or post-synaptic origin. The fourth and fifth columns show the frequency (in Hz) of stimulation and the number of pulses delivered, respectively: 10 × 4 means that 10 trains of 4 pulses with 10 ms interval (100 Hz) were delivered, and likewise, 25 × 5 means that 25 trains of 5 pulses with 10 ms interval were delivered. The sixth column tells whether the data were obtained in control conditions or under additional blockers or agonists. The seventh, eighth, ninth, and tenth columns show the relative change in synaptic strength 10, 15, and 20 min after the start of the stimulus protocol and an average SD of the relative synaptic strengths — these values were approximated from the LTP/LTD curves plotted in the underlying references. The rows correspond to experiments from a given reference that are divided to 11 different experimental data sets. Within each data set, the underlying system is assumed to be otherwise similar to the control except for the applied modifier: as an example, the chemical or genetic blockade of CaMKII activity (as performed in Ma et al., 2008 and Hardingham et al., 2003) is here expected to only affect the ability of CaMKII to autophosphorylate, and the rest of the model parameters are kept fixed. The experiments printed in grey were included in the underlying study, but were excluded from the main analyses of the present work (see main text). EC – entorhinal cortex; PFC – prefrontal cortex; BC – barrel cortex; ACC – anterior cingulate cortex; VC – visual cortex; AuC – auditory cortex; CC – corpus callosum. (*): The LFS of 900 3-ms pulses at 5 Hz in data sets VC-1 and VC-2 was replaced by 180 15-ms pulses at 1 Hz to decrease computational load in the optimisation.
| Data set | Reference | Pathway | Pre/post | Freq. | Npulses | Experiment | 10 min | 15 min | 20 min | SD |
|---|---|---|---|---|---|---|---|---|---|---|
| EC-1 | Ma et al., 2008 | horizontal | mostly | 100 | 100 | control | 1.3 | 1.4 | 1.3 | 0.1 |
| post | CaMKII blocked | 1.05 | 1.02 | 0.95 | 0.07 | |||||
| without post-syn. Ca2+ | 1.05 | 1.05 | 1.1 | 0.09 | ||||||
| EC-2 | Ma et al., 2008 | ascending | mostly | 100 | 100 | control | 1.6 | 1.6 | 1.6 | 0.11 |
| post | PKA blocked | 1.4 | 1.4 | 1.4 | 0.13 | |||||
| without post-syn. Ca2+ | 1.3 | 1.4 | 1.4 | 0.13 | ||||||
| PFC-1 | Sáez-Briones et al., 2015 | CC→PFC | n/a | 312 | 156 | control | 2.0 | 1.98 | 1.9 | 0.08 |
| without -adrenergic ligand | 1.34 | 1.4 | 1.36 | 0.09 | ||||||
| PFC-2 | Flores et al., 2011 | CC→PFC | n/a | 312 | 156 | control | 1.7 | 1.6 | 1.64 | 0.12 |
| without −1-receptor agonist | 1.43 | 1.45 | 1.43 | 0.1 | ||||||
| BC | Hardingham et al., 2003 | L4→L2/3 | n/a | 5 | 10 × 4 | control | 1.35 | 1.4 | 1.3 | 0.09 |
| CaMKII mutant | 1.25 | 1.2 | 1.1 | 0.09 | ||||||
| ACC | Song et al., 2017 | L5/6 → L2/3 | post | 5 | 10 × 4 | control | 1.55 | 1.4 | 1.4 | 0.05 |
| without s845 | 1.1 | 1.05 | 1.05 | 0.07 | ||||||
| without s831 | 1.35 | 1.4 | 1.3 | 0.1 | ||||||
| PFC-3 | Zhou et al., 2013 | L2/3 → L2/3 | mostly | 0.1 | 50 | control | 1.3 | 1.4 | 1.4 | 0.14 |
| post | without −1-receptor agonist | 1.1 | 1.2 | 1.2 | 0.13 | |||||
| VC-1 | Kirkwood et al., 1997 | L4 → L3 | n/a | 5 | 10 × 4 | (CTR, HFS) | 1.3 | 1.26 | 1.26 | 0.07 |
| (adult) | (without CaMKII, HFS) | 1.02 | 1.02 | 1.02 | 0.02 | |||||
| 5 | 900* | (CTR, LFS) | n/a | 0.95 | 0.95 | 0.05 | ||||
| (without CaMKII, LFS) | n/a | 0.88 | 0.93 | 0.03 | ||||||
| VC-2 | Kirkwood et al., 1997 | L4 → L3 | n/a | 5 | 10 × 4 | (CTR, HFS) | 1.2 | 1.18 | 1.18 | 0.05 |
| (4–5 w) | (without CaMKII, HFS) | 1.07 | 1.09 | 1.08 | 0.03 | |||||
| 5 | 900* | (CTR, LFS) | n/a | 0.79 | 0.82 | 0.03 | ||||
| (without CaMKII, LFS) | n/a | 0.82 | 0.89 | 0.03 | ||||||
| AuC-1 | Kotak et al., 2007 | L6 → L5 | n/a | 1 | 25 × 5 | LTP-expressing cells | 1.98 | 1.58 | 1.93 | 0.19 |
| AuC-2 | Kotak et al., 2007 | L6 → L5 | n/a | 1 | 25 × 5 | LTD-expressing cells | 0.77 | 0.68 | 0.67 | 0.09 |
Table 3
List of model reactions.
(A) The reaction-rate units are in 1/ms, 1/(nMms), 1/(nM2ms), 1/(nM3ms), or 1/(nM4ms), depending on the number of reactants. Reactions are grouped by similar modes of action and identical forward and backward rates. The denominators , , and represent groups of species detailed below. †: backward reaction rate proportional to [PKAc], not to [PKAc]2. (B) Groups of species as used in panel (A).
| (A) | Forw. | Backw. | Forw. | Backw. | |||
|---|---|---|---|---|---|---|---|
| ID | Reaction | Rate | Rate | ID | Reaction | Rate | Rate |
| 1 | Ca + PMCA ⇌ PMCACa | 5e-05 | 0.007 | 71 | GluR1 + ⇌ GluR1 | 2.78e-08 | 0.002 |
| 2 | PMCACa ⇌ PMCA + CaOut | 0.0035 | 0.0 | 72 | GluR1 ⇌ GluR1 + | 0.0005 | 0 |
| 3 | Ca + NCX ⇌ NCXCa | 1.68e-05 | 0.0112 | 73 | GluR1 + PKAc ⇌ GluR1 | 4e-06 | 0.024 |
| 4 | NCXCa ⇌ NCX + CaOut | 0.0056 | 0.0 | 74 | GluR1 + PP1 ⇌ GluR1 | 8.7e-07 | 0.00068 |
| 5 | CaOut + Leak ⇌ CaOutLeak | 1.5e-06 | 0.0011 | 75 | GluR1 ⇌ GluR1 + PP1 | 0.00017 | 0 |
| 6 | CaOutLeak ⇌ Ca + Leak | 0.0011 | 0.0 | 76 | GluR1 + PP1 ⇌ GluR1 | 8.75e-07 | 0.0014 |
| 7 | Ca + Calbin ⇌ CalbinC | 2.8e-05 | 0.0196 | 77 | GluR1 ⇌ GluR1 + PP1 | 0.00035 | 0 |
| 8 | L ⇌ LOut | 0.0005 | 2e-09 | 78 | GluR1 + PP2BCaMCa4 ⇌ GluR1 | 2.01e-06 | 0.008 |
| 9 | L + R ⇌ LR | 5.555e-06 | 0.005 | 79 | GluR1 ⇌ GluR1 + PP2BCaMCa4 | 0.002 | 0 |
| 10 | LR + Gs ⇌ LRGs | 6e-07 | 1e-06 | 80 | GluR1 ⇌ GluR1_memb | 2e-07 | 8e-07 |
| 11 | Gs + R ⇌ GsR | 4e-08 | 3e-07 | 81 | GluR1_S845 | ||
| 12 | GsR + L ⇌ LRGs | 2.5e-06 | 0.0005 | ⇌ GluR1_memb_S845 | 3.28e-05 | 8e-06 | |
| 13 | LRGs ⇌ LRGsbg + GsaGTP | 0.02 | 0.0 | 82 | PDE1 + CaMCa4 ⇌ PDE1CaMCa4 | 0.0001 | 0.001 |
| 14 | LRGsbg ⇌ LR + Gsbg | 0.08 | 0.0 | 83 | PDE1CaMCa4 + cAMP ⇌ PDE1CaMCa4cAMP | 4.6e-06 | 0.044 |
| 15 | + PKAc ⇌ PKAc | 8e-07 | 0.00448 | 84 | PDE1CaMCa4cAMP ⇌ PDE1CaMCa4 + AMP | 0.011 | 0.0 |
| 16 | PKAc ⇌ p + PKAc | 0.001 | 0.0 | 85 | AMP ⇌ ATP | 0.001 | 0.0 |
| 17 | ppLR + PKAc ⇌ PKAcppLR | 1.712e-05 | 0.00448 | 86 | PDE4 + cAMP ⇌ PDE4cAMP | 2.166e-05 | 0.0034656 |
| 18 | pppLR + PKAc ⇌ PKAcpppLR | 0.001712 | 0.00448 | 87 | PDE4cAMP ⇌ PDE4 + AMP | 0.017233 | 0.0 |
| 19 | ppppLR + Gi ⇌ ppppLRGi | 0.00015 | 0.00025 | 88 | + ⇌ PKAc | 2.5e-07 | 8e-05 |
| 20 | ppppLRGi ⇌ ppppLRGibg + GiaGTP | 0.000125 | 0.0 | 89 | PKAc ⇌ pPDE4 + PKAc | 2e-05 | 0.0 |
| 21 | pppp ⇌ pppp + Gibg | 0.001 | 0.0 | 90 | pPDE4 ⇌ PDE4 | 2.5e-06 | 0.0 |
| 22 | p ⇌ | 2.5e-06 | 0.0 | 91 | pPDE4 + cAMP ⇌ pPDE4cAMP | 0.000433175 | 0.069308 |
| 23 | pp ⇌ p | 2.5e-06 | 0.0 | 92 | pPDE4cAMP ⇌ pPDE4 + AMP | 0.3446674 | 0.0 |
| 24 | R + PKAc ⇌ PKAcR | 4e-08 | 0.00448 | 93 | PKAcAMP4 ⇌ PKAr + 2*PKAc | 0.00024 | 2.55e-05 |
| 25 | pR + PKAc ⇌ PKAcpR | 4e-07 | 0.00448 | 94 | Ca + fixedbuffer ⇌ fixedbufferCa | 0.0004 | 20.0 |
| 26 | ppR + PKAc ⇌ PKAcppR | 4e-06 | 0.00448 | 95 | Glu ⇌ GluOut | 0.0005 | 2e-10 |
| 27 | pppR + PKAc ⇌ PKAcpppR | 0.0004 | 0.00448 | 96 | Ca + PLC ⇌ PLCCa | 4e-07 | 0.001 |
| 28 | ppppR + Gi ⇌ ppppRGi | 7.5e-05 | 0.000125 | 97 | GqaGTP + PLC ⇌ PLCGqaGTP | 7e-07 | 0.0007 |
| 29 | ppppRGi ⇌ ppppRGibg + GiaGTP | 6.25e-05 | 0.0 | 98 | Ca + PLCGqaGTP ⇌ PLCCaGqaGTP | 8e-05 | 0.04 |
| 30 | GsaGTP ⇌ GsaGDP | 0.01 | 0.0 | 99 | GqaGTP + PLCCa ⇌ PLCCaGqaGTP | 0.0001 | 0.01 |
| 31 | GsaGDP + Gsbg ⇌ Gs | 0.1 | 0.0 | 100 | PLCCa + Pip2 ⇌ PLCCaPip2 | 3e-08 | 0.01 |
| 32 | GiaGTP ⇌ GiaGDP | 0.000125 | 0.0 | 101 | PLCCaPip2 ⇌ PLCCaDAG + Ip3 | 0.0003 | 0.0 |
| 33 | GiaGDP + Gibg ⇌ Gi | 0.00125 | 0.0 | 102 | PLCCaDAG ⇌ PLCCa + DAG | 0.2 | 0.0 |
| 34 | GsaGTP + AC1 ⇌ AC1GsaGTP | 3.85e-05 | 0.01 | 103 | PLCCaGqaGTP + Pip2 ⇌ PLCCaGqaGTPPip2 | 1.5e-05 | 0.075 |
| 35 | AC1 + CaMCa4 ⇌ AC1 | 6e-06 | 0.0009 | 104 | PLCCaGqaGTPPip2 ⇌ PLCCaGqaGTPDAG + Ip3 | 0.25 | 0.0 |
| 36 | + ATP ⇌ | 1e-05 | 2.273 | 105 | PLCCaGqaGTPDAG ⇌ PLCCaGqaGTP + DAG | 1.0 | 0.0 |
| 37 | AC1GsaGTPCaMCa4ATP | 106 | Ip3degrad + PIkinase ⇌ Ip3degPIk | 2e-06 | 0.001 | ||
| ⇌ cAMP + AC1GsaGTPCaMCa4 | 0.02842 | 0.0 | 107 | Ip3degPIk ⇌ PIkinase + Pip2 | 0.001 | 0.0 | |
| 38 | + ⇌ AC1Gsa | 6.25e-05 | 0.01 | 108 | PLC ⇌ PLC + GqaGDP | 0.012 | 0.0 |
| 39 | ⇌ cAMP + | 0.002842 | 0.0 | 109 | GqaGTP ⇌ GqaGDP | 0.001 | 0.0 |
| 40 | AC1GiaGTPCaMCa4ATP | 110 | GqaGDP ⇌ Gqabg | 0.01 | 0.0 | ||
| ⇌ cAMP + AC1GiaGTPCaMCa4 | 0.0005684 | 0.0 | 111 | Ca + DGL ⇌ CaDGL | 0.000125 | 0.05 | |
| 41 | AC1CaMCa4ATP ⇌ cAMP + AC1CaMCa4 | 0.005684 | 0.0 | 112 | DAG + CaDGL ⇌ DAGCaDGL | 5e-07 | 0.001 |
| 42 | AC8 + CaMCa4 ⇌ AC8CaMCa4 | 1.25e-06 | 0.001 | 113 | DAGCaDGL ⇌ CaDGL + 2AG | 0.00025 | 0.0 |
| 43 | CaM + 2*Ca ⇌ CaMCa2 | 1.7e-08 | 0.035 | 114 | Ip3 ⇌ Ip3degrad | 0.01 | 0.0 |
| 44 | + Ca ⇌ | 1.4e-05 | 0.228 | 115 | 2AG ⇌ 2AGdegrad | 0.005 | 0.0 |
| 45 | + Ca ⇌ | 2.6e-05 | 0.064 | 116 | DAG + DAGK ⇌ DAGKdag | 7e-08 | 0.0008 |
| 46 | CaM + Ng ⇌ NgCaM | 2.8e-05 | 0.036 | 117 | DAGKdag ⇌ DAGK + PA | 0.0002 | 0.0 |
| 47 | CaM + PP2B ⇌ PP2BCaM | 4.6e-06 | 1.2e-06 | 118 | Ca + PKC ⇌ PKCCa | 1.33e-05 | 0.05 |
| 48 | CaMCa + PP2B ⇌ PP2B | 4.6e-05 | 1.2e-06 | 119 | PKCCa + DAG ⇌ PKCt | 1.5e-08 | 0.00015 |
| 49 | PP2BCaM + 2*Ca ⇌ PP2BCaMCa2 | 1.7e-07 | 0.35 | 120 | Glu + MGluR ⇌ MGluR_Glu | 1.68e-08 | 0.0001 |
| 50 | CaMCa4 + CK ⇌ CKCaMCa4 | 1e-05 | 0.003 | 121 | MGluR_Glu ⇌ MGluR_Glu_desens | 6.25e-05 | 1e-06 |
| 51 | 2*CKCaMCa4 ⇌ Complex | 1e-07 | 0.01 | 122 | Gqabg + MGluR_Glu ⇌ MGluR_Gqabg_Glu | 9e-06 | 0.00136 |
| 52 | CKpCaMCa4 + CKCaMCa4 ⇌ pComplex | 1e-07 | 0.01 | 123 | MGluR_Gqabg_Glu ⇌ GqaGTP + MGluR_Glu | 0.0015 | 0.0 |
| 53 | CK + Complex ⇌ CK + pComplex | 1e-07 | 0.0 | 124 | GluR2 + PKC ⇌ GluR2 | 4e-07 | 0.0008 |
| 54 | 2*Complex ⇌ Complex + pComplex | 1e-05 | 0.0 | 125 | GluR2 ⇌ GluR2 + PKC | 0.0047 | 0 |
| 55 | Complex + pComplex ⇌ 2*pComplex | 3e-05 | 0.0 | 126 | GluR2 + PP2A ⇌ GluR2 | 5e-07 | 0.005 |
| 56 | CKpCaMCa4 ⇌ CaMCa4 + CKp | 8e-07 | 1e-05 | 127 | GluR2 ⇌ GluR2 + PP2A | 0.00015 | 0 |
| 57 | CKp + PP1 ⇌ CKp | 4e-09 | 0.00034 | 128 | GluR2 ⇌ GluR2_memb | 0.00024545 | 0.0003 |
| 58 | CKp ⇌ PP1 + CK | 8.6e-05 | 0.0 | 129 | GluR2_S880 ⇌ GluR2_memb_S880 | 0.0055 | 0.07 |
| 59 | PKA + 4*cAMP ⇌ PKAcAMP4 | 1.6e-15 | 6e-05 | 130 | ACh + M1R ⇌ AChM1R | 9.5e-08 | 0.0025 |
| 60 | Epac1 + cAMP ⇌ Epac1cAMP | 3.1e-08 | 6.51e-05 | 131 | Gqabg + AChM1R ⇌ AChM1RGq | 2.4e-05 | 0.00042 |
| 61 | I1 + PKAc ⇌ I1PKAc | 1.4e-06 | 0.0056 | 132 | Gqabg + M1R ⇌ M1RGq | 5.76e-07 | 0.00042 |
| 62 | I1PKAc ⇌ Ip35 + PKAc | 0.0014 | 0.0 | 133 | ACh + M1RGq ⇌ AChM1RGq | 3.96e-06 | 0.0025 |
| 63 | Ip35 + PP1 ⇌ Ip35PP1 | 1e-06 | 1.1e-06 | 134 | AChM1RGq ⇌ GqaGTP + AChM1R | 0.0005 | 0.0 |
| 64 | Ip35 + PP2BCaMCa4 ⇌ Ip35PP2B | 9.625e-05 | 0.33 | 135 | ACh ⇌ | 0.006 | 0 |
| 65 | Ip35PP2B ⇌ I1 + PP2B | 0.055 | 0.0 | 136 | Ca + PLA2 ⇌ CaPLA2 | 6e-07 | 0.003 |
| 66 | PP1PP2BCaMCa4 ⇌ PP1 + PP2BCaMCa4 | 0.0015 | 0.0 | 137 | CaPLA2 + Pip2 ⇌ CaPLA2Pip2 | 2.2e-05 | 0.444 |
| 67 | GluR1 + PKAc ⇌ GluR1 | 4.02e-06 | 0.024 | 138 | CaPLA2Pip2 ⇌ CaPLA2 + AA | 0.111 | 0.0 |
| 68 | GluR1 ⇌ GluR1 + PKAc | 0.006 | 0 | 139 | AA ⇌ Pip2 | 0.001 | 0.0 |
| 69 | GluR1 + CK ⇌ GluR1 | 2.224e-08 | 0.0016 | 140 | PKCt + AA ⇌ PKCp | 5e-09 | 1.76e-07 |
| 70 | GluR1 ⇌ GluR1 + CK | 0.0004 | 0 |
| (B) | |||||||
|---|---|---|---|---|---|---|---|
| ∈ {LR, pLR} | (, , ) ∈ { (_CKpCam, _S831, CKpCaMCa4), (_PKCt, | ||||||
| ∈ {LR, pLR, ppLR, pppLR, R, pR, ppR, pppR} | _S831, PKCt), (_PKCp, _S831, PKCp), (_S845_CKpCam, _S845_S831, | ||||||
| (, ) ∈ { (LRGibg, LR), (RGibg, R) } | CKpCaMCa4), (_S845_PKCt, _S845_S831, PKCt), (_S845_PKCp, | ||||||
| ∈ {LR, R, pR} | _S845_S831, PKCp), (_memb_CKpCam, _memb_S831, CKpCaMCa4), | ||||||
| ∈ {LR, pLR, ppLR, pR, ppR} | (_memb_PKCt, _memb_S831, PKCt), (_memb_PKCp, _memb_S831, PKCp), | ||||||
| (, ) ∈ { (GsaGTP, GsaGTPCaMCa4), (GsaGTPGiaGTP, | (_memb_S845_CKpCam, _memb_S845_S831, CKpCaMCa4), | ||||||
| GsaGTPGiaGTPCaMCa4), (, CaMCa4) } | (_memb_S845_PKCt, _memb_S845_S831, PKCt), (_memb_S845_PKCp, | ||||||
| (, ) ∈ { (AC1GsaGTPCaMCa4, AC1GsaGTPCaMCa4ATP), | _memb_S845_S831, PKCp) } | ||||||
| (AC1GsaGTPGiaGTPCaMCa4, AC1GsGiCaMCa4ATP), (AC1GiaGTPCaMCa4, | (, ) ∈ { (_S831, _S831_PKAc), (_memb_S831, | ||||||
| AC1GiaGTPCaMCa4ATP), (AC1CaMCa4, AC1CaMCa4ATP), (AC8CaMCa4, | _memb_S831_PKAc) } | ||||||
| AC8CaMCa4ATP) } | (, ) ∈ { (_S845, _S845_PP1), (_memb_S845, | ||||||
| (, , ) ∈ { (GiaGTP, AC1GsaGTP, GTPGiaGTP), (GiaGTP, | _memb_S845_PP1) } | ||||||
| AC1CaMCa4, GTPCaMCa4), (AC1GiaGTP, GsaGTP, GTPGiaGTP) } | (, ) ∈ { (_S845_PP1, ), (_memb_S845_PP1, | ||||||
| (, ) ∈ { (AC1GsGiCaMCa4ATP, AC1GsaGTPGiaGTPCaMCa4), | _memb) } | ||||||
| (AC8CaMCa4ATP, AC8CaMCa4) } | (, ) ∈ { (_S845_S831, _S845_S831_PP1), (_S831, | ||||||
| (, ) ∈ { (CaMCa2, CaMCa3), (PP2BCaMCa2, | _S831_PP1), (_memb_S845_S831, _memb_S845_S831_PP1), | ||||||
| PP2BCaMCa3) } | (_memb_S831, _memb_S831_PP1) } | ||||||
| (, ) ∈ { (CaMCa3, CaMCa4), (PP2BCaMCa3, | (, ) ∈ { (_S845_S831_PP1, _S845), (_S845_S831_PP1, | ||||||
| PP2BCaMCa4) } | _S831), (_S831_PP1, ), (_memb_S845_S831_PP1, _memb_S845), | ||||||
| (, ) ∈ { (2, CaMCa2), (4, CaMCa4) } | (_memb_S845_S831_PP1, _memb_S831), (_memb_S831_PP1, | ||||||
| ∈ {pCaMCa4, CaMCa4} | _memb) } | ||||||
| (, ) ∈ { (, PP1), (CaMCa4, CaMCa4PP1) } | (, ) ∈ { (_S845, _S845_PP2B), (_S845_S831, | ||||||
| (, ) ∈ { (PP1, ), (CaMCa4PP1, CaMCa4) } | _S845_S831_PP2B), (_memb_S845, _memb_S845_PP2B), | ||||||
| (, ) ∈ { (, CaMCa4), (PP1, P2BCaMCa4) } | (_memb_S845_S831, _memb_S845_S831_PP2B) } | ||||||
| ∈ {CaMCa4, P2BCaMCa4} | (, ) ∈ { (_S845_PP2B, ), (_S845_S831_PP2B, | ||||||
| (, ) ∈ { (, _PKAc), (_memb, _memb_PKAc) } | _S831), (_memb_S845_PP2B, _memb), (_memb_S845_S831_PP2B, | ||||||
| (, ) ∈ { (_PKAc, _S845), (_S831_PKAc, _S845_S831), | _memb_S831) } | ||||||
| (_memb_PKAc, _memb_S845), (_memb_S831_PKAc, | ∈ {, _PKAc, _CKCam, _CKpCam, _CKp, _PKCt, _PKCp, | ||||||
| _memb_S845_S831) } | _S831, _S831_PKAc, _S831_PP1} | ||||||
| (, , ) ∈ { (, CaMCa4, _CKCam), (, p, | ∈ {, _CKCam, _CKpCam, _CKp, _PKCt, _PKCp, _S831, | ||||||
| _CKp), (_S845, CaMCa4, _S845_CKCam), (_S845, p, _S845_CKp), | _PP1, _S831_PP1, _PP2B, _S831_PP2B} | ||||||
| (_memb, CaMCa4, _memb_CKCam), (_memb, p, _memb_CKp), | (, , ) ∈ { (PKAc, PDE4, PDE4), (PDE4cAMP, PKAc, | ||||||
| (_memb_S845, CaMCa4, _memb_S845_CKCam), (_memb_S845, p, | _PDE4_cAMP) } | ||||||
| _memb_S845_CKp) } | (, ) ∈ { (PDE4, ), (_PDE4_cAMP, cAMP) } | ||||||
| (, , ) ∈ { (_CKCam, _S831, CaMCa4), (_CKp, _S831, | (, ) ∈ { (GqaGTP, ), (CaGqaGTP, Ca) } | ||||||
| p), (_S845_CKCam, _S845_S831, CaMCa4), (_S845_CKp, _S845_S831, | (, , ) ∈ { (, t, _PKCt), (, p, _PKCp), | ||||||
| p), (_memb_CKCam, _memb_S831, CaMCa4), (_memb_CKp, _memb_S831, | (_memb, t, _memb_PKCt), (_memb, p, _memb_PKCp) } | ||||||
| p), (_memb_S845_CKCam, _memb_S845_S831, CaMCa4), | (, , ) ∈ { (_PKCt, _S880, t), (_PKCp, _S880, p), | ||||||
| (_memb_S845_CKp, _memb_S845_S831, p) } | (_memb_PKCt, _memb_S880, t), (_memb_PKCp, _memb_S880, p) } | ||||||
| (, , ) ∈ { (, CKpCaMCa4, _CKpCam), (, | (, ) ∈ { (_S880, _S880_PP2A), (_memb_S880, | ||||||
| PKCt, _PKCt), (, PKCp, _PKCp), (_S845, CKpCaMCa4, | _memb_S880_PP2A) } | ||||||
| _S845_CKpCam), (_S845, PKCt, _S845_PKCt), (_S845, PKCp, | (, ) ∈ { (_S880_PP2A, ), (_memb_S880_PP2A, | ||||||
| _S845_PKCp), (_memb, CKpCaMCa4, _memb_CKpCam), (_memb, PKCt, | _memb) } | ||||||
| _memb_PKCt), (_memb, PKCp, _memb_PKCp), (_memb_S845, CKpCaMCa4, | ∈ {, _PKCt, _PKCp} | ||||||
| _memb_S845_CKpCam), (_memb_S845, PKCt, _memb_S845_PKCt), | ∈ {, _PP2A} | ||||||
| (_memb_S845, PKCp, _memb_S845_PKCp) } | |||||||
Table 4
List of initial concentrations of molecular species.
All non-mentioned species have an initial concentration of 0 nM.
| Species | Conc. (nM) | Species | Conc. (nM) | Species | Conc. (nM) | |||
|---|---|---|---|---|---|---|---|---|
| CaOut | extracell. Ca2+ | 1900000 | AMP | adenosine monophosphate | 980 | Pip2 | phosphatidylinositol 4,5-bisphosphate | 24000 |
| Leak | leak channels | 2000 | Ng | neurogranin | 20000 | PIkinase | phosphatidylinositol kinase | 290 |
| Calbin | calbindin | 150000 | CaM | calmodulin | 60000 | Ip3degPIk | Ip3-bound PI kinase | 400 |
| CalbinC | Ca2+-bound calbindin | 15000 | PP2B | protein phosphatase 2B | 2300 | PKC | protein kinase C | 15000 |
| LOut | extracell. β-adr. ligand | 2500000 | CK | CaMKII | 23000 | DAG | diacylglycerol | 90 |
| Epac1 | Epac1 | 500 | PKA | protein kinase A | 6400 | DAGK | DAG kinase | 300 |
| PMCA | Ca2+ pump | 22000 | I1 | inhibitor-1 | 2200 | DGL | DAG lipase | 1600 |
| NCX | Ca2+ exchanger | 540000 | PP1 | protein phosphatase 1 | 1600 | CaDGL | Ca2+-bound DAG lipase | 250 |
| L | β-adrenergic ligand | 10 | GluR1 | AMPAR subunit type 1 | 180 | DAGCaDGL | Ca2+-and DAG-bound DAG lipase | 90 |
| R | β-adrenergic receptor | 1600 | GluR1_memb | membrane-inserted GluR1 | 90 | Ip3degrad | degraded Ip3 | 600 |
| Gs | S-type G-protein | 13000 | PDE4 | phosphodiesterase type 4 | 670 | GluR2 | AMPAR subunit type 2 | 14 |
| Gi | I-type G-protein | 2600 | fixedbuffer | immobile buffer | 500000 | GluR2_memb | membrane-inserted GluR2 | 256 |
| AC1 | adenylyl cyclase type 1 | 430.0 | mGluR | metab. glutamate receptor | 800 | PP2A | protein phosphatase 2A | 500 |
| ATP | adenosine triphosphate | 2000000 | GluOut | extracell. glutamate | 1000000 | M1R | acetylcholine receptor M1 | 450 |
| AC8 | adenylyl cyclase type 8 | 370 | Gqabg | Q-type G-protein | 1400 | PLA2 | phospholipase A2 | 1000 |
| PDE1 | phosphodiesterase type 1 | 12000 | PLC | phospholipase C | 250 |
Download links
A two-part list of links to download the article, or parts of the article, in various formats.
Downloads (link to download the article as PDF)
Open citations (links to open the citations from this article in various online reference manager services)
Cite this article (links to download the citations from this article in formats compatible with various reference manager tools)
A unified computational model for cortical post-synaptic plasticity
eLife 9:e55714.
https://doi.org/10.7554/eLife.55714


