Apical length governs computational diversity of layer 5 pyramidal neurons
- The Francis Crick Institute, United Kingdom
- University College London, United Kingdom
- Birkbeck College, University of London, United Kingdom
Figures
Figure 1 with 1 supplement
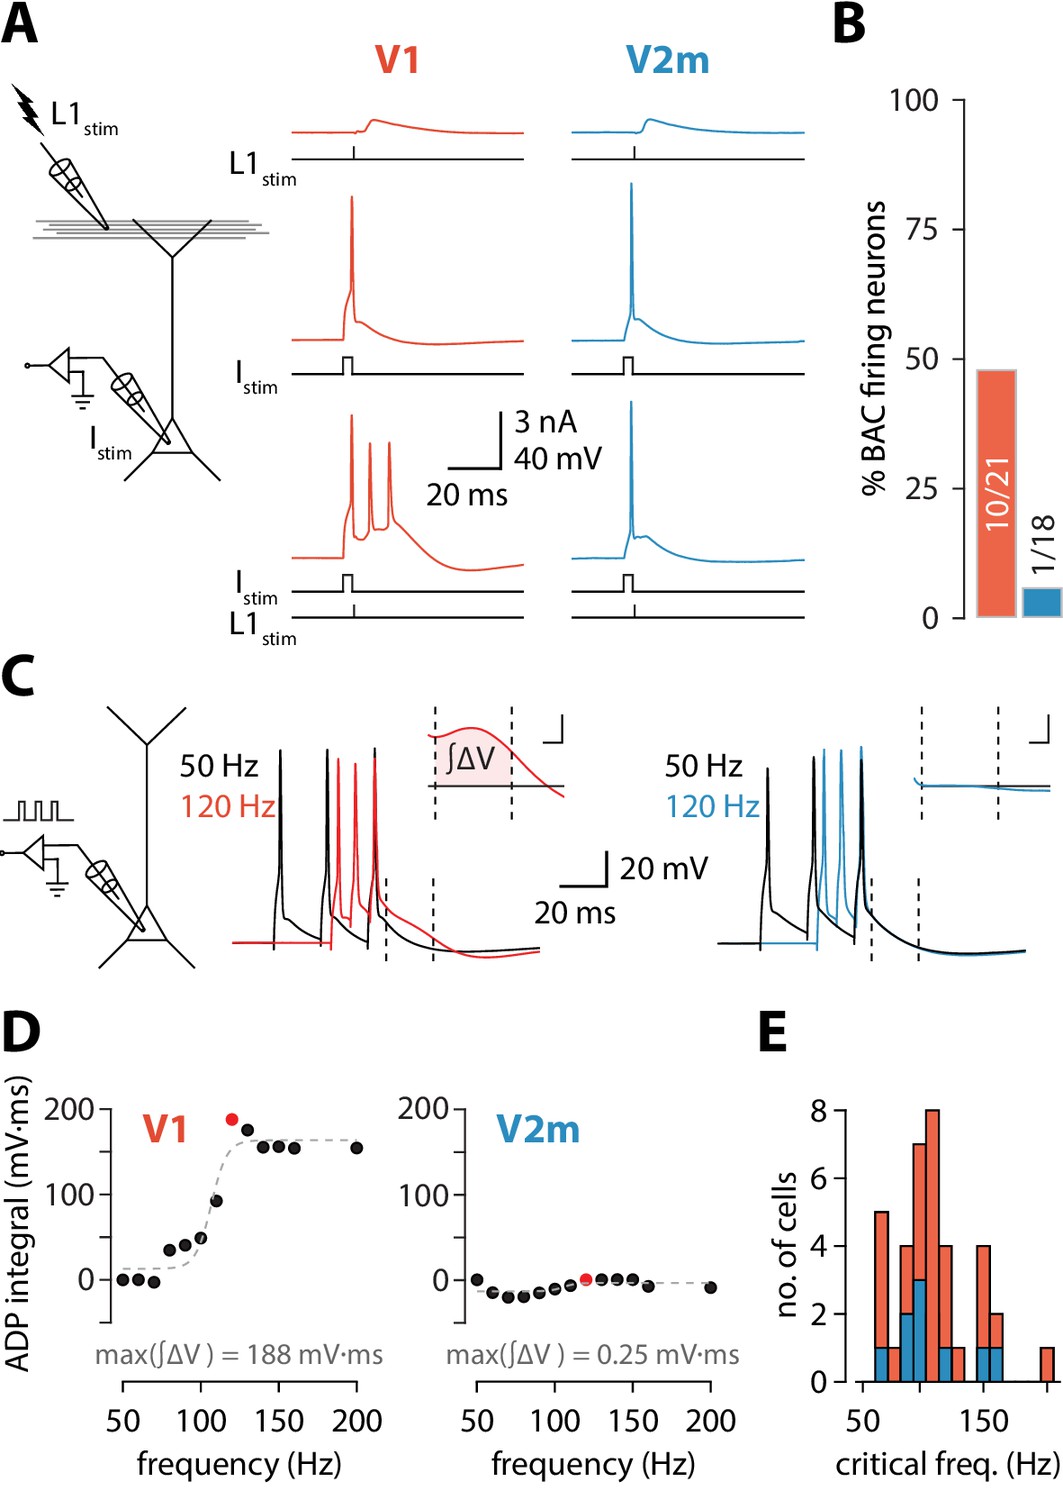
Reduced dendritic Ca2+ electrogenesis in V2m ttL5 neurons.
(A) Left: diagram of experimental configuration. Right: example traces during BAC firing protocol, recorded from V1 (red) and V2m (blue) ttL5 neurons. (B) Proportion of BAC firing neurons in V1 and V2m. (C) Left: diagram of experimental configuration. Right: example traces of V1 and V2m ttL5 neurons stimulated with 50 Hz and 120 Hz AP trains. Note the sustained after-depolarization following the 120 Hz spike train in the V1 neuron. Inset: ADP measured as the area between the 50 Hz trace and the higher frequency trace following the last spike. Inset scale bar: 5 ms x 5 mV. (D) Quantification of ADP area at each measured frequency for the example neurons in C. The peak integral value is highlighted in red. (E) Histogram of all recorded cells with defined critical frequency.
Figure 1—figure supplement 1
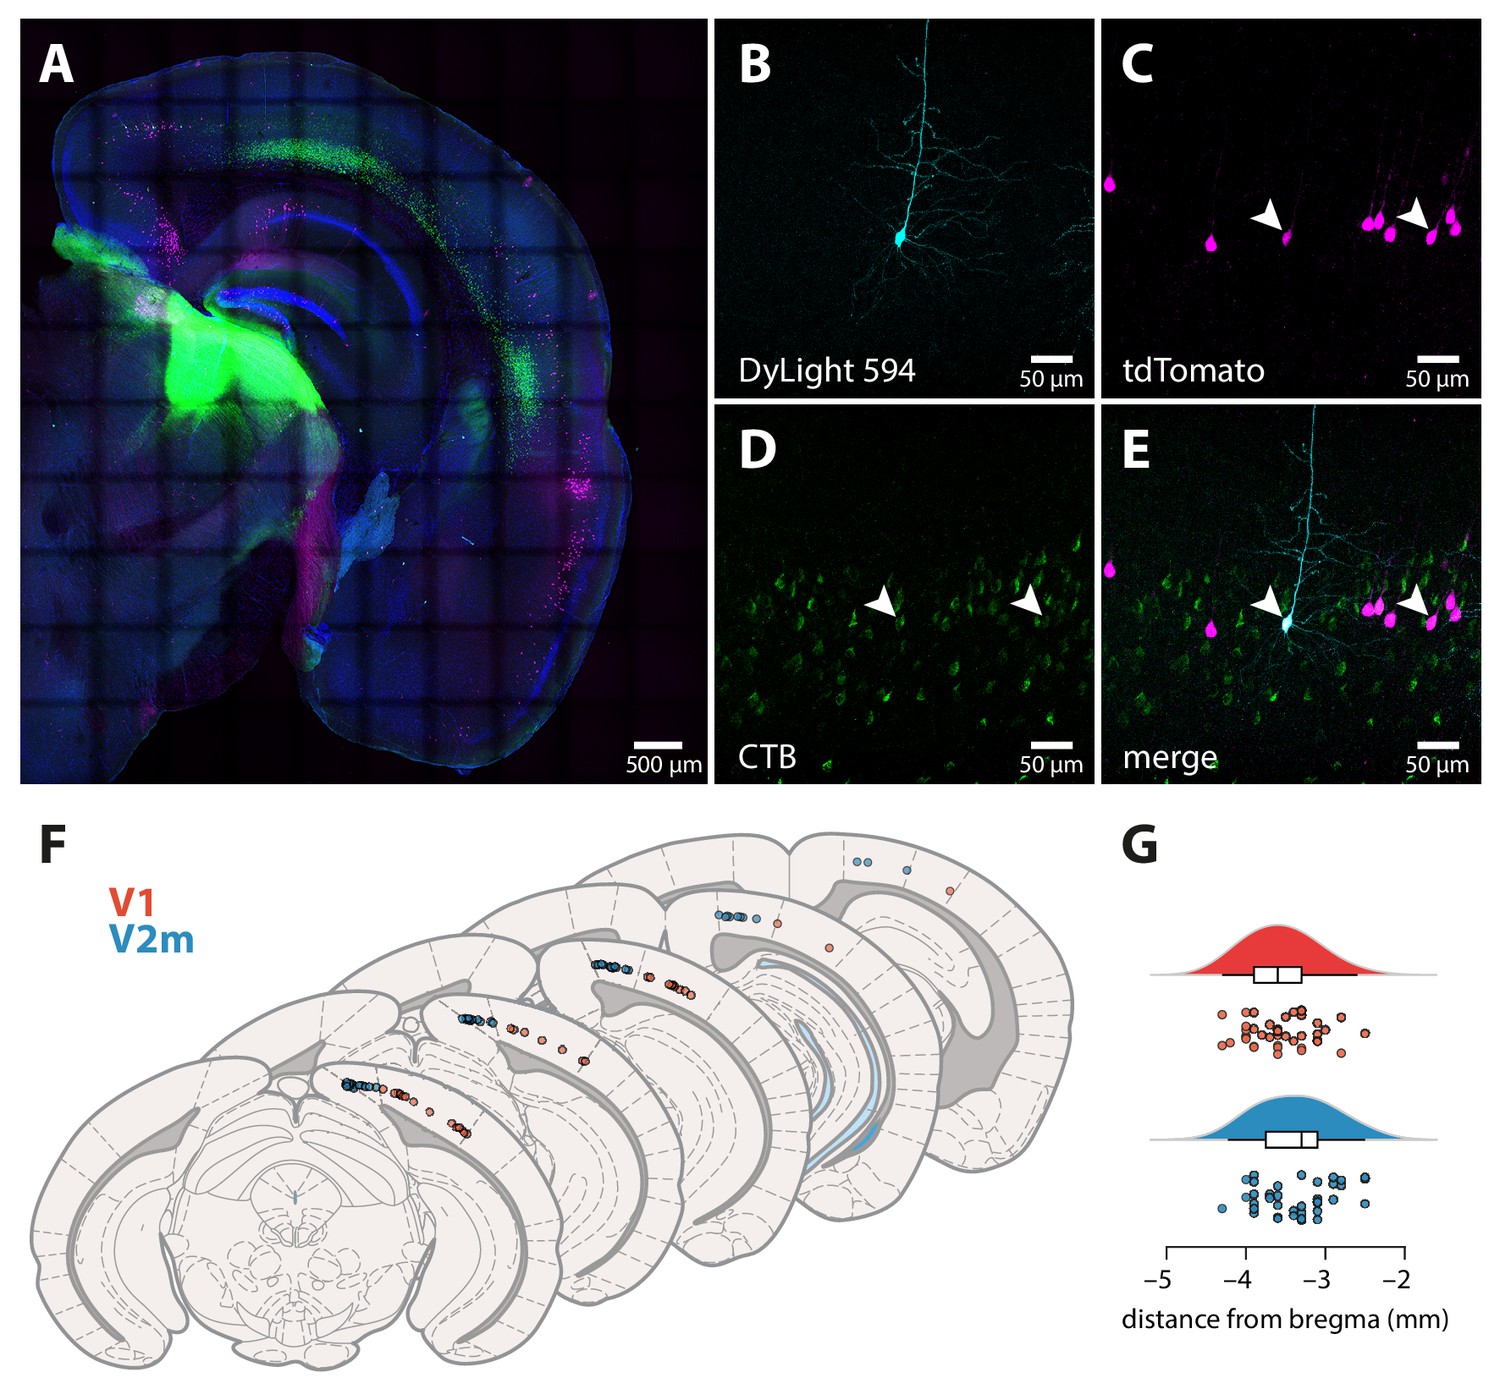
Identification of ttL5 neurons and recording locations in V1 and V2m.
(A) Coronal slice containing visual cortex and LP, showing the injection site and retrogradely labelled neurons (green), tdTomato-expressing Colgalt2-Cre neurons (magenta), a DAPI stain (blue), and neurons that have been filled with biocytin during intracellular recordings and stained with DyLight 594 (cyan). (B) Biocytin-filled ttL5 neuron in V2m. (C) Neighbouring tdTomato-expressing Colgalt2-Cre neurons. (D) CTB-labelled L5 neurons projecting to LP. (E) Composite image of the above. Arrowheads highlight two example cells labelled by both tdTomato and CTB. (F) Schematic of coronal sections, adapted from Franklin and Paxinos, 2007, showing approximate mediolateral locations of V1 (red) and V2m (blue) neurons recorded in the cfADP experiments (90 out of the 129 neurons recorded in total). For visualization, neurons were projected onto the closest of the five atlas sections shown. (G) Approximate anteroposterior locations of the neurons relative to bregma.
Figure 2 with 4 supplements
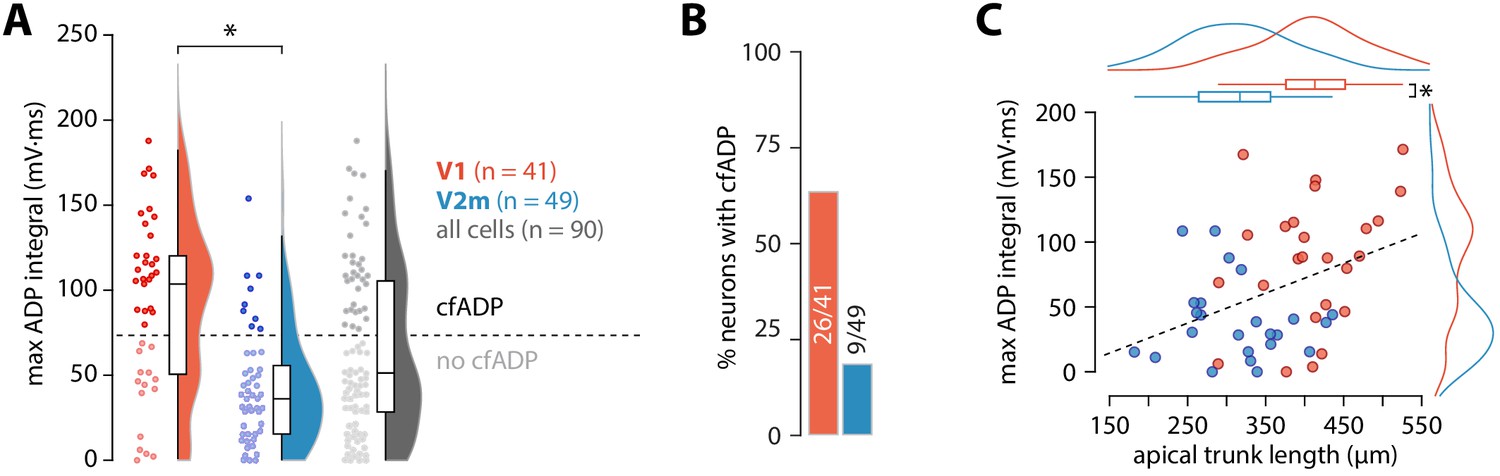
ADP integral correlates with apical trunk length.
(A) Summary data of maximum ADP integral values for all recorded neurons. The dashed line denotes the division between the two groups of cells classified through k-means clustering; asterisk denotes p = 4.54 * 10−6, D = 0.52; two-sample Kolmogorov-Smirnov test. (B) Proportion of cells with cfADP in V1 and V2m. (C) Length of the apical trunk (soma to main bifurcation) plotted against the corresponding maximum ADP integral values. Dashed line is a linear fit (r2 = 0.154, p = 5.37*10-3, F-test); curves at the top and right are kernel density plots of the two variables in V1 and V2m; asterisk denotes p = 4.26*10−6, two-sample t-test.
Figure 2—figure supplement 1

Maximum ADP integral for all cells split by recording ACSF containing either 1.5 or 2 mM CaCl2.
p and D values are shown for a two-sample Kolmogorov-Smirnov test. All cells recorded during this study in 1.5 mM CaCl2 are included.
Figure 2—figure supplement 2

Maximum ADP integral for all cells including V1 (grey), retro-labelled cells recorded from V2m (blue), and V2m cells labelled in the Colgalt2-Cre mouse line (cyan).
p and D value are shown for a two-sample Kolmogorov-Smirnov test. All cells recorded during this study from Colgalt2-Cre animals are included.
Figure 2—figure supplement 3
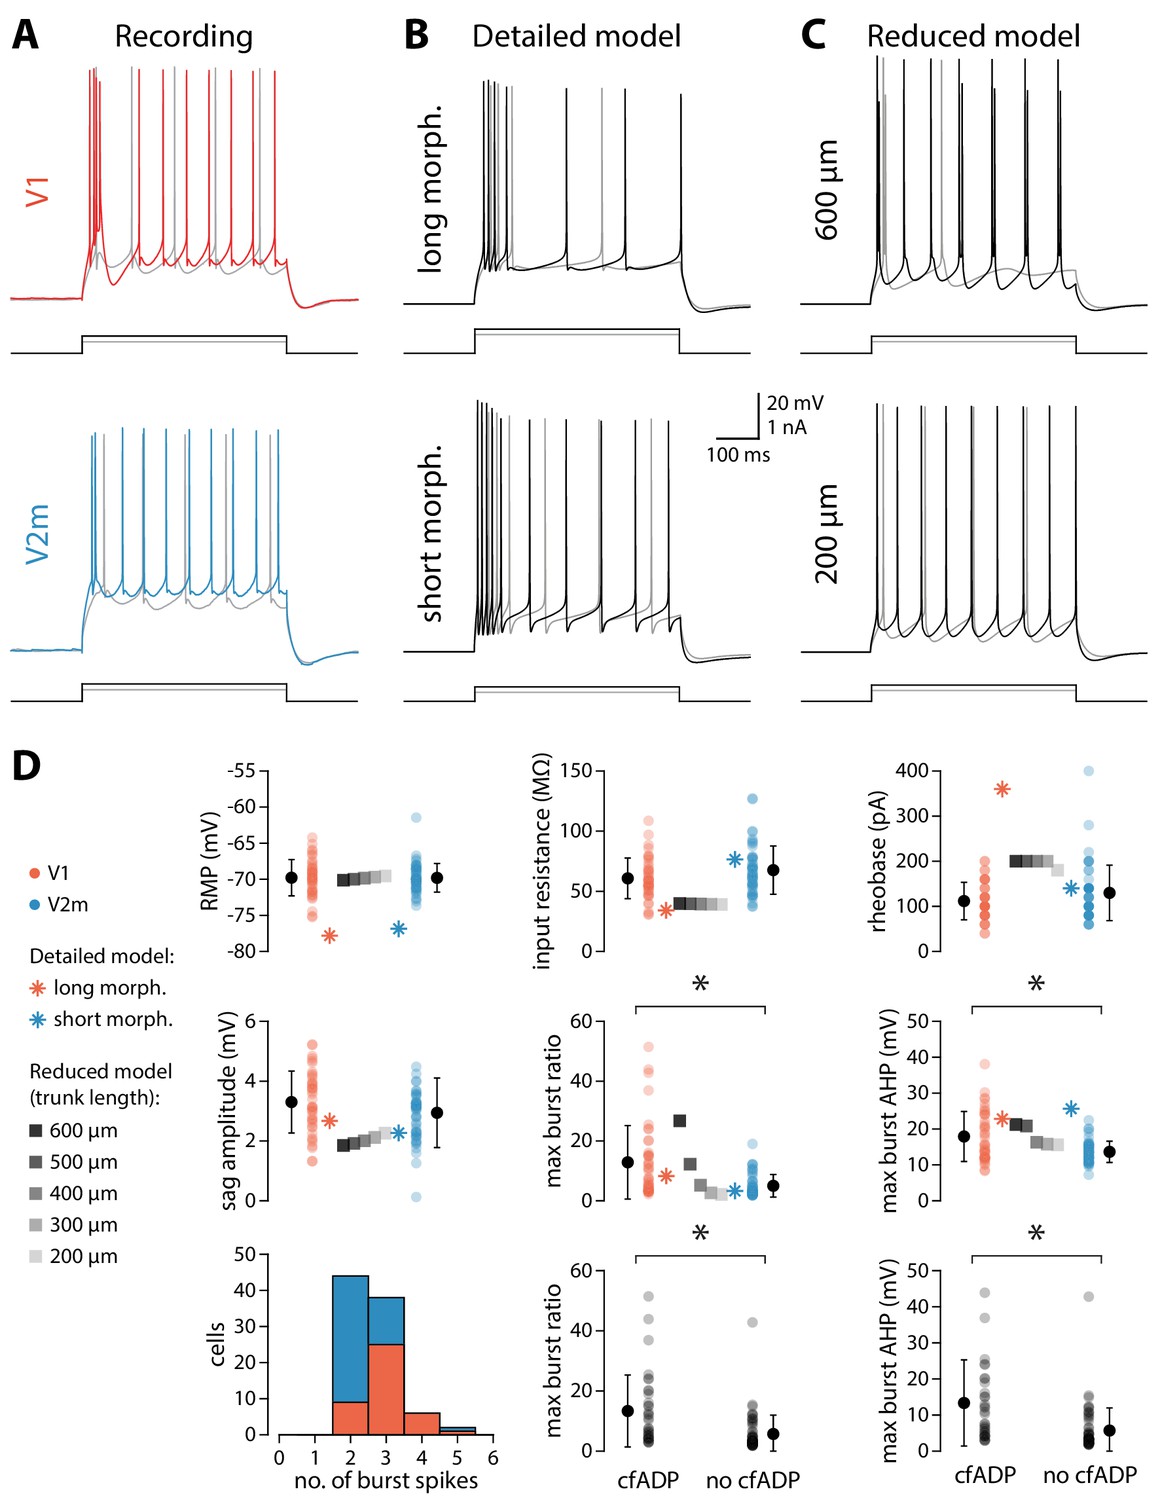
Intrinsic properties of in vitro and in silico recorded neurons.
(A) Representative voltage traces for V1 and V2m neurons in response to 500 ms wide depolarizing current steps. The traces show stimulation at 60 pA (grey) and 180 pA (coloured or black) above rheobase for each cell. (B) Same as in A but for the detailed model with the long and short morphology. (C) Same as in A but for the reduced model with a trunk length of either 600 μm or 200 μm. (D) Quantification of a range of biophysical properties for both recorded and model neurons. Asterisk denotes p < 0.0083 (Bonferroni-corrected).
Figure 2—figure supplement 4
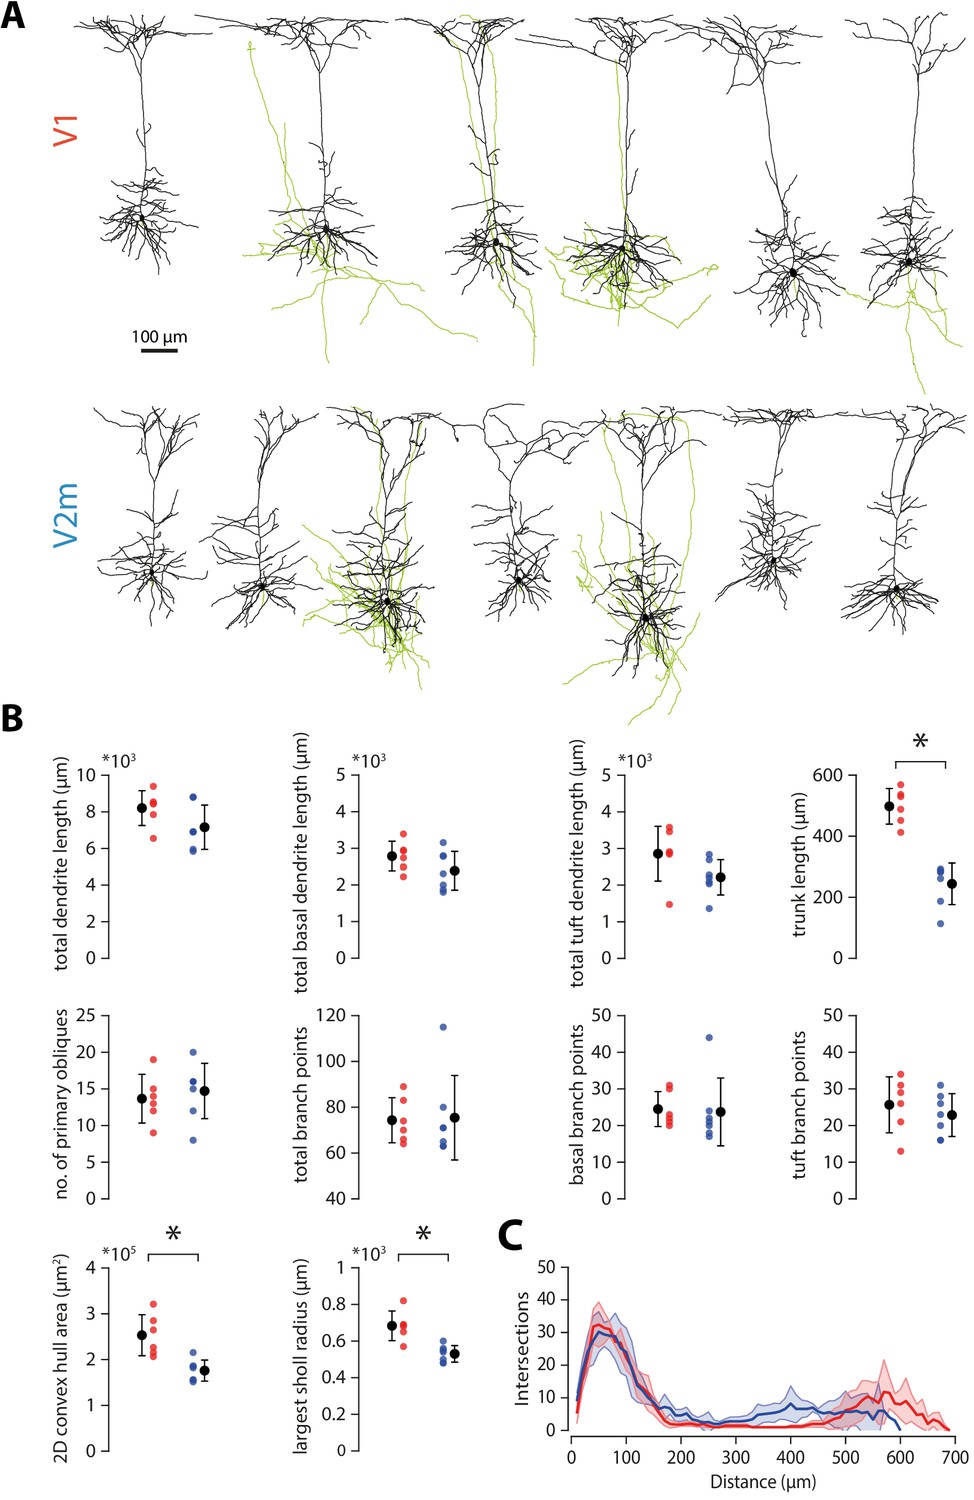
Reconstructions and morphological analysis of V1 and V2m neurons.
(A) Full reconstructions of 6 neurons in V1 (top) and 7 neurons in V2m (bottom), labelled with CTB and filled with biocytin during recordings. Black: dendrites and soma. Green: axons. (B) Quantification of morphological parameters from the reconstructed neurons shown in A. Asterisk denotes p < 0.005 Bonferroni-corrected two-sample t-test. (C) Sholl analysis, showing number of dendritic intersections with concentric spheres in 10 μm increments from the soma.
Figure 3 with 2 supplements
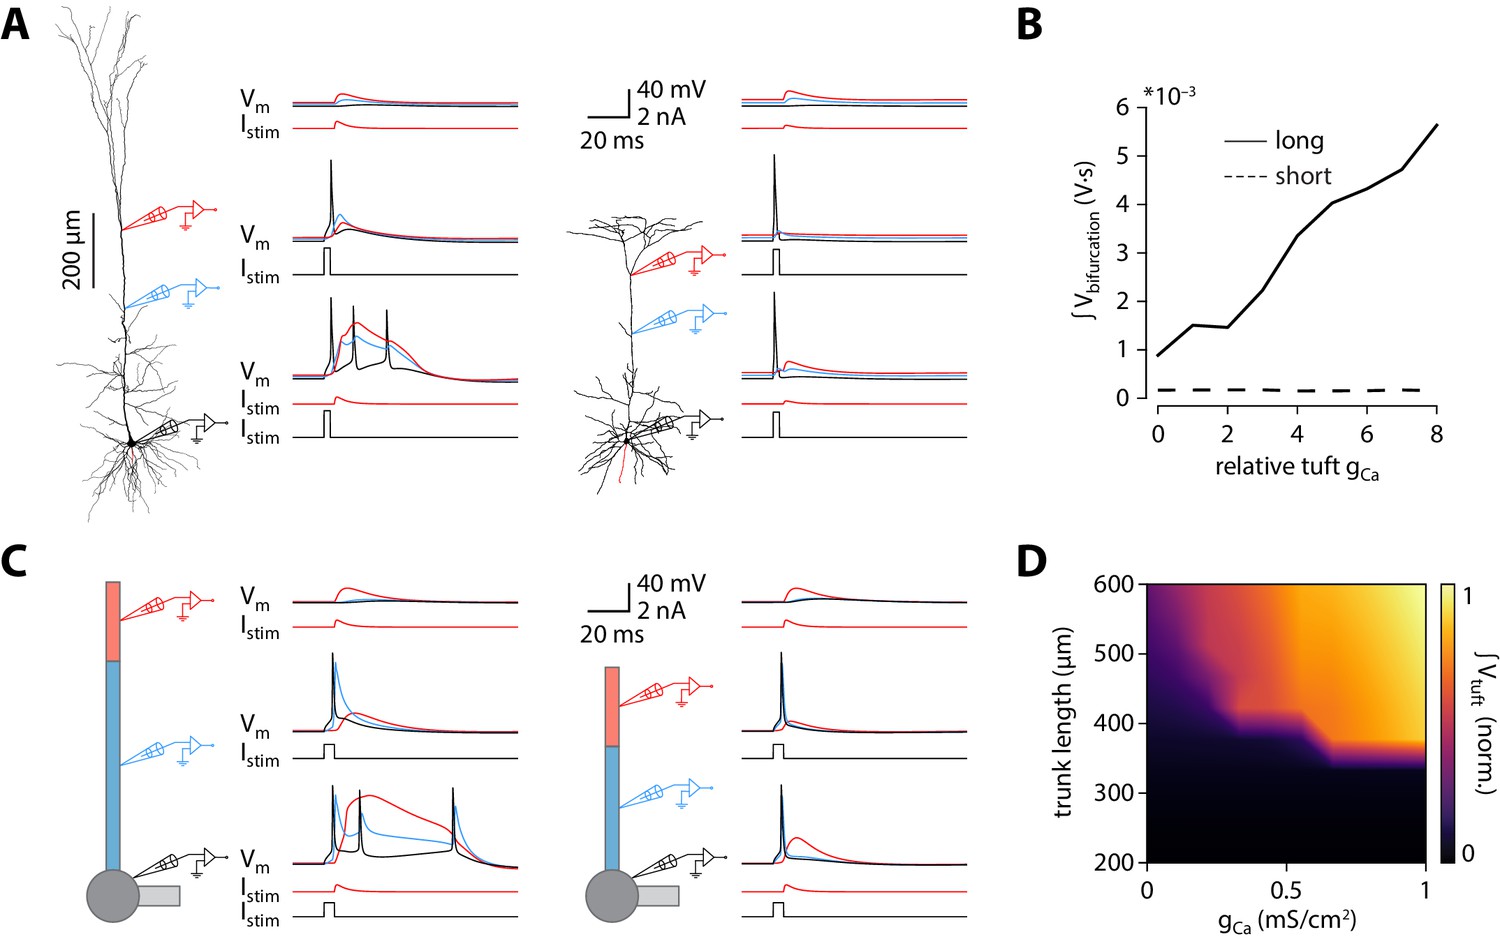
Shorter model neurons are less prone to burst.
(A) Left: detailed morphology of a ttL5 neuron from the model favoured by Hay et al., 2011 for reproducing BAC firing. Right: reconstructed morphology of the ttL5 neuron from V2m. Injected current and recorded voltage traces are shown for the soma (black), the apical trunk (blue, 400 and 200 µm from the soma), and the main bifurcation (red, 620 and 370 µm from the soma) under three different stimulation paradigms. (B) Integral of voltage at the branch point during coincident somatic and branch point stimulation, plotted against relative gCa. (C) Left: diagram of the reduced neuron model. Apical trunk length 600 μm. Injected current and recorded voltage traces as in A. Right: Same for a version of the reduced model modified to have an apical trunk length of 200 μm. (D) Heat map representing the normalised tuft voltage integral during combined somatic and tuft stimulation in the reduced model, plotted against the absolute density of Ca2+ channels in the tuft compartment and the length of the apical trunk compartment. Default gCa ≅ 0.45 mS/cm2.
Figure 3—figure supplement 1
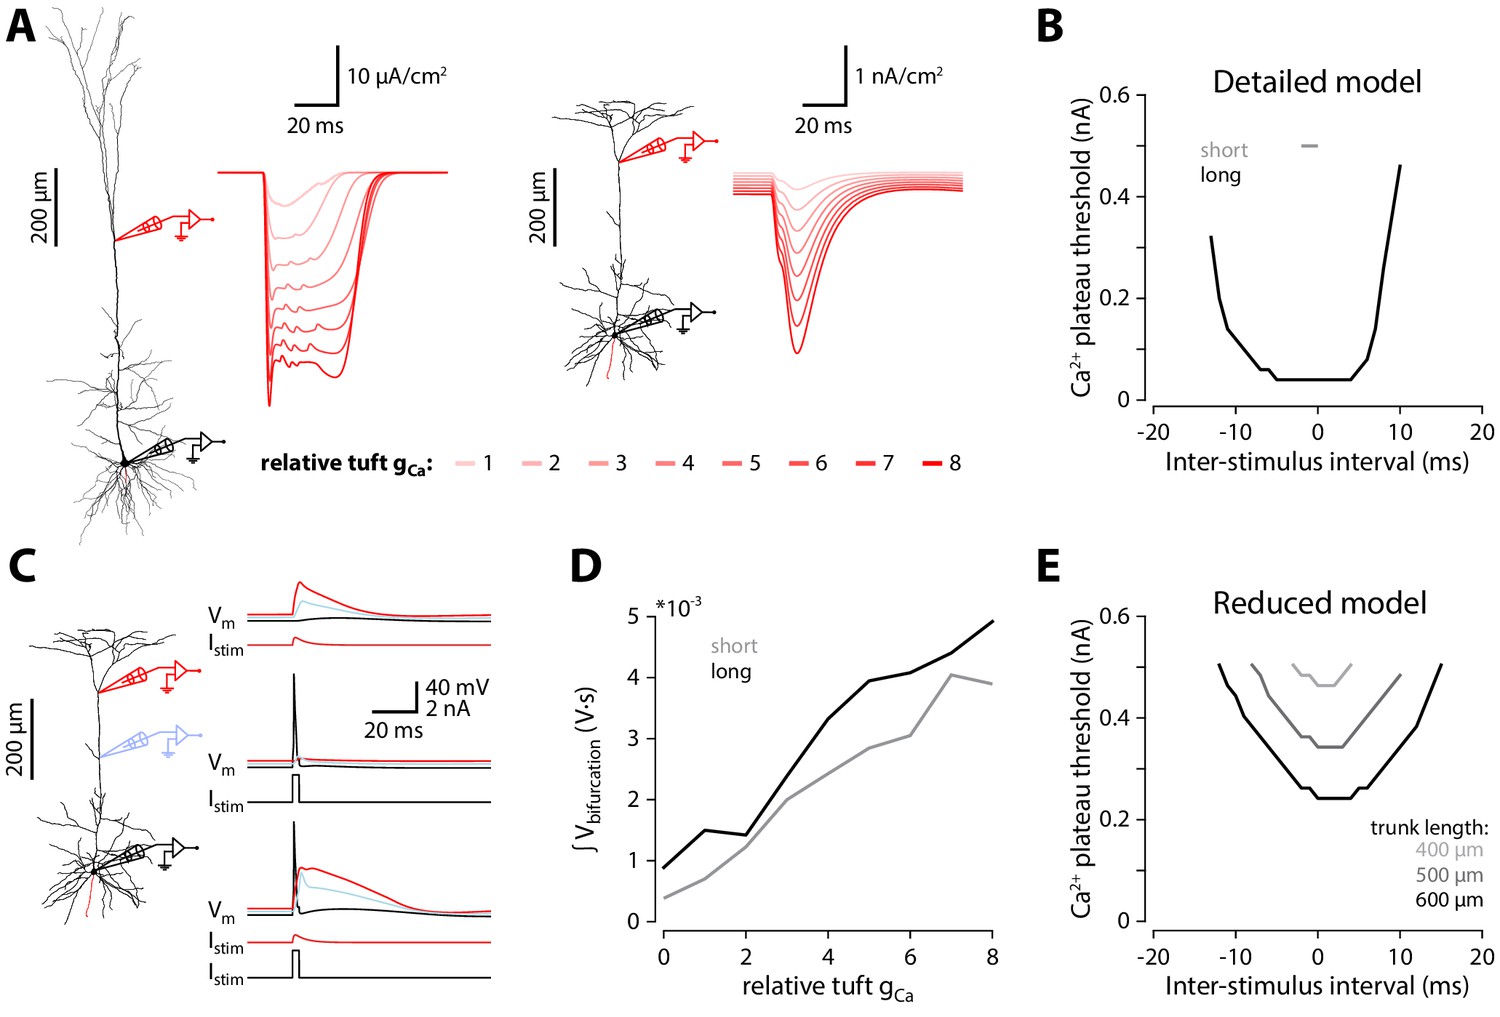
Exploration of Ca2+ electrogenesis under diverse stimulus timings and intensities.
(A) Calcium current densities at the apical bifurcation during coincident stimulation for different relative levels of tuft gCa (as in Figure 3B). N.B. there is a factor of 104 difference in scale between the traces for the long and short morphology. (B) Smallest dendritic current required to trigger a Ca2+ plateau in the long and short detailed models during coincident stimulation with different time intervals between the somatic and dendritic stimuli. Ca2+ plateau threshold: 1.25 μA/cm2. (C) Voltage traces for the short morphology during the strongest stimulation (Δt = 0; 0.5 nA). (D) Integral of the voltage at the apical bifurcation of the long and short models during the strongest stimulation (Δt = 0; 0.5 nA) with different levels of tuft gCa. (E) Same as in A, but for the reduced model. Trunk lengths of 300 μm and lower did not elicit Ca2+ plateaus for any amplitude of current injection.
Figure 3—figure supplement 2
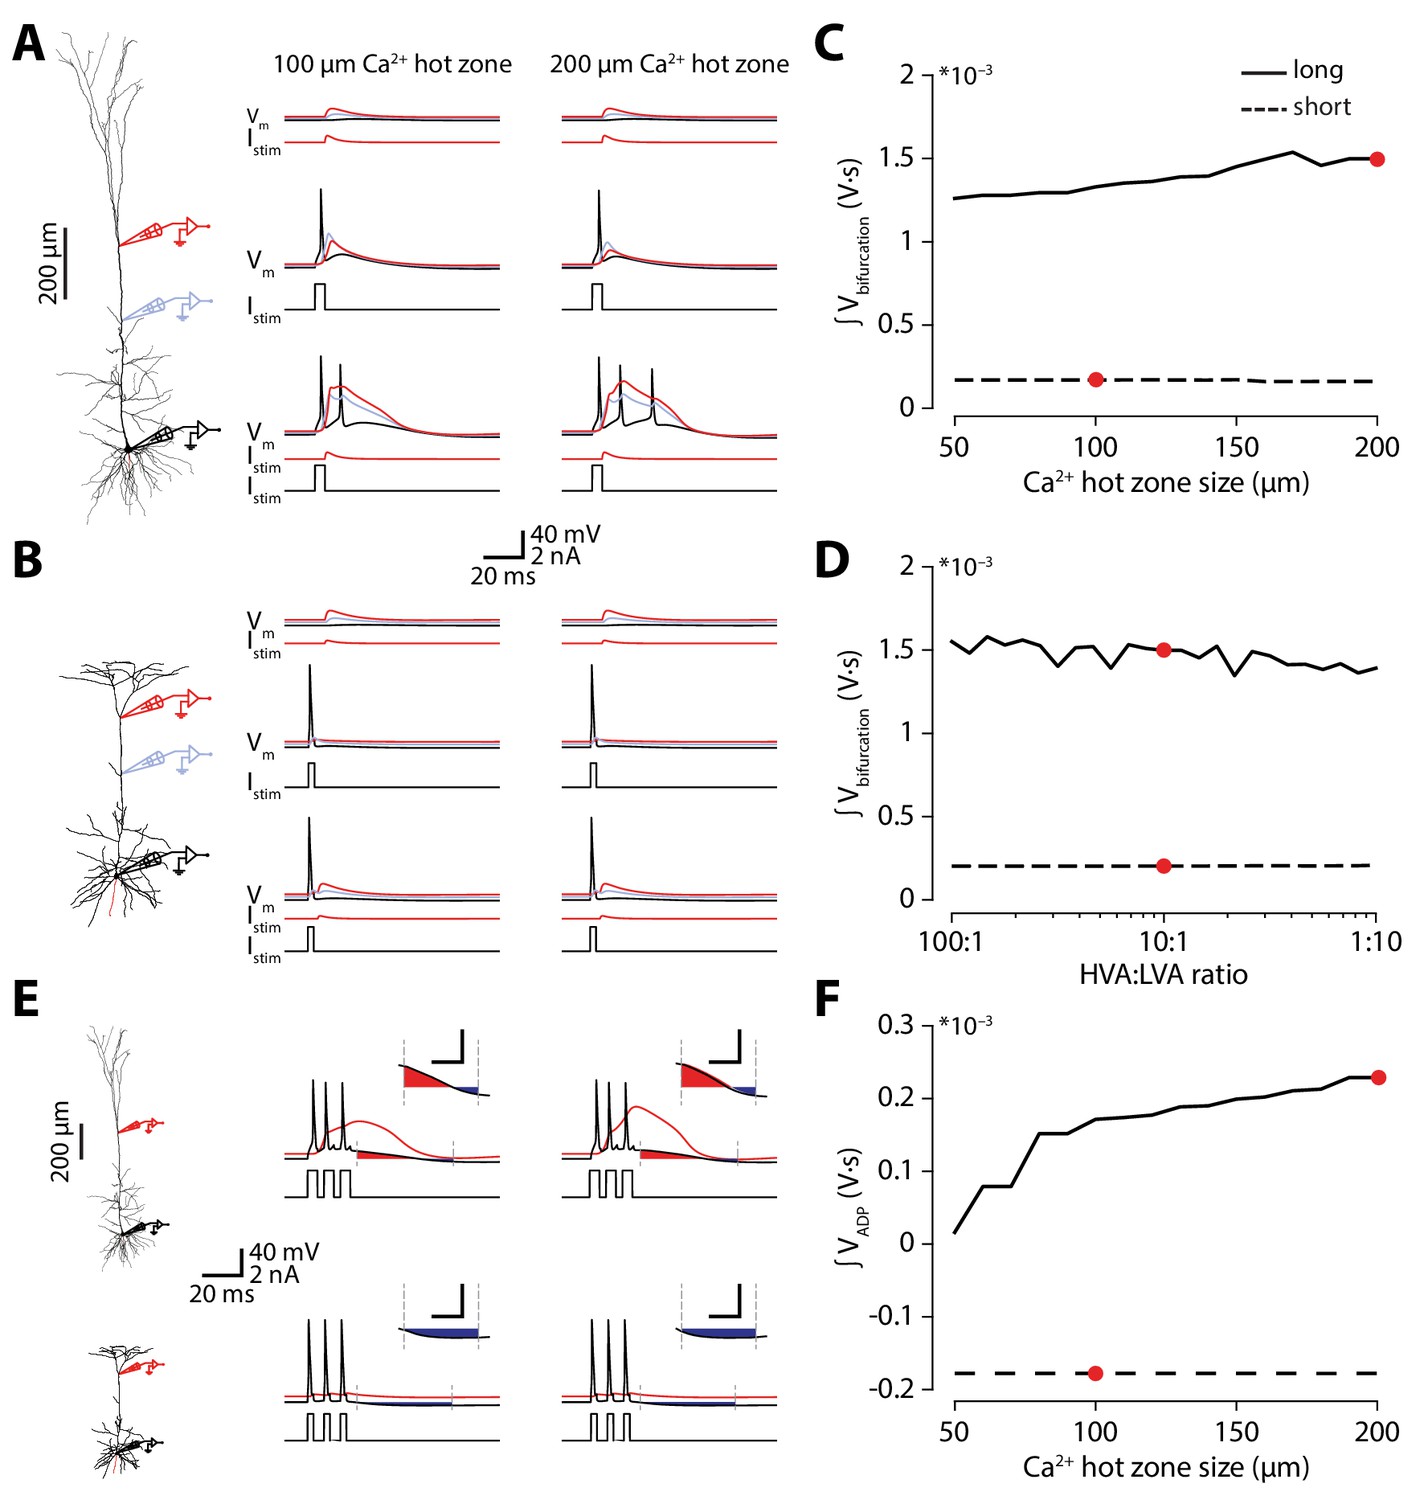
Hot zone size or Ca2+ channel ratio does not account for differences in Ca2+ electrogenesis.
(A) Voltage traces recorded from different parts of the long neuronal morphology containing either a 200 μm (as in the original), or 100 μm long Ca2+ hot zone in the distal apical trunk. (B) Same as in A, but for the short morphology. (C) Integral of the voltage at the distal recording electrode during coincident stimulation for long and short morphologies with different sizes of Ca2+ hot zone sizes. The red points indicate the model parameters used in Figure 3. (D) As in C, but with different ratios of HVA to LVA Ca2+ conductances. The red points indicate the model parameters used in Figure 3. (E) Dendritic and somatic voltage traces during high-frequency somatic stimulation (120 Hz). The cfADP was measured as the integral (relative to the resting potential) in a 50 ms window following the last spike. Inset: magnification of quantified cfADP area (scale bar: 20 ms x 20 mV). (F) Quantification of cfADP integral shown in E for different Ca2+ hot zone sizes. The red points indicate the model parameters used in Figure 3.
Figure 4 with 4 supplements
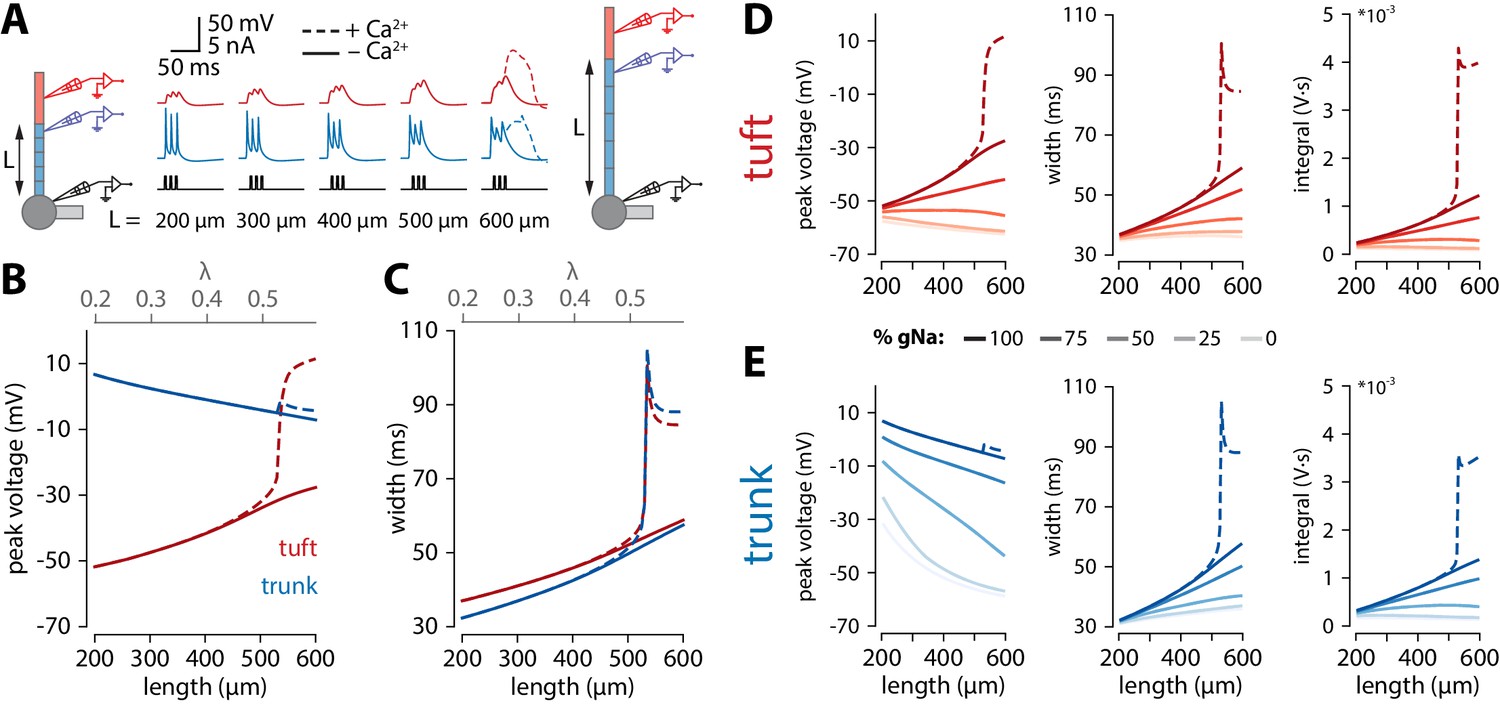
Tuft voltage increases with trunk length due to the widening of bAPs.
(A) Schematic of the simulation: stimulation site in the somatic compartment and recording sites at the distal end of the apical trunk (blue) and in the centre of the tuft (red). Stimulus shown in black. Solid lines: gCa = 0; dashed lines: original gCa. (B) Peak voltage reached in trunk (blue) and tuft (red) for a range of simulations with different trunk lengths. Length constant λ = 1009 µm. (C) Same as in B but plotting the width of the depolarization measured 2 mV above baseline. (D, E) Peak voltage, width, and integral values measured in the trunk and tuft for dendrites containing different Na+ channel densities in the apical trunk.
Figure 4—figure supplement 1
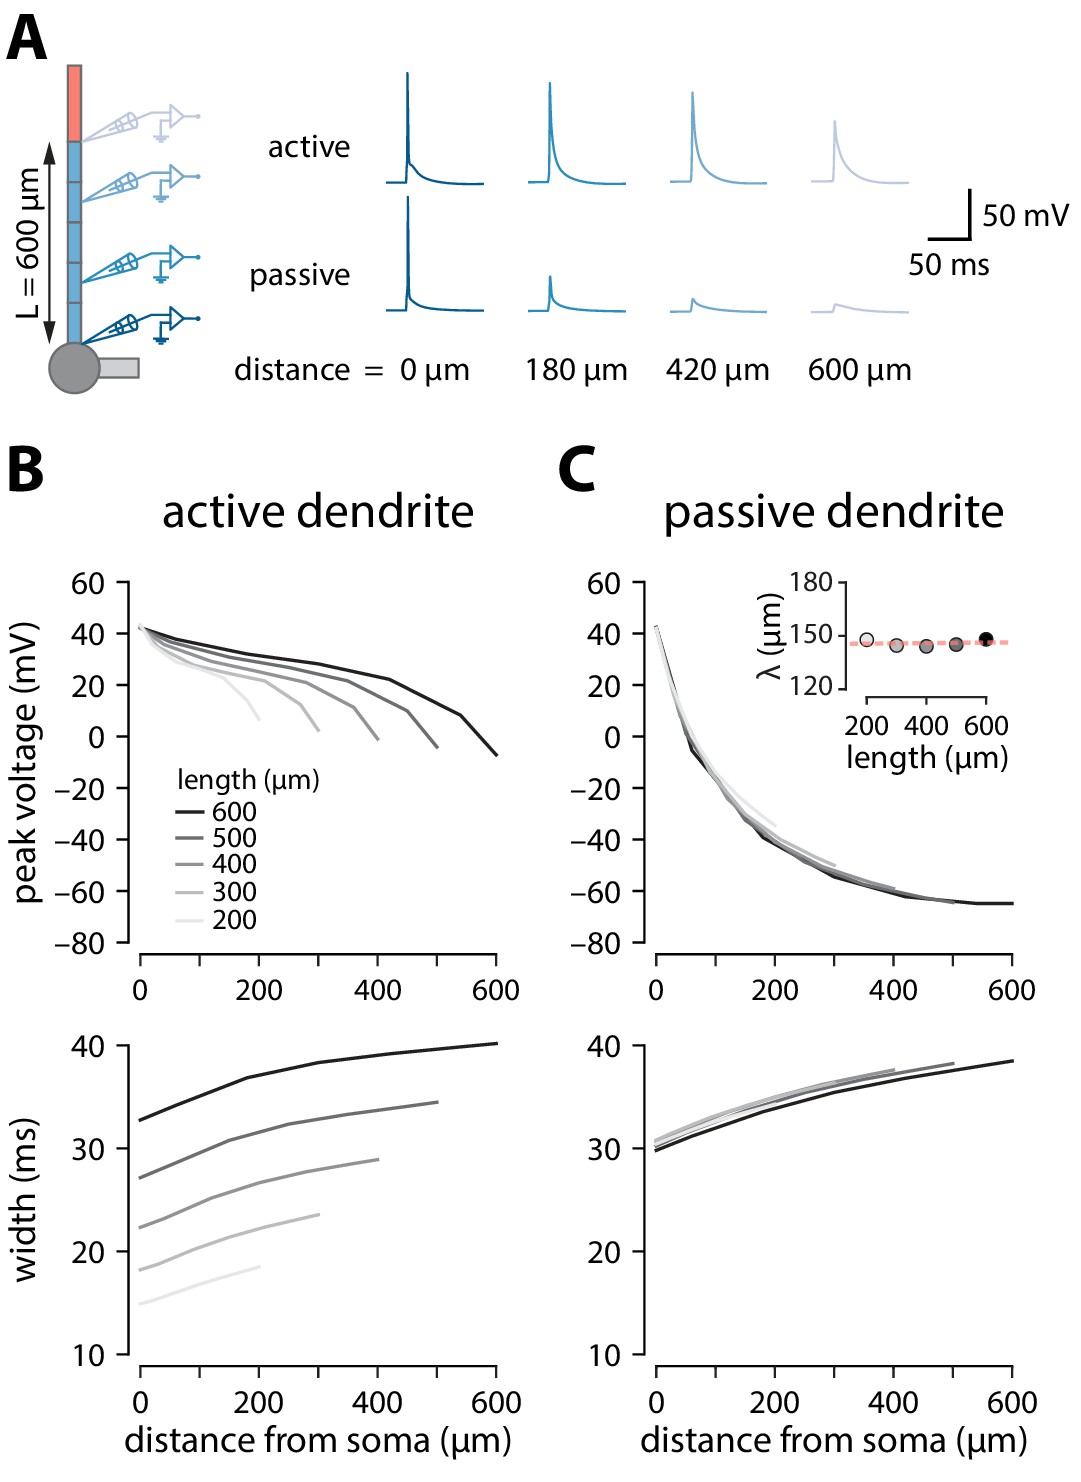
Backpropagation of APs in active and passive trunks of different length.
(A) Backpropagation of a somatic spike elicited through a single 3 ms wide 2 nA square current step at the soma in a model neuron with 600 μm apical trunk length. Voltage recordings at different distances along the trunk. (B) Peak voltage and width measured at different absolute distances (same relative) for active model neurons. Width was measured as the interval between the voltage values 2 mV above baseline membrane potential. Shading indicates models with different apical trunk lengths. (C) Same as in B but with all voltage-dependent conductances removed from the trunk and tuft compartments. Inset: length constant (λ) for different trunk lengths. The slope of the linear fit was not significantly different from 0, indicating that voltage attenuation is independent of trunk length (r2 = 0.008; p = 0.89, F-test).
Figure 4—figure supplement 2

Tuft voltage increases with trunk length independently of conductance gradients.
Same experiments as in Figure 3A but with uniform distribution of all active conductances in the apical trunk. Total conductance was maintained for each channel.
Figure 4—figure supplement 3
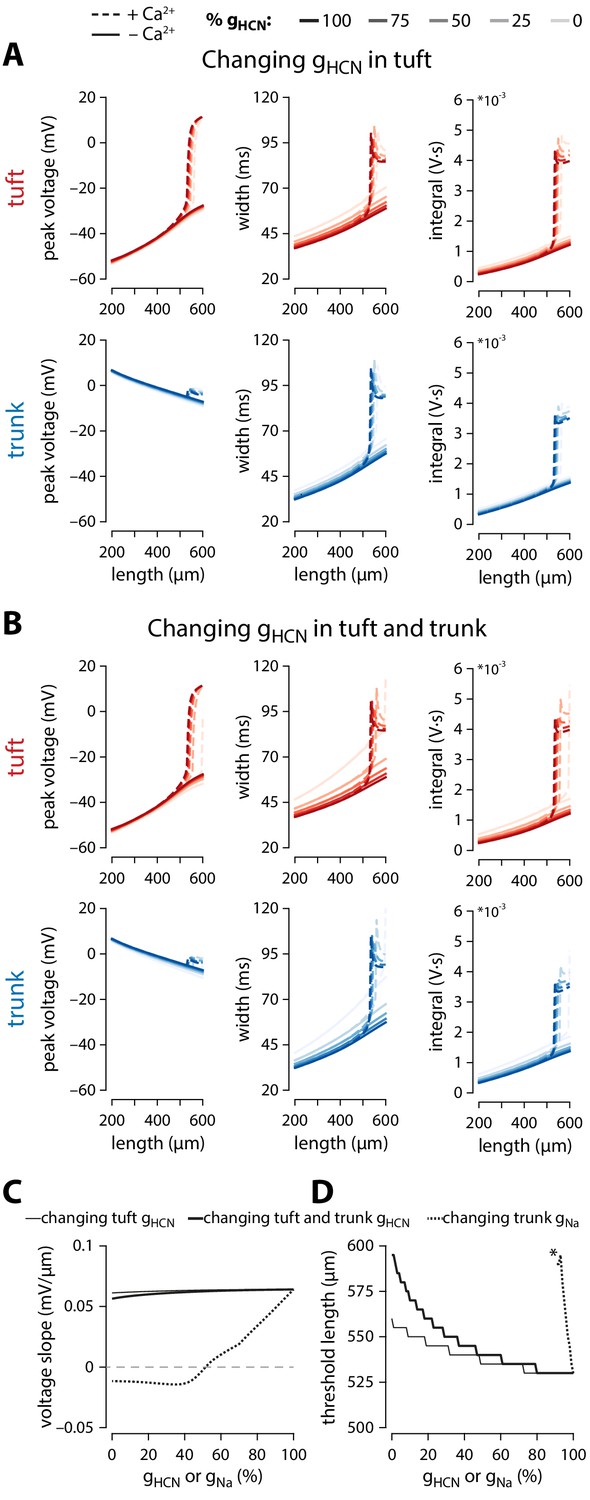
Ih is not critical to the length dependence of Ca2+ electrogenesis.
(A) Plots of peak voltage, width and integral of bAPs under different relative gHCN (shades) in the tuft, both in the presence (dashed) or absence (solid) of Ca2+ channels. (B) Same as A, but varying gHCN in both tuft and trunk compartments. (C) Slope of tuft voltage vs apical trunk length plotted at different gHCN (from panel B) or gNa (from Figure 4E) values. (D) Threshold length for dendritic Ca2+ electrogenesis at different gHCN values. N.B. there is no dendritic Ca2+ electrogenesis under 0.91 gNa (marked with asterisk). Simulations were run in 5 µm trunk length and 1% conductance steps.
Figure 4—figure supplement 4
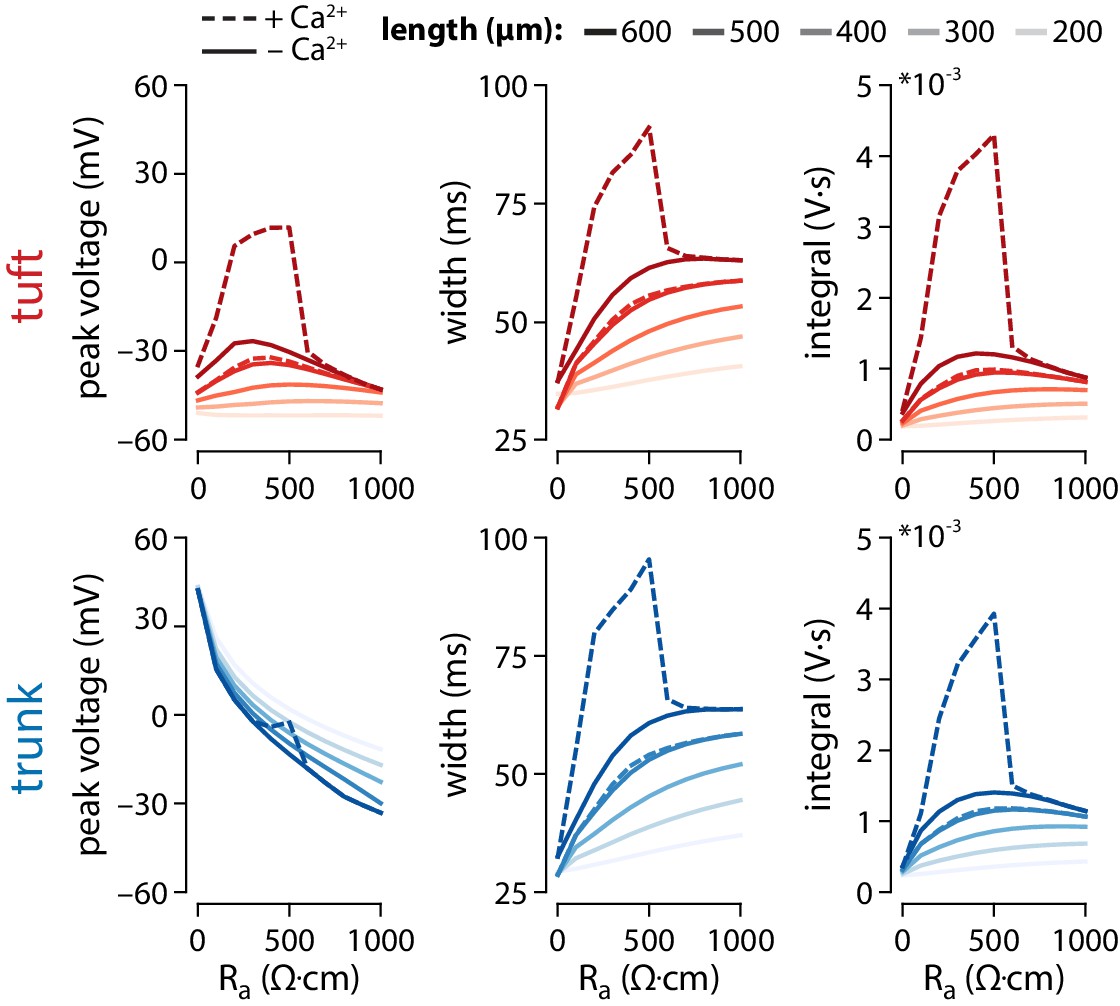
Effect of axial resistance on voltage propagation.
Plots of peak voltage, width, and voltage integral reached in the tuft and the last segment of the trunk for varying values of trunk length and axial resistance (Ra). Default Ra ≅ 382.22 Ω∙cm. The stimulus and recording conditions were the same as in Figure 4A, with 3 APs at 100 Hz triggered in the somatic compartment. Solid lines show simulations with gCa = 0, while dashed lines show the same simulations with the original gCa = 0.45 mS/cm2.
Figure 5
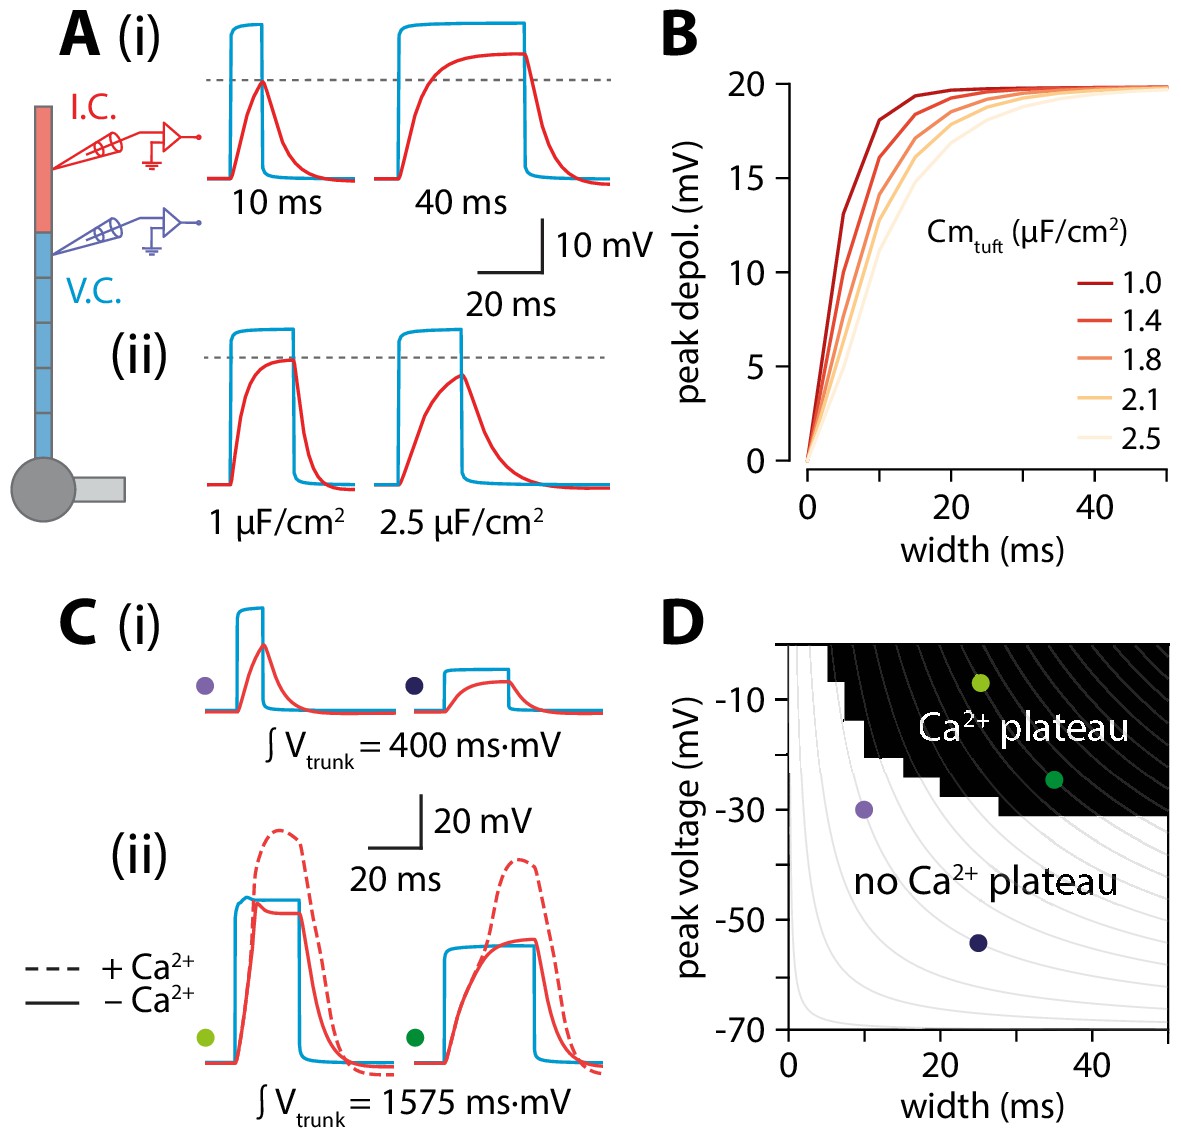
Interplay of width and amplitude underlie length dependence of Ca2+ electrogenesis.
(A) Different width voltage steps (i) or same width under differing tuft membrane capacitance conditions (ii) injected into the trunk (blue). Recorded tuft voltage in red, Vrest = −65 mV. (B) Peak voltage values reached in the tuft for a range of trunk step widths and tuft capacitances. In the original model, tuft Cm ≅ 1.75 µF/cm2. (C) Same as in A but showing voltage steps of different width and amplitude with the same voltage integral in the trunk. For smaller integrals (i) the voltage remains subthreshold while for larger integrals (ii), the tuft voltage crosses the threshold for a Ca2+ plateau. (D) Voltage and width combinations for square voltage steps in the distal trunk which result in a Ca2+ plateau in the tuft. Coloured dots represent the value combinations illustrated in C. Grey lines indicate width and amplitude combinations with equal integral.
Author response image 1
Tables
Key resources table
| Reagent type (species) or resource | Designation | Source or reference | Identifiers | Additional information |
|---|---|---|---|---|
| Strain, strain background (Mus musculus, C57BL/6, male) | Colgalt2-Cre | The Jackson Laboratory | RRID:MMRRC_036504-UCD | |
| Strain, strain background (Mus musculus, C57BL/6) | Rbp4-Cre | The Jackson Laboratory | RRID:MMRRC_031125-UCD | |
| Strain, strain background (Mus musculus, C57BL/6) | Ai14 | The Jackson Laboratory | RRID:IMSR_JAX:007908 | |
| Peptide, recombinant protein | Alexa Fluor 488-conjugated Cholera toxin subunit B (CTB) | Thermo Fisher Scientific | Cat.# C34775 | 0.8% w/v |
| Chemical compound, drug | CGP-52432 | Tocris | Cat.# 1246 | 1 μM in ACSF |
| Peptide, recombinant protein | DyLight 594-conjugated streptavidin | Thermo Fisher Scientific | Cat.# 21842 | 2 μg/ml |
| Peptide, recombinant protein | Biocytin hydrochloride | Sigma-Aldrich | Cat.# B1758 | 0.5% w/v |
| Other | DAPI stain | Sigma-Aldrich | Cat.# D9542 | 5 μg/ml |
| Software, algorithm | MATLAB R2018a | MathWorks | RRID:SCR_001622 | |
| Software, algorithm | Python 3.6 | RRID:SCR_008394 | ||
| Software, algorithm | SciPy | RRID:SCR_008058 | ||
| Software, algorithm | NEURON simulation environment 7.7.1 | Carnevale and Hines, 2006 | RRID:SCR_005393 | |
| Software, algorithm | Neurolucida 360 | MBF Bioscience | RRID:SCR_001775 | |
| Software, algorithm | Igor Pro 6.37 | WaveMetrics | RRID:SCR_000325 | |
| Software, algorithm | NeuroMatic 2.5 | Rothman and Silver, 2018 | RRID:SCR_004186 | |
| Software, algorithm | FIJI | https://imagej.net/Fiji | RRID:SCR_002285 |
Additional files
Download links
A two-part list of links to download the article, or parts of the article, in various formats.
Downloads (link to download the article as PDF)
Open citations (links to open the citations from this article in various online reference manager services)
Cite this article (links to download the citations from this article in formats compatible with various reference manager tools)
Apical length governs computational diversity of layer 5 pyramidal neurons
eLife 9:e55761.
https://doi.org/10.7554/eLife.55761


