Time-dependent cytokine and chemokine changes in mouse cerebral cortex following a mild traumatic brain injury
- Translational Gerontology Branch, Intramural Research Program, National Institute on Aging, NIH, United States
- Laboratory of Clinical Investigation, Intramural Research Program, National Institute on Aging, NIH, United States
- Department of Anatomy and Anthropology, Sackler School of Medicine, Sylvan Adams Sports Institute, and Dr. Miriam and SheldonG. Adelson Chair and Center for the Biology of Addictive Diseases, Tel Aviv University, Israel
- Department of Neurosurgery, Case Western Reserve University School of Medicine, United States
- Department of Medicine, University of California Medical Center, San Francisco, United States
Figures
Figure 1

Cerebral cortex proteins significantly altered by a single mTBI event 8 and 24 hr post-injury.
The percentage increase from sham levels are presented, positive values (red) are increases and negative values (green) are reductions in protein levels, compared to sham control levels. Left – At 8 hr, more proteins displayed significant increases than significant reductions in protein levels. VEGF-B; MIP-3b; SLAM and CRP were the most up-regulated proteins. FASL and MIP-1a were significantly lower than sham. Right – At 24 hr following a single mTBI event, many more proteins presented with lower rather than increased levels when compared to sham. The largest reductions were evident in IL-1 ra and IL-12p40, the largest increases in protein levels were seen for CD6 and E-Cadherin. Percentage ‘increase’ values are presented as the mean ± S.E.M. of n cortical samples (see Supplementary file 1 for mean ± S.E.M. and n data). Definitions of pathways are provided in the Figure Legends, where the pathways are first mentioned in the results sections. When new pathways are described in subsequent text, the new definitions will be provided in the appropriate Figure Legend. Pathway definitions for 8 and 24 hr are: Apoptosis signaling pathway (P00006) - signal transduction pathways linked with cellular death. FAS signaling pathway (P00020) - the FAS receptor mediates apoptotic signaling initiated by interaction with surface expressed FASL on other cells, FAS-FASL apoptosis is mediated via a death domain. Alzheimer disease-presenilin pathway (P00004) - the presenilin gamma-secretase complex linked to Alzheimer's disease. Angiogenesis (P00005) - signaling pathways that have been identified as key mediators of angiogenesis. PDGF signaling pathway (P00047) - platelet-derived growth factor (PDGF) plays a critical role in cellular proliferation and development. EGF receptor signaling pathway (P00018) - signaling that mediates growth and proliferation in response to the binding of a variety of growth factor ligands. CCKR signaling map (P06959) - the classical gastrin cholecystokinin B receptor CCK-BR, its isoforms and alternative receptors, these peptides trigger signaling pathways which influence the expression of downstream genes that affect cell survival, angiogenesis and invasion. Gonadotropin-releasing hormone receptor pathway (P06664) - the GnRH receptor (GnRHR), expressed at the cell surface of the anterior pituitary gonadotrope is critical for normal secretion of gonadotropins LH and FSH, pubertal development, and reproduction. Wnt signaling pathway (P00057) - is involved in various transcriptional regulatory molecules affecting various target genes. Inflammation mediated by chemokine and cytokine signaling pathway (P00031) - this pathway illustrates chemokine-induced adhesion and migration of leukocytes resulting in the infiltration to the tissue and transcriptional activation enabling recruitment of more leukocytes. Interferon-gamma signaling pathway (P00035) - the interferon-gamma signaling pathway modulates the antiproliferative and antiviral properties of interferon-gamma. Interleukin signaling pathway (P00036) - they can mediate different biological response via activation of a combination of different signal transduction pathways. FGF signaling pathway (P00021) - the result is the activation of many downstream pathways and many cellular outcomes, including mitogenesis, differentiation, survival, apoptosis, and cell migration. Cadherin signaling pathway (P00012) - the pathway is involved in many biological processes, such as development, neurogenesis, cell adhesion, and inflammation. Figure 1—source data 1.
-
Figure 1—source data 1
Cortex tissue at 8 and 24 hrs.
- https://cdn.elifesciences.org/articles/55827/elife-55827-fig1-data1-v3.xlsx
Figure 2

Cerebral cortex proteins significantly altered by a single mTBI event 48, 72 and 96 hr post-injury.
The percentage increase from sham levels are presented, positive values (red) are increases and negative values (green) are reductions in protein levels compared to sham control. Left - 48 hr the proteins OPN, CRP, E-Cadherin and IL-17E were the most elevated compared to sham levels. MadCAM-1, sFRP-3, IL-1 R4 and TWEAK R were the most down-regulated proteins. Middle - 72 hr the largest reductions in protein levels were seen for G-CSF, TRANCE, Granzyme B and TGFb1. The largest increases in protein levels were seen for CRP, IL-17E and VEGF-B. Right - 96 hr the proteins IL-20, VEGF-B, CD27 and IL-17E were the most significantly up-regulated proteins by 96 hr. IL-17B, ALK-1, TWEAK R, EGF, GITR L, TRANCE and MadCAM-1 were the most down-regulated proteins. Percentage ‘increase’ values are presented as the mean ± S.E.M. of n cortical samples (see Supplementary file 1 for mean ± S.E.M. and n data). Definitions of additional pathways observed for 48, 72 and 96 hr are: Plasminogen activating cascade (P00050) - the inactive zymogen plasminogen is converted into plasmin. TGF-beta signaling pathway (P00052) - Transforming growth factor beta signaling pathway. Other pathways have been defined elsewhere. Figure 2—source data 1.
-
Figure 2—source data 1
Cortext issue at 48, 72 and 96hrs.
- https://cdn.elifesciences.org/articles/55827/elife-55827-fig2-data1-v3.xlsx
Figure 3

Cerebral cortex proteins significantly altered by a single mTBI event 7, 14 and 30 days post-injury.
The percentage increase from sham levels are presented, positive values (red) are increases and negative values (green) are reductions in protein levels compared to sham control. Left - 7 days the proteins VEGF-B, SLAM, IL-17E, E-Cadherin and IL-20 were the most elevated compared to sham levels. IL-1 ra, IL-7, MCP-5 and FASL were the most down-regulated proteins. Middle - 14 days the largest reductions were seen for G-CSF, EGF, ALK-1 and IL-1 ra. The largest increases in protein levels were seen for BAFF R, VEGF-B, CD6 and IL-17E. Right – 30 days TRANCE, CD40 L, CTLA4, IL-17E and sFRP-3 were the most significantly up-regulated proteins by 30 days. CRO, OPG, IL-1a, IL-1 ra and IL-6 were the most down-regulated proteins. Percentage ‘increase’ values are presented as the mean ± S.E.M. of n cortical samples (see Supplementary file 1 for mean ± S.E.M. and n data). An additional pathway identified for 7, 14 and 30 days is Notch signaling pathway (P00045) which is defined as follows: a transmembrane receptor that mediates local cell-cell communication and coordinates a signaling cascade. Other pathways have been defined elsewhere. Figure 3—source data 1.
-
Figure 3—source data 1
Cortext issue at 7, 14 and 30 days.
- https://cdn.elifesciences.org/articles/55827/elife-55827-fig3-data1-v3.xlsx
Figure 4
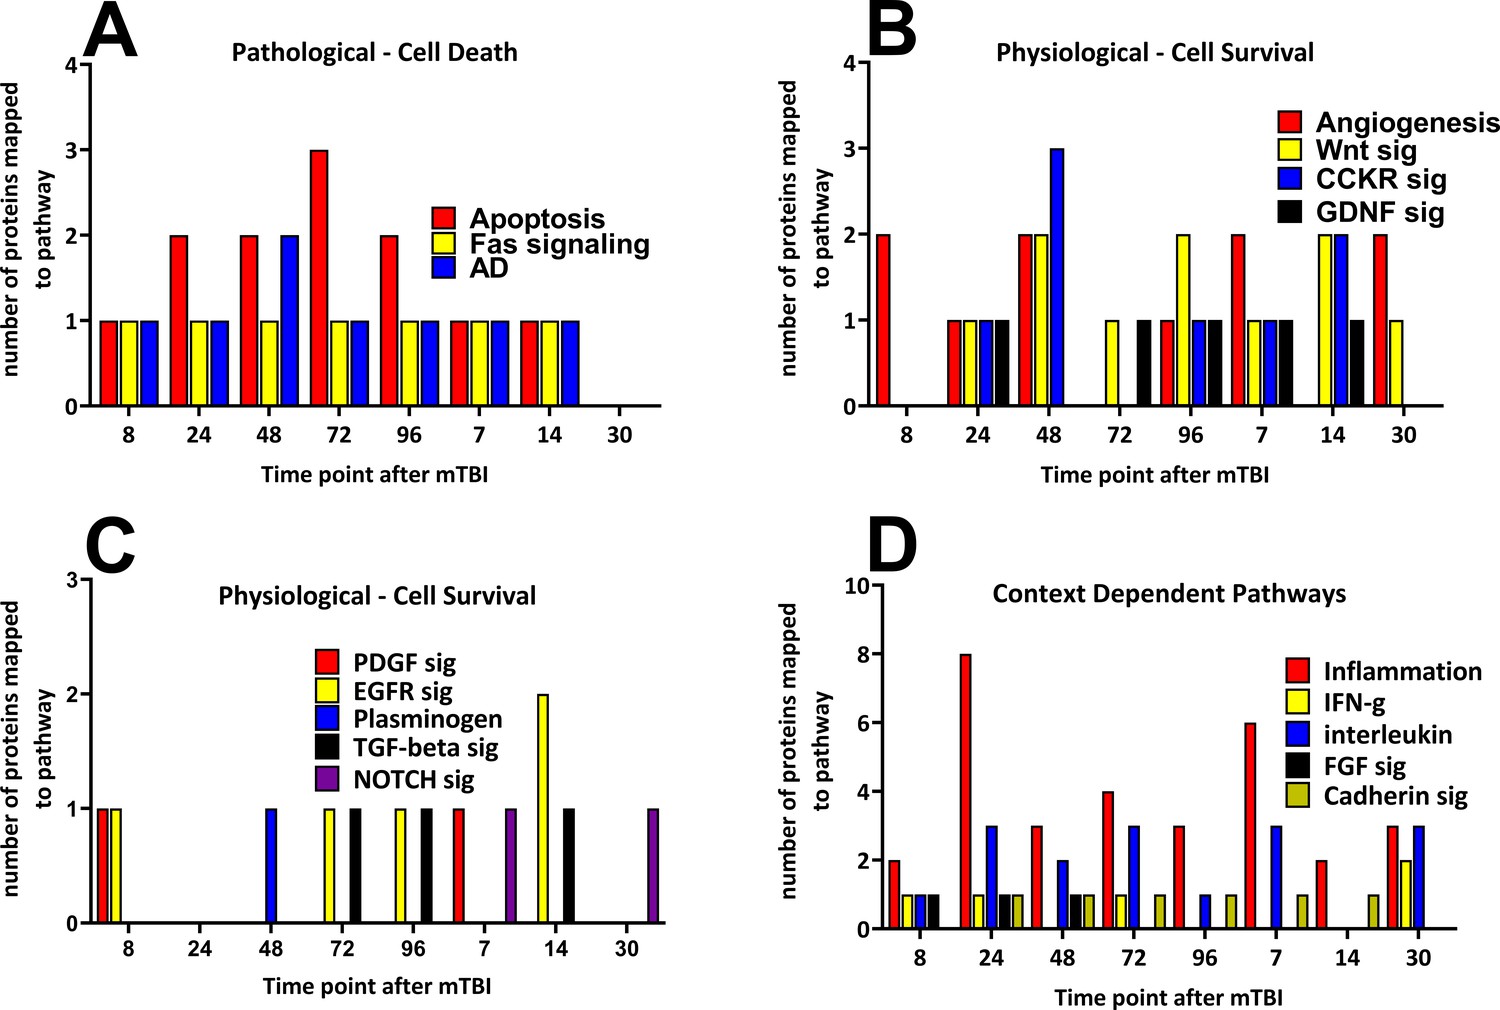
Time-dependent changes in pathways and cerebral cortical derived proteins that mapped to the pathways after a single mild TBI.
Changes in protein numbers that mapped to Pathological – Cell Death (A), Physiological – Cell Survival (B/C) and Context-Dependent Pathways (D) are provided. Pathological pathways were observed from 8 hr up to, but not after 14 days following injury, the apoptosis pathway showed the largest number of proteins at 72 hr after injury (A). Physiological pathways were shown to be observed at times similar to that of Pathological pathways, yet in contrast to those, cell survival pathways were present at the 30 day time point. The numbers of proteins that mapped to the cell survival pathways were similar during the study (B/C). Context-dependent pathways were also observed at all times during the study, the pathways which had the largest number of proteins was the inflammation pathway (eight proteins by 24 hr and six proteins at 7 days following TBI (D). The pathways were derived from the identities of the proteins significantly regulated at each time point which were analyzed by the Protein ANalysis THrough Evolutionary Relationships (PANTHER) bioinformatic tool. Figure 4—source data 1.
-
Figure 4—source data 1
Pathway.
- https://cdn.elifesciences.org/articles/55827/elife-55827-fig4-data1-v3.xlsx
Figure 5
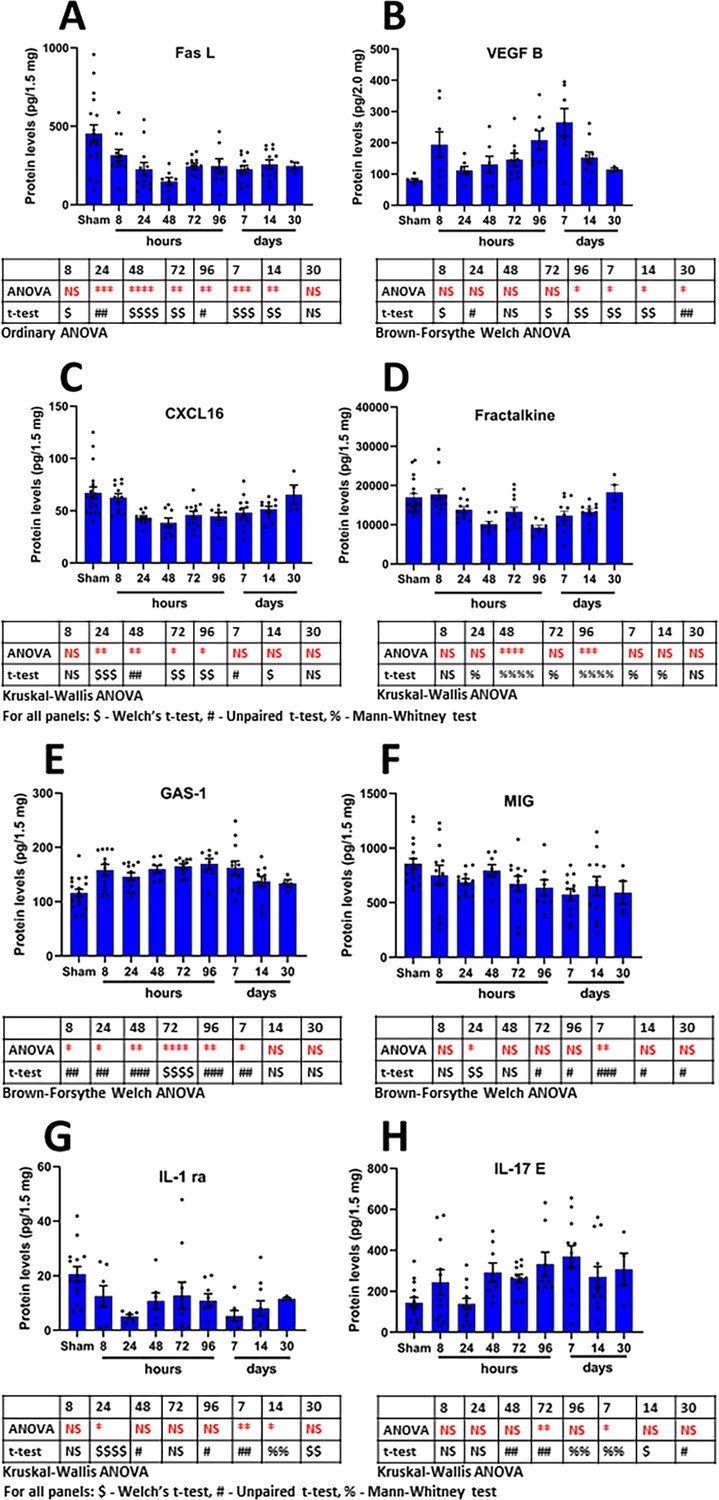
Time-dependent changes in the most frequently regulated cortical derived changed proteins induced by a single mTBI event over a 30 day period.
Shown are the changes in proteins over time for the proteins FASL (A), VEGF-B (B), CXCL16 (C), Fractalkine (D), GAS-1 (E), MIG (F), IL-1 ra (G) and IL-17E (H). Provided are the mean ± S.E.M. data in bar graph form with the individual animal protein levels (filed circles). Below each component are the statistical markers and the type of ANOVA test that was performed, multiple comparisons were made between the mTBI time points and the sham group. Also, shown are the results of the Student’s T-test, comparing the mTBI time point data with the sham data. Statistical analysis was performed with Prism Ver 8.31 (GraphPad). Figure 5—source data 1.
-
Figure 5—source data 1
Most frequently regulated cortical proteins.
- https://cdn.elifesciences.org/articles/55827/elife-55827-fig5-data1-v3.xlsx
Figure 6
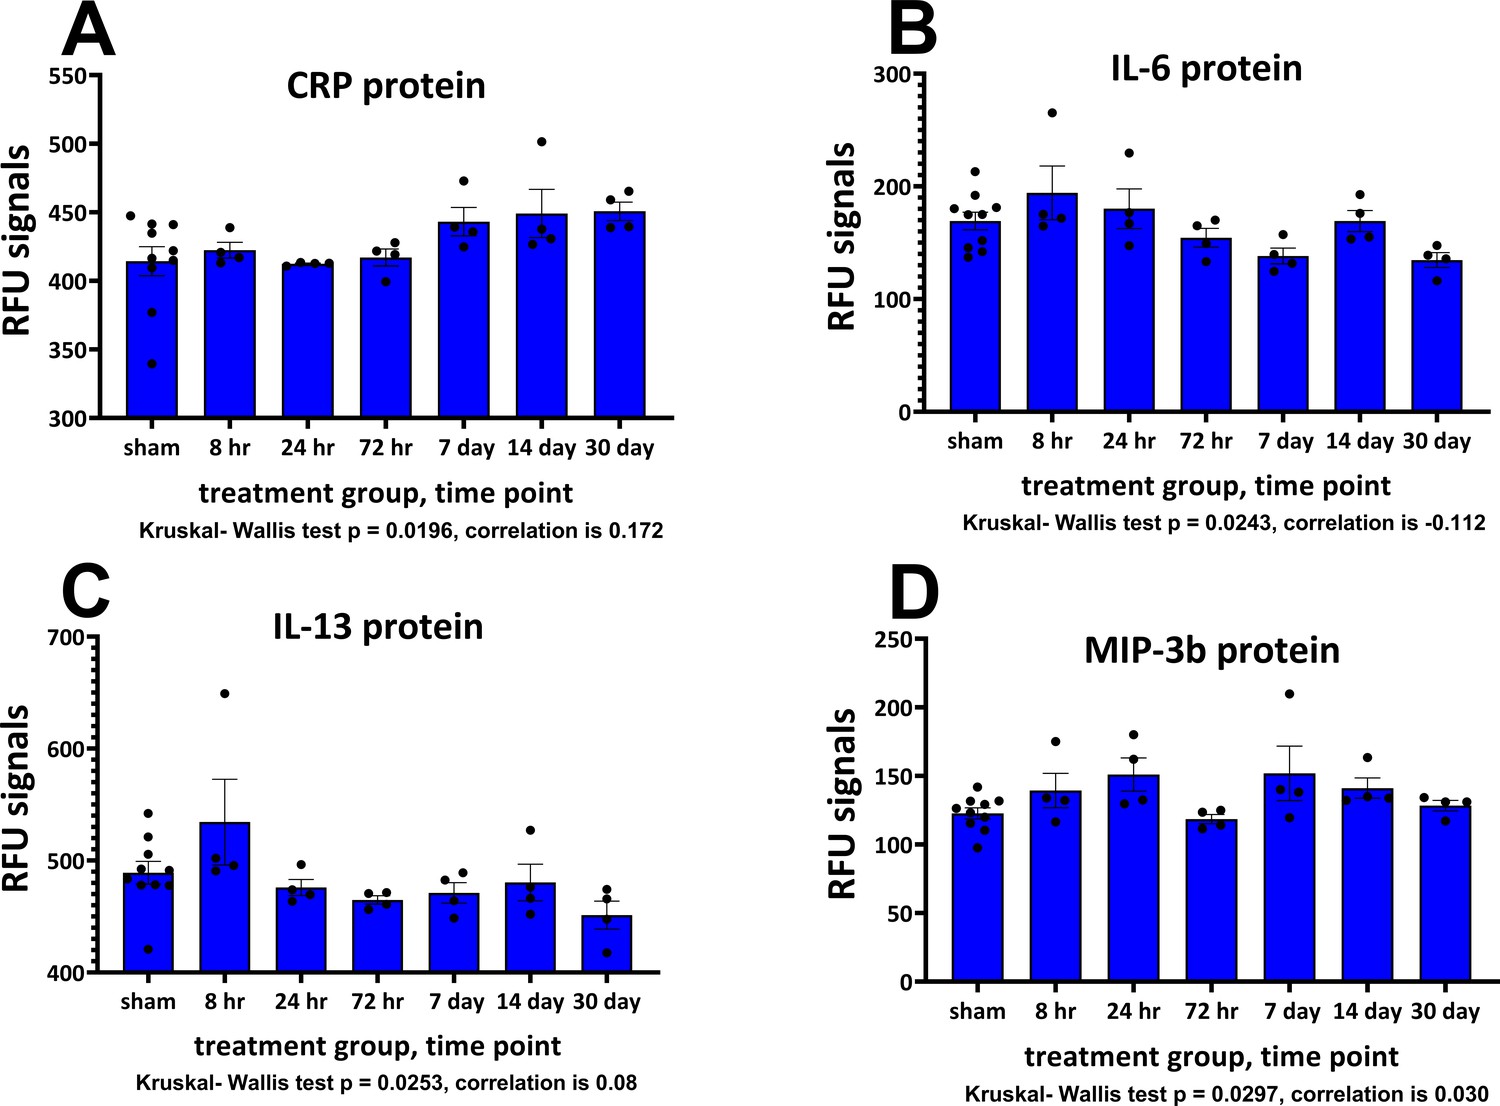
Plasma neuronal-enriched EV cargo proteins significantly altered by a single mTBI event over a 30-day period.
The Relative Fluorescence Units (RFU) obtained from the SOMAscan assay for NEV proteins are shown. Provided are the mean ± S.E.M. data in bar graph form with the individual animal protein levels (filed circles). Due to the low numbers in the TBI groups, sample normality was tested with the Shapiro-Wilk test, all sham data passed normality, several of the TBI data points were not normally distributed and were subject to ANOVA by Kruskal-Wallis, p values are provided. Below each component are the correlation values comparing matched cortical and NEV sample data. Values are presented as the mean ± S.E.M. of n = 4–10 EV samples. Figure 6—source data 1.
-
Figure 6—source data 1
EV cargo protein.
- https://cdn.elifesciences.org/articles/55827/elife-55827-fig6-data1-v3.xlsx
Tables
Table 1
Mouse cortical tissue proteins significantly altered compared to sham tissue four or more times over the study period.
(A) Red font indicates increases in protein levels, blue font indicates reductions in protein levels, black font indicates that the proteins were observed to be both increased and reduced over the duration of the study. (B) Gene ontology definitions are as follows: Pathways are defined elsewhere. Protein class definitions - Signaling molecule (PC00207) - a molecule that is secreted by one cell and received as a signal by a receptor on another cell. Receptor (PC00197) - a protein or complex that spans the plasma membrane, that binds to a signal molecule in the extracellular space and transduces the signal to the cytoplasm. Cytoskeletal protein (PC00085) - a major constituent of the cytoskeleton found in the cytoplasm of eukaryotic cells. Cell adhesion molecule (PC00069) - a protein that mediates cell-to-cell adhesion. Biological process definitions - Cellular process (GO:0009987) - any process that is carried out at the cellular level, but not necessarily restricted to a single cell. Response to stimulus (GO:0050896) - any process that results in a change in state or activity of a cell or an organism as a result of a stimulus. Localization (GO:0051179) - any process in which a cell, a substance, or a cellular entity, such as a protein complex or organelle, is transported, tethered to or otherwise maintained in a specific location. Biological regulation (GO:0065007) - any process that modulates a measurable attribute of any biological process, quality or function. Biological adhesion (GO:0022610) - the attachment of a cell or organism to a substrate, another cell, or other organism. Biological adhesion includes intracellular attachment between membrane regions. Cell population proliferation (GO:0008283) - the multiplication or reproduction of cells, resulting in the expansion of a cell population. Developmental process (GO:0032502) - a biological process whose specific outcome is the progression of an integrated living unit: an anatomical structure (which may be a subcellular structure, cell, tissue, or organ), or organism over time from an initial condition to a later condition. Immune system process (GO:0002376) - any process involved in the development or functioning of the immune system, an organismal system for calibrated responses to potential internal or invasive threats. Multicellular organismal process (GO:0032501) - any biological process, occurring at the level of a multicellular organism, pertinent to its function.
| A – Identities of 23 significantly altered proteins | |
|---|---|
| # of significant time points out of 8 | Protein |
| 7 | , |
| 6 | , , , , , |
| 5 | , , , CRP, |
| 4 | , IL-20, , , , , , , , |
| B – Identities of significantly altered proteins mapped to different functional categories | |
| Pathway | Protein |
| CCKR signaling map (P06959) | E-cadherin |
| Wnt signaling pathway (P00057) | E-cadherin |
| FAS signaling pathway (P00020) | FASL |
| Inflammation mediated by chemokine and cytokine signaling pathway (P00031) | Fractalkine, MIP-1a, RANTES |
| Apoptosis signaling pathway (P00006) | FASL |
| Alzheimer disease-presenilin pathway (P00004) | E-cadherin |
| Cadherin signaling pathway (P00012) | E-cadherin |
| Protein Class | Protein |
| Signaling molecule (PC00207) | FASL, MIP-1a, Galectin-1, CD40L, CXCL16, VEGF-B, RANTES, TCA-3, MIG |
| Receptor (PC00197) | IL-1 r4, MBL-2 |
| Cytoskeletal protein (PC00085) | CRP |
| Cell adhesion molecule (PC00069) | Galectin-1 |
| Biological Process | Protein |
| Cellular process (GO:0009987) | FASL, IL-1 r4, MIP-1a, Galectin-1, CD40L, MBL-2, CXCL16, MIG, VEGF-B, MadCam-1, E-cadherin, RANTES, TCA-3 |
| Localization (GO:0051179) | MIP-1a, CXCL16, VEGF-B, MadCam-1, RANTES, TCA-3, MIG |
| Biological regulation (GO:0065007) | MIP-1a, CXCL16, Fractalkine, VEGF-B, MadCam-1, RANTES, TCA-3 |
| Response to stimulus (GO:0050896) | FASL, MIP-1a, CD40L, MIG, VEGF-B, RANTES, TCA-3 |
| Developmental process (GO:0032502) | MBL-2 |
| Biological adhesion (GO:0022610) | MadCAM-1, E-cadherin |
| Multicellular organismal process (GO:0032501) | MBL-2, VEGF-B |
| Cell proliferation (GO:0008283) | VEGF-B |
| Immune system process (GO:0002376) | FASL, CD30L, CD40L, Fractalkine, CRP, MIG |
Table 2
Neuronally enriched EV particle counts and sizes for sham and mTBI time points obtained from mouse plasma.
SOMA EV Counts by treatment group, One-way Analysis of Variance (ANOVA), the p value is 0.3560, considered not significant. SOMA EV sizes by treatment group, One-way Analysis of Variance (ANOVA), the p value is 0.2198, considered not significant. Table 2—source data 1.
| Sham | mTBI | mTBI | mTBI | mTBI | mTBI | mTBI | |
|---|---|---|---|---|---|---|---|
| EV counts/ml | hours | hours | hours | days | days | days | |
| 8 | 24 | 72 | 7 | 14 | 30 | ||
| Mean | 6.83 × 10¹⁰ | 6.54 × 10¹⁰ | 5.41 × 10¹⁰ | 4.93 × 10¹⁰ | 3.86 × 10¹⁰ | 4.42 × 10¹⁰ | 8.43 × 10¹⁰ |
| SD | 2.67 × 10¹⁰ | 3.94 × 10¹⁰ | 2.36 × 10¹⁰ | 3.36 × 10¹⁰ | 1.89 × 10¹⁰ | 2.87 × 10¹⁰ | 4.39 × 10¹⁰ |
| SEM | 8.44 × 10⁹ | 1.97 × 10¹⁰ | 1.18 × 10¹⁰ | 1.68 × 10¹⁰ | 9.48 × 10⁹ | 1.44 × 10¹⁰ | 2.20 × 10¹⁰ |
| N | 10 | 4 | 4 | 4 | 4 | 4 | 4 |
| P-value (vs. Sham) | 0.8738 | 0.3753 | 0.2828 | 0.0677 | 0.1607 | 0.4138 | |
| EV size (nm) | |||||||
| Mean | 172 | 204 | 164 | 210 | 149 | 171 | 165 |
| SD | 38 | 39 | 16 | 58 | 38 | 19 | 24 |
| SEM | 12 | 20 | 8 | 28 | 19 | 9 | 12 |
| N | 10 | 4 | 4 | 4 | 4 | 4 | 4 |
| p-value (vs. Sham) | 0.1919 | 0.7117 | 0.1710 | 0.3286 | 0.9536 | 0.7274 |
-
Table 2—source data 1
EV particle.
- https://cdn.elifesciences.org/articles/55827/elife-55827-table2-data1-v3.xlsx
Table 3
Mouse sample treatment/time points following mTBI for cerebral cortex (CTX) and plasma-sampled, neuronally enriched EV samples.
| Treatment/Time Point | CTX (Cytokine/Chemokine Arrays, n) | NEV (SOMAscan, n) |
|---|---|---|
| sham | 18 | 10 |
| mTBI 8 hr | 12 | 4 |
| mTBI 24 hr | 12 | 4 |
| mTBI 48 hr | 8 | ND |
| mTBI 72 hr | 12 | 4 |
| mTBI 96 hr | 8 | ND |
| mTBI 7 Days | 12 | 4 |
| mTBI 14 Days | 12 | 4 |
| mTBI 30 Days | 4 | 4 |
-
ND refers to not determined.
Additional files
-
Source data 1
Cortical tissue data.
This file contains the raw data obtained from the Antibody Array studies undertaken with the five different arrays. Provided are the different treatment groups, the protein names, the upper and lower limits of the assay detection and the individual data points as pg. The assay proteins loading conditions have been described in the methods section. The sample identity is provided. This file contains all of the original data related to Figures 1–5, describing the cortical tissue protein changes over time.
- https://cdn.elifesciences.org/articles/55827/elife-55827-data1-v3.xlsx
-
Source data 2
NEVs data.
This file contains the raw data in relative fluorescent units for each of the proteins measured in the neuronal extracellular vesicles. Provided are target full name, target, uniprot, entrez gene id, entrez gene symbol. The sample identity is provided. These data relate to the protein measurements from the plasma derived neuronal extracellular vesicles that were screened on the SOMASCAN assay, Figure 6.
- https://cdn.elifesciences.org/articles/55827/elife-55827-data2-v3.xlsx
-
Supplementary file 1
Proteins significantly regulated by a single mTBI event over time.
Provided are lists of up-regulated and down-regulated proteins, also the mean, SEM and number of values for each time point. Data are expressed a percentage increase from sham and complement the source data files.
- https://cdn.elifesciences.org/articles/55827/elife-55827-supp1-v3.docx
-
Supplementary file 2
Correlations between cortical and NEV proteins.
Provided is a list proteins that were significantly changed in the cortical proteins that were common between the cortical array and SOMAscan assay.
- https://cdn.elifesciences.org/articles/55827/elife-55827-supp2-v3.xlsx
-
Transparent reporting form
- https://cdn.elifesciences.org/articles/55827/elife-55827-transrepform-v3.docx
Download links
A two-part list of links to download the article, or parts of the article, in various formats.
Downloads (link to download the article as PDF)
Open citations (links to open the citations from this article in various online reference manager services)
Cite this article (links to download the citations from this article in formats compatible with various reference manager tools)
Time-dependent cytokine and chemokine changes in mouse cerebral cortex following a mild traumatic brain injury
eLife 9:e55827.
https://doi.org/10.7554/eLife.55827


