Genetic mapping of etiologic brain cell types for obesity
- Novo Nordisk Foundation Center for Basic Metabolic Research, University of Copenhagen, Denmark
Figures
Figure 1 with 2 supplements
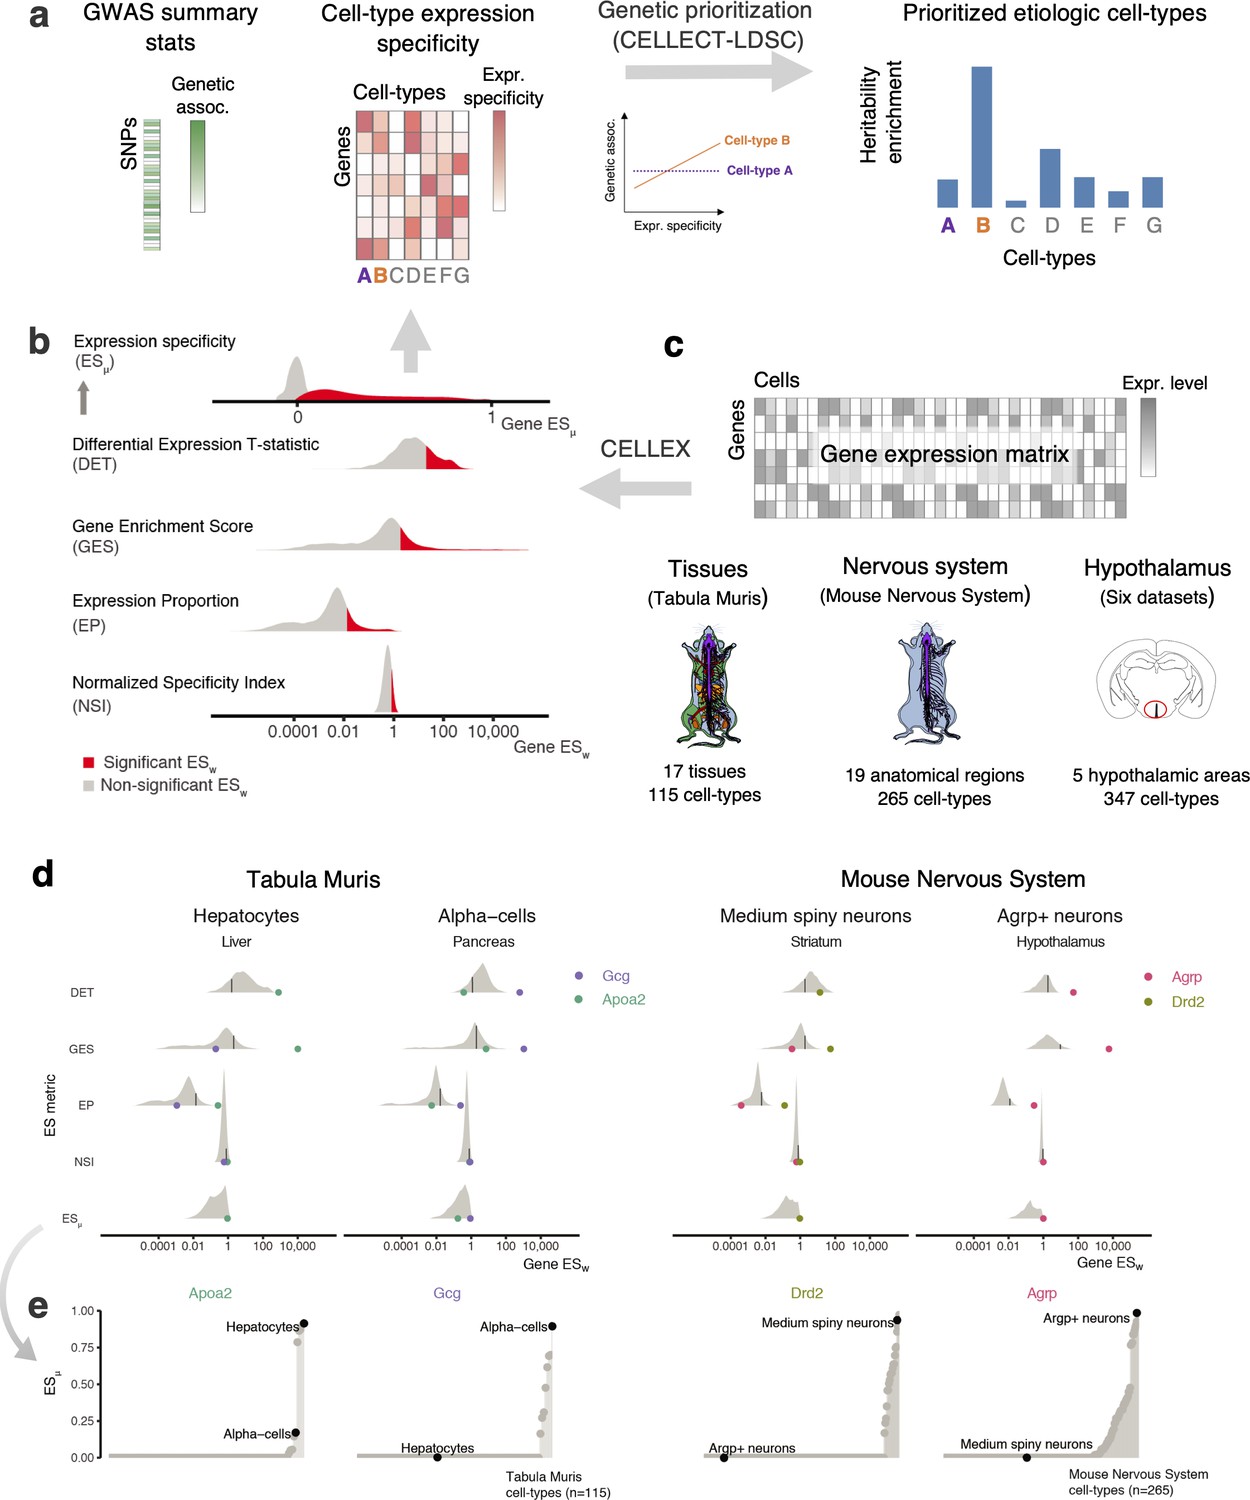
Overview of CELLECT and CELLEX and main datasets used (a) CELLECT quantifies the association between common polygenetic GWAS signal (heritability) and cell type expression specificity (ES) to prioritize relevant etiological cell types.
As input to CELLECT, we used BMI GWAS summary statistics derived from analysis of UK Biobank data (N > 457,000 individuals) and ES was calculated using CELLEX. (b) CELLEX uses a ‘wisdom of the crowd’ approach by averaging multiple ES metrics into ESμ, a robust ES measure that captures multiple aspects of expression specificity. Prior to averaging ES metrics, CELLEX determines the significance of individual ES metric estimates (ESw), indicated by the red and gray colored areas. (c) scRNA-seq datasets analyzed in this study. In total, the associations between 727 cell types and BMI heritability were analyzed. Anatograms modified from gganatogram (Maag, 2018). (d) Example of the CELLEX approach for selected cell types and relevant marker genes. The log-scale distribution plot of ESw illustrate differences of ES metrics. For each ES metric distribution, a black line is shown to indicate the cut-off value for ESw significance. In most cases, the ES metrics identified the relevant marker gene as having a significant ESw. In all cases, the marker gene was correctly estimated as having ESμ~1. We note that the majority of genes have ESμ=0 and were omitted from the log-scale plot. (e) ESμ plots showing the specificity and sensitivity of our approach. The plots depict ESμ for the genes shown in panel (d) across all cell types in the respective datasets. For each marker gene, the relevant cell type has the highest ESμ estimate (high sensitivity) and cell types in which the given gene is likely to have a lesser role have near zero ESμ estimates (high specificity). BMI, body mass index; ES, expression specificity; GWAS, genome-wide association study; UK, United Kingdom; scRNA-seq, single-cell RNA-sequencing.
Figure 1—figure supplement 1
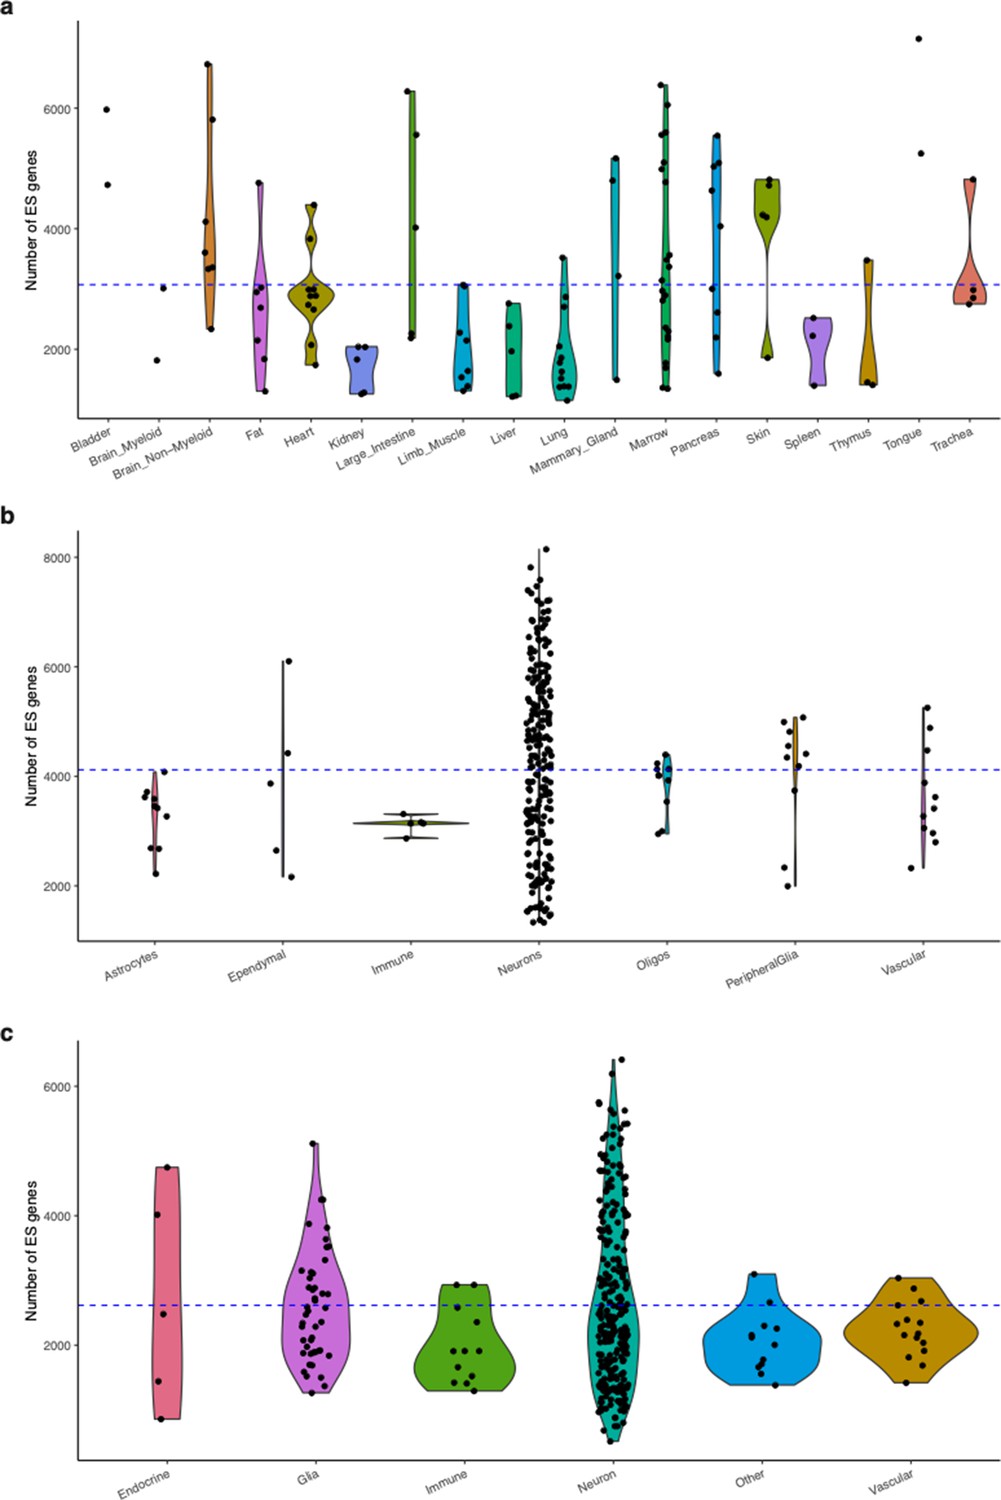
Number of ES genes.
Distribution of the number of ES genes across cell type categories. Points represent cell types. The horizontal blue line reflects the global mean across all cell types. (a) Tabula Muris (cell types grouped by tissue). (b) Mouse Nervous System (cell types grouped by class). (c) Hypothalamus datasets (cell types grouped by class).
Figure 1—figure supplement 2

Hierarchical clustering of cell types using ESμ.
Dendrogram of cell types clustered using average linkage of ESμ Pearson’s correlation. Dendrograms are shown for (a) Tabula Muris; (b) Mouse Nervous System; and (c) Hypothalamus datasets. Cell types highlighted by red points (positioned at leaf nodes) passed the Bonferroni significance threshold in the BMI GWAS enrichment analysis.
Figure 2 with 1 supplement

Cell type prioritization across 17 tissues highlights a key role of the brain in obesity.
(a) Prioritization of 115 Tabula Muris cell types identified two cell types from the brain as significantly associated with BMI, namely oligodendrocyte precursor cells and neurons (shown in black; Bonferroni significance threshold, PS-LDSC <0.05/115). (b) Heatmap of cell type prioritization for multiple GWAS traits. BMI results (first column) are the same as in panel (a) and projected onto the heatmap. The four brain-related traits (second column) were associated with cell types in the brain, the two immune traits (third column) were associated with immune cells, and anthropometric traits (fourth column) were associated with mesenchymal stem cells, which are progenitor cells for muscle, bone and fat. Asterisks (*) mark cell types passing the per-trait Bonferroni significance threshold. The top bar plot shows the estimated trait heritability. An overview of the GWAS files used in this work are available in the Figure 2—source data 1, metadata for the Tabula Muris dataset are available in Figure 2—source data 2 and the CELLECT results for the Tabula Muris dataset are available in Figure 2—source data 3. S-LDSC, stratified-linkage disequilibrium score regression; h2S-LDSC, trait SNP-heritability.
-
Figure 2—source data 1
GWAS overview.
- https://cdn.elifesciences.org/articles/55851/elife-55851-fig2-data1-v2.xlsx
-
Figure 2—source data 2
Tabula Muris metadata.
- https://cdn.elifesciences.org/articles/55851/elife-55851-fig2-data2-v2.xlsx
-
Figure 2—source data 3
Tabula Muris CELLECT results.
- https://cdn.elifesciences.org/articles/55851/elife-55851-fig2-data3-v2.xlsx
Figure 2—figure supplement 1
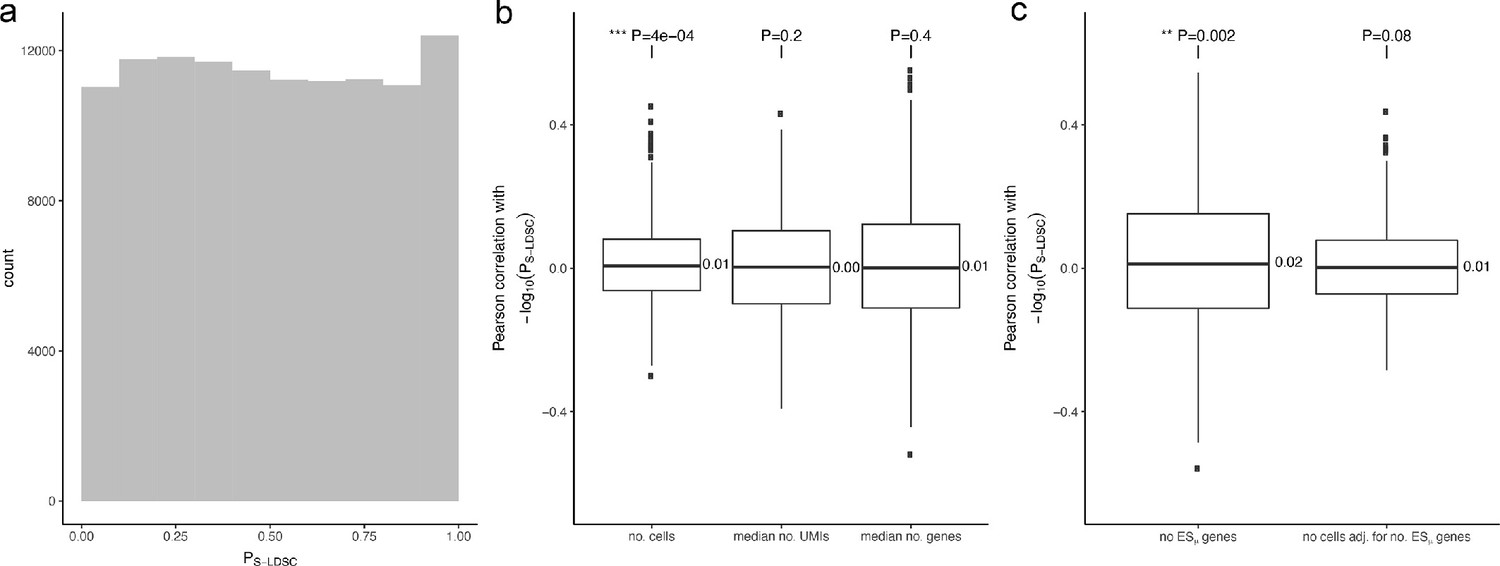
Tests for confounding factors.
(a) Histogram of S-LDSC p-values for 115 cell types in the Tabula Muris dataset across 1000 null GWAS. The modest enrichment near one and depletion near 0 may be due to imperfect calibration of the S-LDSC method. (b) Pearson correlation coefficients between S-LDSC p-values and the number of cells, median number of UMIs and median number of genes expressed, respectively, for 115 Tabula Muris cell types, computed for 1000 null GWAS. The leftmost boxplot shows a small but statistically significant mean correlation between cell cluster sizes and S-LDSC p-values. (c) Pearson correlation coefficients between S-LDSC p-values and, respectively, number of ESμ genes and number of cells adjusted for number of ESμ genes, over 115 Tabula Muris cell types, computed for 1000 null GWAS. The small mean correlation between cell numbers and CELLECT S-LDSC p-values was no longer statistically significant after accounting for the number of ESμ genes.
Figure 3 with 3 supplements

Cell type prioritization of mouse nervous system cell types highlights cell types outside canonical energy homeostasis circuits.
(a) Prioritization of 265 mouse nervous system cell types identified 22 cell types from eight distinct brain regions as significantly associated with BMI. The highlighted cell types passed the Bonferroni significance threshold, PS-LDSC <0.05/265. Cell types are grouped by the taxonomy described in Zeisel et al., 2018. (b) Heatmap of cell type prioritization for multiple GWAS traits. The four brain-related traits (second column) were primarily associated with cortical neurons (telencephalon projecting and interneuron cell types) and did not overlap with the BMI-associated cell types. The two immune traits (third column) were associated with microglia, and anthropometric traits (fourth column) were predominantly associated with vascular cell types. Asterisks (*) mark cell types passing the per-trait Bonferroni significance threshold. The top bar plot shows the estimated trait heritability. Metadata for the Mouse Nervous System dataset are available in Figure 3—source data 1, CELLECT results for the Mouse Nervous System dataset are available in Figure 3—source data 2, CELLEX expression specificity values for the BMI GWAS-enriched cell types are available in Figure 3—source data 3 and cognitive traits and psychiatric disorders CELLECT results limited to the 22 BMI GWAS-enriched cell types are available in Figure 3—source data 4.
-
Figure 3—source data 1
Mouse Nervous System metadata.
- https://cdn.elifesciences.org/articles/55851/elife-55851-fig3-data1-v2.xlsx
-
Figure 3—source data 2
Mouse Nervous System CELLECT results.
- https://cdn.elifesciences.org/articles/55851/elife-55851-fig3-data2-v2.xlsx
-
Figure 3—source data 3
Mouse Nervous System expression specificity results.
- https://cdn.elifesciences.org/articles/55851/elife-55851-fig3-data3-v2.xlsx
-
Figure 3—source data 4
Mouse Nervous System results for other traits and diseases.
- https://cdn.elifesciences.org/articles/55851/elife-55851-fig3-data4-v2.xlsx
-
Figure 3—source data 5
WGCNA results overview.
- https://cdn.elifesciences.org/articles/55851/elife-55851-fig3-data5-v2.xlsx
-
Figure 3—source data 6
WGCNA results for the top module M1.
- https://cdn.elifesciences.org/articles/55851/elife-55851-fig3-data6-v2.xlsx
-
Figure 3—source data 7
MAGMA results.
- https://cdn.elifesciences.org/articles/55851/elife-55851-fig3-data7-v2.xlsx
Figure 3—figure supplement 1
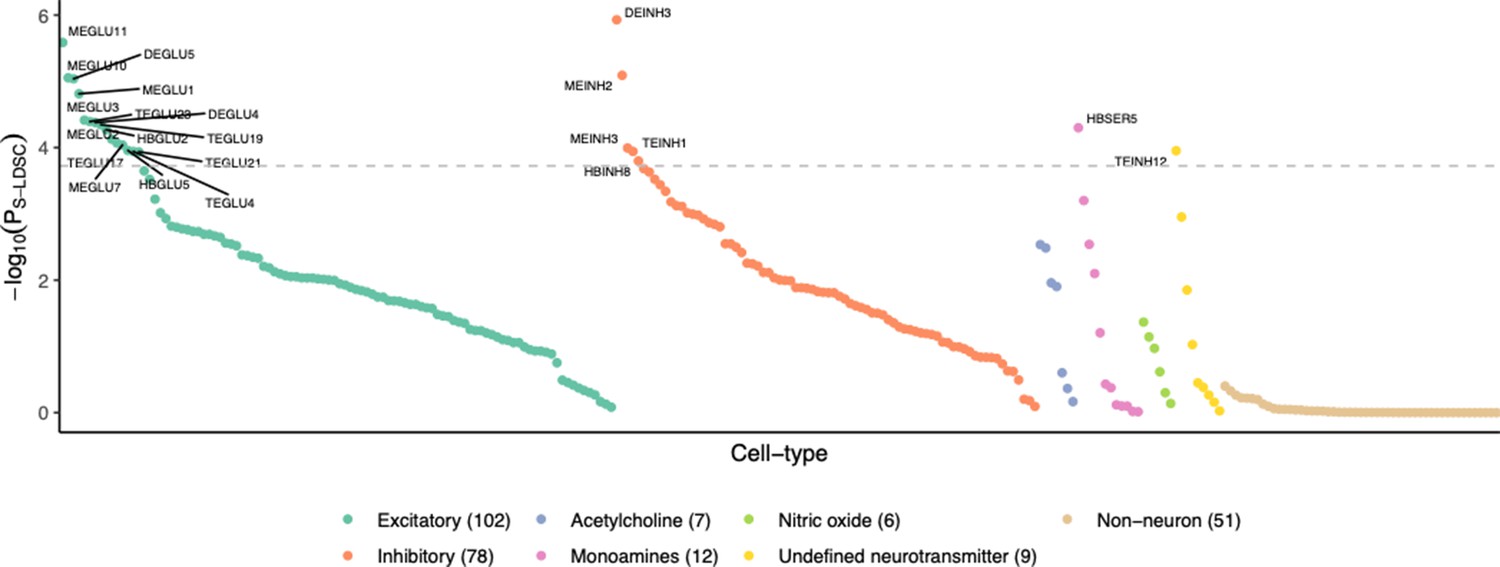
BMI-prioritized Mouse Nervous System cell type neurotransmitter classes BMI GWAS prioritized cell types prioritization enriched for neurons.
Non-neuronal (glial and vascular) cells did not exhibit any genetic enrichment. Cell types are grouped by neurotransmitter type and ordered by BMI GWAS-enrichment p-value (PS-LDSC). The horizontal line marks the Bonferroni significance threshold (PS-LDSC <0.05/265).
Figure 3—figure supplement 2
Genetic prioritization of cell type gene co-expression networks.
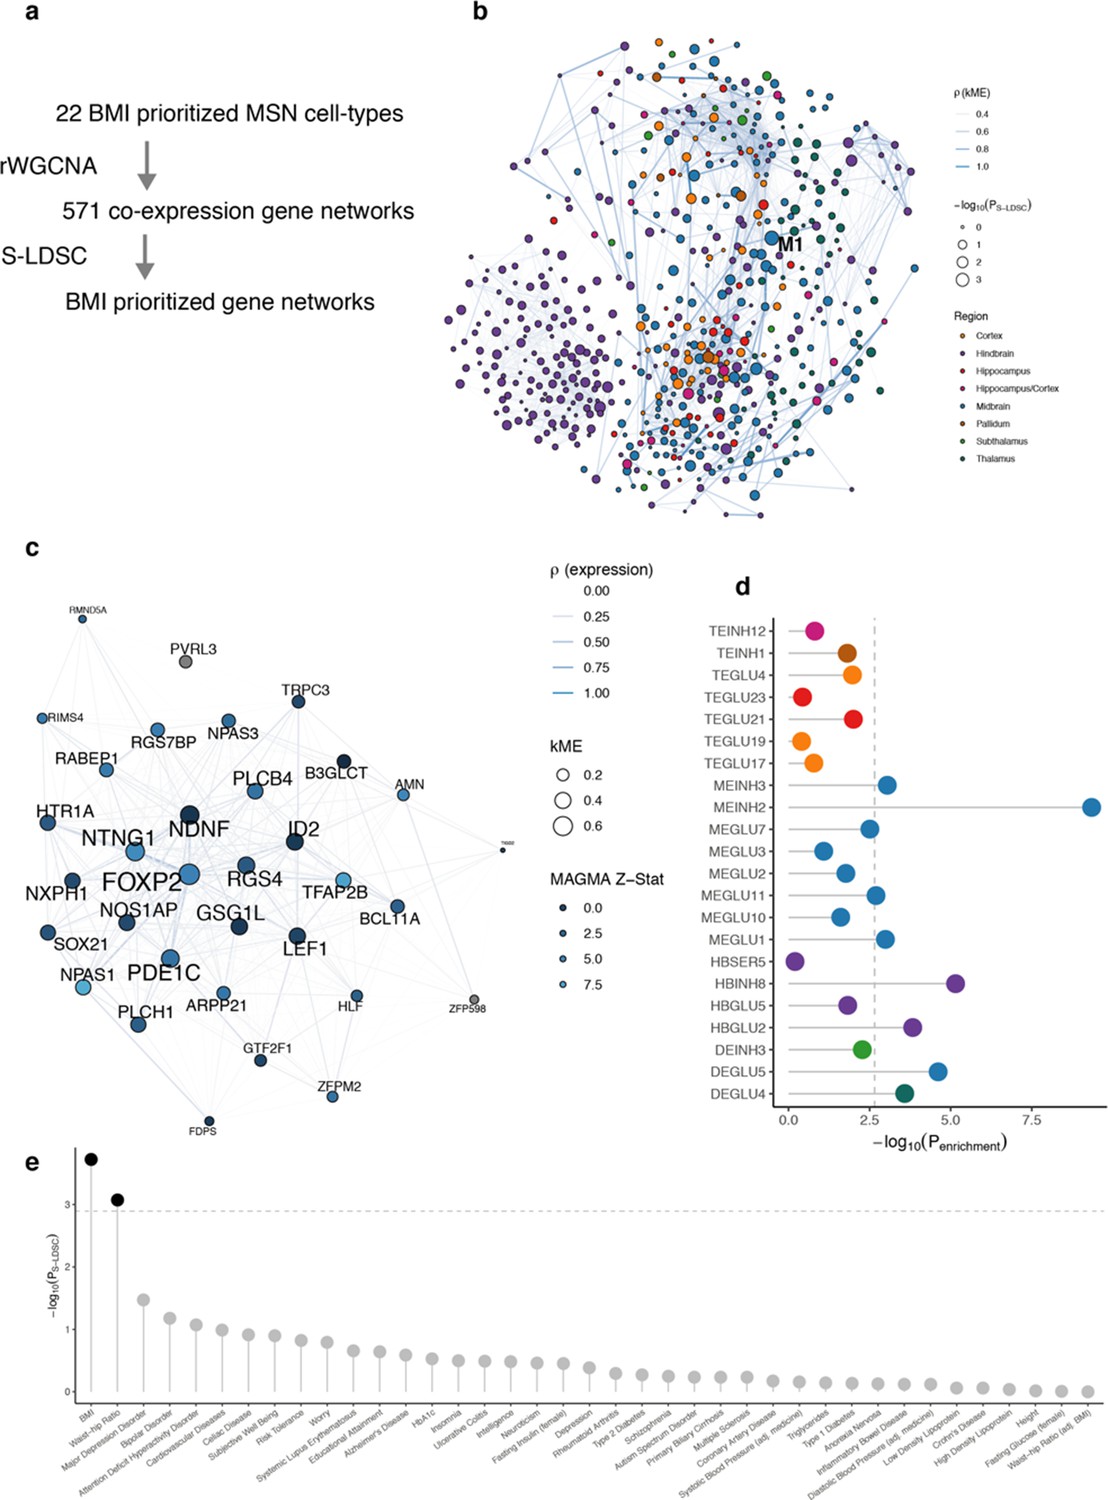
(a) Overview of our approach to identify and prioritize cell type gene co-expression networks (modules). We used robust weighted gene correlation network analysis (rWGCNA) to identify gene modules on expression data from individual BMI-prioritized cell types. The resulting modules were used as input to S-LDSC for genetic prioritization. (b) Network visualization of the 571 cell type gene modules. The graph shows the absolute Pearson’s correlation (ρ, edge width) between modules (nodes). Node color indicates the region of the cell type from which the module originates; node sizes represent genetic prioritization P-value for BMI (-log10(PS-LDSC)). The M1 module (originating from the MEINH2 cell type) is highlighted as the top significant module. The M1 module is not highly correlated with other modules. Only edges with ρ>0.3 are shown. (c) Network visualization of the M1 gene module. The graph shows the absolute Pearson’s correlation (ρ, edge width) between genes (nodes) in the module. Node size indicate kME value (a measure of gene-module membership); node color indicates MAGMA BMI gene Z-statistic (an aggregated measure of nearby variants BMI association). (d) Enrichment of M1 module genes in BMI-prioritized cell types. Genes in the M1 module are enriched among expression specific genes for multiple prioritized cell types, but most strongly in MEINH2. The dashed line indicates the Bonferroni significance threshold (Penrichment <0.05/22). (e) Genetic prioritization of M1 module across multiple GWAS traits. The M1 module is associated with BMI and waist-hip ratio (passing Bonferroni significance threshold PS-LDSC <0.05/39). Weighted gene correlation network analysis results for each of the 22 BMI-enriched cell types are available in Figure 3—source datas 5 and 6.
Figure 3—figure supplement 3

Robustness of cell type prioritization results.
(a) Comparison of Mouse Nervous System cell type prioritization results between the primary BMI analysis (Loh et al., 2018 GWAS summary statistics) and the Locke et al., 2015 GWAS summary statistics (sample size >320,000; left plot) and Yengo et al., 2018 BMI GWAS summary statistics (sample size >680,000; right plot). Pearson’s correlation (R) is shown in the top left corner. Solid line shows x = y. (b) Comparison of Mouse Nervous System cell type BMI prioritization results obtained using MAGMA (y-axis) and S-LDSC (x-axis). Pearson’s correlation (R) is shown in the top left corner. Solid line show x = y. Dashed lines highlight cell types passing the Bonferroni significance threshold. MAGMA results are available in Figure 3—source data 7.
Figure 4 with 2 supplements
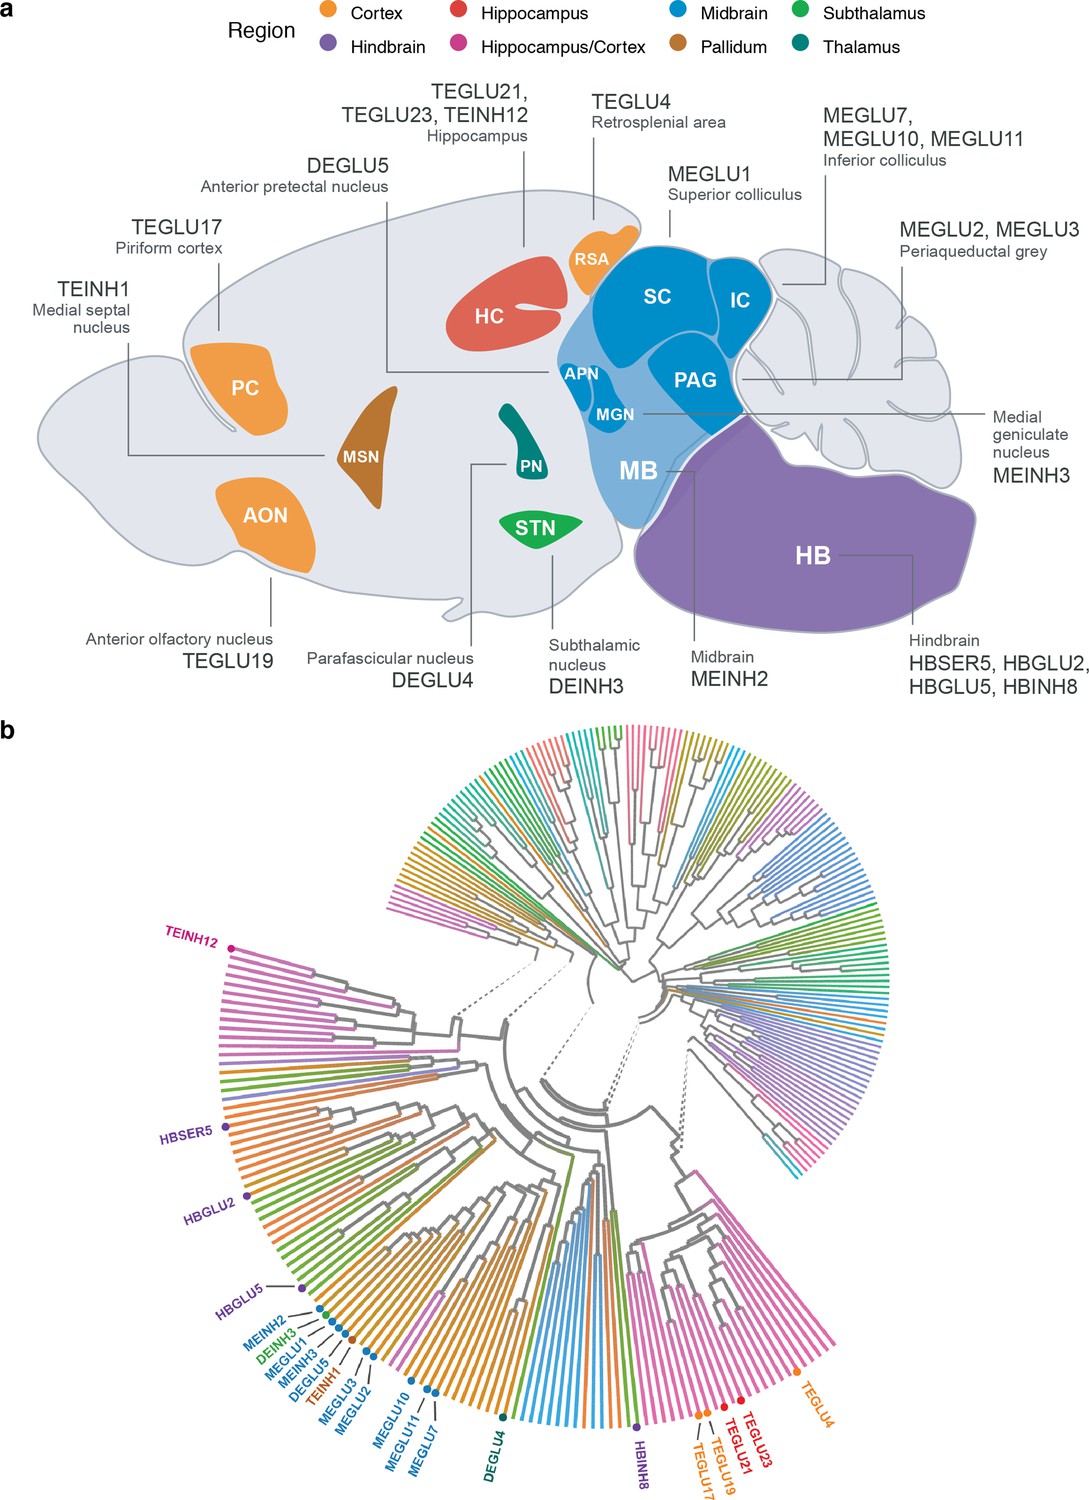
Neuroanatomical location and transcriptional similarity of brain cell types enriching for BMI GWAS variants.
(a) Sagittal mouse brain view showing the 22 BMI GWAS-enriched cell types. The first two letters in each cell type label denote the developmental compartment (ME, mesencephalon; DE, diencephalon; TE, telencephalon), letters three to five denote the neurotransmitter type (INH, inhibitory; GLU, glutamatergic) and the numerical suffix represents an arbitrary number assigned to the given cell type. (b) Circular dendrogram showing the similarity of all Mouse Nervous System dataset cell type expression specificity (ESμ) values. Dendrogram edges colored by taxonomy described in Zeisel et al., 2018. Expectedly, the cell types clustered according to their neuroanatomical origin. For clarity, only the labels of the 22 BMI GWAS enriched cell types are shown.
-
Figure 4—source data 1
Conditional CELLECT results.
- https://cdn.elifesciences.org/articles/55851/elife-55851-fig4-data1-v2.xlsx
Figure 4—figure supplement 1
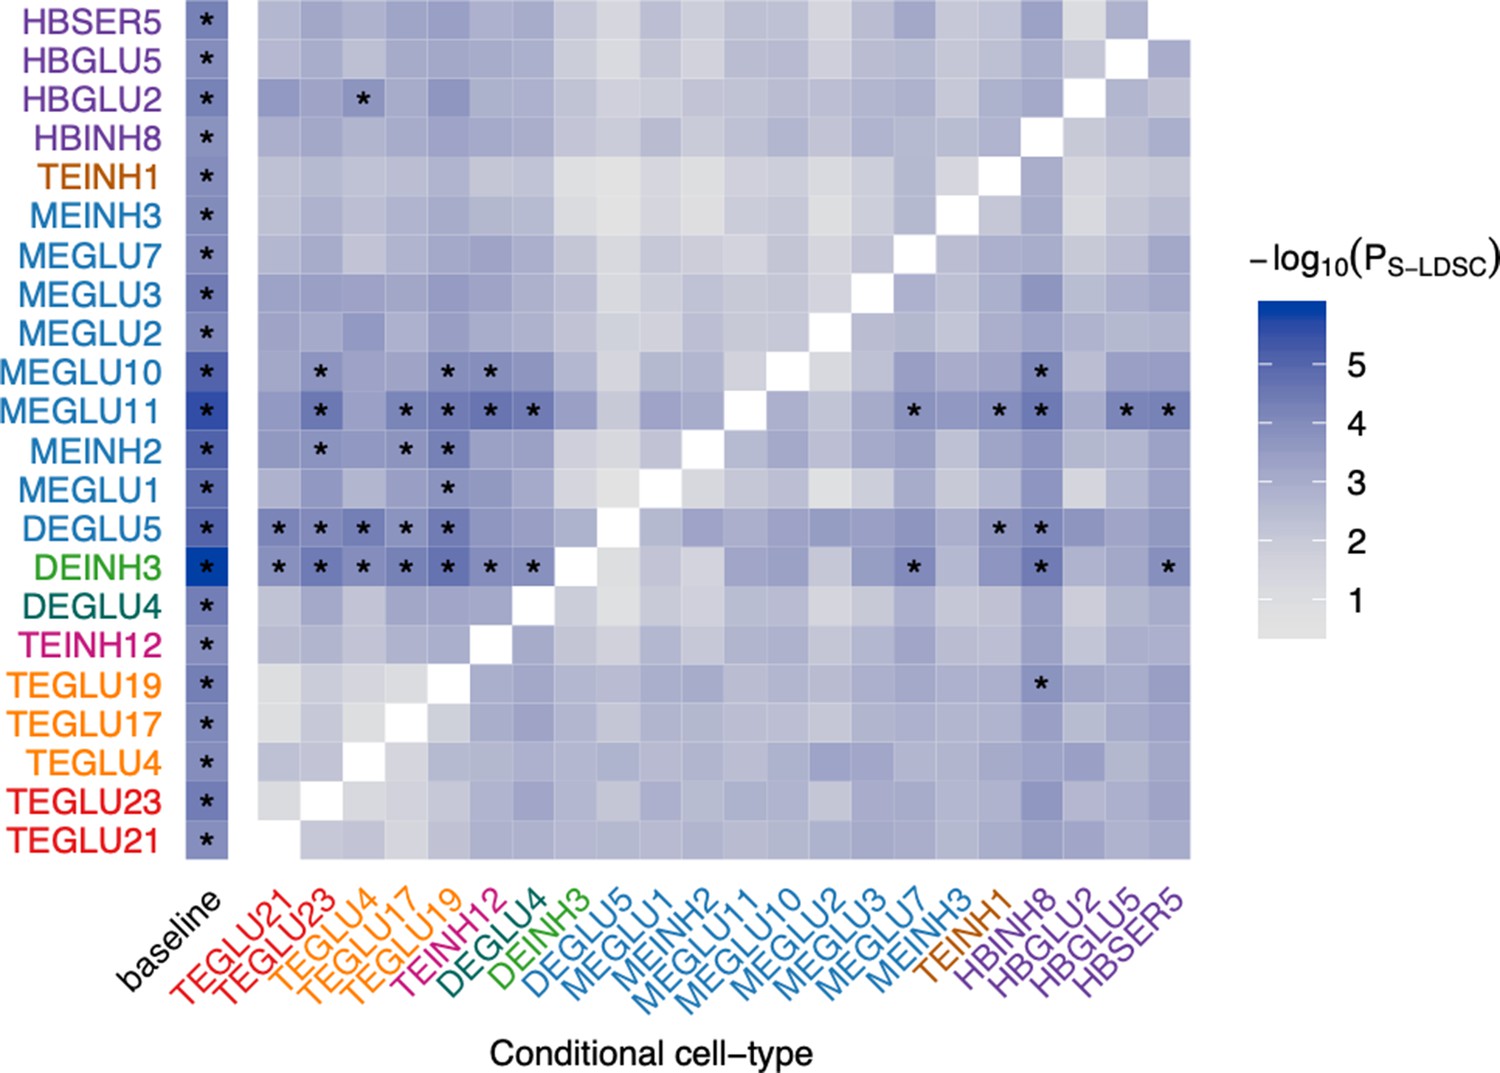
Conditional analysis of BMI GWAS-enriched mouse nervous system cell types conditional genetic prioritization analysis of BMI-prioritized cell types.
We used S-LDSC to re-estimate genetic prioritization p-values, conditioning on each BMI-prioritized cell type. Columns indicate the cell type conditioned on. The left column (‘baseline’) shows the unconditioned results (as shown in main text Figure 3a). Cell-types are colored by their brain region as shown in main text Figure 3a. NA values are colored in white (diagonal values) indicate cases were the prioritized and conditioned cell types are identical. Asterisks (*) mark p-values passing the Bonferroni significance threshold (PS-LDSC <0.05/265 from main text Figure 3a). All conditional CELLECT results are available in Figure 4—source data 1.
Figure 4—figure supplement 2
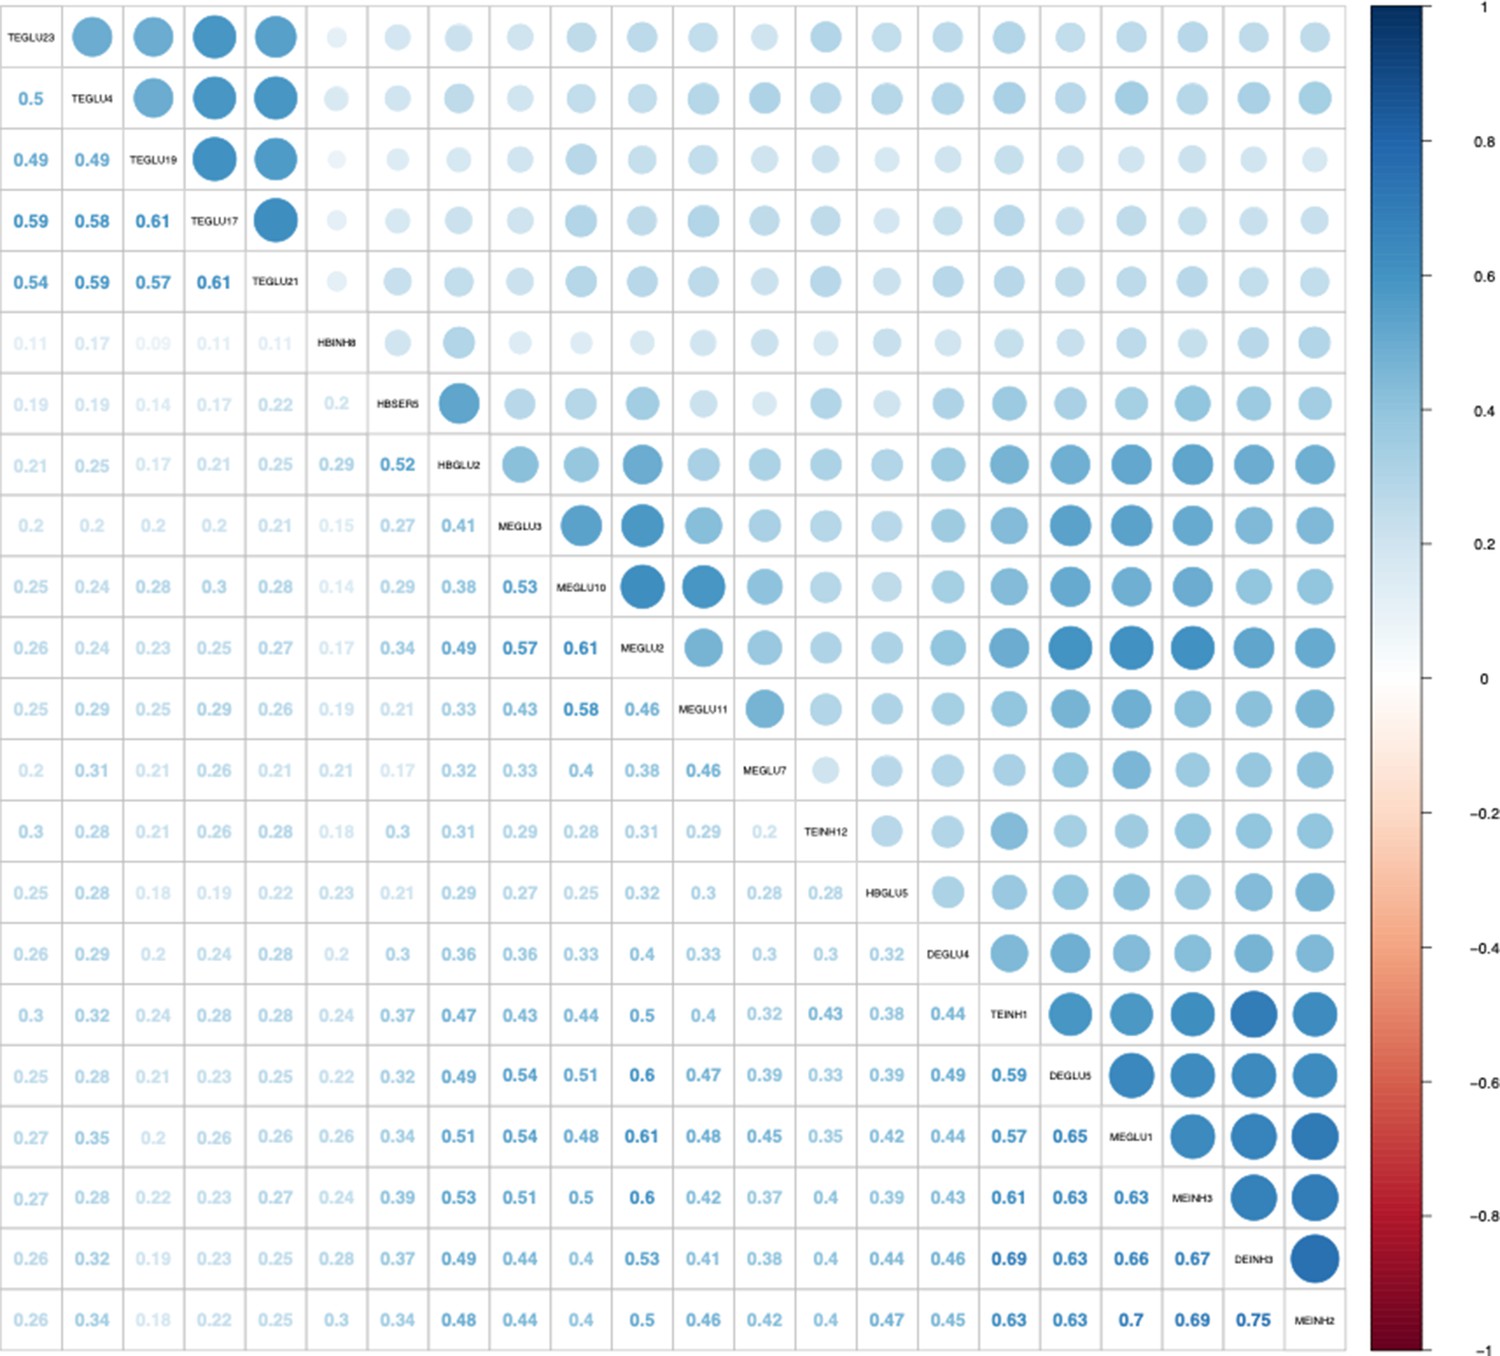
Correlation of mouse nervous system BMI GWAS-enriched cell types correlogram of cell type ESμ Pearson’s correlations.
Cell types are ordered by hierarchical clustered using Ward’s method. The plot was generated using the ‘corrplot’ R package.
Figure 5 with 3 supplements
BMI GWAS enrichment across hypothalamic cells and human tissues.
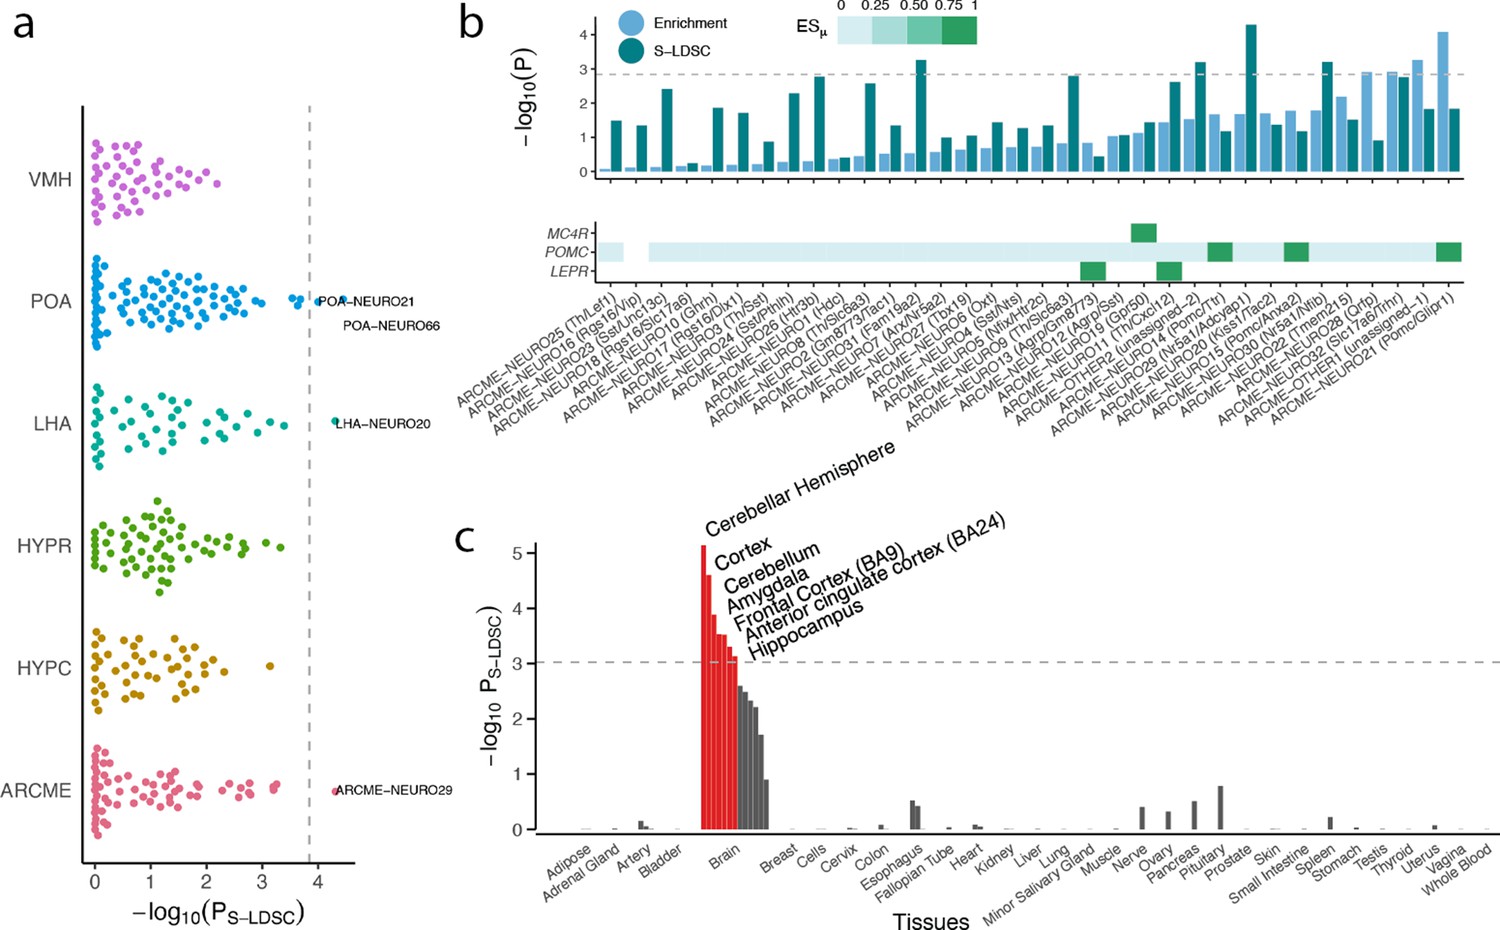
(a) BMI GWAS enrichments across 347 hypothalamic cell types derived from studies of the Arc-ME (ARCME), the ventromedial hypothalamus (VMH), the lateral hypothalamus (LHA), the preoptic nucleus of the hypothalamus (POA) and the entire hypothalamus (HYPR and HYPC). For each study, CELLEX and CELLECT were run individually, and subsequently all cell types were pooled and significance was determine based on Bonferroni correction (p<0.05/347). Four cell types were significantly enriched, namely POA-NEURO66 (Reln+; Moffitt et al., 2018) and POA-NEURO21 (Cck+/Ebf3+; Moffitt et al., 2018) from the preoptic area of the hypothalamus, ARCME-NEURO29 (Sf1+/Adcyap1+; Campbell et al., 2017) from the Arc-ME, and LHA-NEURO20 (Ebf3/Otb+; Mickelsen et al., 2019) from the lateral hypothalamus. (b) CELLECT and high-confidence obesity genes enrichments for neuronal cell populations in the Arc-ME (upper panel). Expression of Mc4r, Pomc and Lepr across Arc-ME neuronal populations, white squares means that the given gene is not expressed in at least 10% of the cells in the given cell population, non-white squares denote increasingly specific gene expression (lower panel). (c) CELLECT enrichment analysis of Genotype-Tissue Expression Consortium (GTEx) RNA-seq data. Orange bars denote significantly enriched tissues. The hypothalamus datasets’ metadata, CELLECT results and expression specificity values for the enriched cell types are available in Figure 5—source datas 1–3. The GTEx tissue annotations, CELLECT and high-confidence obesity genes enrichment results are available in Figure 5—source datas 10–12. POA, preoptic area of the hypothalamus; LHA, lateral hypothalamus; ARCME, arcuate nucleus and median eminence complex; S-LDSC, stratified-linkage disequilibrium score regression.
-
Figure 5—source data 1
Hypothalamus datasets metadata.
- https://cdn.elifesciences.org/articles/55851/elife-55851-fig5-data1-v2.xlsx
-
Figure 5—source data 2
Hypothalamus CELLECT results.
- https://cdn.elifesciences.org/articles/55851/elife-55851-fig5-data2-v2.xlsx
-
Figure 5—source data 3
Hypothalamus expression specificity results.
- https://cdn.elifesciences.org/articles/55851/elife-55851-fig5-data3-v2.xlsx
-
Figure 5—source data 4
High-confidence obesity genes.
- https://cdn.elifesciences.org/articles/55851/elife-55851-fig5-data4-v2.xlsx
-
Figure 5—source data 5
High-confidence obesity genes expression specificities.
- https://cdn.elifesciences.org/articles/55851/elife-55851-fig5-data5-v2.xlsx
-
Figure 5—source data 6
High-confidence obesity genes enrichments.
- https://cdn.elifesciences.org/articles/55851/elife-55851-fig5-data6-v2.xlsx
-
Figure 5—source data 7
High-confidence obesity genes CELLECT correlations.
- https://cdn.elifesciences.org/articles/55851/elife-55851-fig5-data7-v2.xlsx
-
Figure 5—source data 8
Expression specificity and cell type heterogeneity.
- https://cdn.elifesciences.org/articles/55851/elife-55851-fig5-data8-v2.xlsx
-
Figure 5—source data 9
High-confidence obesity genes CELLEX top quartile.
- https://cdn.elifesciences.org/articles/55851/elife-55851-fig5-data9-v2.xlsx
-
Figure 5—source data 10
Genotype-Tissue Expression data annotation.
- https://cdn.elifesciences.org/articles/55851/elife-55851-fig5-data10-v2.xlsx
-
Figure 5—source data 11
Genotype-Tissue Expression CELLECT enrichment results.
- https://cdn.elifesciences.org/articles/55851/elife-55851-fig5-data11-v2.xlsx
-
Figure 5—source data 12
Genotype-Tissue Expression obesity genes enrichment results.
- https://cdn.elifesciences.org/articles/55851/elife-55851-fig5-data12-v2.xlsx
Figure 5—figure supplement 1
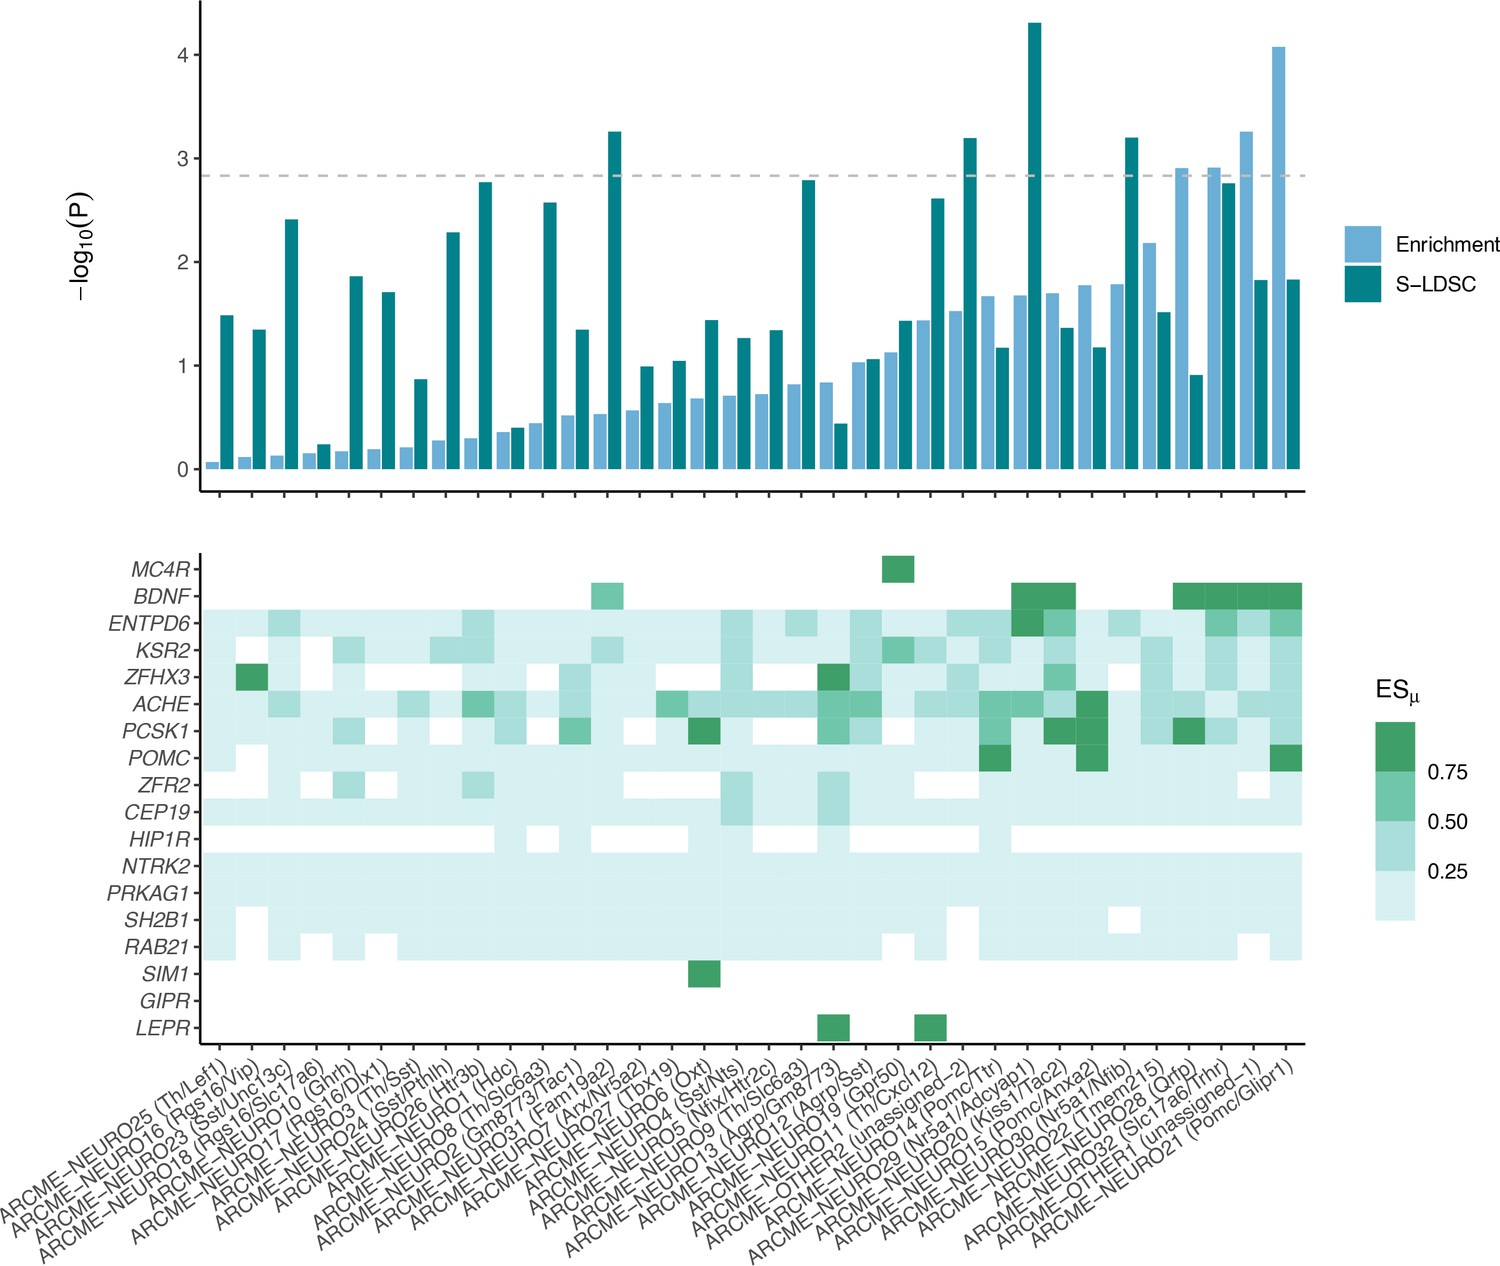
Arc-ME neuronal cell population enrichments and expression levels across obesity genes CELLECT and high-confidence obesity genes enrichments for neuronal cell populations in the Arc-ME (upper panel).
Expression of high-confidence obesity genes across Arc-ME neuronal populations, white squares means that the given gene is not expressed in at least 10% of the cells in the given cell population, non-white squares denote increasingly specific gene expression (lower panel).
Figure 5—figure supplement 2
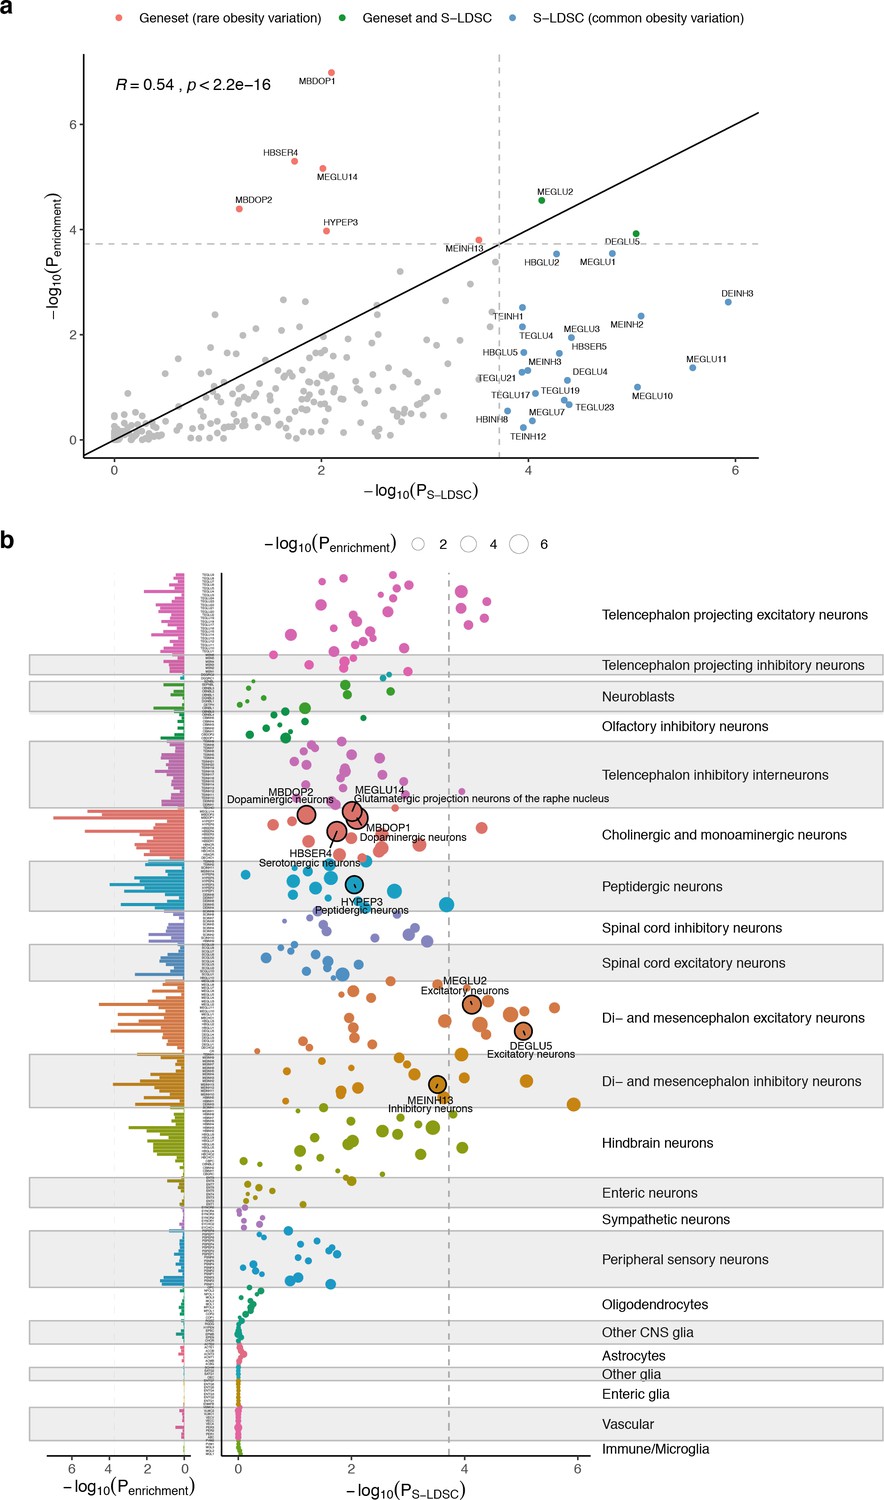
Convergence of cell type prioritization based on common and rare variants.
(a) Cell type prioritization of high-confidence obesity genes enrichment results (bar chart, left part) and BMI GWAS-enrichment results (bubble chart, right part). Circle sizes represent the -log10(Penrichment) cell type enrichment of the high-confidence obesity genes. Circles with black edges mark cell types passing the Bonferroni significance threshold (Penrichment <0.05/265). Bar chart (left plot) shows the distribution of -log10(Penrichment) across all cell types. Dashed lines indicate Bonferroni significance threshold. Cell types are grouped by the cell type taxonomy shown in Figure 3b. (b) Comparison of cell type BMI GWAS-enrichment and high-confidence obesity genes enrichment-based results. Cell type BMI GWAS-enrichment (x-axis) and cell type enrichment of high-confidence obesity genes (y-axis). Pearson’s correlation (R) is shown in the top left corner. Dashed lines indicate cell types passing the Bonferroni significance threshold. Solid line shows x = y relationship.
Figure 5—figure supplement 3
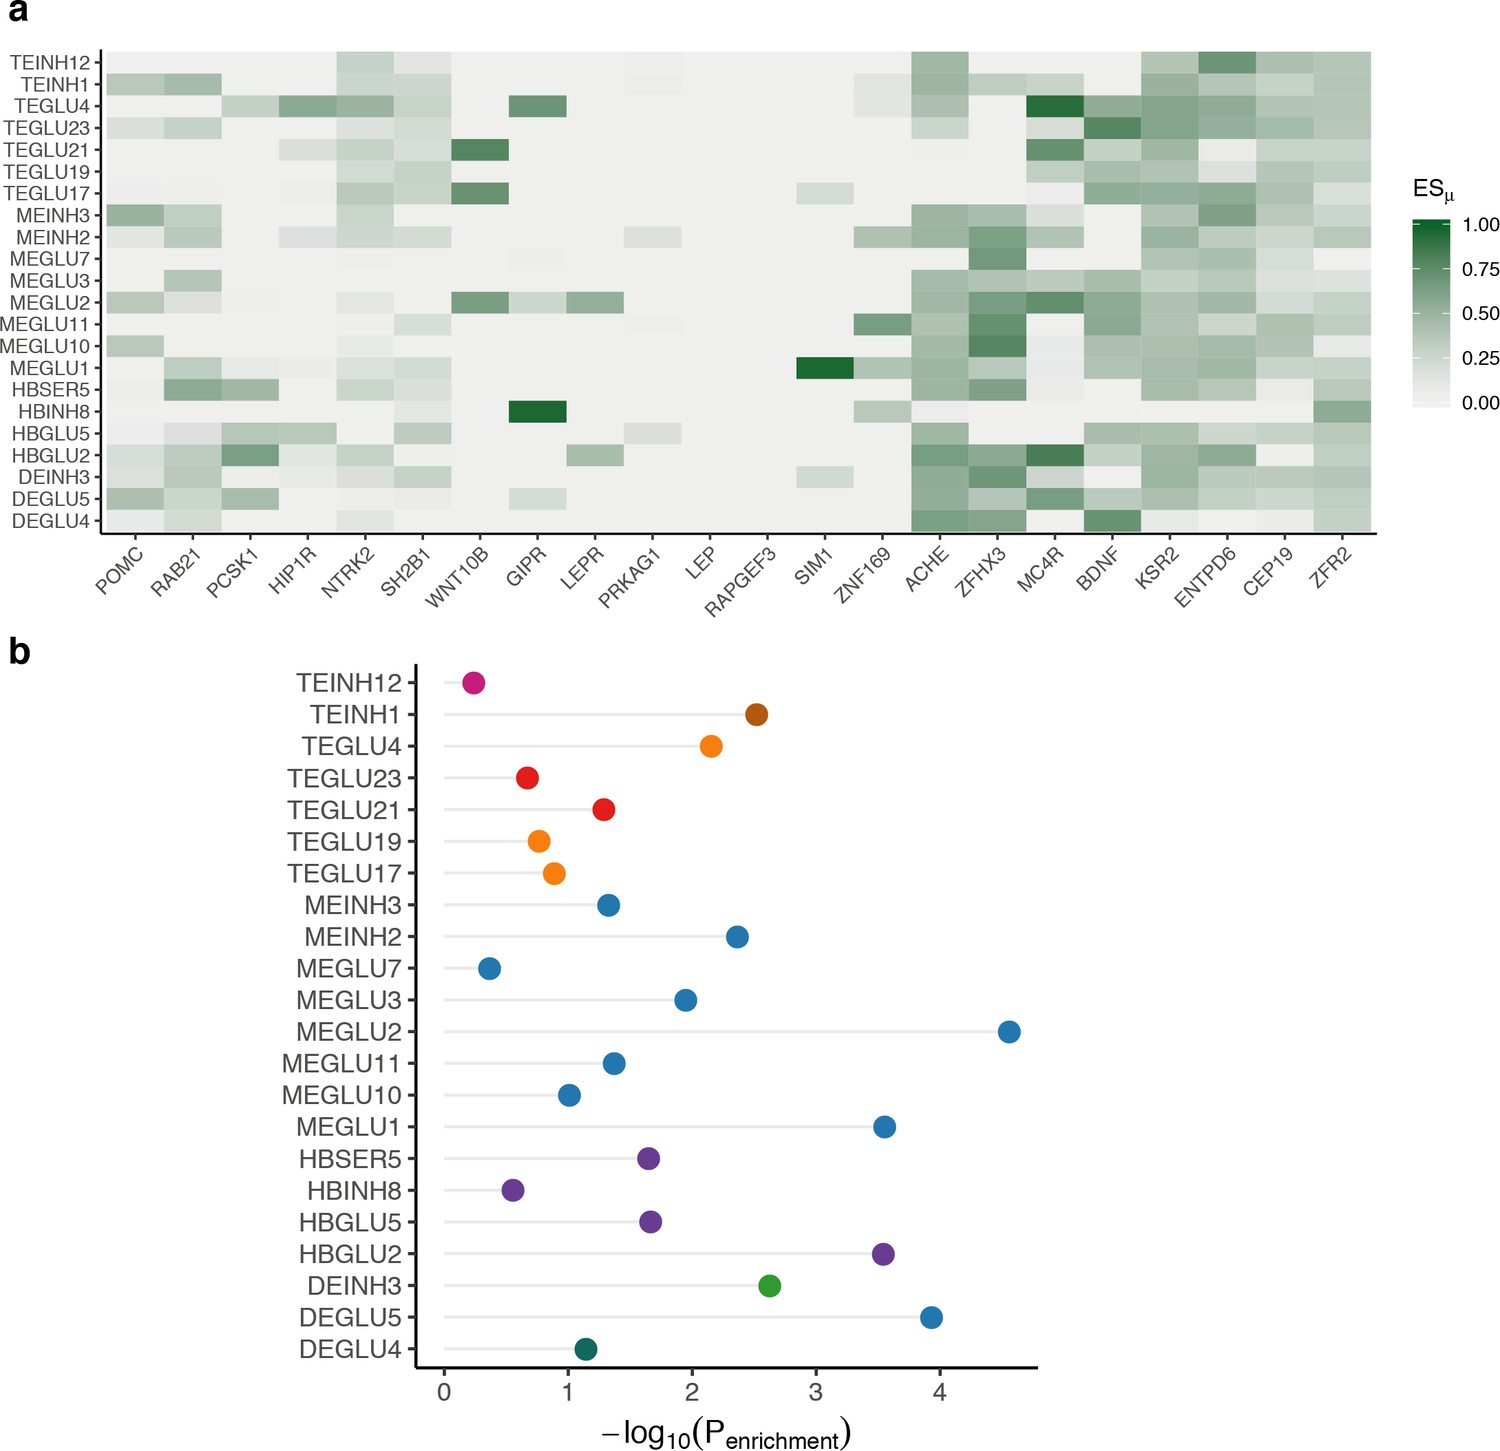
High-confidence obesity genes enrichment in mouse nervous system cell types.
(a) Heatmap showing ESμ values for high-confidence obesity genes (columns) for BMI GWAS-enriched cell types (rows). (b) Cell type enrichment of high-confidence obesity genes for BMI GWAS-enriched cell types. The high-confidence obesity genes and mouse nervous system enrichment results are available in Figure 5—source datas 4 and 6.
Figure 6 with 1 supplement
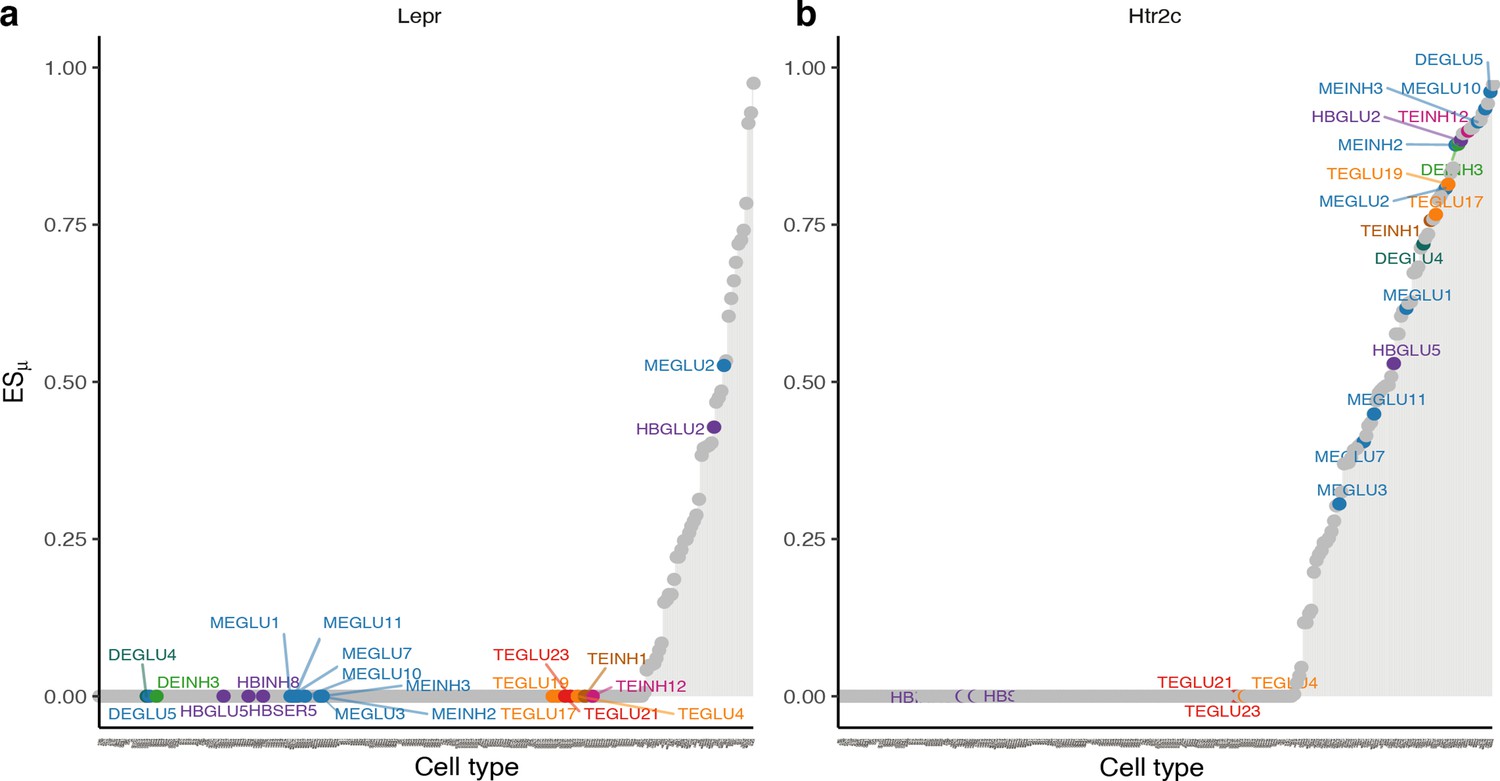
Expression specificity of the leptin- and serotonin receptors across BMI GWAS enriched cell types.
(a) In the lipostatic model of obesity originally defined by Kennedy, 1953, circulating concentrations of the leptin hormone signal the amount of energy stored in fat cells to the brain. The plot shows gene ESμ (y-axis) for each cell type (x-axis, ordered by increasing values of expression specificity, ESμ) with BMI-prioritized cell types from the Mouse Nervous System dataset highlighted. In our analysis, only two of the 22 BMI GWAS enriched cell types specifically expressed the leptin receptor (MEGLU2, periaqueductal grey; and HBGLU2, nucleus of the solitary tract). (b) Seventeen of the 22 BMI GWAS enriched cell types specifically expressed the serotonin (5-htr2c) receptor. The strongest enrichment was observed for DEGLU5, a glutamatergic cell type from the anterior pretectal nucleus. ESμ, expression specificity.
Figure 6—figure supplement 1

ESμ plot for selected genes ESμ plots for genes selected based on their suggested role in appetite regulation, energy homeostasis or obesity.
The plot shows gene ESμ (y-axis) for each cell type (x-axis, ordered by increasing values of ESμ) and highlights the BMI-prioritized cell types.
Appendix 1—figure 1
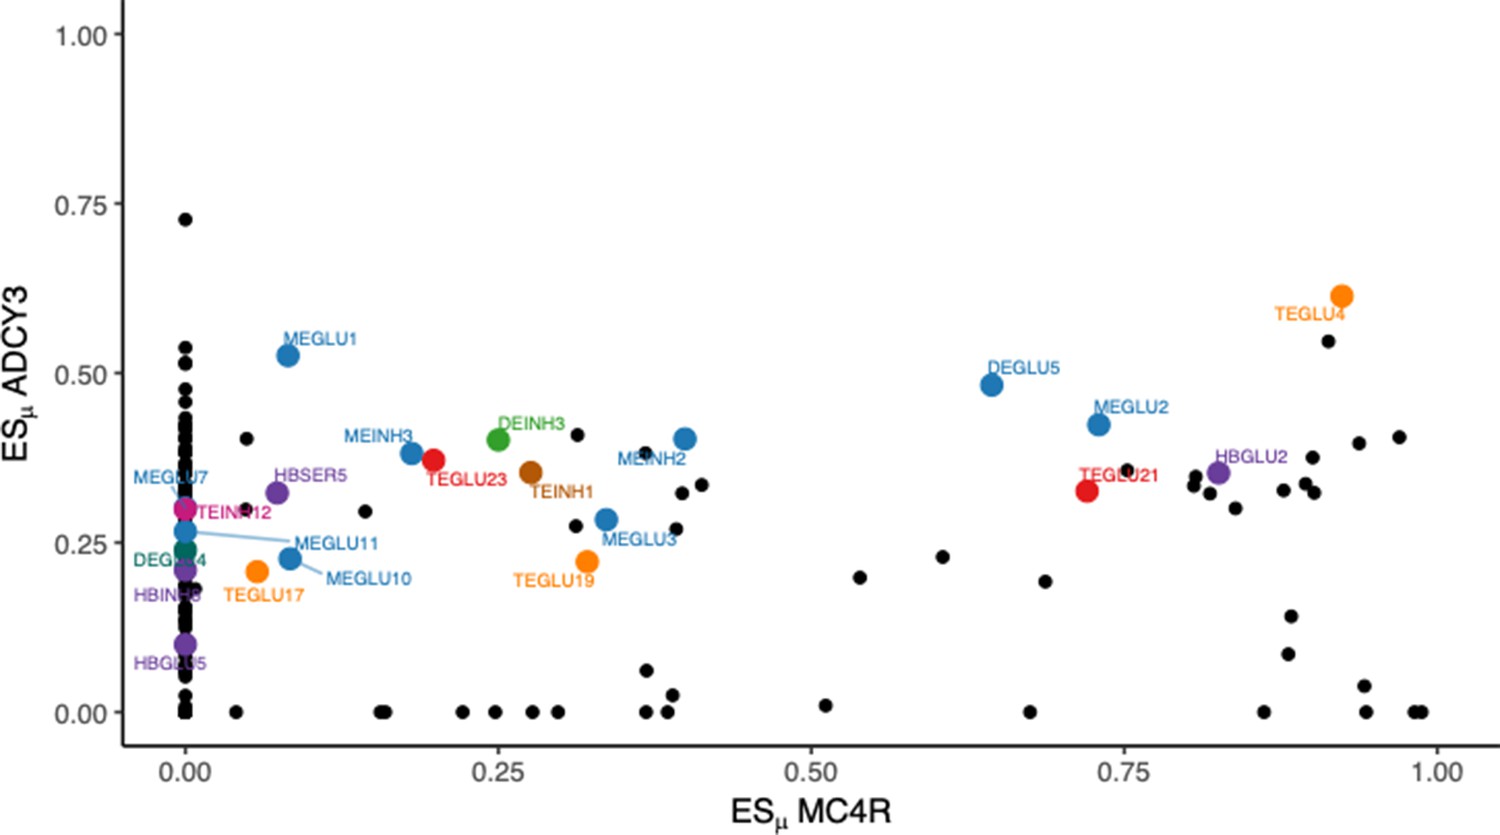
Co-specific expression of Mc4r and Adcy3.
The co-specific expression of Mc4r and Adcy3 may serve as an example on how certain cell types may co-express a core gene (Mc4r in this example) and peripheral genes (Adcy3 in this example). BMI-prioritized cell types are highlighted in color.
Appendix 1—figure 2
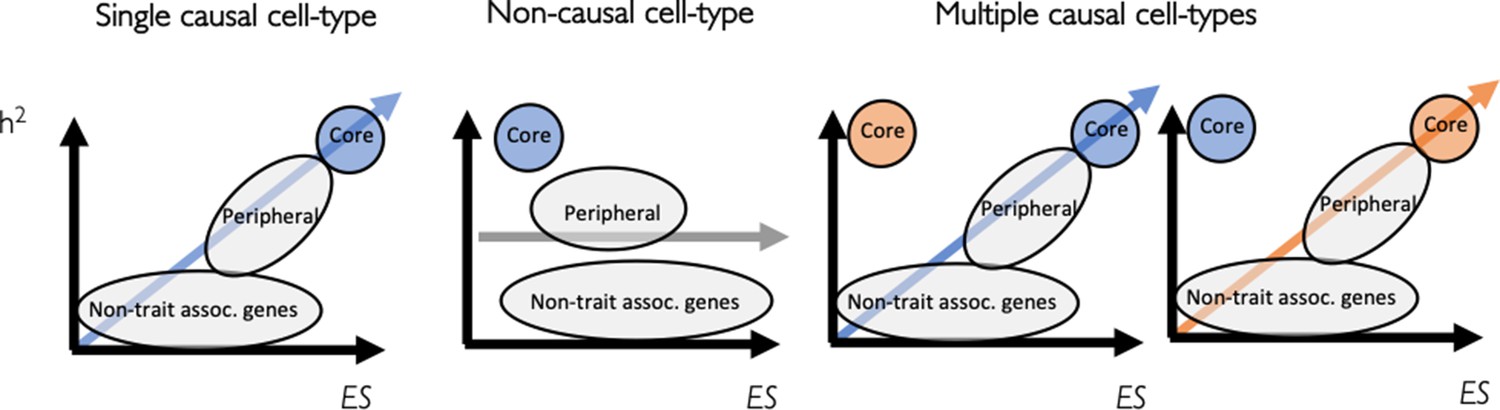
Levering the omnigenic model to identify causal cell types using expression specificity.
A linear model can be used to identify causal cell types by testing for association between gene expression specificity and gene heritability. Three scenarios are shown: a causal cell type (left), a non-causal cell type (middle) and multiple causal cell types (right).
Appendix 2—figure 1
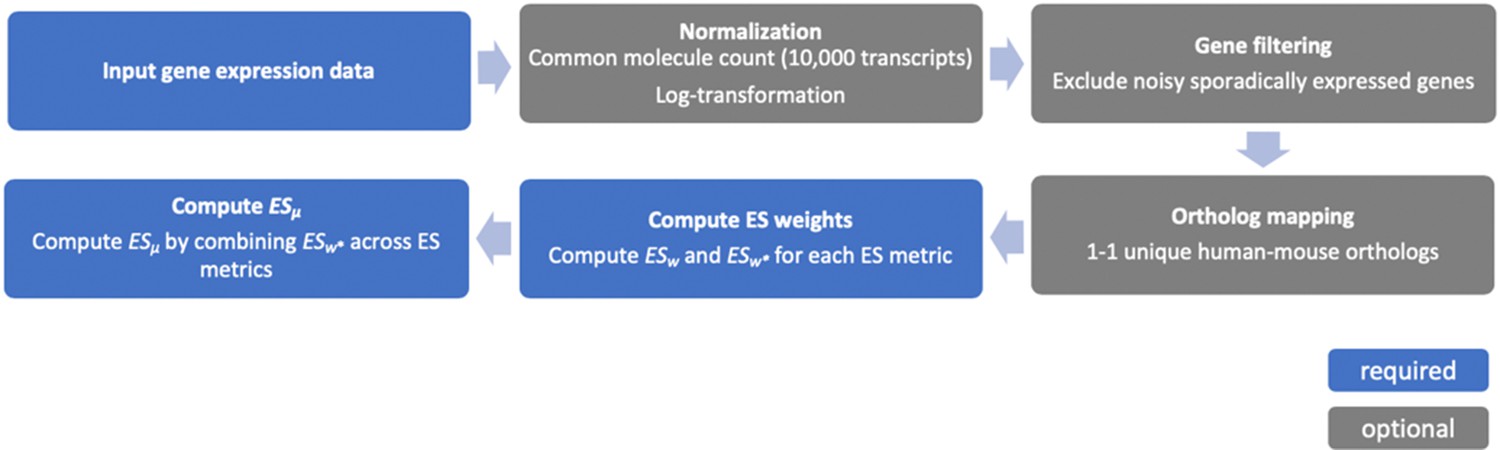
Overview of CELLEX expression specificity estimation In this work, we used the optional steps for normalization and gene filtering.
We also used ortholog mapping when analyzing mouse scRNA-seq data.
-
Appendix 2—figure 1—source data 1
ES metrics used in CELLEX.
- https://cdn.elifesciences.org/articles/55851/elife-55851-app2-fig1-data1-v2.docx
Appendix 2—figure 2
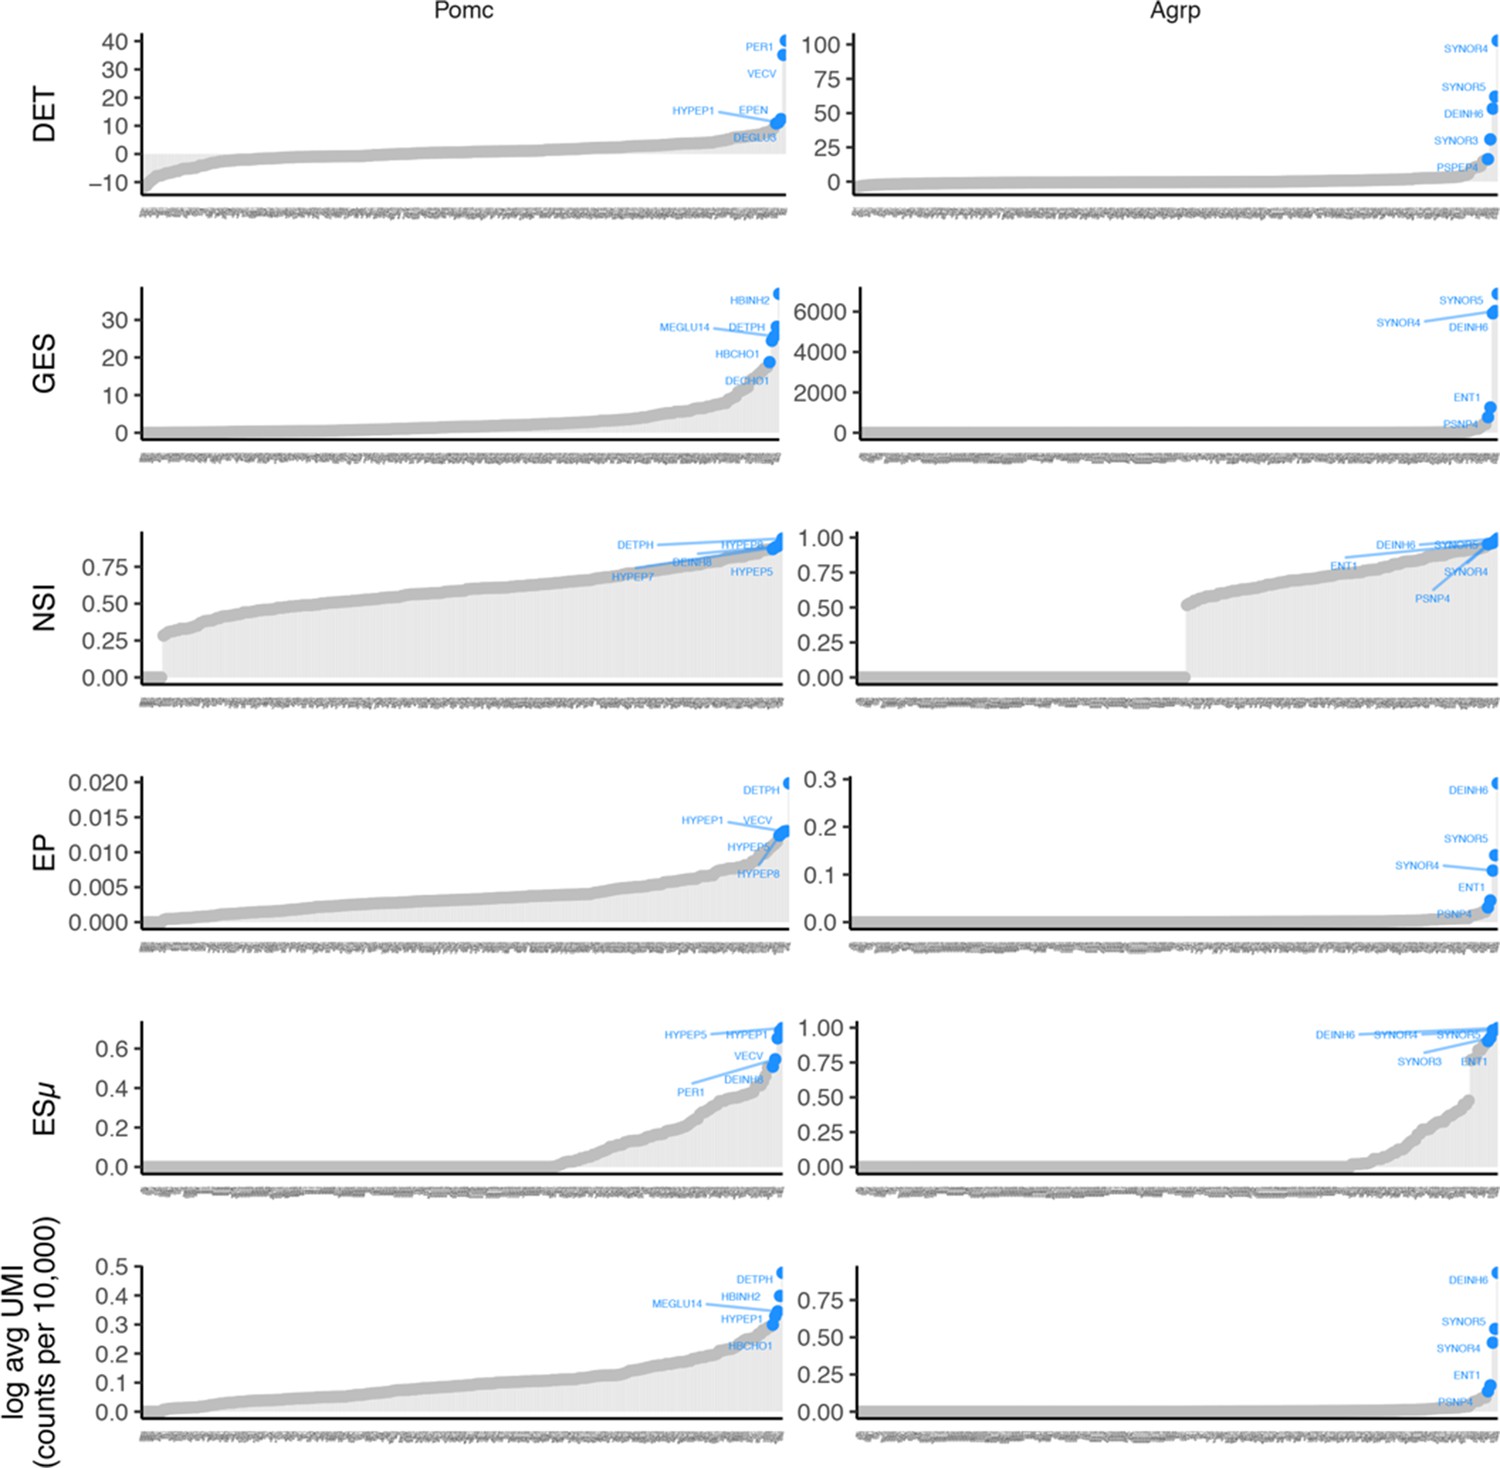
Expression specificity profile for POMC (left) and AGRP (right) AGRP is expressed in few cell types and POMC is expressed in slightly more cell types.
Each panel row shows a different ES metric (normalized average expression is shown in the bottom row panels). The plot shows gene ESw (y-axis) for each cell type (x-axis, ordered by increasing values of ESw). The five cell types with the largest ESw are highlighted. ESw values are estimated from the Mouse Nervous System dataset.
Appendix 2—figure 3
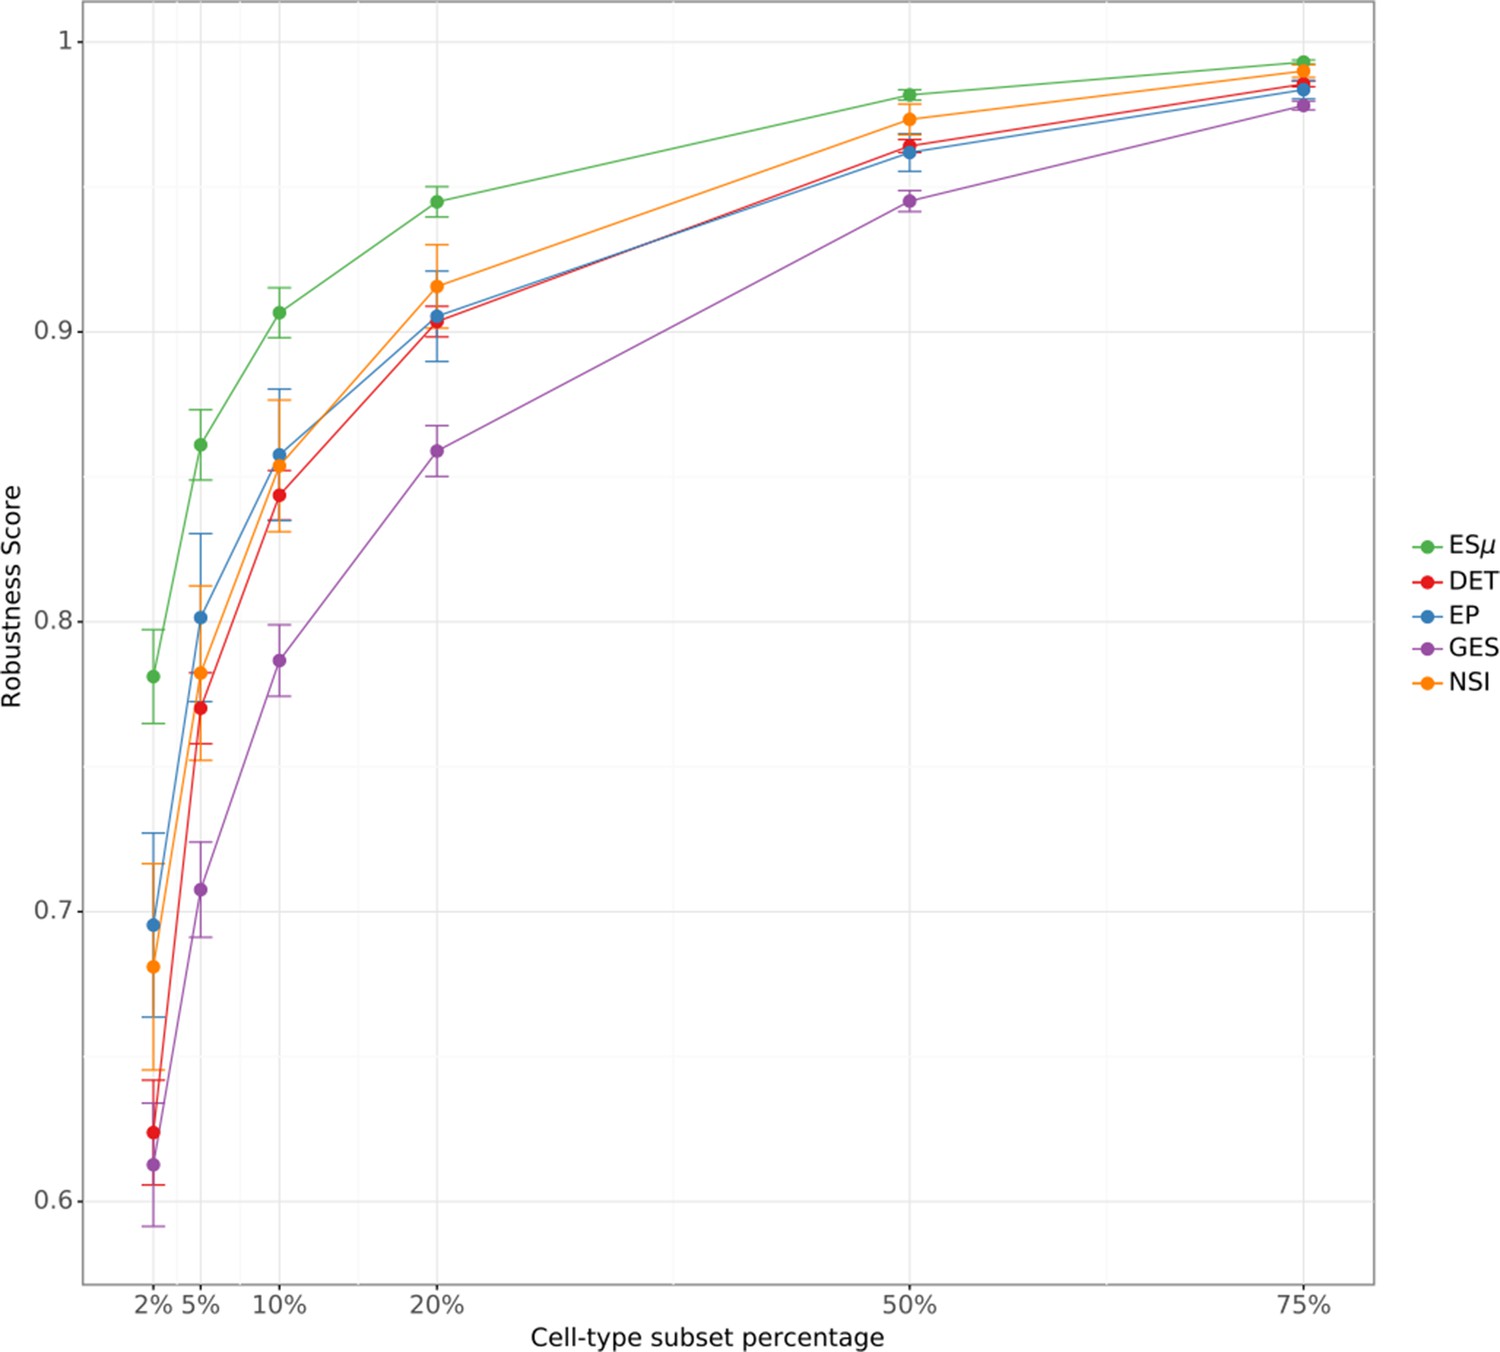
Robustness of ES metrics.
The figure depicts the robustness score (RS) for each ES metric as a function of cell type subset percentage. Each point represents the mean RS across 12 focal cell types. Error bars indicate standard error of the mean.
Appendix 4—figure 1

Heritability of BMI prioritized cell types.
(a) Heritability enrichment of cell type ESμ intervals. Heritability enrichment was estimated using S-LDSC on cell type ESμ annotations partitioned into five equally spaced intervals and an interval including ESμ=0. The intervals 0 and (0.8–1) represent the heritability enrichment of by the variants with the lowest and highest ESμ values, respectively. Error bars represent 95% confidence intervals. The top, middle and bottom panel show results for BMI, height and waist-hip ratio, respectively. BMI heritability enrichment increases with increasing ESμ value for prioritized cell types. (b) Proportion of BMI heritability explained by prioritized cell types. We used S-LDSC to estimate the proportion of trait SNP heritability explained by each cell type annotation. For comparison we report the proportion of heritability explained by cell types with known etiology for selected traits: type 2 diabetes (T2D), low-density lipoprotein (LDL), rheumatoid arthritis (RA) and human height. Circles are colored by annotation size reflecting the proportion of variants covered by the cell type annotation (a value of one means that all variants were covered). Error bars represent 95% confidence intervals.
Additional files
-
Transparent reporting form
- https://cdn.elifesciences.org/articles/55851/elife-55851-transrepform-v2.docx
-
Appendix 2—figure 1—source data 1
ES metrics used in CELLEX.
- https://cdn.elifesciences.org/articles/55851/elife-55851-app2-fig1-data1-v2.docx
Download links
A two-part list of links to download the article, or parts of the article, in various formats.
Downloads (link to download the article as PDF)
Open citations (links to open the citations from this article in various online reference manager services)
Cite this article (links to download the citations from this article in formats compatible with various reference manager tools)
Genetic mapping of etiologic brain cell types for obesity
eLife 9:e55851.
https://doi.org/10.7554/eLife.55851


