Genomic architecture and evolutionary antagonism drive allelic expression bias in the social supergene of red fire ants
- School of Biological and Chemical Sciences, Queen Mary University of London, United Kingdom
- Departamento Ecología, Genética y Evolución, Facultad de Ciencias Exactas y Naturales, Universidad de Buenos Aires, Intendente Güiraldes 2160, Ciudad Universitaria, Argentina
- Alan Turing Institute, United Kingdom
Figures
Figure 1 with 5 supplements
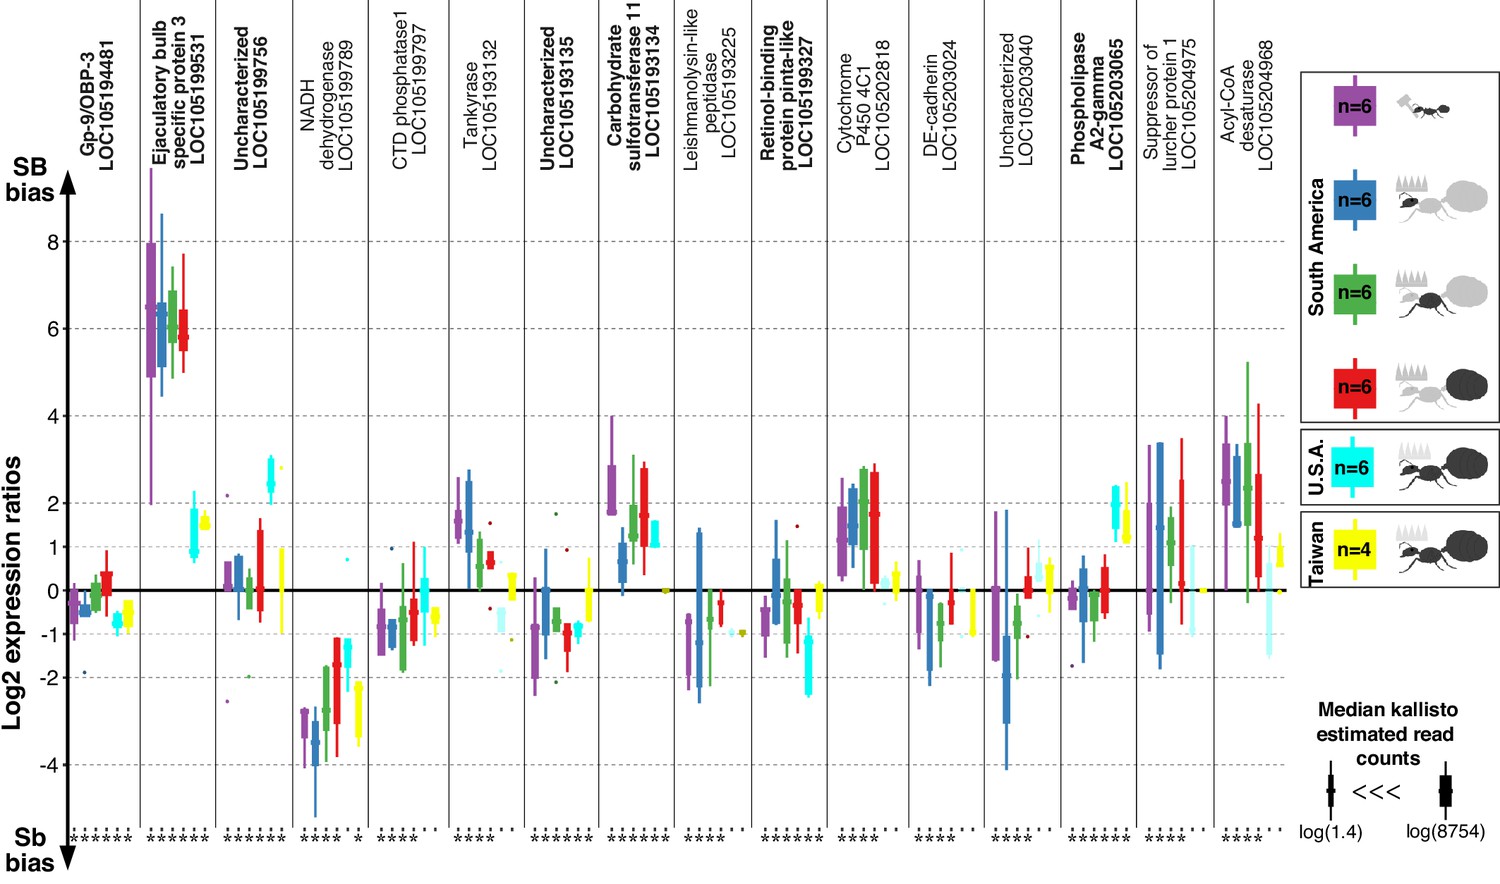
Differences in expression levels between alleles for genes in the fire ant social supergene in heterozygous SB/Sb individuals which exist only in multiple-queen colonies.
Differences in expression (y axis) between social chromosome variants in whole bodies of workers from South America, heads, thoraces and abdomens of queens from South America, whole bodies of queens from North America and Taiwan. We show all 16 genes with significant allelic bias in South American populations, and the corresponding biases from the other populations. Bold gene names highlight when allelic bias occurs in all populations (Benjamini-Hochberg (BH) adjusted p<0.05 from the joint linear mixed-effects model). Significance in population-specific comparisons is indicated by an asterisks under each boxplot (BH adjusted p<0.05 from either the joint analysis or DESeq2 Wald tests). Each box shows the distribution of logarithm two expression ratios between SB and Sb in each sample type. Positive values indicate higher SB expression; negative values indicate higher Sb expression. A log2 expression ratio greater than one or smaller than −1 represents a two-fold gene expression difference in either direction. Genes are in chromosomal order.
-
Figure 1—source data 1
Differences in expression levels between alleles for genes in the fire ant social supergene in heterozygous SB/Sb individuals which exist only in multiple-queen colonies.
The columns in the dataset stand for: refseq_id, gene ID in the RefSeq database; body_part, body part from which the RNA was extracted; median_expression, median DESeq2 normalized expression per gene across all samples per body part; mean_lfc, mean log2 fold changes between Sb and SB allelic expression per body part; sd_lfc, standard deviation of the log2 fold changes between Sb and SB allelic expression per body part; littleb_expression, DESeq2 normalised read counts for the Sb allele, bigB_expression, DESeq2 normalised read counts for the SB allele; sample_id, ID for the replicate; population, population of origin of the replicate, total_expression, combined SB Sb expression per gene per replicate; lfc_SB-Sb, log2 fold changes between SB and Sb DESeq2 normalized read counts; normalized_lfc, Z scores centered log2 fold changes between SB and Sb, the mean log2 fold change per body part is substracted from the log2 fold change per gene per replicate and divided by the standard deviation per body part; significant, whether a gene show significant differences in expression levels between Sb and SB according to either our linear mixed effects model or DESeq2's Wald test, "na" for significance in North American populations, "sa" for South American, "taiwan" for Taiwanese populations and "all" if a geneis significant in all populations.
- https://cdn.elifesciences.org/articles/55862/elife-55862-fig1-data1-v2.csv
Figure 1—figure supplement 1
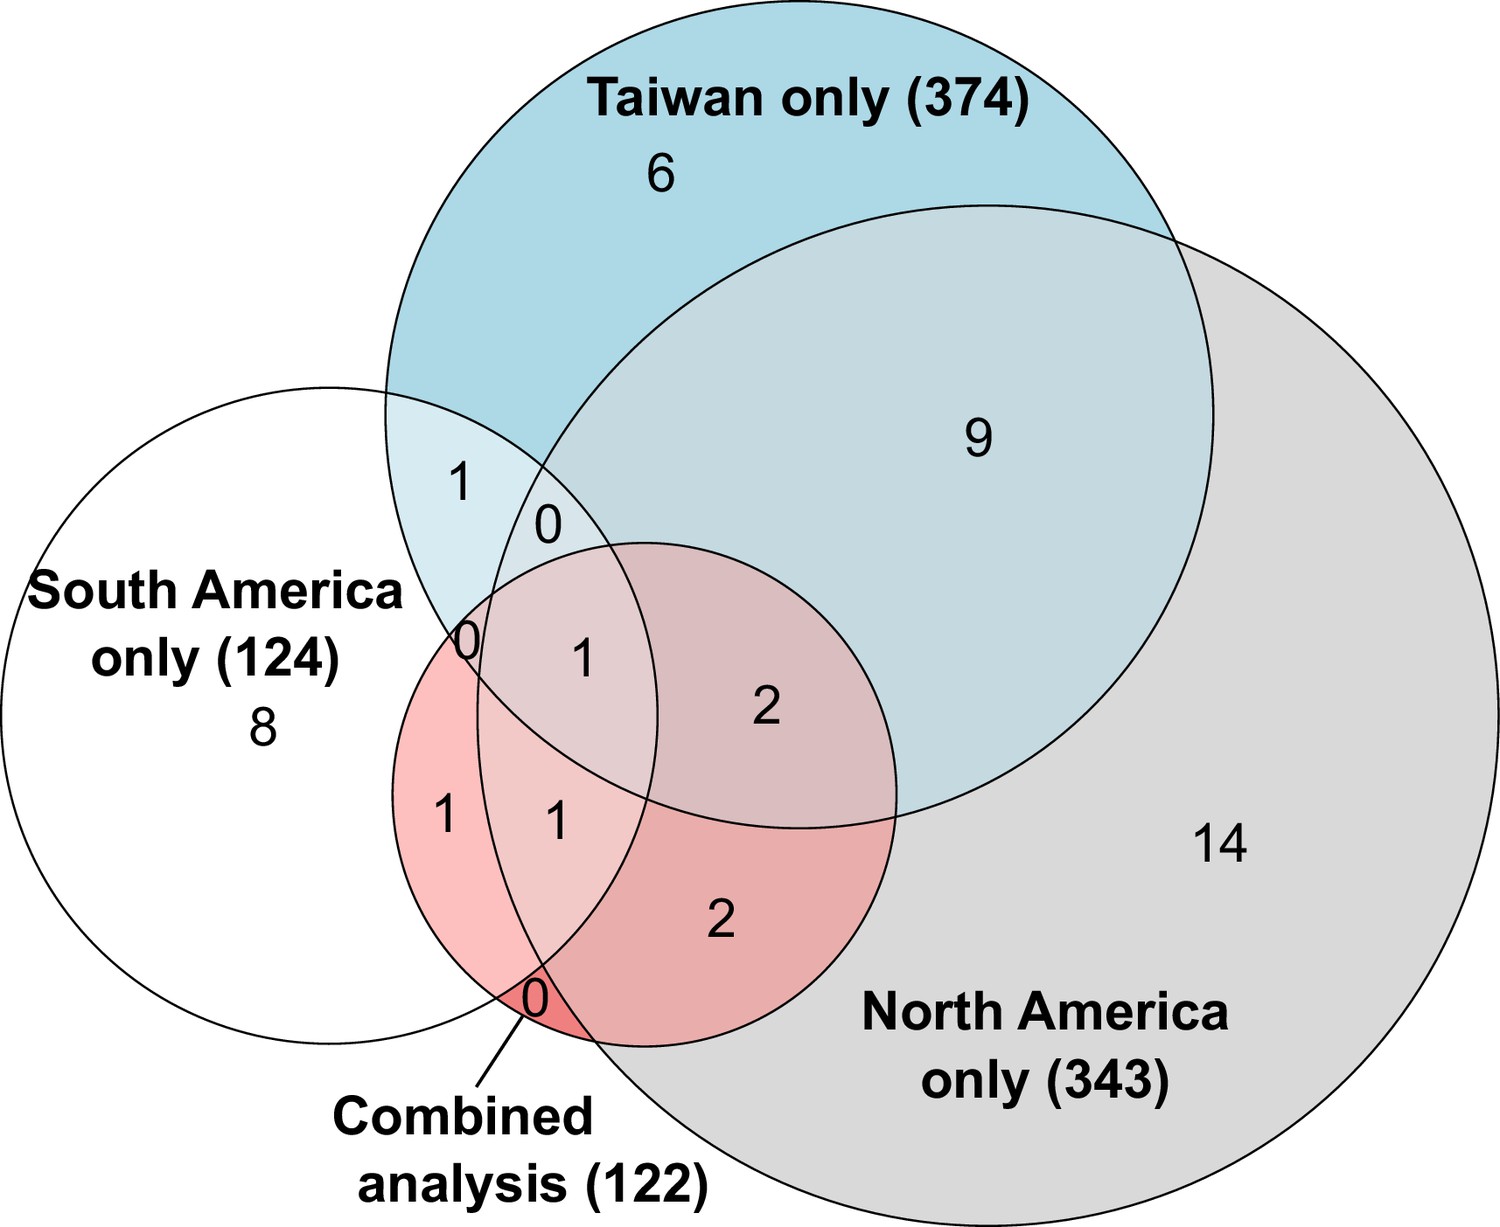
Overlapping number of genes with allele-specific expression according to comparisons in each population independently or after combining data from all populations.
The combined analysis detected seven genes with allele-specific expression across both populations, three of which were independently detected using only South American populations, six using only North American populations and three using only Taiwanese populations. The numbers in parentheses indicate how many genes analyzed in each comparison.
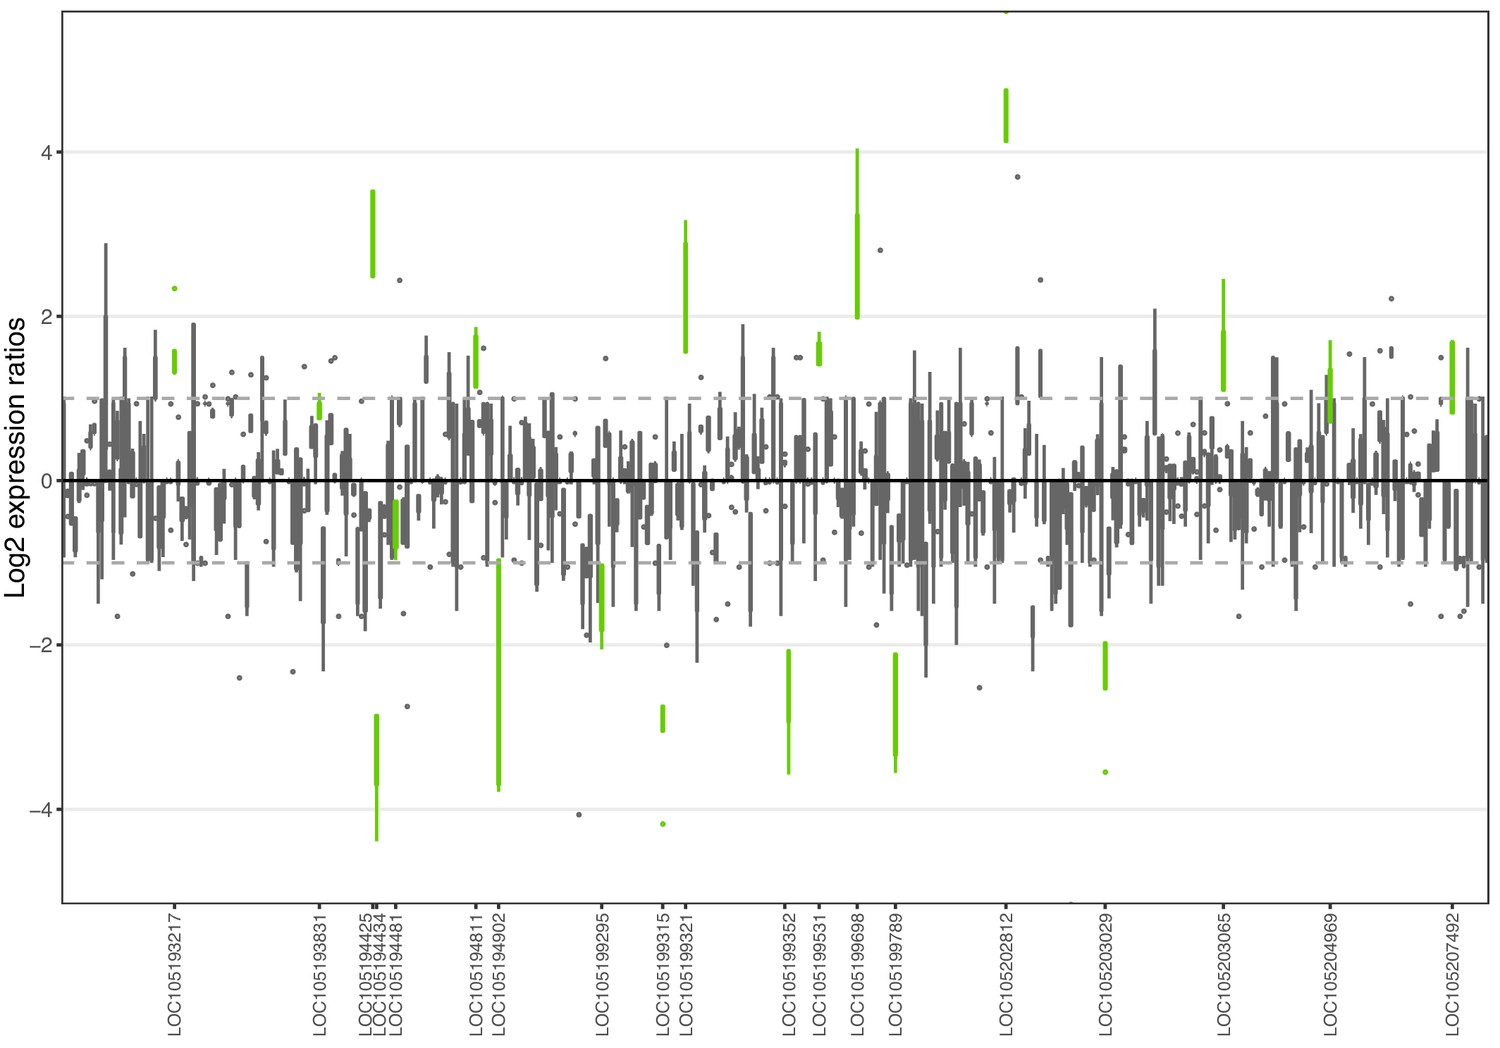
Figure 1—figure supplement 2
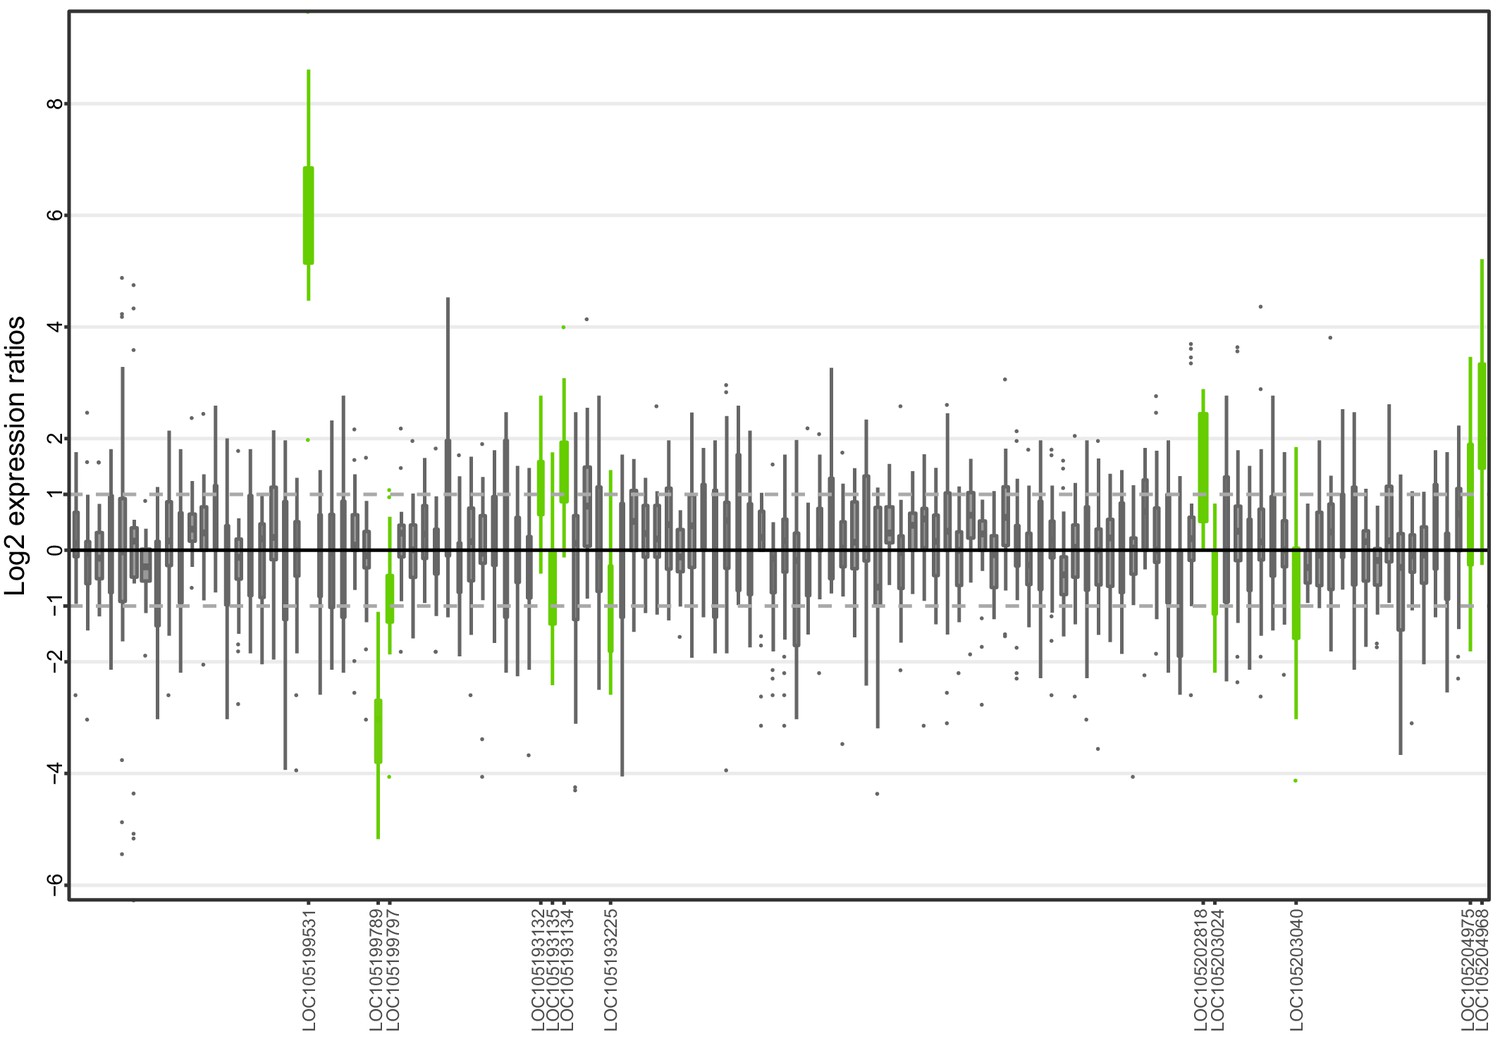
Allele-specific expression for genes in the fire ant social supergene for South American samples (information from body parts of queens and whole bodies of workers merged together).
Differences in allele-specific expression between variants (x axis) for all genes in the supergene with enough expression information (y axis). Significant expression differences (BH adjusted p<0.05 from Wald test in DESeq2) are indicated by green boxes and the RefSeq ID of the significant gene is outlined in the y axis. Non-significant differences are marked by grey boxes. Within each plot, each box shows the distribution of log2 expression ratios between SB and Sb. Positive values indicate higher expression in SB; negative values indicate higher expression in Sb. The dashed line shows log2 expression ratios = 1, that is a two-fold gene expression difference in either direction. Genes are in chromosomal order, showing that genes with allelic biases in either direction are distributed throughout the supergene, rather than localized in a manner that would be expected by strata of differentiation. Thicker boxes have higher median read counts than thinner boxes.
-
Figure 1—figure supplement 2—source data 1
Allele-specific expression for genes in the fire ant social supergene for South American samples.
The columns in the dataset stand for: refseq_id, gene ID in the RefSeq database; body_part, body part from which the RNA was extracted; median_expression, median DESeq2 normalized expression per gene across all samples per body part; mean_lfc, mean log2 fold changes between Sb and SB allelic expression per body part; sd_lfc, standard deviation of the log2 fold changes between Sb and SB allelic expression per body part; littleb_expression, DESeq2 normalised read counts for the Sb allele, bigB_expression, DESeq2 normalised read counts for the SB allele; sample_id, ID for the replicate; population, population of origin of the replicate, total_expression, combined SB Sb expression per gene per replicate; lfc_SB-Sb, log2 fold changes between SB and Sb DESeq2 normalized read counts; normalized_lfc, Z scores centered log2 fold changes between SB and Sb, the mean log2 fold change per body part is substracted from the log2 fold change per gene per replicate and divided by the standard deviation per body part; significant, whether a gene show significant differences in expression levels between Sb and SB according to either our linear mixed effects model or DESeq2's Wald test.
- https://cdn.elifesciences.org/articles/55862/elife-55862-fig1-figsupp2-data1-v2.csv
Figure 1—figure supplement 3
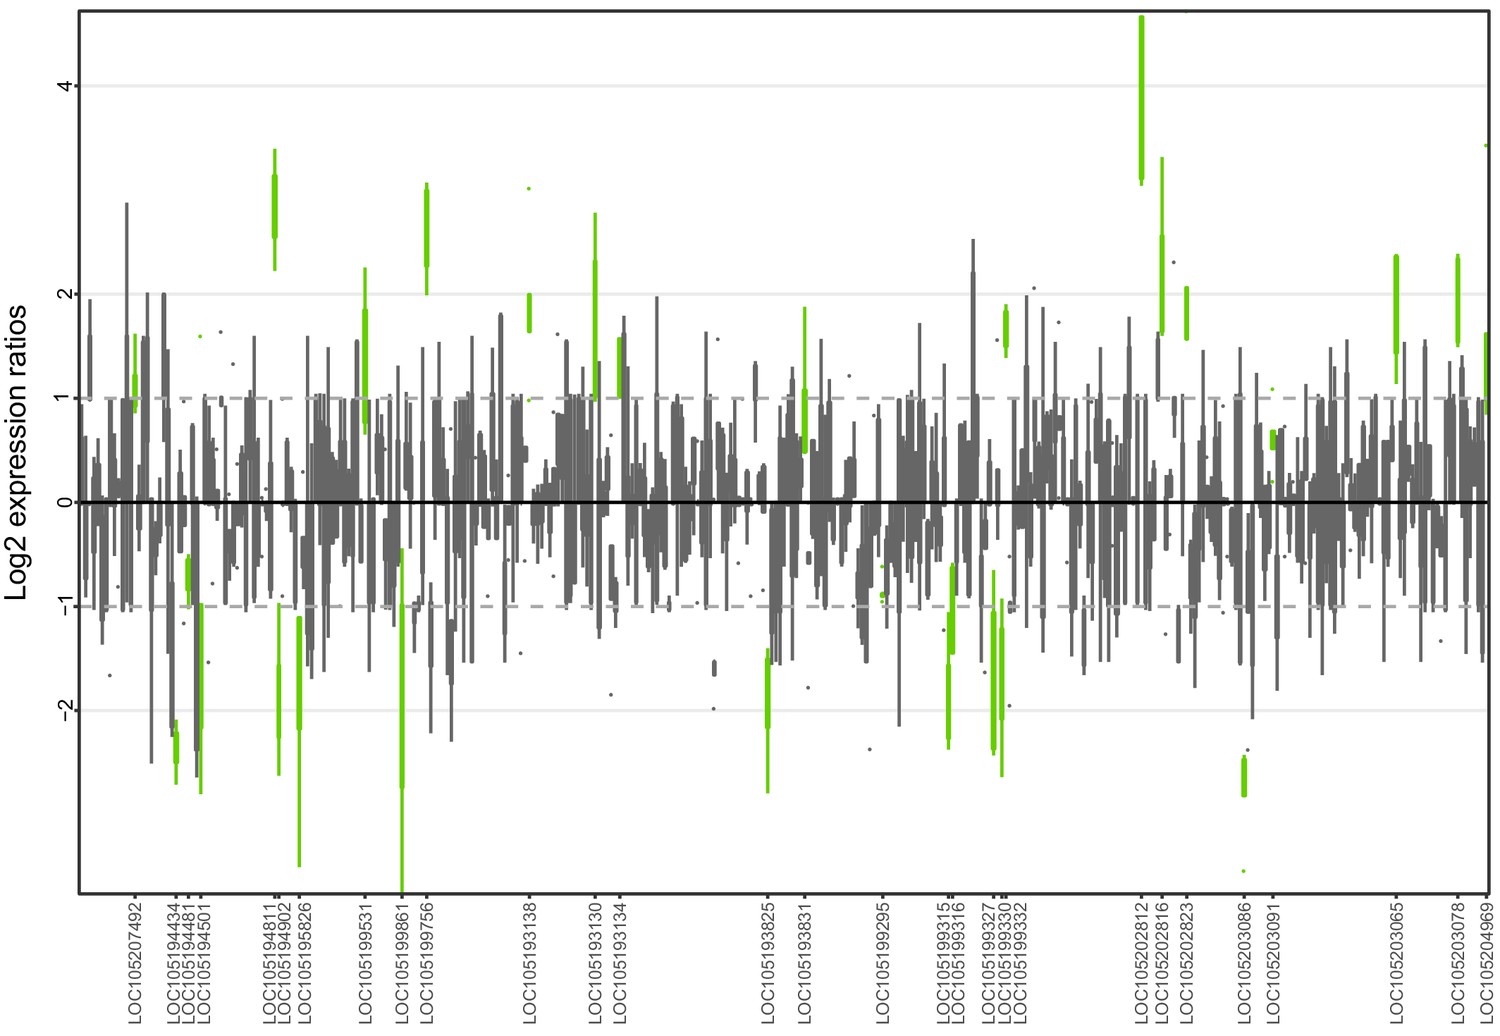
Allele-specific expression for genes in the fire ant social supergene for whole bodies of North American queens.
Differences in allele-specific expression between variants (x axis) for all genes in the supergene with enough expression information (y axis). Significant expression differences (BH adjusted p<0.05 from Wald test in DESeq2) are in green and the RefSeq ID of the significant gene is outlined in the y axis. Non-significant differences are in gray. Within each plot, each box shows the distribution of log2 expression ratios between SB and Sb. Positive values indicate higher expression in SB; negative values indicate higher expression in Sb. The dashed line shows log2 expression ratios = 1, that is a two-fold gene expression difference in either direction. Genes are in chromosomal order, showing that genes with allelic biases in either direction are distributed throughout the supergene, rather than localized in a manner that would be expected by strata of differentiation. Thicker boxes have higher median read counts than thinner boxes.
-
Figure 1—figure supplement 3—source data 1
Allele-specific expression for genes in the fire ant social supergene for whole bodies of North American queens.
The columns in the dataset stand for: refseq_id, gene ID in the RefSeq database; body_part, body part from which the RNA was extracted; median_expression, median DESeq2 normalized expression per gene across all samples per body part; littleb_expression, DESeq2 normalised read counts for the Sb allele, bigB_expression, DESeq2 normalised read counts for the SB allele; sample_id, ID for the replicate; population, population of origin of the replicate, total_expression, combined SB Sb expression per gene per replicate; lfc_SB-Sb, log2 fold changes between SB and Sb DESeq2 normalized read counts; significant, whether a gene show significant differences in expression levels between Sb and SB according to either our linear mixed effects model or DESeq2's Wald test.
- https://cdn.elifesciences.org/articles/55862/elife-55862-fig1-figsupp3-data1-v2.csv
Figure 1—figure supplement 4
Allele-specific expression for genes in the fire ant social supergene) for whole bodies of Taiwanese queens.
Differences in allele-specific expression between variants (x axis) for all genes in the supergene with enough expression information (y axis). Significant expression differences (BH adjusted p<0.05 from Wald test in DESeq2) are in green and the RefSeq ID of the significant gene is outlined in the y axis. Non-significant differences are in gray. Within each plot, each box shows the distribution of log2 expression ratios between SB and Sb. Positive values indicate higher expression in SB; negative values indicate higher expression in Sb. The dashed line shows log2 expression ratios = 1, that is a two-fold gene expression difference in either direction. Genes are in chromosomal order, showing that genes with allelic biases in either direction are distributed throughout the supergene, rather than localized in a manner that would be expected by strata of differentiation. Thicker boxes have higher median read counts than thinner boxes.
-
Figure 1—figure supplement 4—source data 1
Allele-specific expression for genes in the fire ant social supergene) for whole bodies of Taiwanese queens.
The columns in the dataset stand for: refseq_id, gene ID in the RefSeq database; body_part, body part from which the RNA was extracted; median_expression, median DESeq2 normalized expression per gene across all samples per body part; littleb_expression, DESeq2 normalised read counts for the Sb allele, bigB_expression, DESeq2 normalised read counts for the SB allele; sample_id, ID for the replicate; population, population of origin of the replicate, total_expression, combined SB Sb expression per gene per replicate; lfc_SB-Sb, log2 fold changes between SB and Sb DESeq2 normalized read counts; significant, whether a gene show significant differences in expression levels between Sb and SB according to either our linear mixed effects model or DESeq2's Wald test.
- https://cdn.elifesciences.org/articles/55862/elife-55862-fig1-figsupp4-data1-v2.csv
Figure 1—figure supplement 5
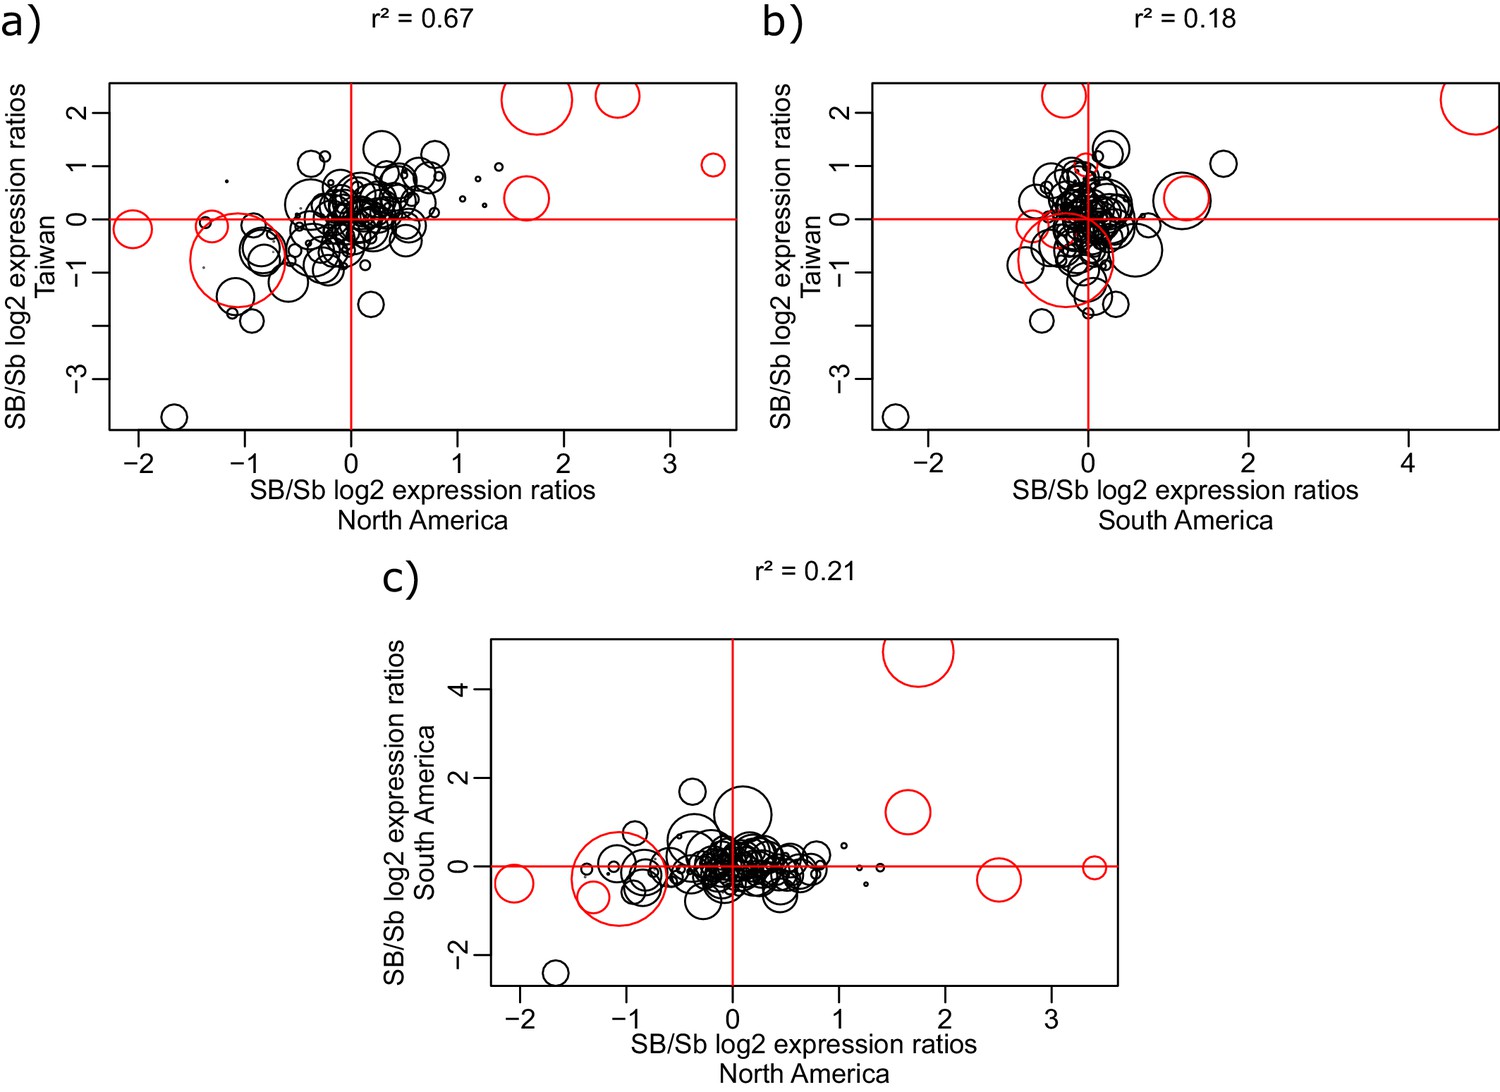
Correlation of log2 allele-specific expression ratios between the SB and Sb variants in heterozygous queens from three populations: South American data we generated, North American data (from Morandin et al., 2016), and Taiwanese data (from Fontana et al., 2020).
We show correlations: (a) between Taiwanese and North American populations; (b) between Taiwanese and South American populations; and (c) between South American and North American populations. Positive values represent higher expression of the SB allele, negative values represent higher expression of the Sb allele. Each dot represents a single gene within the supergene region. The sizes of the dots are proportional to the average gene expression level. Red dots represent the genes detected by the linear mixed effects model as significantly differentially expressed between SB and Sb across populations. The correlation r2 between each pair of populations was calculated using the Spearman method, with each gene being weighted by mean expression level (read counts).
Figure 2
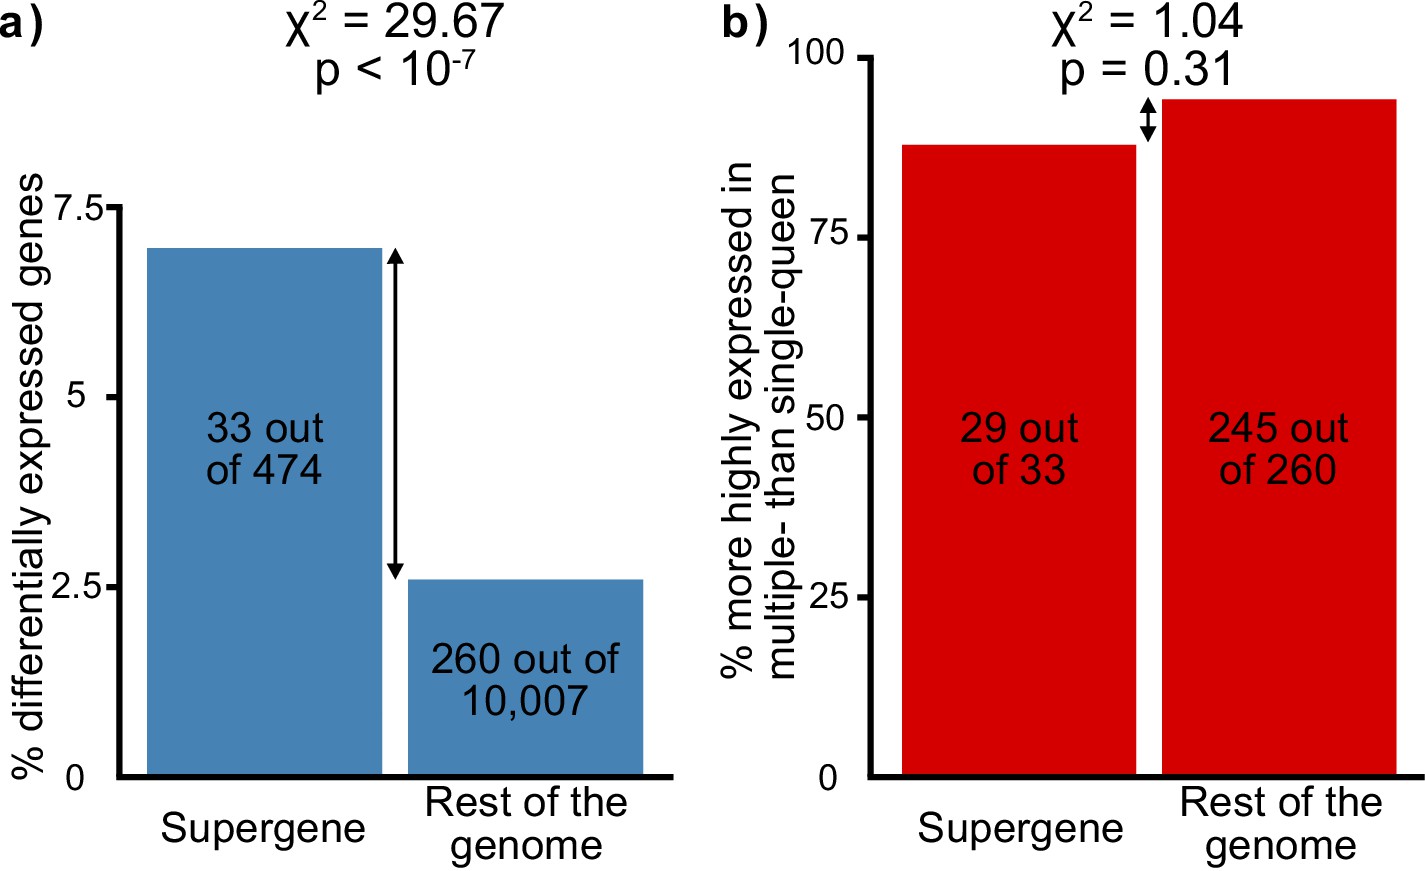
Distribution of socially biased genes in the genome of the red fire ant within (left bars) and outside (right bars) the supergene region.
(a) The supergene region is significantly enriched in genes with differences between social forms, a pattern that could indicate the effect of antagonistic selection. (b) Most genes with differential expression between social forms are more highly expressed in multiple-queen colonies. This expression bias is observed across the genome and is not a unique feature of the supergene.
-
Figure 2—source data 1
Genomic location of the analyzed genes in the Solenopsis invicta genome.
The columns in the dataset stand for: genome_region, whether the gene is located in the supergene ("supergene") or in the rest of the genome ("recombining"); gng_linkage_group, the linkage group for the gnG assembly of the Solenopsis invicta reference genome in which a gene is located; refseq_id, gene ID in the RefSeq database; social_bias, whether a gene shows differential expression between social forms according to DESeq2's Wald test (Benjamini Hochberg adjusted p value < 0.05); social_bias_direction, whether a gene is more highly expressed in multiple-queen colonies ("Poly"), single-queen colonies ("Mono") or not differentially expressed ("Non-diff").
- https://cdn.elifesciences.org/articles/55862/elife-55862-fig2-data1-v2.csv
Figure 3 with 1 supplement
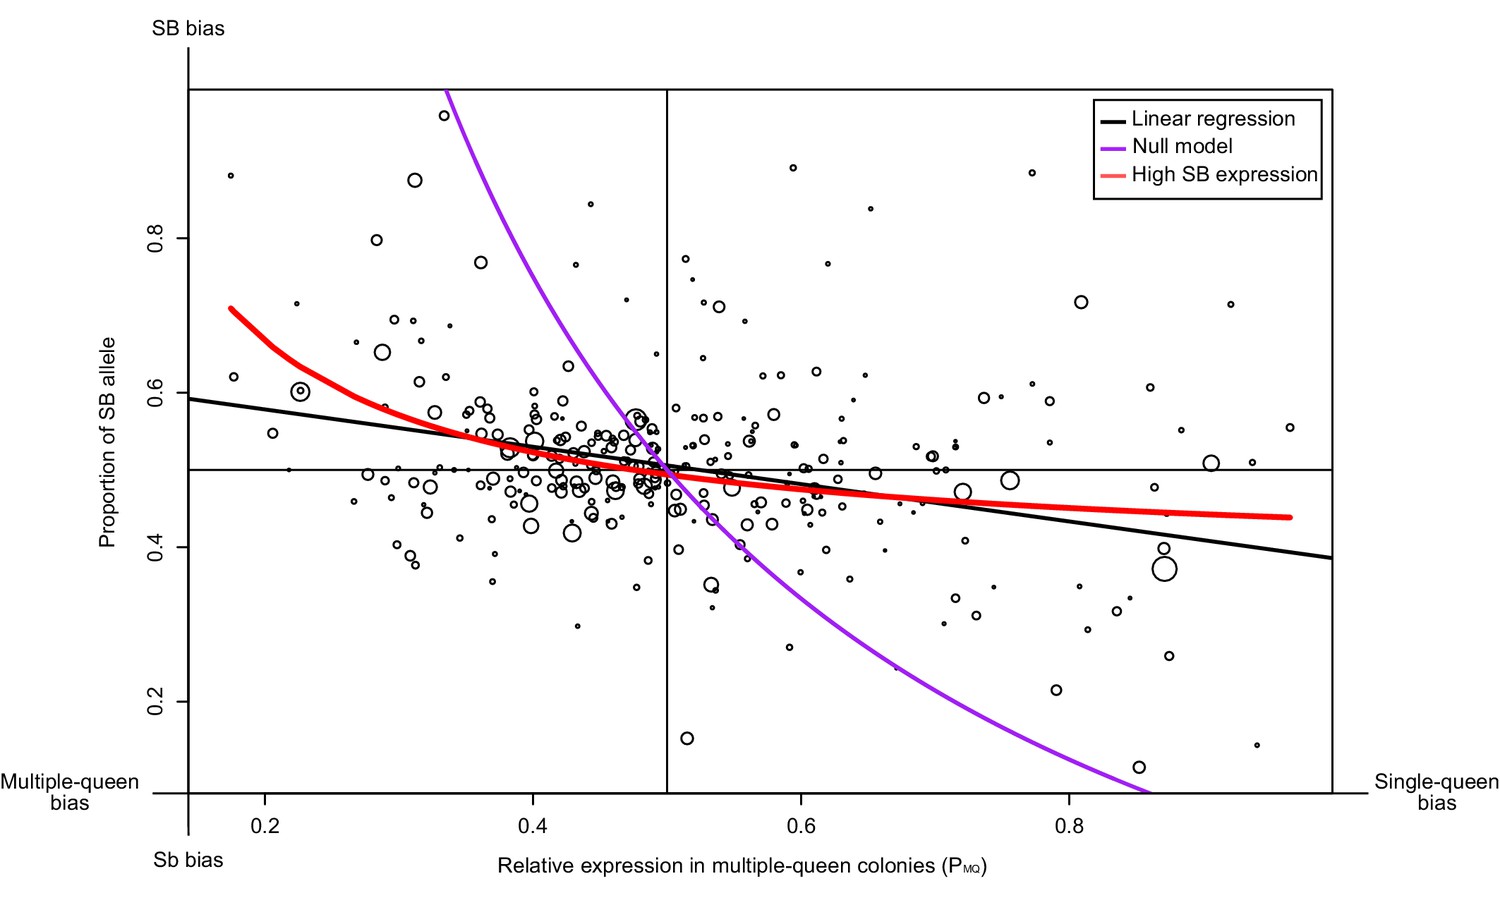
Relationship between measures of bias in allelic expression (PB) and between social forms (PMQ).
Each point is one of 294 genes within the supergene (North American data). Point size is proportional to the mean expression in queens from multiple-queen colonies. The values were calculated as PB = xB/(xB + xb) and PMQ = xMQ/(xSQ + xMQ); where xB and xb are the expression of SB and Sb alleles, and xSQ and xMQ are the expression in single-queen and multiple-queen colonies. Values of PB below 0.5 therefore indicate higher expression in SB/SB queens from single-queen colonies; values above 0.5 indicate higher expression in SB/Sb queens from multiple-queen colonies. Values of PMQ above 0.5 indicate allelic bias towards SB; values below 0.5 indicate bias towards Sb. The straight black line shows a linear regression. The purple line shows the predicted null relationship if the pattern of expression was due to Sb degeneration alone PMQ = (1/ (2PB+1)). This model is a poor predictor of the data. The red line assumes gene-specific dosage compensation, where a decrease in expression of Sb leads to increased SB expression PB=(1-(PMQ/2))/PMQ. The model including dosage compensation fits the data better than the null model; both models are significantly different (analysis of variance between models p<10−5). The observed enrichment of multiple-queen genes in Sb is therefore unlikely due to Sb degeneration alone.
-
Figure 3—source data 1
Social and allelic bias for genes in the supergene.
The columns in the dataset stand for: gene, RefSeq gene ID for each gene; lfcs_ase, log2 fold changes between SB and Sb estimated by DESeq2; lfcs_social_form, log2 fold changes between multiple-queen and single-queen colonies estimated by DESeq2; mean_reads_ase, mean expression across all samples per gene for the allele specific expression analysis; mean_reads_social_form, mean expression across all samples per gene for the social form differences expression analysis.
- https://cdn.elifesciences.org/articles/55862/elife-55862-fig3-data1-v2.csv
Figure 3—figure supplement 1
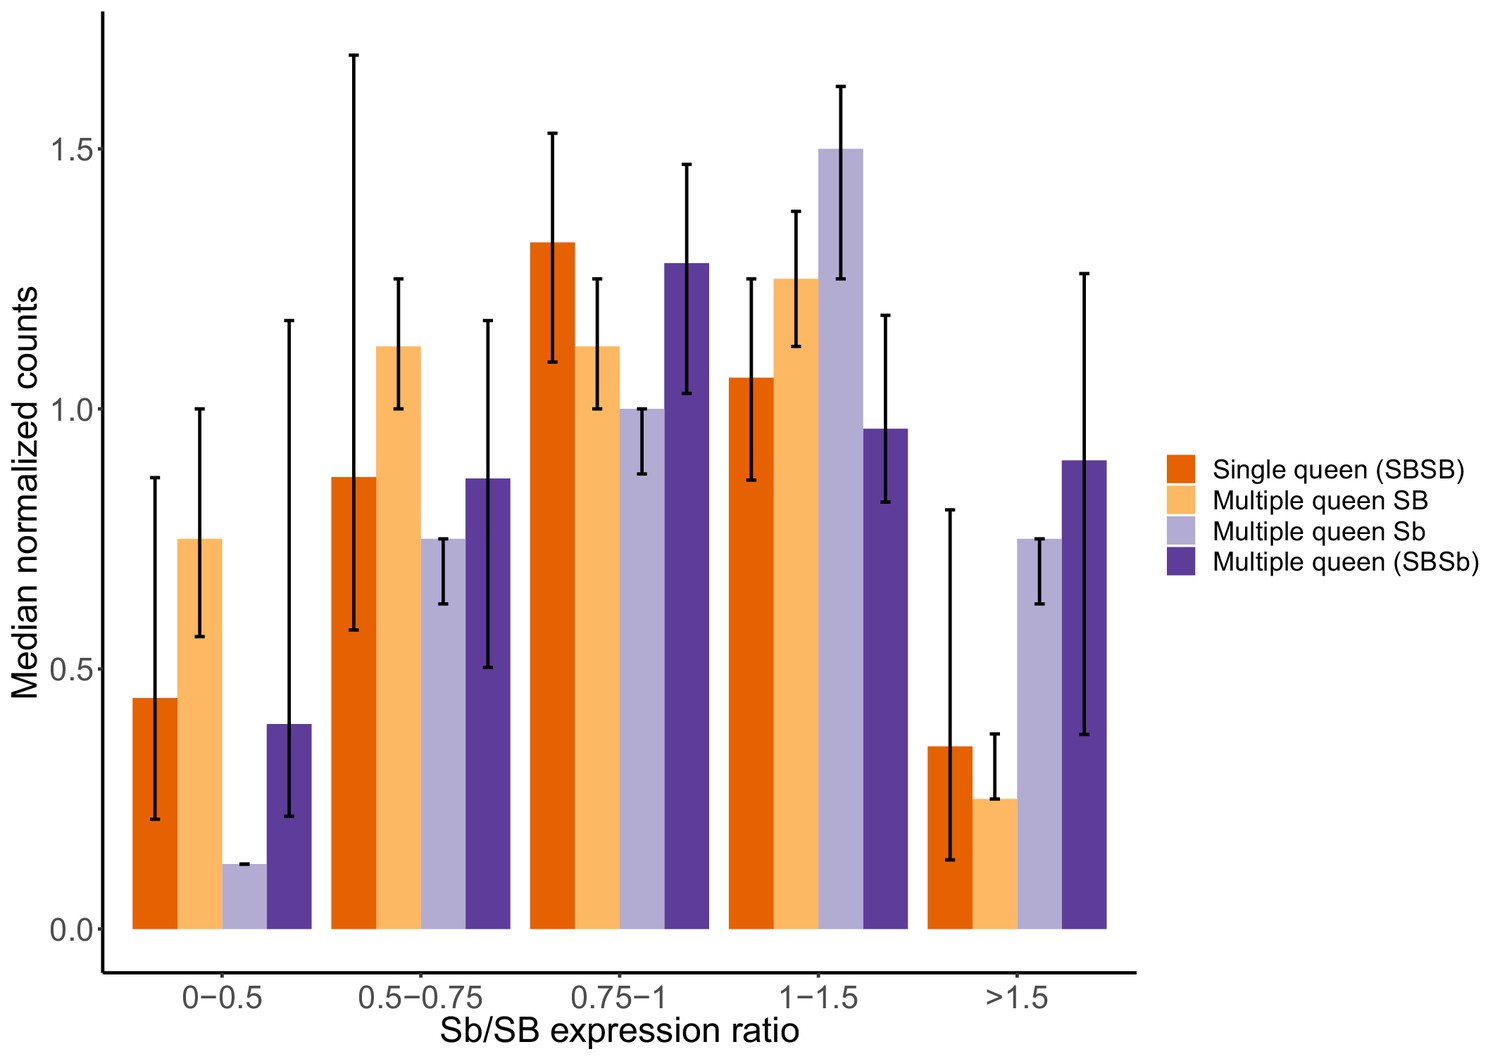
Gene expression levels in single-queen and multiple-queen individuals for different levels of SB and Sb expression levels in multiple-queens.
The plot represents the overall expression levels for all genes analyzed in the supergene for which there was allele-specific and social form expression data in North American populations. To account for the potential effects of antagonistic selection, nine genes with significant expression biases towards Sb or with high SB expression in multiple-queen colonies were removed. As a result, 193 genes in total were included in this analysis. Each bar represents the median normalized expression within group, the error bars are the 95% CI interval around the median (estimated from a 5000x median bootstrapping). The expression levels within each expression group (Single-queens, multiple-queens, SB and Sb expression) is normalized by the total number of reads in that group. This normalization allows the comparison across different datasets with different levels. The differences in expression between single-queen and multiple-queen individuals remain non-significant (Wilcox test p>0.05) across varying levels of SB-Sb expression differences. Only when Sb expression is much higher than SB expression (Sb/SB expression ratio >1.5) does it seem to be an increase in gene expression for multiple-queen individuals, but the difference between social forms remained non-significant (Wilcox test p=0.08). Without dosage compensation, we would expect that allelic bias would invariably result in changes in expression between social forms: As the allelic expression levels of SB increases, we would observe an increase in expression of single-queen colonies. Instead, expression levels in single-queen and multiple-queen individuals remain similar. These results are therefore consistent with SB expression compensating for low Sb expression.
-
Figure 3—figure supplement 1—source data 1
Median gene expression levels in single-queen and multiple-queen individuals for different levels of SB and Sb expression levels in multiple-queens.
The columns in the dataset stand for: expression_group, the samples from which the expression levels were calculated, either whole body queen from multiple-queen colonies ("Poly"), whole body queen from single-queen colonies ("Mono"), SB allelic expression in multiple-queen colonies ("PolySB") or Sb allelic expresion in multiple-queen colonies ("PolySb"); Sb-SB_expression_category, the different levels in which we divided the Sb to SB allele expression levels ratio; median_expression, median raw expression levels per group per category; confidence_level, estimated median of normalized expression across groups and categories after bootstrapping (5000 bootstrap replicates); lower_median_ci, the lower confidence interval at 95% for the median; upper_median_ci, the upper confidence interval at 95% for the median.
- https://cdn.elifesciences.org/articles/55862/elife-55862-fig3-figsupp1-data1-v2.csv
Figure 4 with 2 supplements
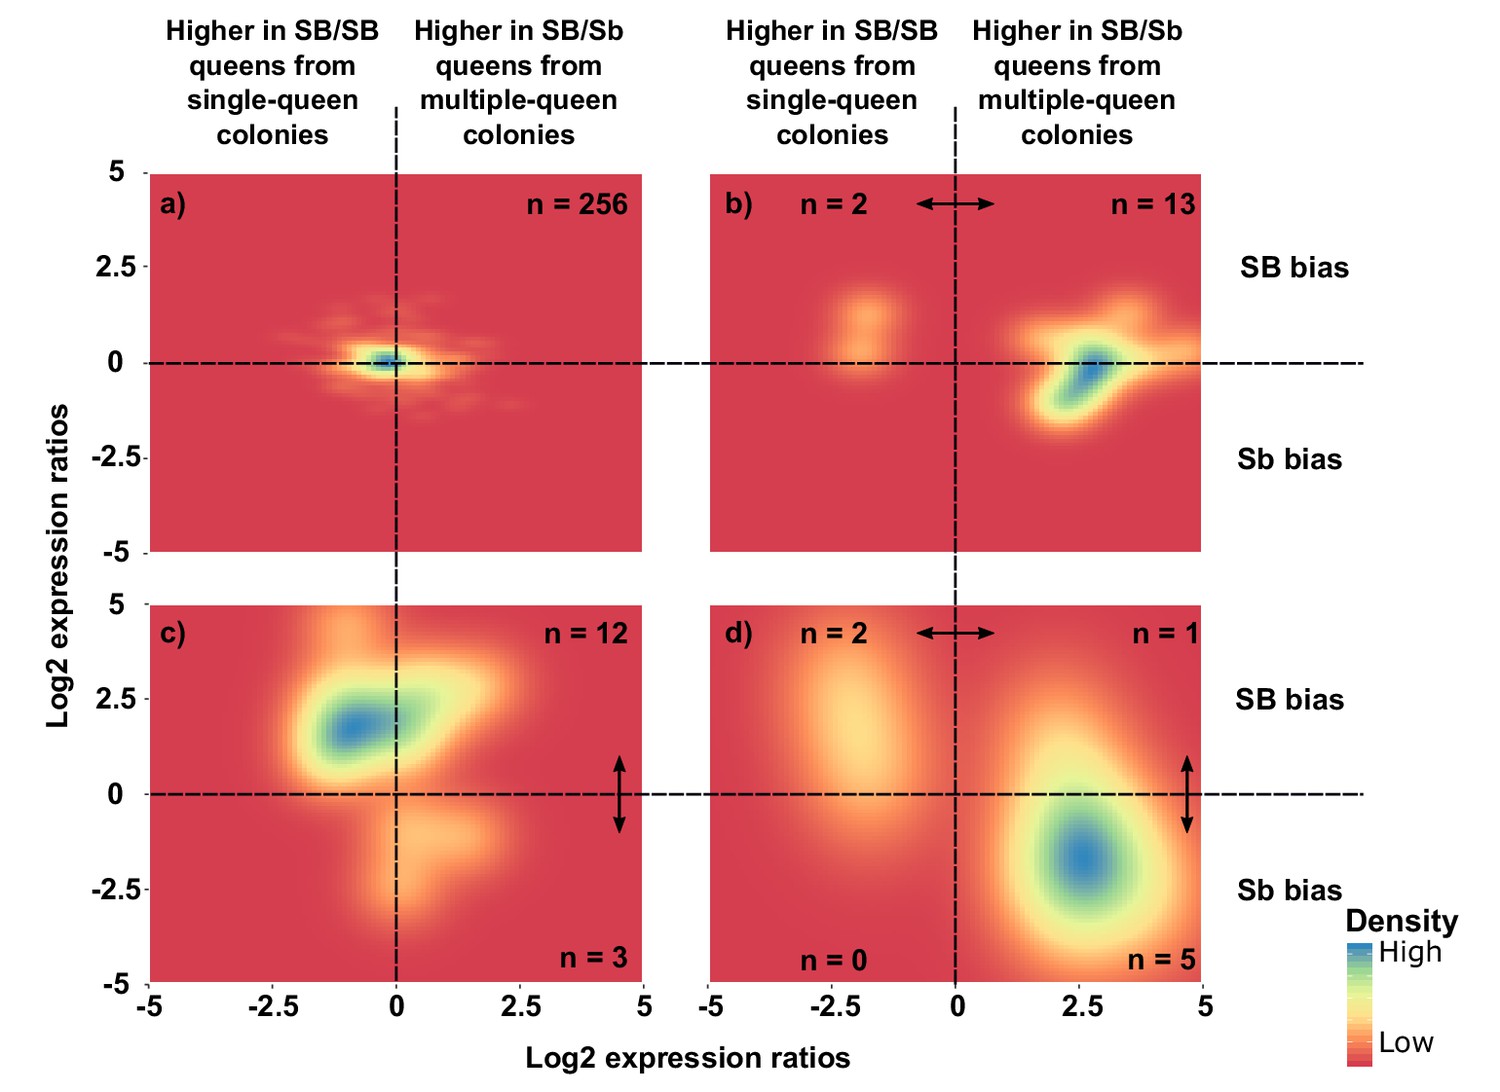
Distribution of differences in gene expression between social forms and between supergene alleles.
X axes indicate ratios of expression between SB/Sb queens and SB/SB queens. Y axes indicate allelic expression ratios in SB/Sb queens. Both ratios use a log2 scale whereby log2 = 0 indicates absence of differences. Colors are proportional to numbers of genes. Double-headed arrows indicate significant expression differences. Panel (a) shows expression patterns for genes showing no difference in either comparison. The remaining three panels summarize expression patterns for: (b) genes with significant expression differences between SB/Sb and SB/SB queens only – these are biased towards higher expression in multiple-queen colonies (13 multiple-queen vs. two single-queen, binomial test, p=0.007); (c) genes with significant expression differences only between SB and Sb alleles within SB/Sb individuals – these are biased towards higher expression in the SB variant, in line with a dosage compensation mechanism (12 SB vs. 3 Sb, binomial test, p=0.03); (d) genes with significant expression differences between SB/Sb and SB/SB queens and between the SB and Sb variants in SB/Sb queens – the genes with higher expression of the Sb allele (x > 0) tend to be more highly expressed in queens from multiple-queen colonies (y < 0), in line with evolutionary antagonism between social forms (5 out of 8 Sb biased genes with bias towards multiple-queen colonies, compared with 1 out of 15 for SB biased genes χ2 = 5.8, p=0.02). The numbers in a) indicate how many genes had no differential expression. In b), (c) and d) the numbers in each quadrant indicate how many genes were significantly differentially expressed in the relevant comparison.
-
Figure 4—source data 1
Expression differences between allele expression levels and between social forms for genes in the supergene.
The columns in the dataset stand for: gene_id, gene ID in the RefSeq database; lfcs_allele_bias, log2 fold changes between SB and Sb estimated by DESeq2; padj_allele_bias, Benjamini Hochberg adjusted p value obtained from DESeq2's Wald test for differences in expression levels between SB and Sb; lfcs_social_bias, log2 fold changes between multiple-queen and single-queen colonies estimated by DESeq2; padj_social_bias, Benjamini Hochberg adjusted p value obtained from DESeq2's Wald test for differences in expression levels between multiple-queen and single queen colonies.
- https://cdn.elifesciences.org/articles/55862/elife-55862-fig4-data1-v2.csv
Figure 4—figure supplement 1
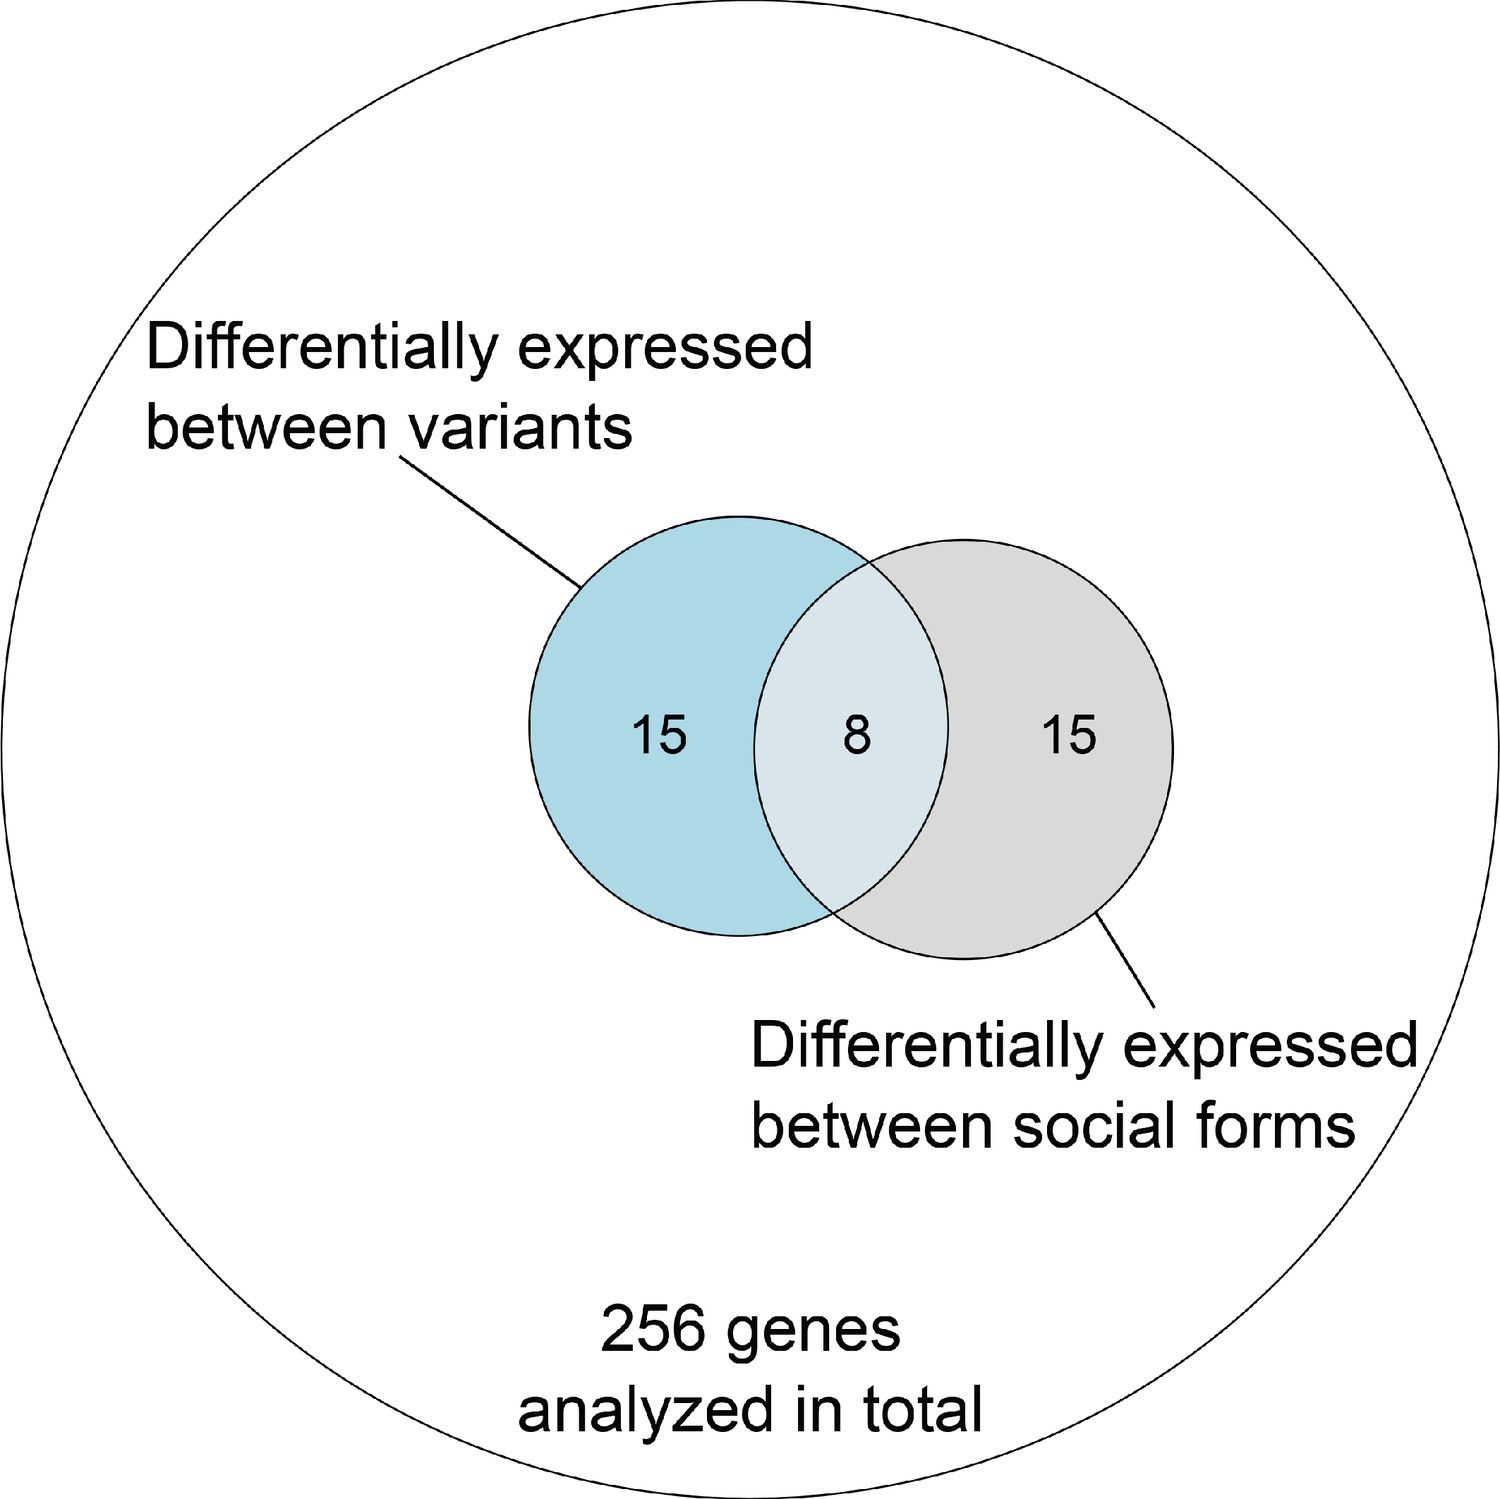
Overlap of genes with expression differences between variants and social forms out of all genes within the supergene region with sufficient data in both comparisons in the North American dataset.
Figure 4—figure supplement 2
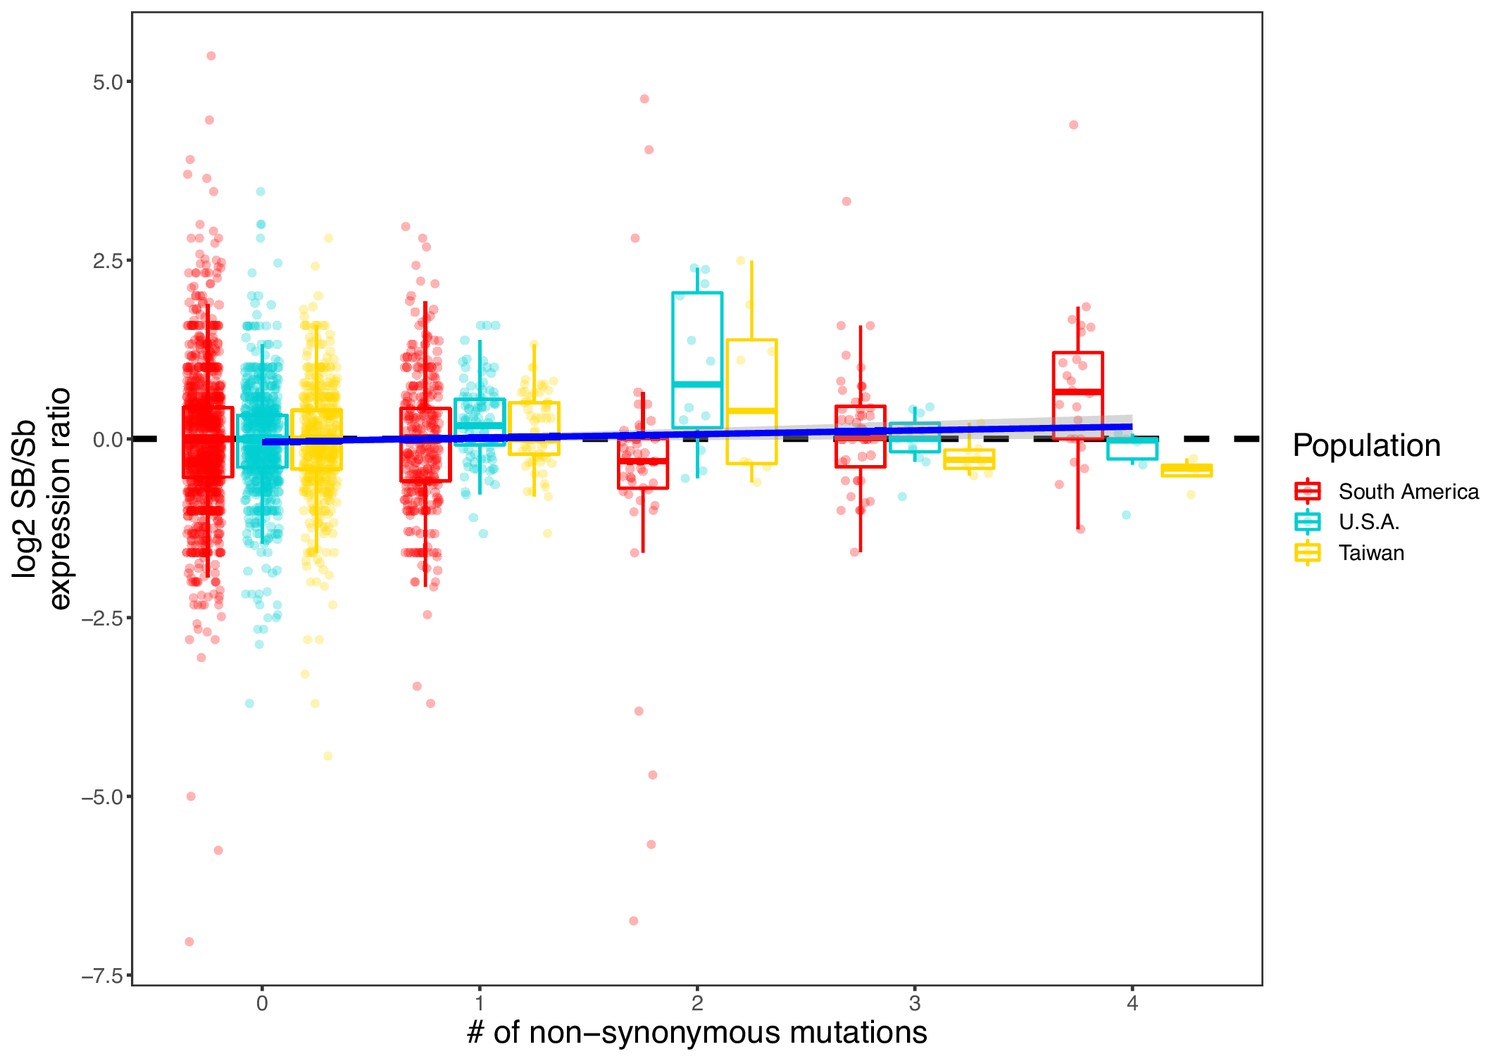
Allelic bias measured as the log2 ratio of expression between the SB and Sb alleles compared to the number of nonsynonymous mutations per gene.
Positive values indicate higher expression in SB; negative values indicate higher expression in Sb. Allelic expression bias was measured in all populations analyzed in this study: South America, U.S.A. and Taiwan. Each dot represents a gene from a sample in each population. Because genes with low expression result in noisy log2 ratios of expression, we excluded genes with a median expression of 5 reads or fewer). A linear regression (dark blue line, ‘log2 ratio’ ~ ‘Population’ + ‘Sample’ + ‘Number of nonsynonymous mutations’) shows that, overall, SB bias increases with the number of nonsynonymous mutations (coefficient = 0.052, p=0.01).
-
Figure 4—figure supplement 2—source data 1
Effect of non-synonymous mutations in the allelic bias between SB and Sb.
The columns in the dataset stand for: gene, gene ID in the RefSeq database, reads_b, raw read counts per gene per sample for the Sb allele; sample, replicate ID, population, population to which the replicate belongs; reads_B raw read counts per gene per sample for the SB allele; total_reads, combined SB and Sb expression per gene; median_expression, median read count per gene across all samples; lfc, log2 fold changes between SB and Sb expression levels; missense_muts, number of missense mutations, stop_gain_id, number of stop codon gain mutations; stop_loss_id, number of stop codon loss mutations; all_nonsyn_muts, total number of non-synonymous mutations.
- https://cdn.elifesciences.org/articles/55862/elife-55862-fig4-figsupp2-data1-v2.csv
Tables
Table 1
Summary of the hypotheses proposed in this study, the tests carried out to explore them, the data used and the results obtained.
| Underlying process | Hypothesis | Test | Expectation | Data | Result |
|---|---|---|---|---|---|
| Suppressed recombination | Allele bias is determined by the effects of genomic structure independently of function | Allele specific expression in the supergene remains constant across body parts/castes | Tissue-specific allele specific expression would suggest fine-tuning by selection for specific functions. A lack of allelic bias would be consistent with random changes in expression due to a random accumulation of mutations in Sb | RNAseq from three body parts of queens and whole bodies of workers from South American populations. Data generated in this study. | We find no tissue-specific differences in allelic bias (124 genes, four levels, DESeq2 Wald test > 0.05, Figure 1) |
| Allele specific expression differences within the supergene should be highly correlated between closely related populations | Highly correlated supergene expression patterns between closely related populations would indicate that most expression differences between variants depend on the genomic content, rather than on function. Alternatively, if most expression patterns are driven by function, gene expression differences between supergene variants should be consistent across different populations, irrespective of ancestry. | RNAseq from SBSb queens from populations in the invasive range of North America and Taiwan and the native range of South America. North American and Taiwanese populations are closely related. Data generated in this study and from Wurm et al., 2011 and Fontana et al., 2020. | North American and Taiwanese expression patterns within the supergene are highly correlated (r²=0.67). Correlation between South American and the invasive populations is lower (r²=0.21 and 0.18 for North America-South American and Taiwan-South America respectively). Figure 1—figure supplement 5. | ||
| Some genes will show signs of dosage compensation | Genes Sb alleles with a hallmark of past sequence degeneration are more likely to be biased towards SB | A positive correlation between the number of non-synonymous mutations in Sb and lower allelic expression would indicate gene degeneration. | RNAseq from SBSb queens from populations in the invasive range of North America and Taiwan and the native range of South America. Data generated in this study and from Wurm et al., 2011 and Fontana et al., 2020. | SB bias increases with the number of non-synonymous mutations in Sb. Figure 4—figure supplement 2 | |
| We should find genes with a strong allelic bias towards the SB allele, but with no expression differences between social forms | In some genes, deleterious mutations in Sb leading to lowered expression of this allele should result in an increased expression of the SB allele to reach balanced expression, resulting in similar expression levels between multiple-queen (SB/Sb) and single-queen (SB/SB) individuals. Alternatively, low expression of the Sb allele will invariably lead to low expression of multiple-queen individuals. | RNAseq from North American SBSb and SBSB queens. Data from Wurm et al., 2011 and Fontana et al., 2020. | The patterns of expression differences between social forms in the social chromosome cannot be explained only by the observed allelic biases. A model allowing for dosage compensation fits the data best (294 genes, Figure 3). Differences in gene expression between social forms does not vary with varying levels of allelic bias (193 genes, Figure 3—figure supplement 1). Most genes with a strong SB bias are not differentially expressed between SBSb and SBSB queens (12 out of 15, binomial test p=0.03, Figure 4c) | ||
| Antagonistic selection | Selection favors the linkage of antagonistic alleles to the supergene | The supergene region should be enriched in genes with differences between social forms | Selection would favor the linkage to the supergene of genes with different expression optima for the different social forms. This would result in more genes with socially biased expression than expected by chance in the supergene. If selection does not play a major role in supergene expression patterns, socially biased genes will be equally spread throughout the genome. | RNAseq from North American SBSb and SBSB queens. Data from Wurm et al., 2011 and Fontana et al., 2020. | The supergene region contains more genes with expression differences between social forms than expected by chance (33 out of 474 in the supergene, 260 out of 10,007 in the rest of the genome, Chi² test p<10⁻⁷, Figure 2a). |
| Selection favors the fixation of alleles adapted to the multiple-queen form in the Sb variant | The Sb variant is enriched in genes high multiple-queen expression | If selection has favored the linkage to Sb of alleles beneficial to multiple-queen individuals, this variant should be enriched in genes highly expressed in this social form despite widespread degeneration. Alternatively, most Sb alleles are expected to be downregulated due to degeneration, and consequently Sb should be enriched in genes with low expression in multiple-queen colonies. | RNAseq from North American SBSb and SBSB queens. Data from Wurm et al., 2011 and Fontana et al., 2020. | Genes with Sb bias tend to show higher multiple-queen expression (5 out of 8, compared with 1 out of 15 for SB, Chi² test p=0.02, Figure 4d). This pattern is unlikely to be neutral due to widespread gene degeneration (Figure 3) and given that social bias patterns are similar within the supergene and in the rest of the genome (29 out of 33 genes with multiple queen bias in the supergene compared with 245 out of 260 in the rest of the genome, Chi² test p=0.31, Figure 2b). |
Key resources table
| Reagent type (species) or resource | Designation | Source or reference | Identifiers | Additional information |
|---|---|---|---|---|
| Biological sample (Solenopsis invicta) | Fire ants | Argentina | NCBI taxonomy 13686 | |
| Chemical compound, drug | Tri Reagent | Sigma-Aldrich | MFCD00213058 | DNA/RNA extraction |
| Commercial assay, kit | NEBNext Ultra II RNA Library Prep Kit | New England Biolabs | E7775L | |
| Commercial assay, kit | NEB Library Quant Kit | New England Biolabs | E7630 |
Additional files
-
Supplementary file 1
Single nucleotide polymorphisms (SNPs) with fixed differences between the SB and Sb variant in present in both North and South American populations of red fire ant.
The columns show, from left to right: the scaffold in the reference genome of the fire ant (version gnG; RefSeq GCF_000188075.1) where the SNP is located, its position within the scaffold, the allele present in all SB males (reference allele), the allele present in all Sb males (alternative allele), the position within the gene were the SNP is located, the gene (or genes) that could be potentially affected by the SNP and the potential effect of the SNP in Sb: ‘HIGH’ implies a change that substantially alters protein sequence (e.g., an early stop codon), ‘MODERATE’ implies a change affecting protein sequence, but without necessarily altering substantially protein structure (e.g., a non-synonymous mutation), ‘LOW’ implies a change with no effect on protein sequence (e.g., a synonymous mutation) and ‘MODIFIER’ are variants outside gene coding regions that could have potential regulatory effects. The last three columns of the table are based on the results from snpEff.
- https://cdn.elifesciences.org/articles/55862/elife-55862-supp1-v2.xlsx
-
Supplementary file 2
Names and RefSeq identifiers of the seven genes that are significantly differentially expressed between the SB and Sb variants of the S. invicta supergene.
The significance levels were determined using a linear mixed effect models on the log2 expression ratios between SB and Sb. Population was used as a random effect and the log2 expression ratios were weighted by read count of the gene. The third column in the table shows whether that particular gene is also differentially expressed in the comparison between social forms (using Morandin et al., 2016 data), and if so, in which social form it is more highly expressed.
- https://cdn.elifesciences.org/articles/55862/elife-55862-supp2-v2.xlsx
-
Supplementary file 3
Genes with significant differential expression between the SB and Sb variants of the S. invicta supergene in a) South American, b) North American or c) Taiwanese populations.
Significance levels were determined by the Wald test in DESeq2. Significance was established as Benjamini and Hochberg corrected p<0.05. The columns in the tables show the names of the genes, their RefSeq identifiers, their log2 expression ratios for allele-specific expression differences between variants (values greater than 0 are more highly expressed in SB) and in which variant they are more highly expressed.
- https://cdn.elifesciences.org/articles/55862/elife-55862-supp3-v2.xlsx
-
Supplementary file 4
Genes with significant differential expression between queens from single-queen and multiple-queen colonies of S. invicta from North American populations (data from Morandin et al., 2016).
Significance levels were determined by the Wald test in DESeq2. Significance was established as Benjamini and Hochberg corrected p<0.05. The columns in the tables show the names of the genes, their RefSeq identifiers, their log2 expression ratios for gene expression differences between social forms (values greater than 0 are more highly expressed in queens from multiple-queen colonies) and in which social form they are more highly expressed. Locations in the supergene are based on the data from Pracana, Rodrigo, et al. Molecular ecology 26.11 (2017): 2864–2879.
- https://cdn.elifesciences.org/articles/55862/elife-55862-supp4-v2.xlsx
-
Supplementary file 5
Overview of RNA-seq datasets used in this study.
(a) Accession numbers of the North American RNA-seq datasets. ‘Project’ and ‘SRA’ columns indicate NCBI identifiers. The descriptions provided and the sequencing method used are based on metadata available on NCBI and in the manuscripts. One sample (marked with an asterisk) was discarded because of very low coverage after aligning the reads to the S. invicta genome. b) Details for the South American RNAseq dataset. From left to right, the colony name from where samples were taken, the caste used from these colonies, the body parts extracted, the location of each colony in Argentina, the coordinates from where the sample was taken and finally, whether or not samples from the same colony were used to generate the VCF with fixed differences between Sb and SB.
- https://cdn.elifesciences.org/articles/55862/elife-55862-supp5-v2.xlsx
-
Supplementary file 6
Location of the colonies used to estimate single nucleotide polymorphisms (SNPs) between SB and Sb males.
Note that individuals from colonies AR102, AR111, AR112, AR114 and AR28 were also used to extract RNA for RNA sequencing.
- https://cdn.elifesciences.org/articles/55862/elife-55862-supp6-v2.xlsx
-
Transparent reporting form
- https://cdn.elifesciences.org/articles/55862/elife-55862-transrepform-v2.docx
Download links
A two-part list of links to download the article, or parts of the article, in various formats.
Downloads (link to download the article as PDF)
Open citations (links to open the citations from this article in various online reference manager services)
Cite this article (links to download the citations from this article in formats compatible with various reference manager tools)
Genomic architecture and evolutionary antagonism drive allelic expression bias in the social supergene of red fire ants
eLife 9:e55862.
https://doi.org/10.7554/eLife.55862


