Near-atomic structures of the BBSome reveal the basis for BBSome activation and binding to GPCR cargoes
- Laboratory of Molecular Electron Microscopy, The Rockefeller University, United States
- Department of Ophthalmology, University of California San Francisco, United States
- Department of Pharmaceutical Chemistry, Institute of Pharmaceutical Sciences, University of Graz and BioTechMed-Graz, Austria
Figures
Figure 1 with 2 supplements
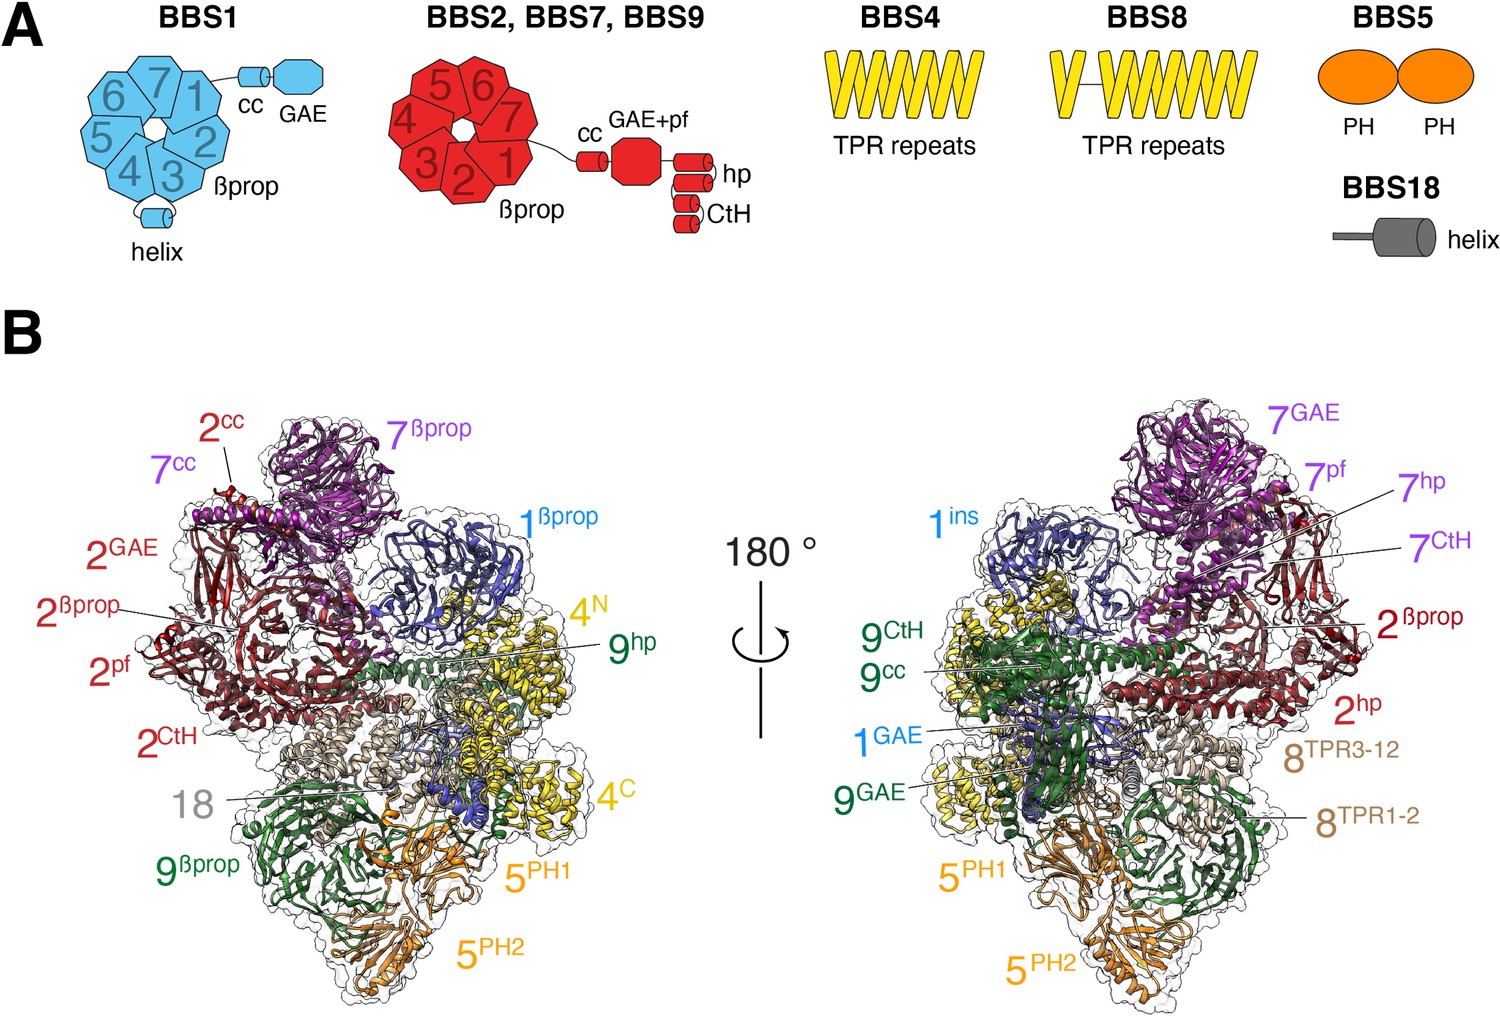
Overall structure of the BBSome.
(A) Diagrams showing the domain architecture of the eight BBSome subunits. βprop, β-propeller; cc, coiled coil; GAE, γ-adaptin ear; pf, platform; ins, insert; hp, hairpin; CtH, C-terminal helix bundle; TPR, tetratricopeptide repeat; PH, pleckstrin homology. (B) Two views of the cryo-EM map (transparent surface) and the near-atomic model of the BBSome complex shown in ribbon representation. Individual domains are labeled with the numbers identifying the subunit and the superscripts denoting the specific domain.
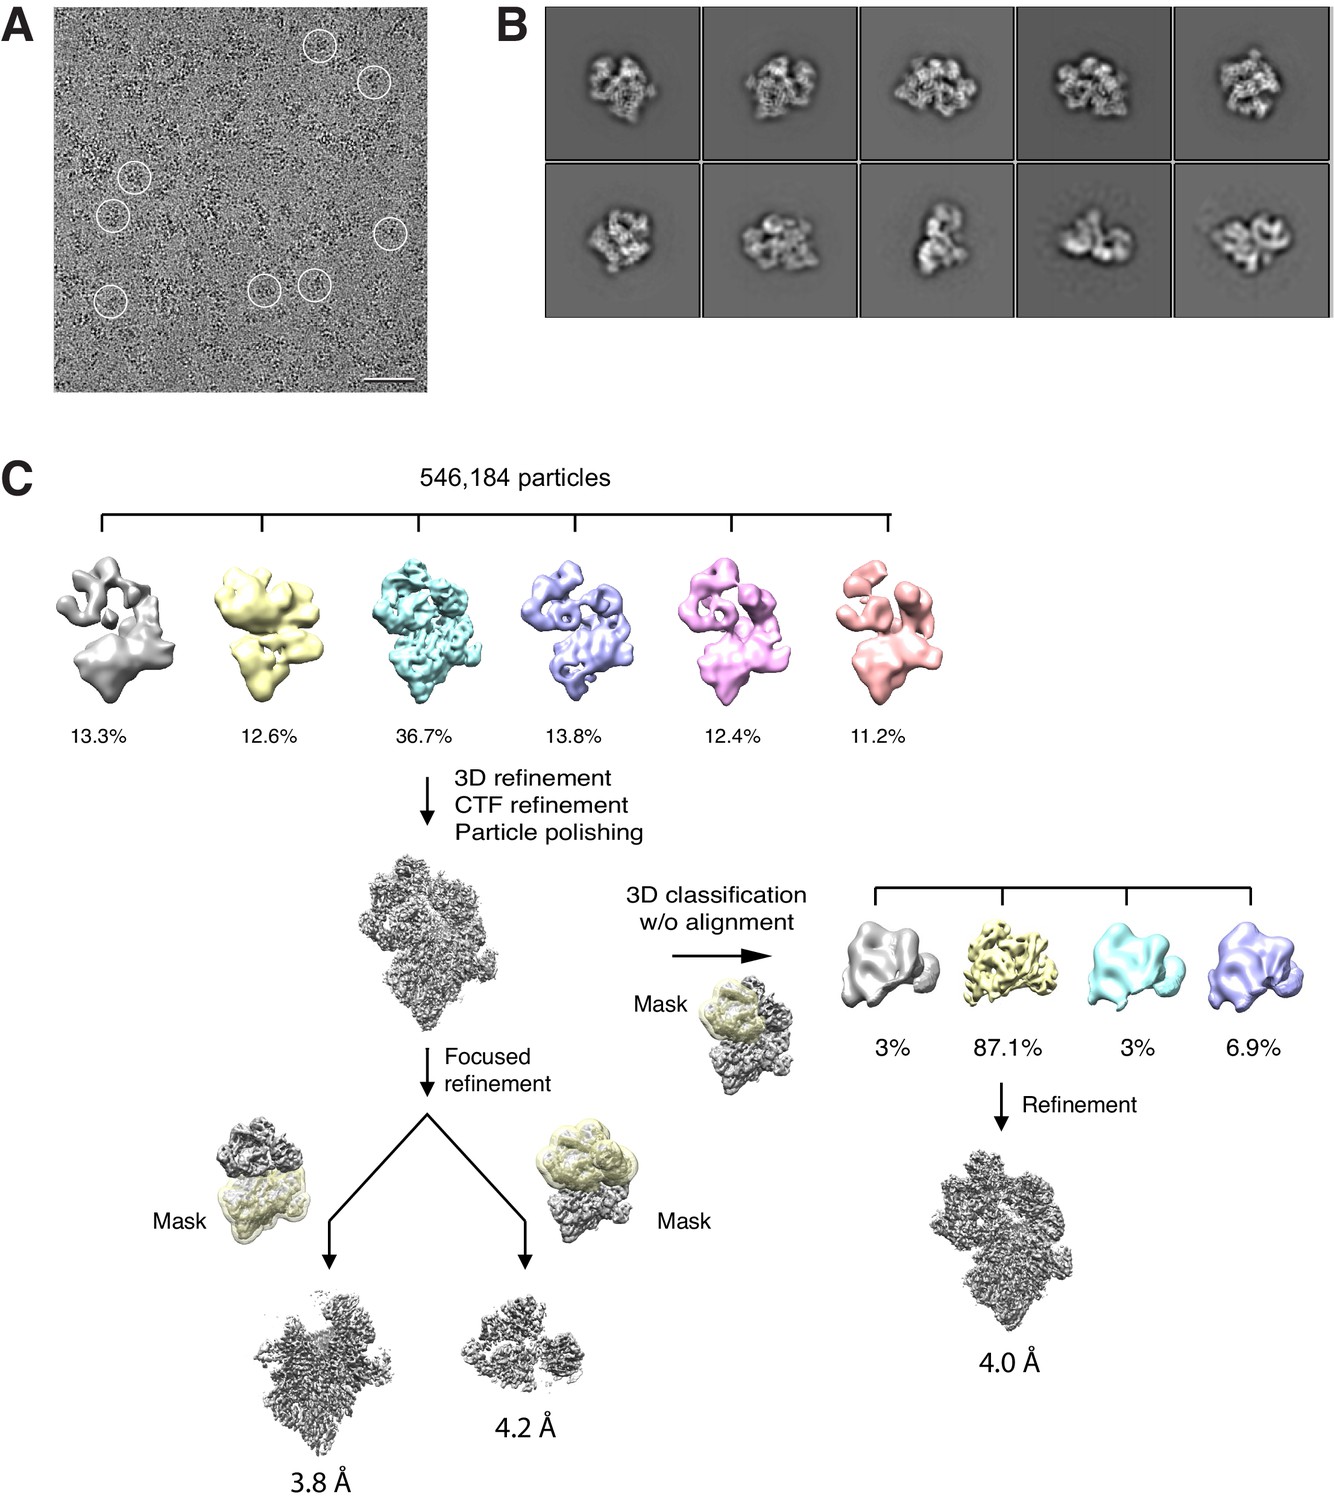
Figure 1—figure supplement 1
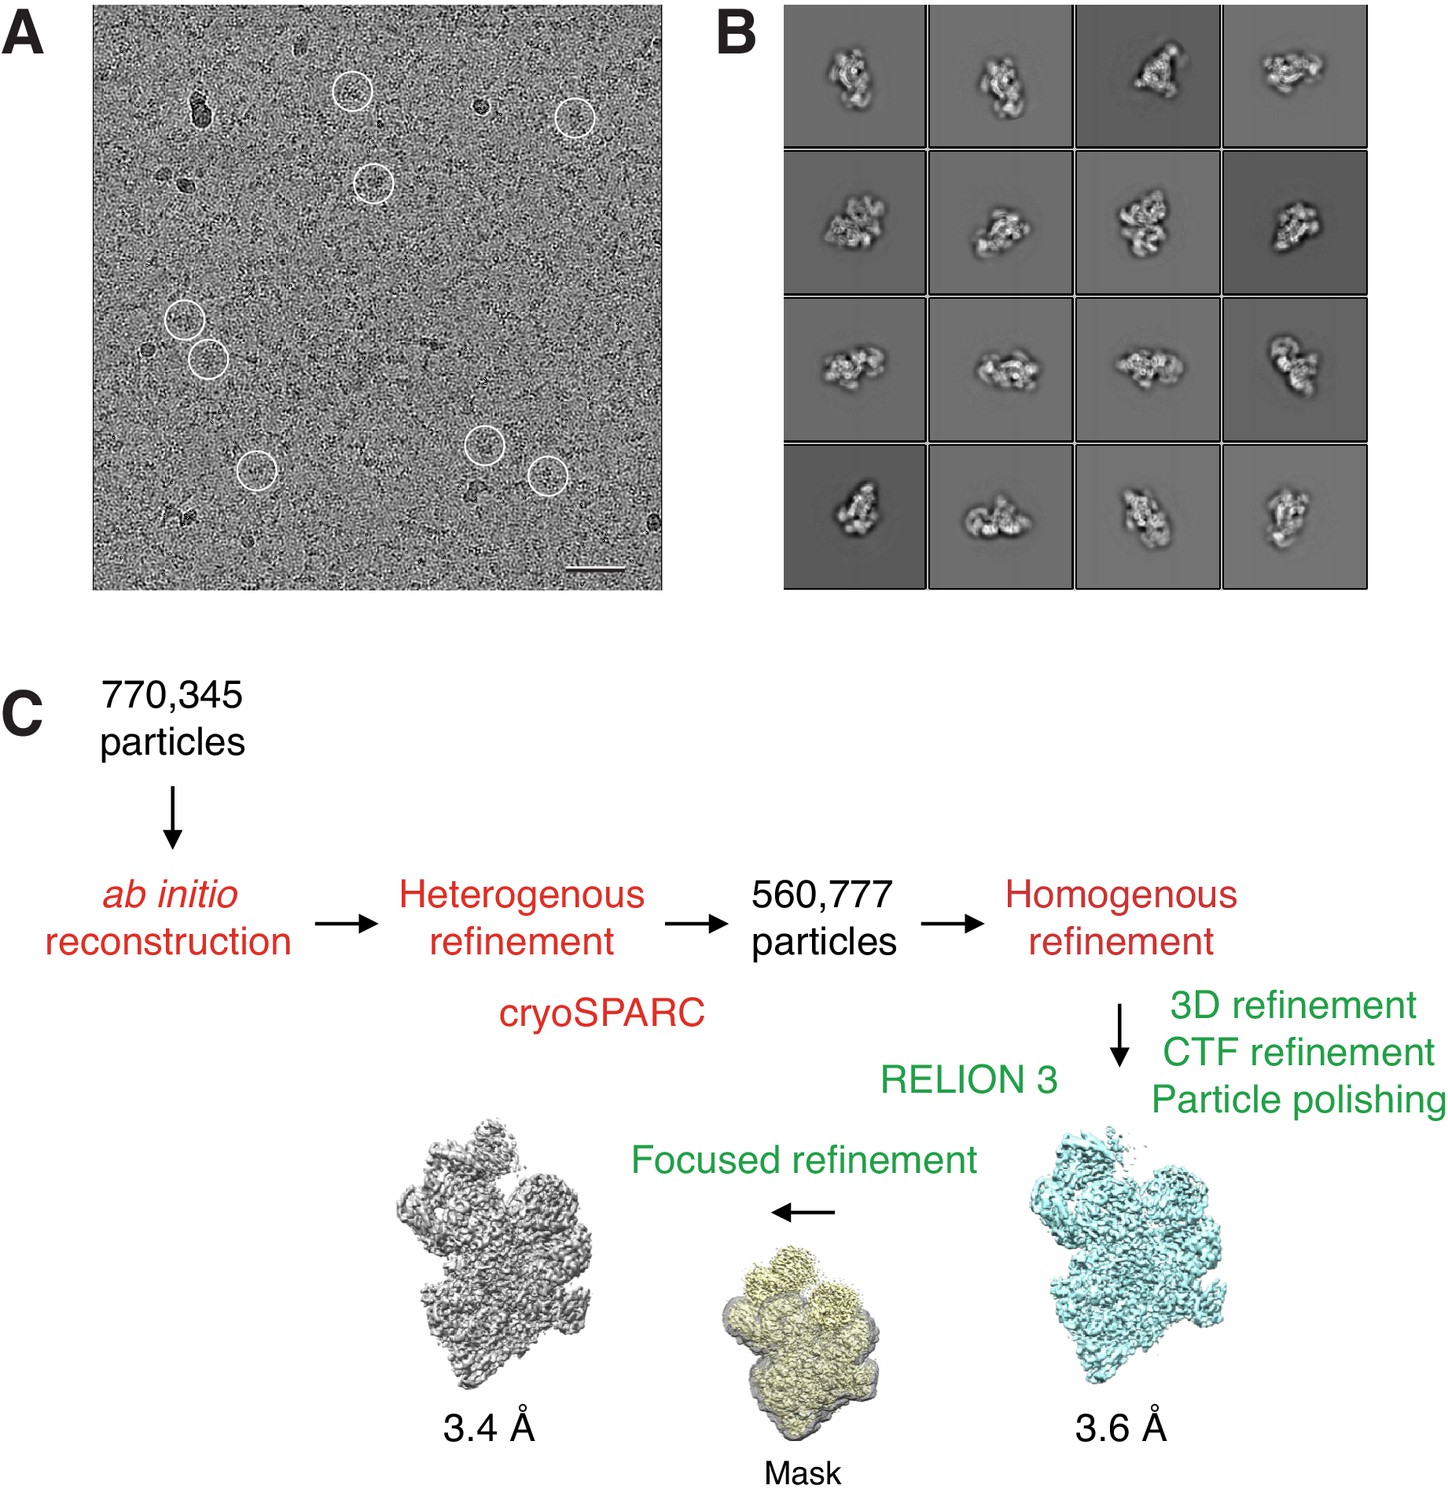
Cryo-EM analysis of the BBSome alone.
(A) Typical cryo-EM image of vitrified BBSome. Some particles are circled. Scale bar: 50 nm. (B) Selected 2D-class averages obtained with RELION 3.0. Side length of individual averages: 41.6 nm. (C) Image-processing workflow for 3D reconstruction and refinement in cryoSPARC and RELION 3.0. See Materials and methods section for details.
Figure 1—figure supplement 2
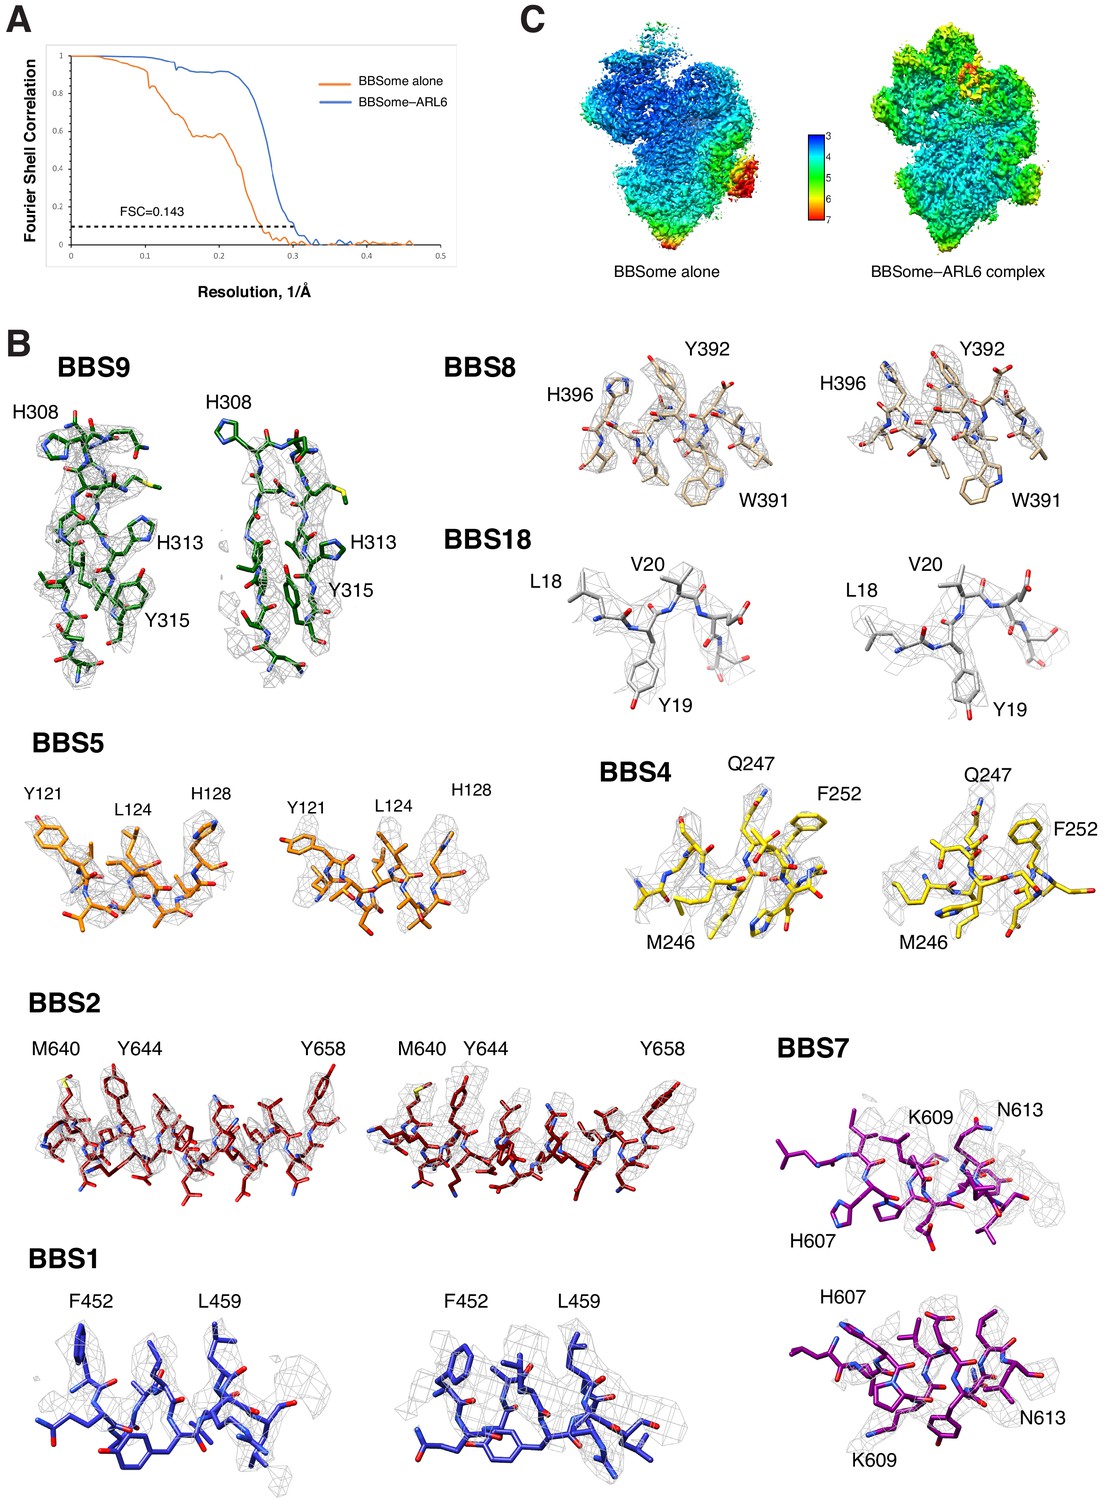
Quality assessment of the BBSome density maps.
(A) Fourier shell correlation curves calculated between independently refined half maps for the density maps of BBSome alone and the BBSome–ARL6GTP complex. (B) Local resolution for the density maps of BBSome alone and the BBSome–ARL6GTP complex as determined by using the ResMap algorithm included in RELION. (C) Representative cryo-EM densities for the maps of BBSome alone (left panels) and the BBSome–ARL6GTP complex (right panels).
Figure 2 with 1 supplement
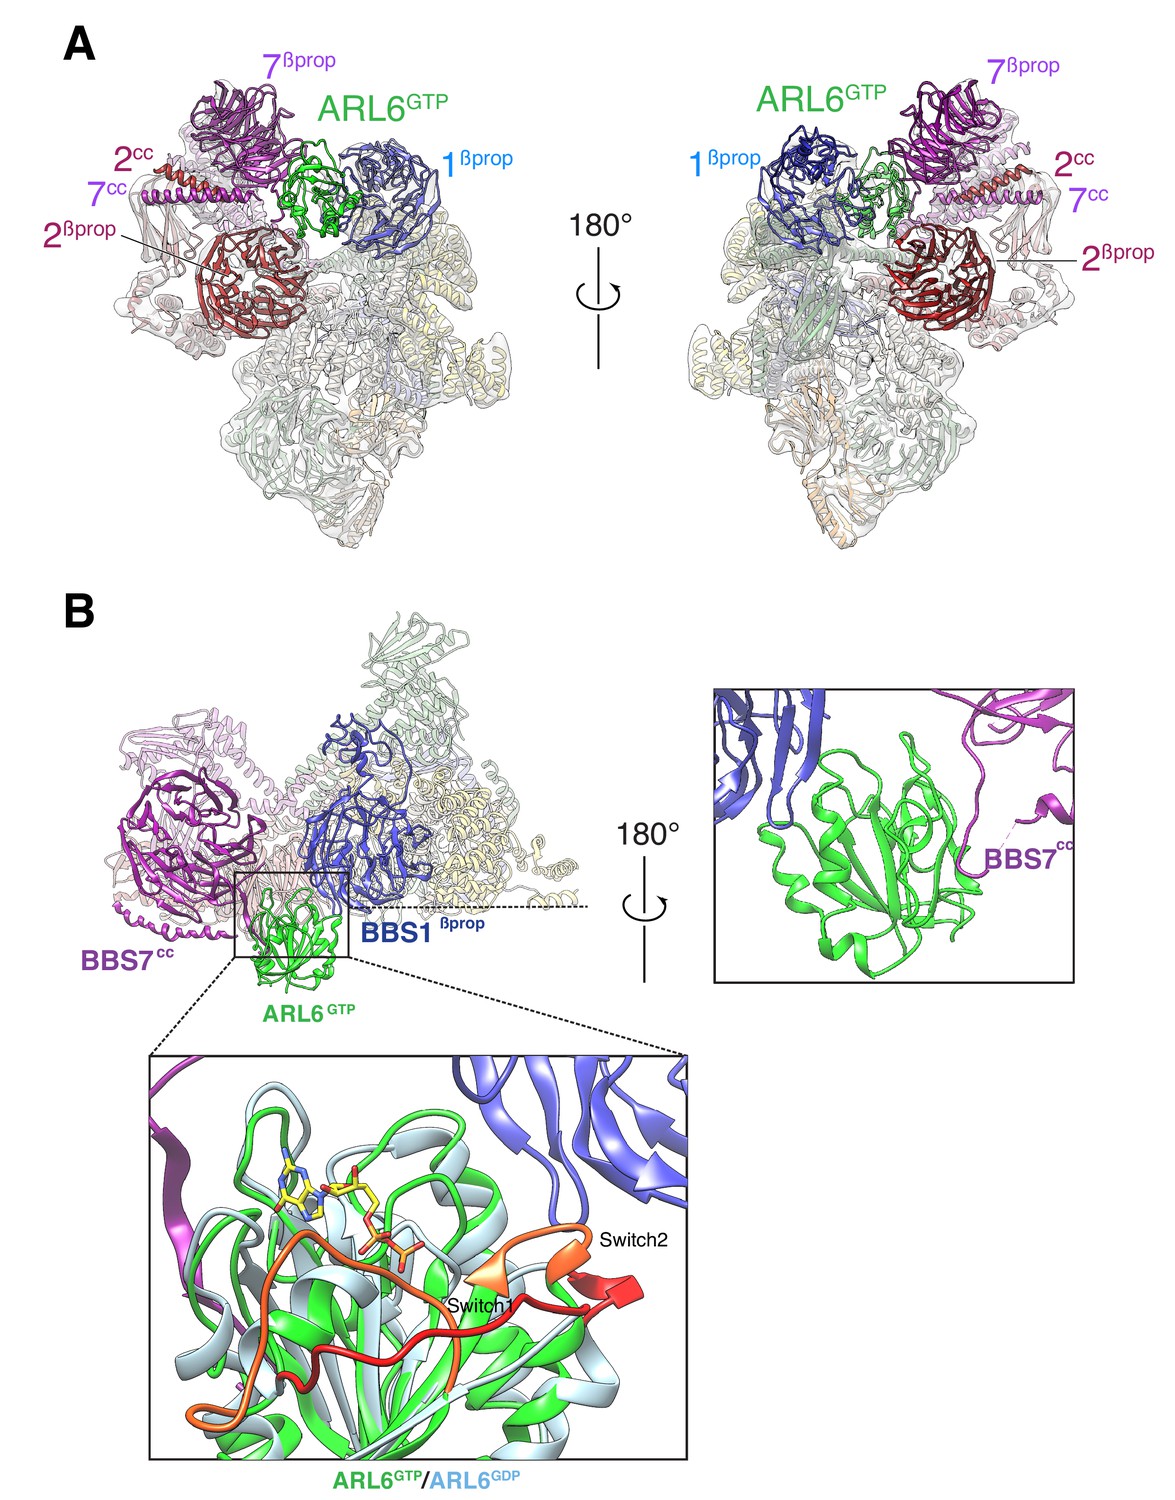
Overall structure of the BBSome–ARL6GTP complex.
(A) Two views of the cryo-EM map (transparent surface) and the near-atomic model of the BBSome–ARL6GTP complex shown in ribbon representation. BBS2βprop and BBS7βprop were swapped in our previously published structure, as were BBS2cc and BBS7cc. BBS1βprop, the domain that contacts ARL6GTP, is also labeled. (B) Overall view (left panel) of the BBSome–ARL6GTP complex. Right panel: close-up view focusing on the interaction of the backside of ARL6GTP with the loop connecting BBS7cc and BBS7βprop, and with BBS1βprop. Bottom panel: The Switch 1 and Switch 2 regions change conformation between ARL6GDP for ARL6GTP and these regions are colored orange (ARL6GTP) or red (ARL6GDP). ARL6GTP contacts the BBS1 β-propeller with its Switch 2 region. In contrast, ARL6 contacts BBS7 using a surface that is largely unaffected by nucleotide binding. A homology model of bovine GDP-bound ARL6GTP (based on the crystal structure of the Chlamydomonas protein; PDB ID: 4V0K) was aligned to the model of the GTP-bound ARL6 in our BBSome–ARL6GTP complex (ARL6GDP in light blue and ARL6GTP in lime green). GTP is shown in stick representation.
Figure 2—figure supplement 1
Cryo-EM analysis of the BBSome–ARL6GTP complex.
(A) Typical cryo-EM image of vitrified BBSome–ARL6GTP complex. Some particles are circled. Scale bar: 50 nm. (B) Selected 2D-class averages obtained with RELION 3.0. Side length of individual averages: 45 nm. (C) Image-processing workflow for 3D classifications and refinement in RELION 3.0 that yielded the three density maps discussed in the main text. See Methods for details.
Figure 3 with 1 supplement
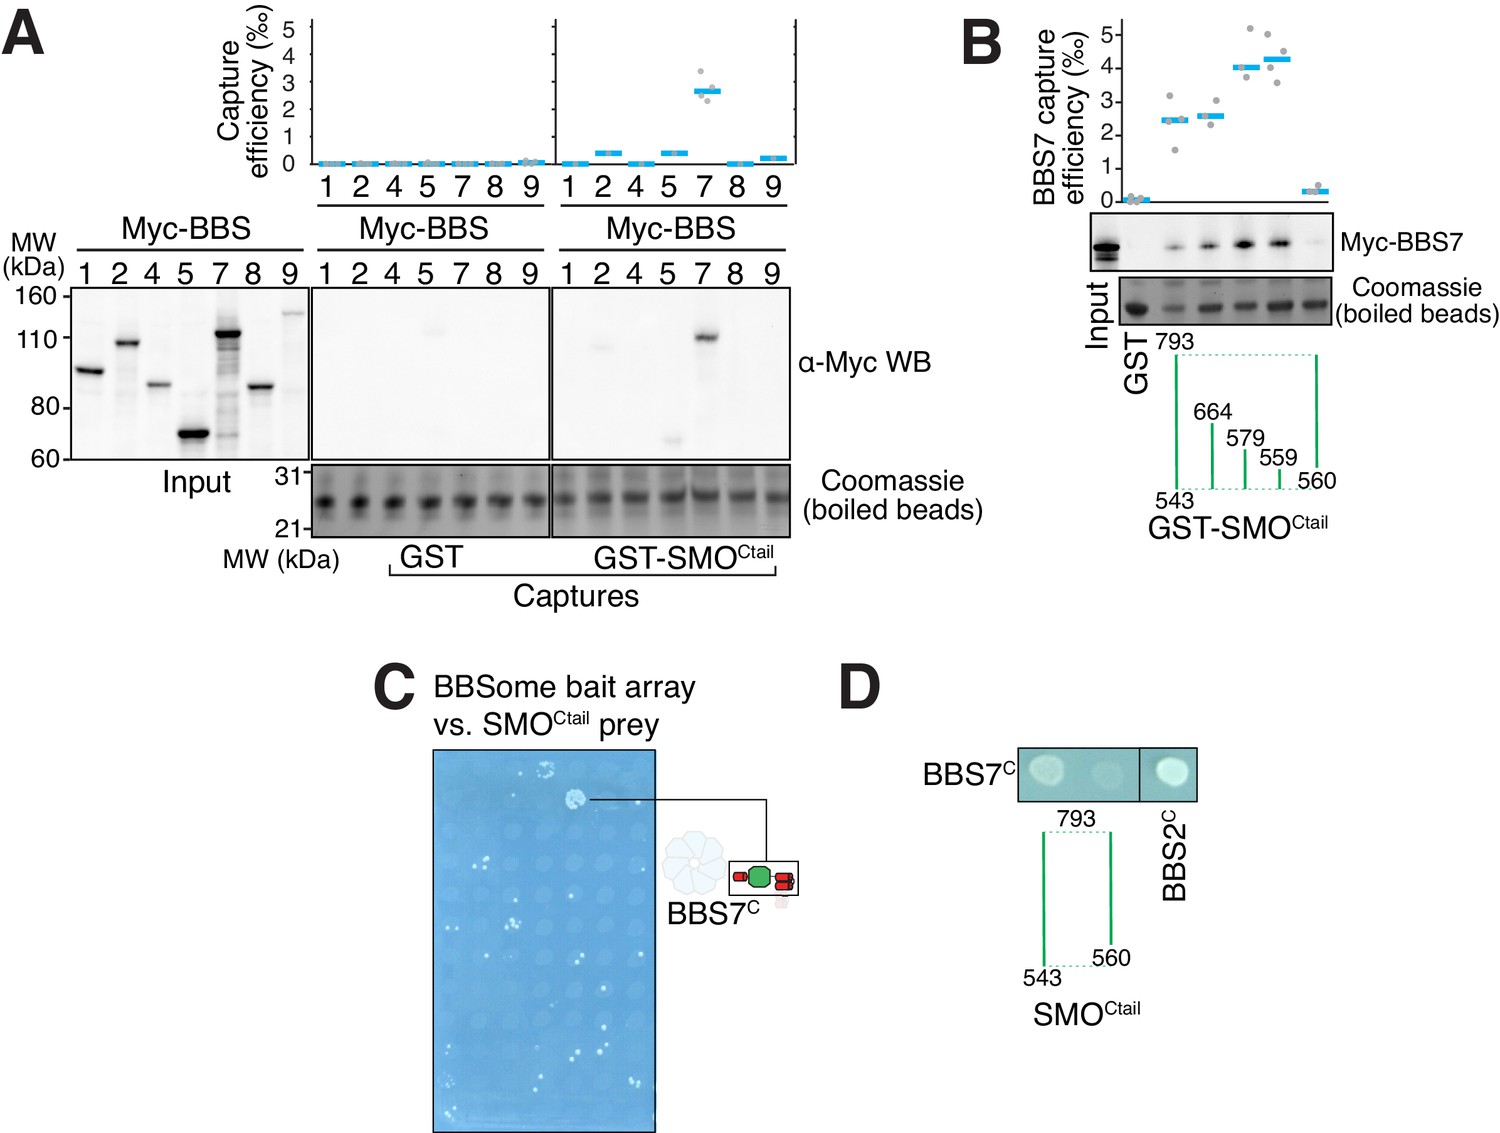
The BBSome recognizes SMO via membrane-embedded residues in SMO helix 8.
(A–B) GST-capture assays were conducted with in vitro translated BBSome subunits tagged with a 6xMyc epitope. Bound material was released by specific cleavage between GST and the fused peptide, and released proteins were detected using a Western blot and anti-Myc antibody (α-Myc WB). The proportions of BBSome subunits recovered in the eluate are plotted; grey circles are individual data points and blue lines are mean values. Even loading of the glutathione beads is demonstrated by staining for the remaining GST-tagged proteins after cleavage elution. (A) Capture of individual BBSome subunits with GST-SMOCtail (aa 543–793) identifies BBS7 as the SMO-binding subunit. (B) Capture assays with truncations of SMOCtail find that SMOH8 is necessary and sufficient for binding to BBS7. (C) Yeast two-hybrid (YTH) assays with SMOCtail against an array of BBS protein fragments identify an interaction between a C-terminal fragment of BBS7 (BBS7C, residues 326–672) and SMOCtail. The composition of the BBS YTH array is shown in Supplementary file 2. (D) YTH assays find that SMOH8 is required for the interaction with BBS7C. Growth controls on diploid-selective medium for panels (C–D) are shown in Figure 3—figure supplement 1C.
Figure 3—figure supplement 1
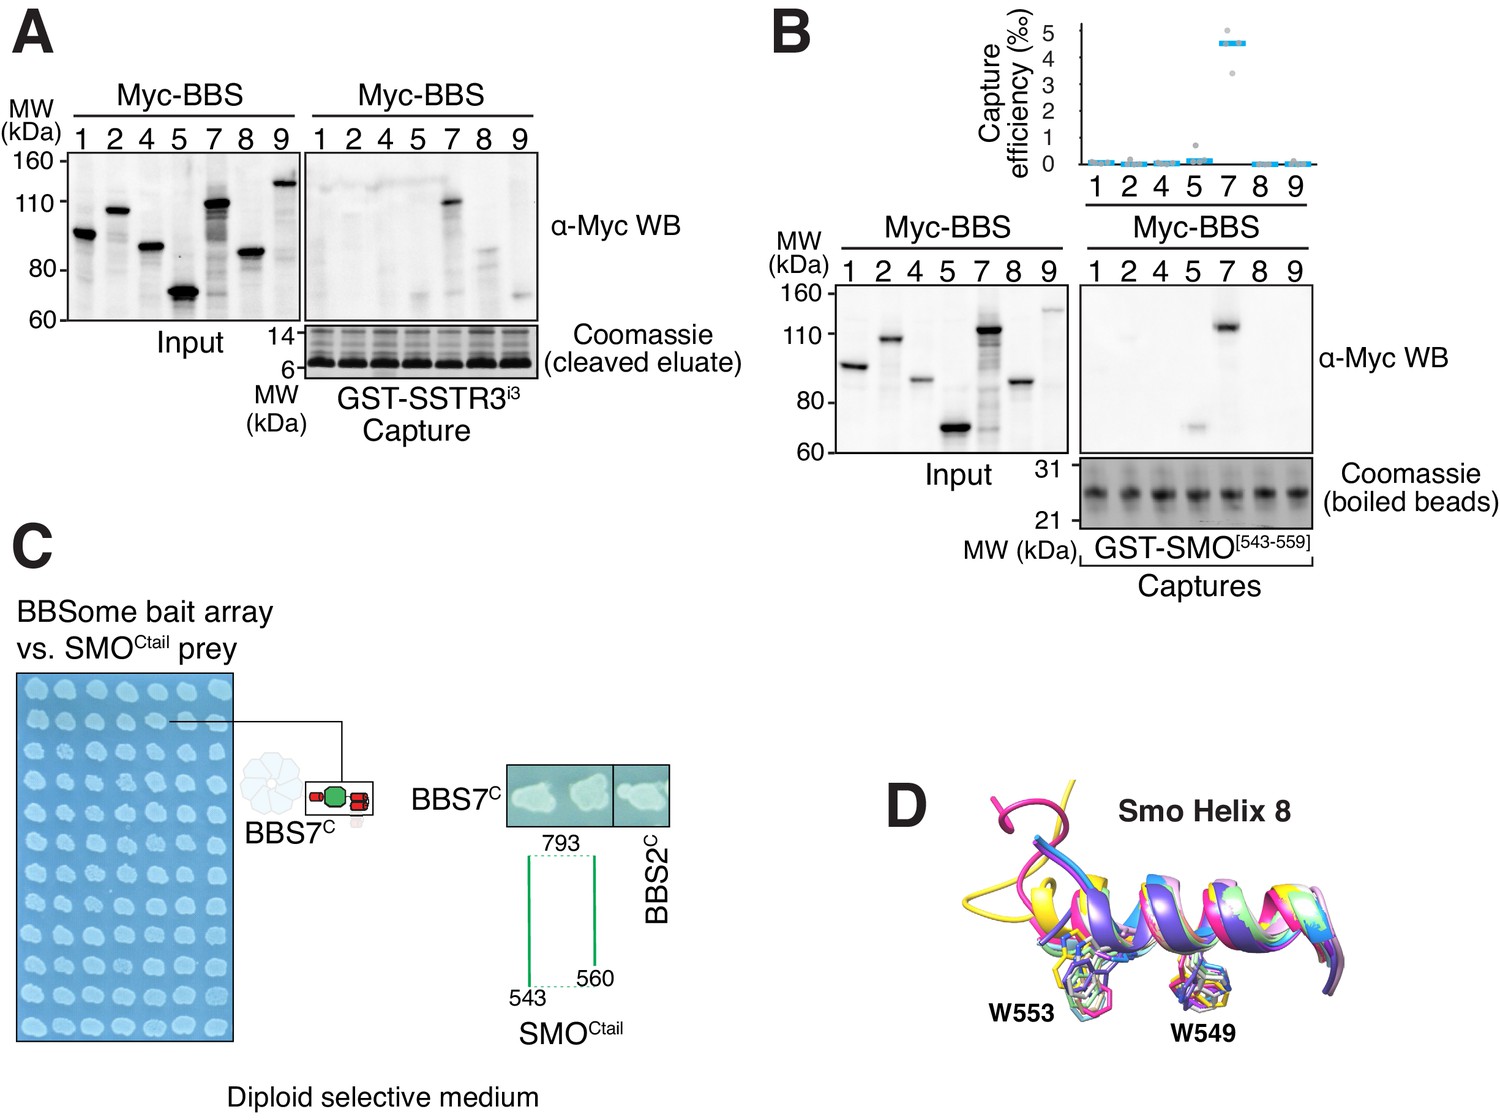
Capture assays, controls for YTH and SMOH8 conformation, and BBSome-binding motif in ciliary GPCRs.
(A) Capture of individual BBSome subunits with GST-SSTR3i3 identifies BBS7 as the SSTR3i3-binding subunit. (B) Capture of individual BBSome subunits with GST fused to the first 19 amino acids of SMOCtail (aa 543–559) identifies BBS7 as the SMO-binding subunit. (C). Controls for diploid growth of the yeast array on medium lacking tryptophan and leucine tested in Figure 3C–D. (D) Structural overlay of helix 8 from different human Smoothened proteins (PDB IDs: 4JKV, 4N4W, 4O9R, 4QIM, 4QIN, 5L7D, 5V56, 5V57, 6D32, 6D35, 6OT0). The side chains of the two critical tryptophan residues are shown as sticks. The numbering of the residues is based on mouse Smoothened.
Figure 4
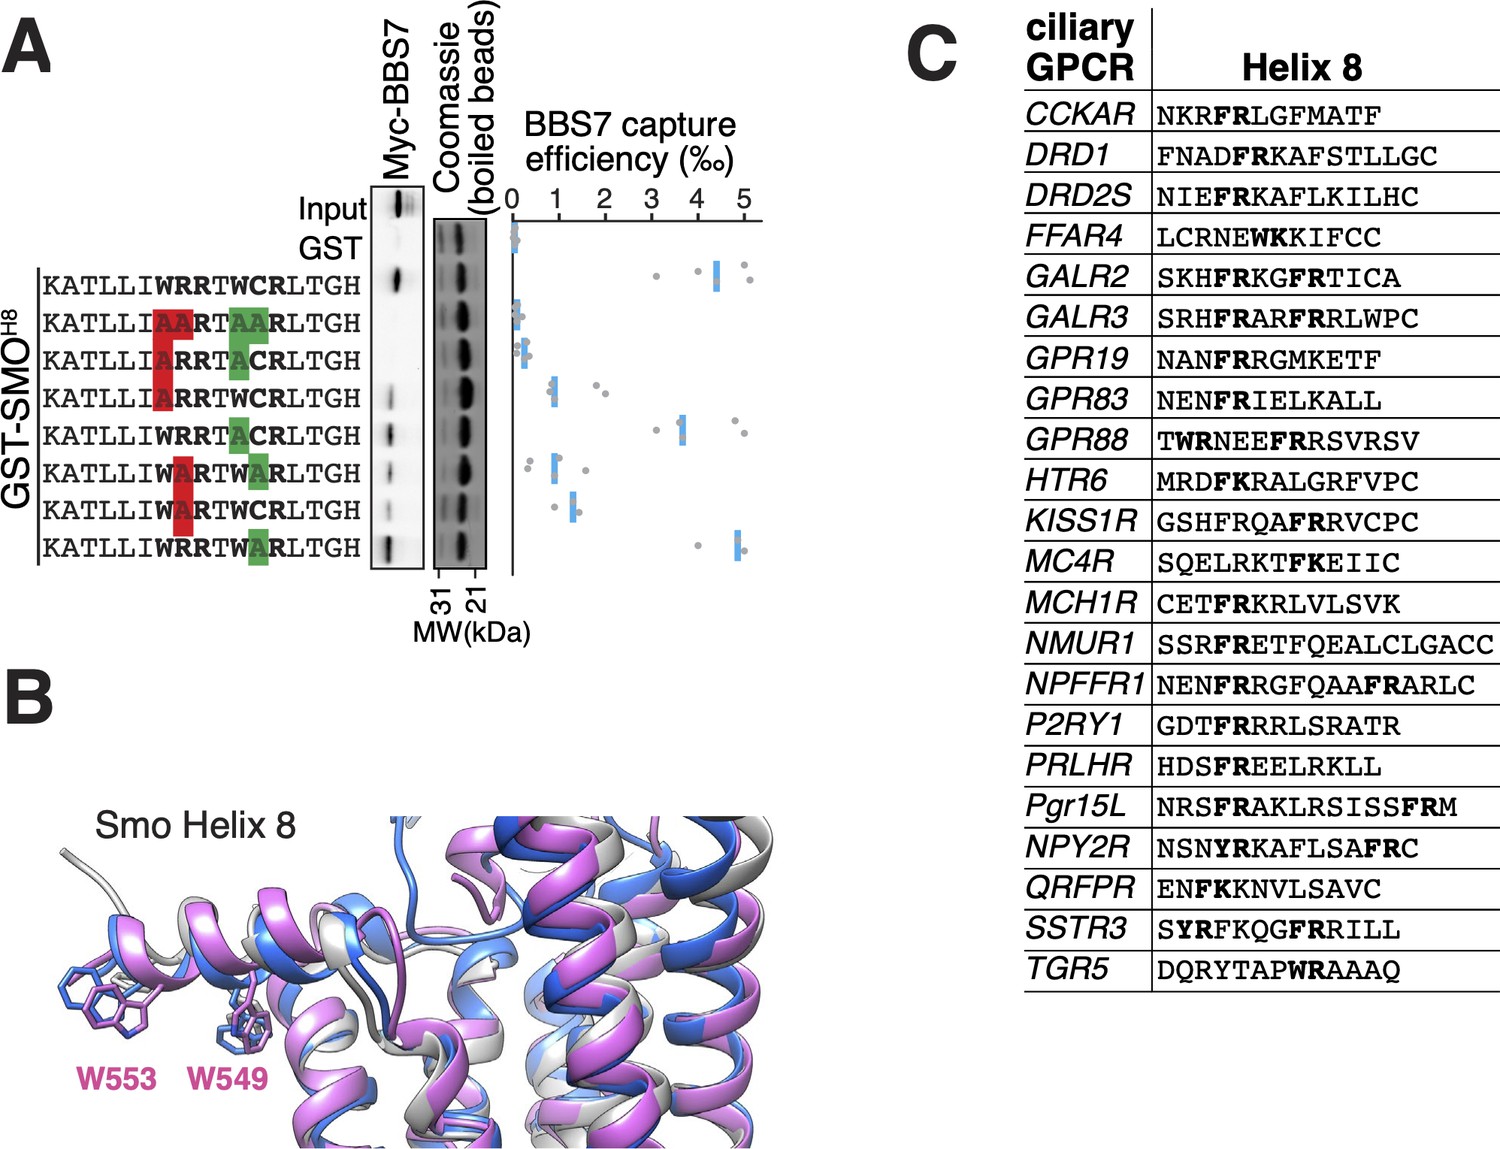
The BBSome BBS7 interacts with conserved SMO helix 8.
(A) Capture assays of BBS7 with mutants of SMOH8 (aa 543–559) identify Trp549 and Trp553 as the major BBS7-binding determinants of SMOH8. The sequences of the peptides fused to GST after the protease cleavage site are indicated. (B) Overlay of helix 8 from three structures of human SMO (PDB IDs: 5L7D, 6O3C, 6D32), showing that the orientation of the two tryptophan residues into the hydrophobic core of the membrane is conserved (see additional structures in Figure 3—figure supplement 1D). For consistency with the GST fusions used in capture assays, residue numbering corresponds to mouse SMO. (C) Sequence analysis finds a BBSome-binding motif ([W/F/Y]R) within helix 8 in 20 of the 26 GPCRs known to localize to cilia. Sequences are listed in Supplementary file 3.
Figure 5 with 1 supplement
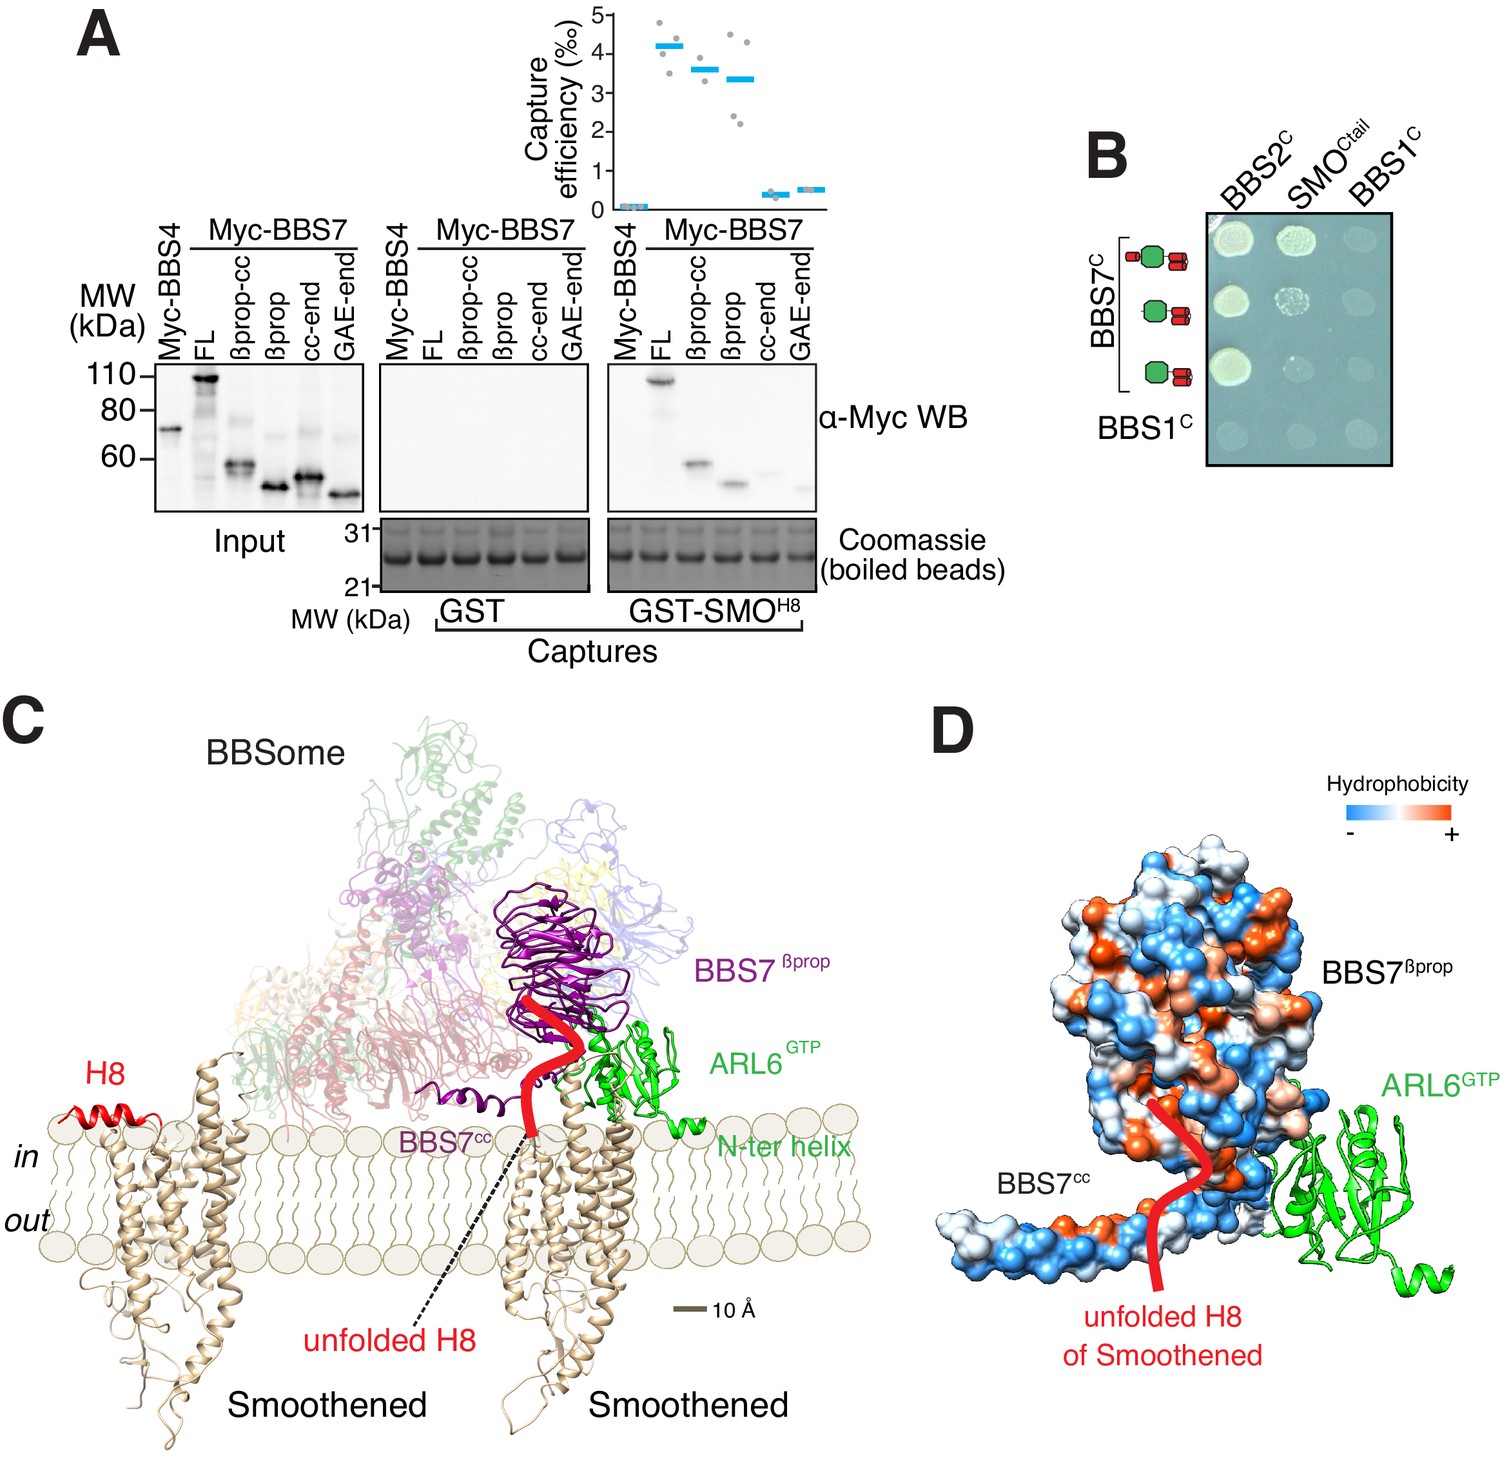
A model for binding of the BBSome to membranes and cargo.
(A) Capture assays of BBS7 find that BBS7βprop engages SMOH8. The boundaries of each truncation are βprop, aa 1–332; βprop-cc, aa 1–378; cc-end, aa 326–672; and GAE-end, aa 375–672. Results are presented as in Figure 3. (B) YTH assays show that the deletion of BBS7cc impairs the interaction of BBS7C with SMOCtail (top row), but not with a C-terminal fragment of BBS2 (BBS2C, residues 324–712) (middle rows). BBS1C serves as non-interacting control. Growth controls on diploid-selective medium are shown in Figure 5—figure supplement 1A. (C) Diagram illustrating the proposed interaction of SMO with the membrane-bound BBSome–ARL6GTP complex. For clarity, ARL6GTP and the BBS7 domains involved in SMO binding (BBS7βprop and BBS7cc) are shown in solid colors with the remaining subunits shown with reduced opacity. Helix 8 (H8) of SMO is folded in the absence of partners, and is proposed to become a random coil in the SMO–BBSome complex. (D) Hydrophobicity surface of the BBS7βprop and BBS7cc domains, showing a plausible binding cleft for unfolded SMOH8 (shown in red). ARL6GTP is shown in ribbon representation.
Figure 5—figure supplement 1
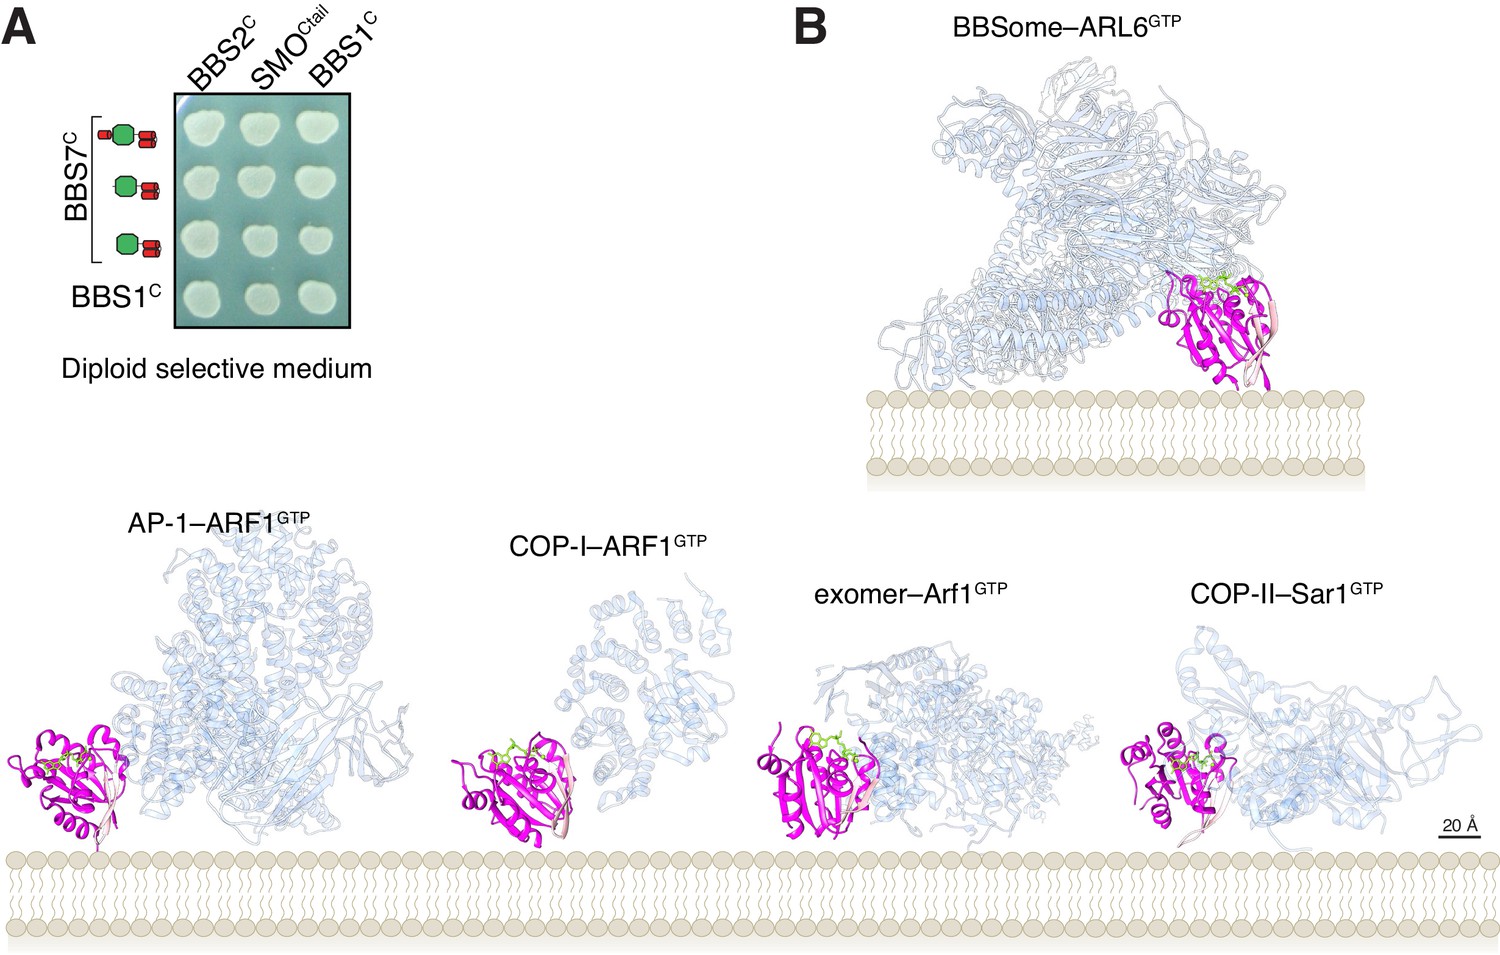
Controls for YTH and membrane orientation of ARF-like GTPases in complex with trafficking complexes.
(A) Controls for diploid growth of the yeast array on medium lacking tryptophan and leucine tested in Figure 4B. (B) Orientations of Arf-like GTPases in complex with coat adaptor complexes from crystal structures (bottom row) and in our model of the BBSome bound to membranes and cargo (top). The coat complexes are transparent blue, the GTPases are magenta with their interswitch hairpin in pink, and the nucleotide and Mg2+ ion are chartreuse. The PDB IDs are: 4HMY for the complex of ARF1GTP with AP1 (Ren et al., 2013), 3TJZ for the complex of ARF1GTP with γζ-COP (Yu et al., 2012), 4Q66 for the complex of Arf1GTP with exomer (Bch1/Chs5) (Paczkowski and Fromme, 2014), and 2QTV for Sar1 bound to Sec23/Sec31 (Bi et al., 2007).
Figure 6 with 1 supplement
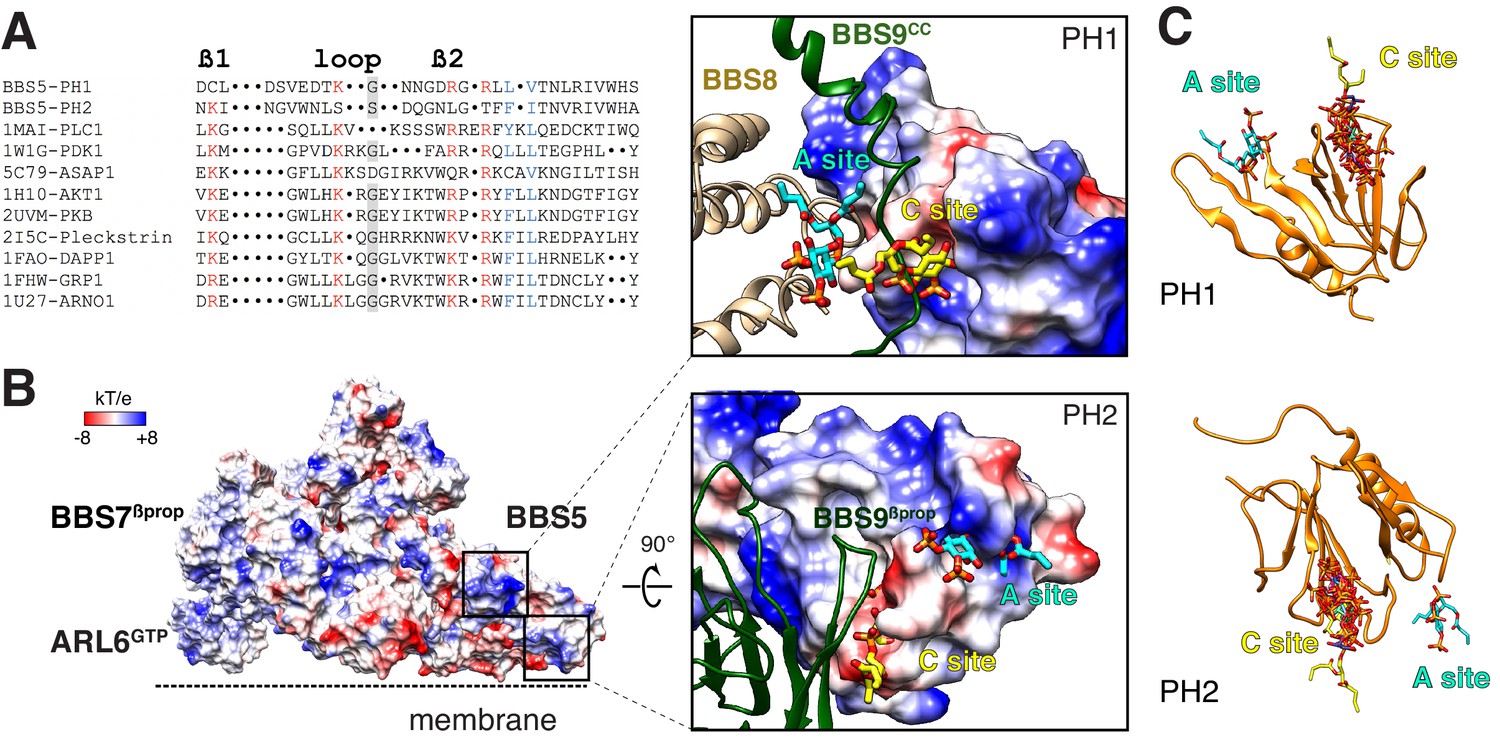
Mapping the putative interactions of lipids onto the BBSome structure.
(A) Sequence alignment of the β1-loop-β2 region in structurally characterized PH domains. Conserved residues are colored: grey shading, glycine; red, positively charged residues; blue, hydrophobic residues. (B) Electrostatic surface of the membrane-bound BBSome–ARL6GTP complex, and close-up views of the BBS5 pleckstrin homology (PH) domains. For the PH1 domain, the canonical (C) and atypical (A) sites for lipid binding are occluded by BBS9 (dark green ribbon) and BBS8 (gold ribbon), respectively. For the PH2 domain, the C site is blocked by BBS9, but the A site is accessible. The lipids at the A and C sites, shown as yellow and cyan sticks, respectively, are diC4-PtdIns(4,5)P2 and are modeled based on the structural alignment of the BBS5 PH domains with the lipid-bound ASAP1 PH domain (PDB ID: 5C79) (C) Structural overlay of the lipids bound to the PH domains listed in the above sequence alignment (PDB IDs: 1MAI, 1W1G, 5C79, 1H10, 2UVM, 2I5C, 1FAO, 1FHW, 1U27), showing the consistency of the lipid position for both PH domains. The lipids are shown as stick models and are overlaid on the PH1 and PH2 domains of BBS5 (orange ribbon).
Figure 6—figure supplement 1
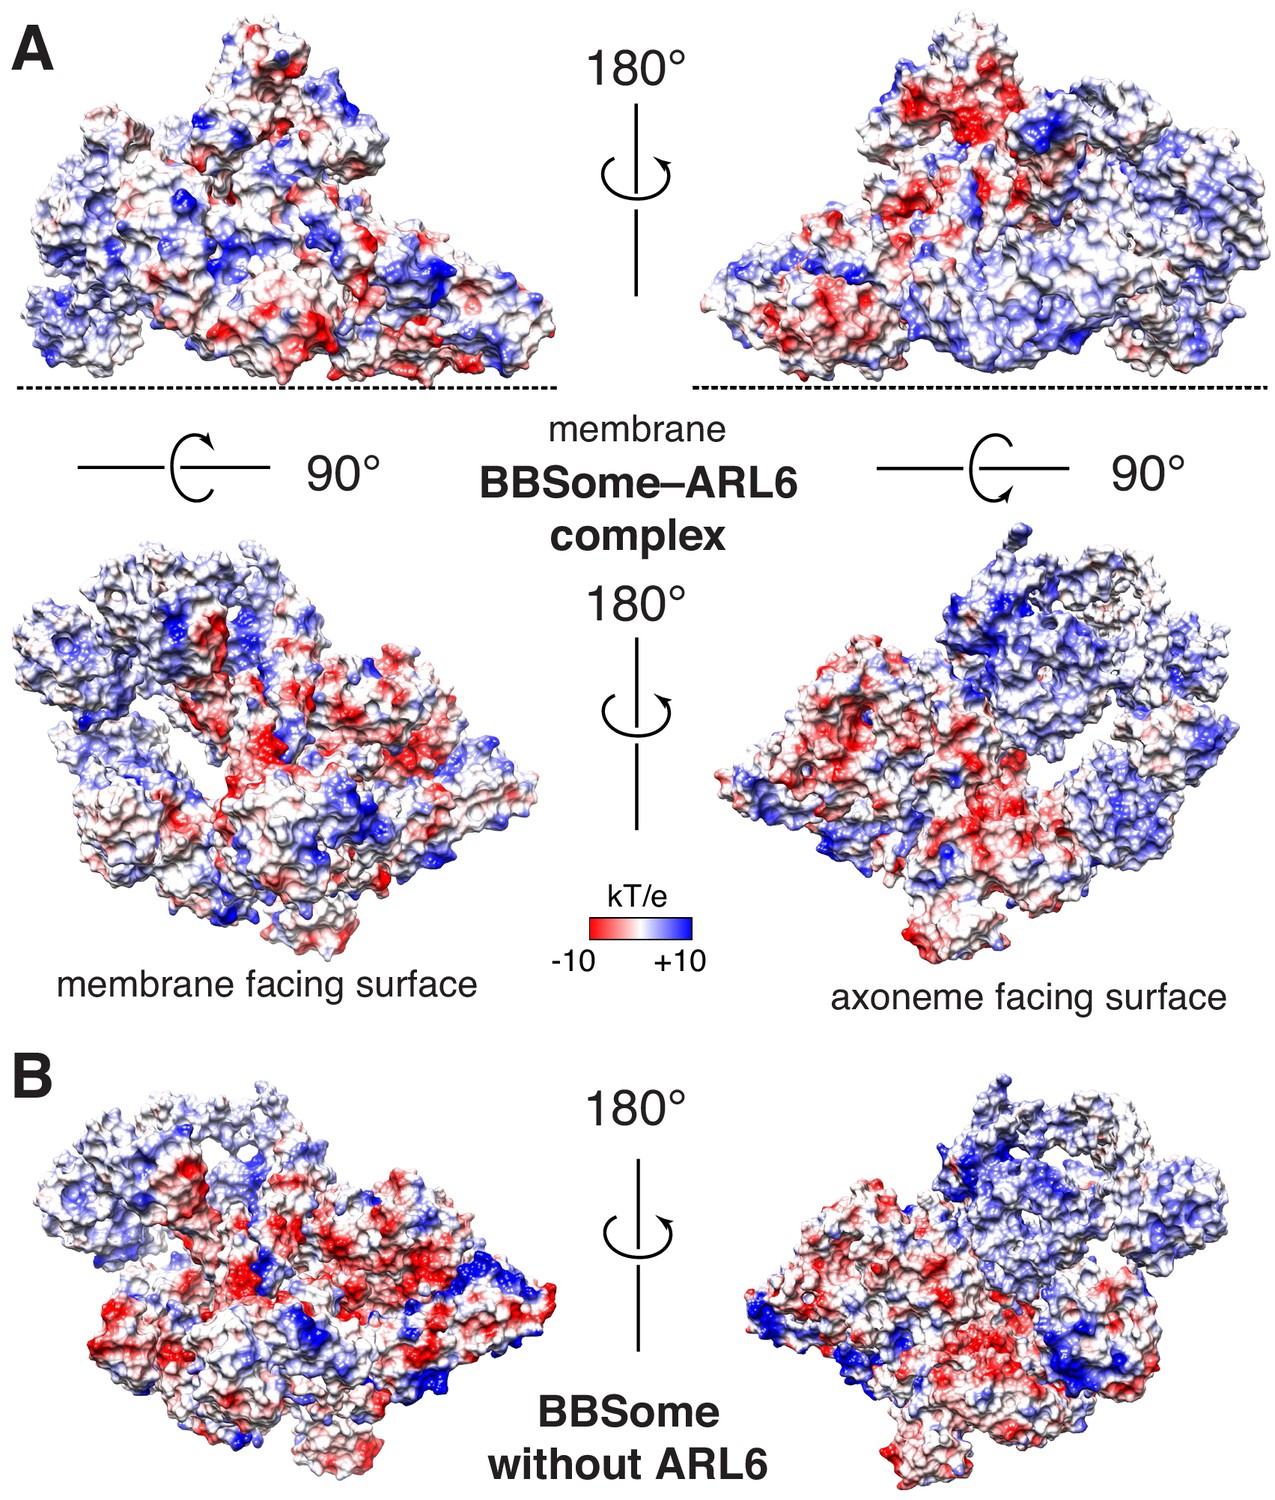
Proposed binding surfaces for membranes on the BBSome.
(A) Views of the electrostatic surface of the BBSome–ARL6GTP complex. (B) Views of the electrostatic surface of the BBSome alone.
Figure 7
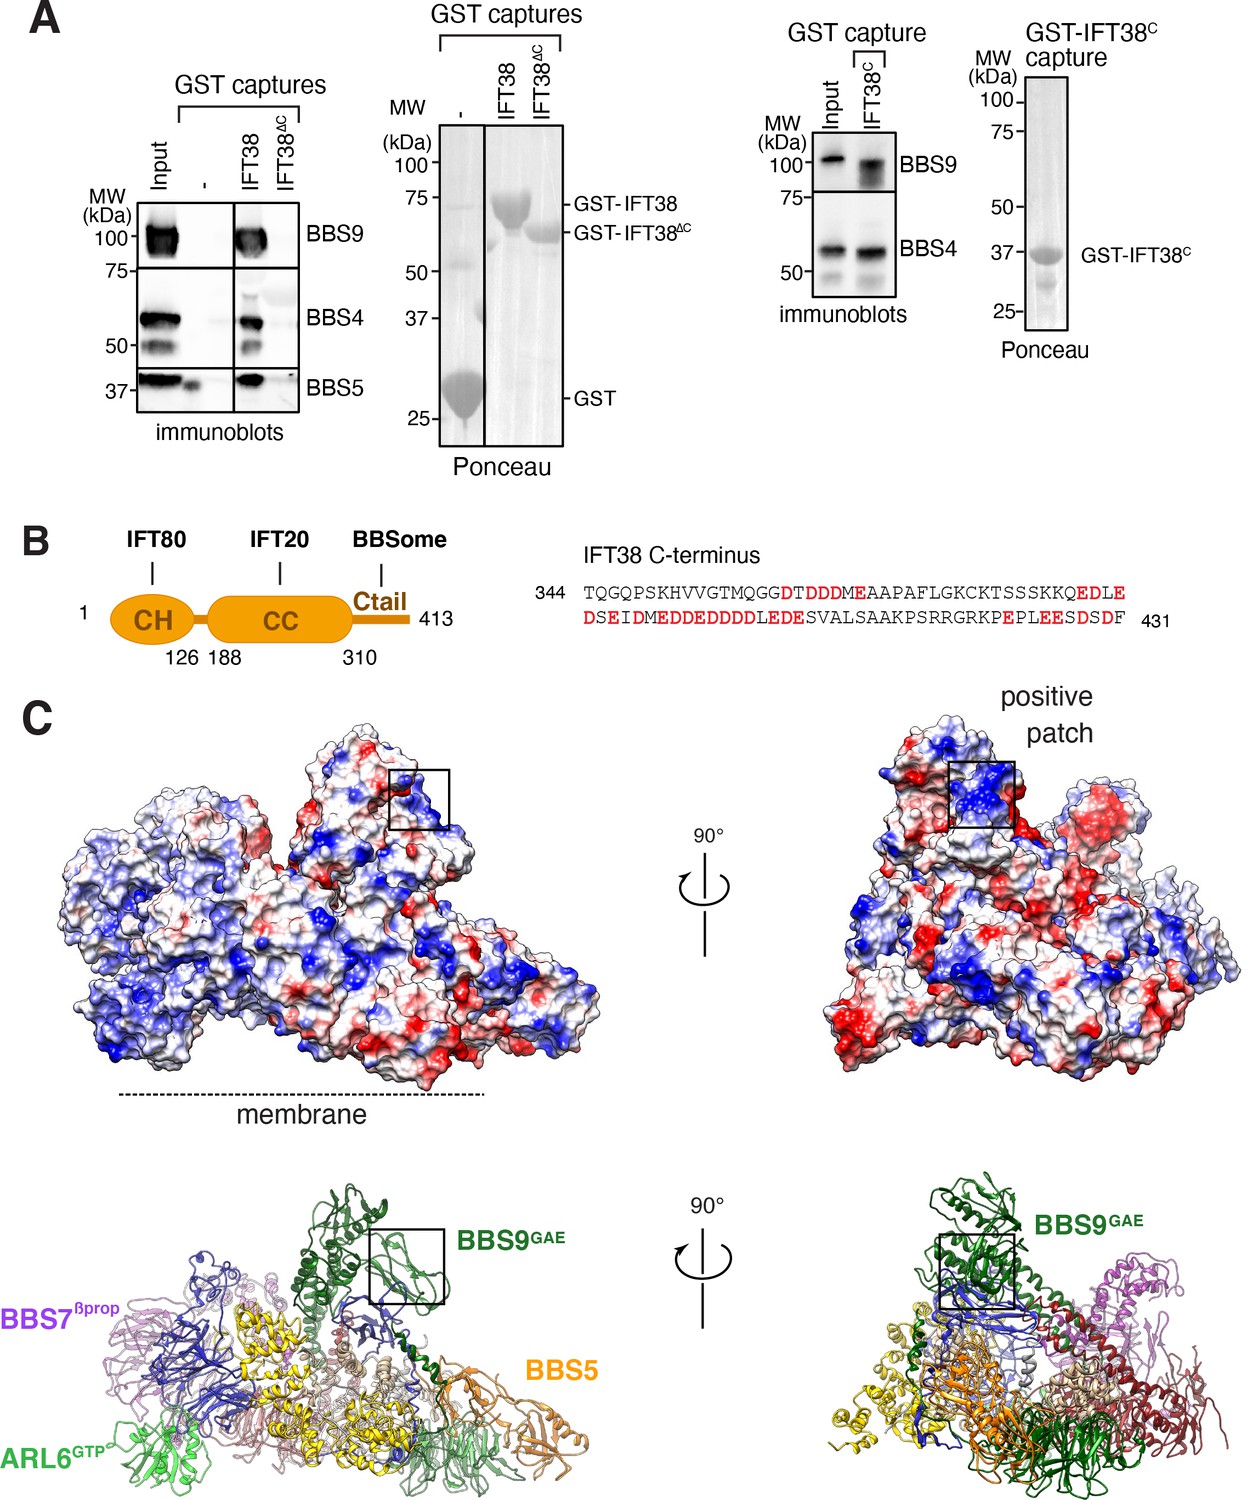
Proposed binding surfaces for IFT38 and membranes on the BBSome.
(A) IFT38Ctail is necessary and sufficient for BBSome binding. GST-capture assays were conducted with BBSome purified from bovine retina and GST fusions immobilized on glutathione sepharose. Bound material was eluted in SDS sample buffer. 2.5 input equivalents were loaded in the capture lanes. The BBSome was detected by immunoblotting and the GST fusions by Ponceau S staining. (B) Left panel: Diagram of the domain organization of IFT38. The calponin homology (CH) domain interacts with IFT80, the coiled-coil (CC) domain with IFT20, and the C-terminal tail (Ctail) with the BBSome. Right panel: Sequence of the region of IFT38 that interacts with the BBSome. Negatively charged residues are bold and red. (C) Top panels: Electrostatic surface of the ARL6GTP -bound BBSome showing a patch of positive charges on a region of BBS9 that interacts with BBS1 and BBS2 and is a candidate for binding IFT38C. Bottom panels: Corresponding orientations in ribbon diagram representations.
Videos
Video 1
Morph of the BBSome structure from the unbound to the ARL6GTP -bound conformation and back to unbound conformation.
BBS1βprop is blue, BBS4 is yellow and ARL6GTP is magenta.
Additional files
-
Supplementary file 1
Cryo-EM data collection, refinement and modelling statistics.
- https://cdn.elifesciences.org/articles/55954/elife-55954-supp1-v2.xlsx
-
Supplementary file 2
Fragments used in the BBS YTH array displayed in Figure 3C.
- https://cdn.elifesciences.org/articles/55954/elife-55954-supp2-v2.xlsx
-
Supplementary file 3
Sequences of helix 8 from known ciliary GPCRs.
- https://cdn.elifesciences.org/articles/55954/elife-55954-supp3-v2.xlsx
-
Transparent reporting form
- https://cdn.elifesciences.org/articles/55954/elife-55954-transrepform-v2.docx
Download links
A two-part list of links to download the article, or parts of the article, in various formats.
Downloads (link to download the article as PDF)
Open citations (links to open the citations from this article in various online reference manager services)
Cite this article (links to download the citations from this article in formats compatible with various reference manager tools)
Near-atomic structures of the BBSome reveal the basis for BBSome activation and binding to GPCR cargoes
eLife 9:e55954.
https://doi.org/10.7554/eLife.55954


