Evolutionary expansion of apical extracellular matrix is required for the elongation of cells in a novel structure
- Department of Biological Sciences, University of Pittsburgh, United States
- Department of Bioengineering, University of Pittsburgh, United States
Figures
Figure 1 with 2 supplements
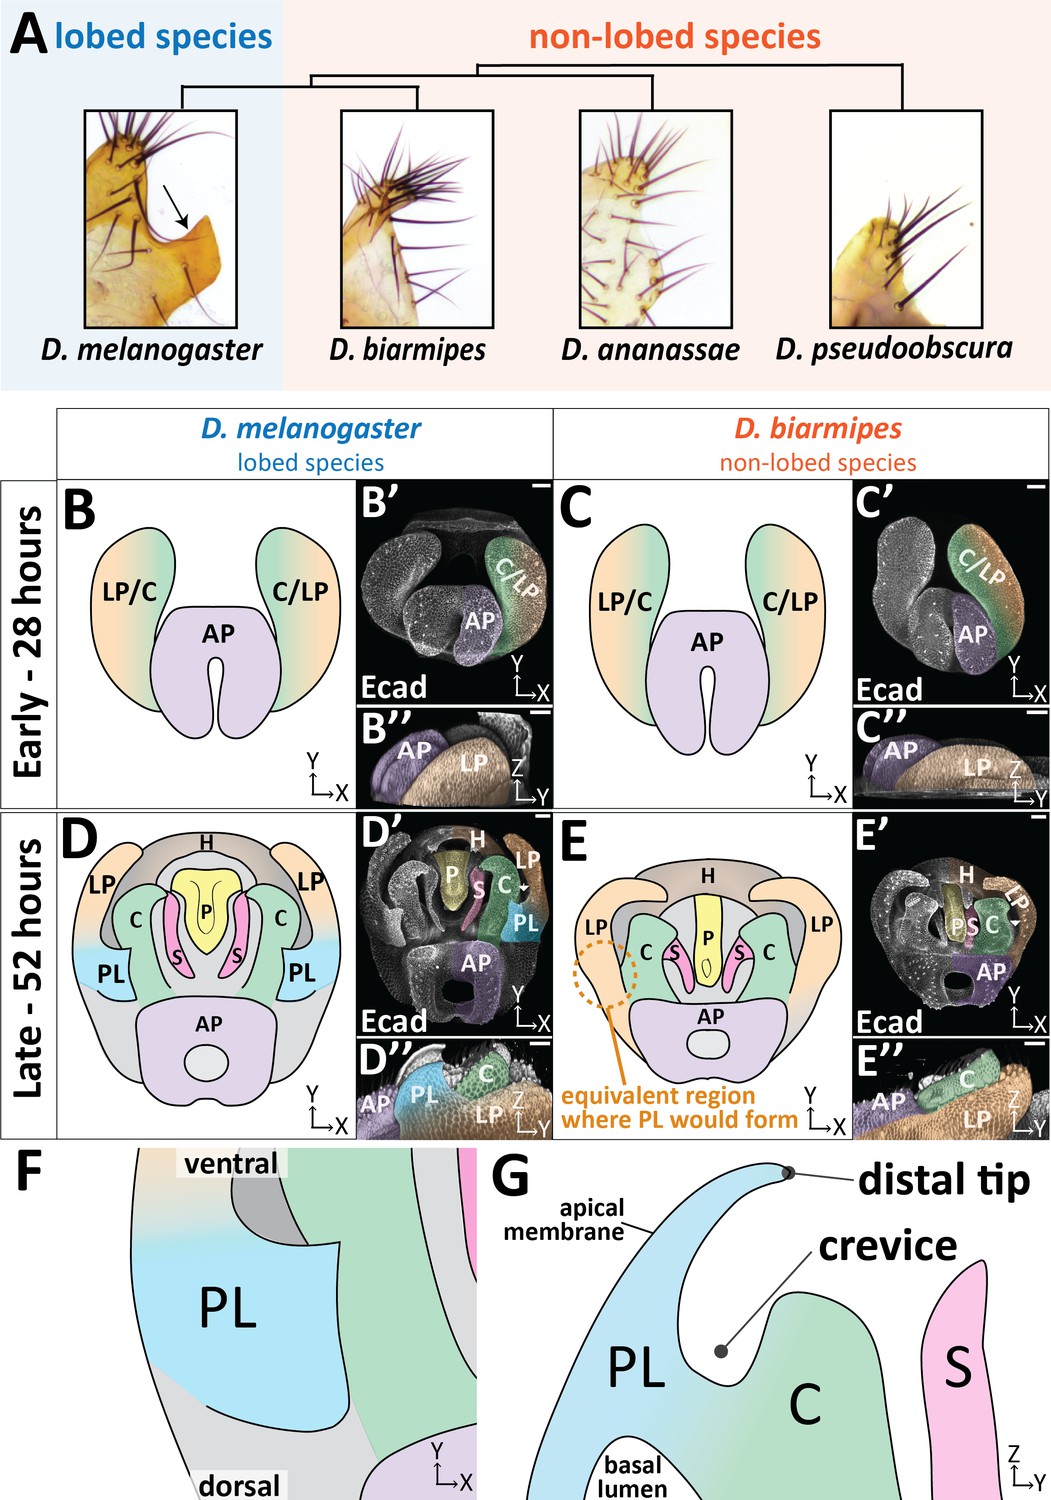
The posterior lobe protrudes from the lateral plate.
(A) Phylogenetic tree with bright-field images of adult lateral plate cuticles from which the posterior lobe projects (arrow). (B–E) Illustration, (B’–E’) maximum projection, and (B’’–E’’) three-dimensional projection labeled with E-cadherin (Ecad) of early (28 hr APF) and late (52 hr APF) developing genitalia showing the posterior lobe projecting form the lateral plate of D. melanogaster (D’’), but absent in D. biarmipes (E’’). Relevant structures are labeled: posterior lobe (PL), lateral plate (LP), clasper (C), sheath (S), phallus (P), anal plate (AP), and hypandrium (H). All max projections are oriented with ventral side towards to the top and dorsal sides towards the bottom. (F) Zoomed in illustration of posterior lobe and (G) a cross-sectional/lateral view of the posterior lobe. The highest point of the lobe is the distal tip and the invagination between the lobe and the clasper is termed the crevice (G). Scale bar, 20 μm.
Figure 1—figure supplement 1
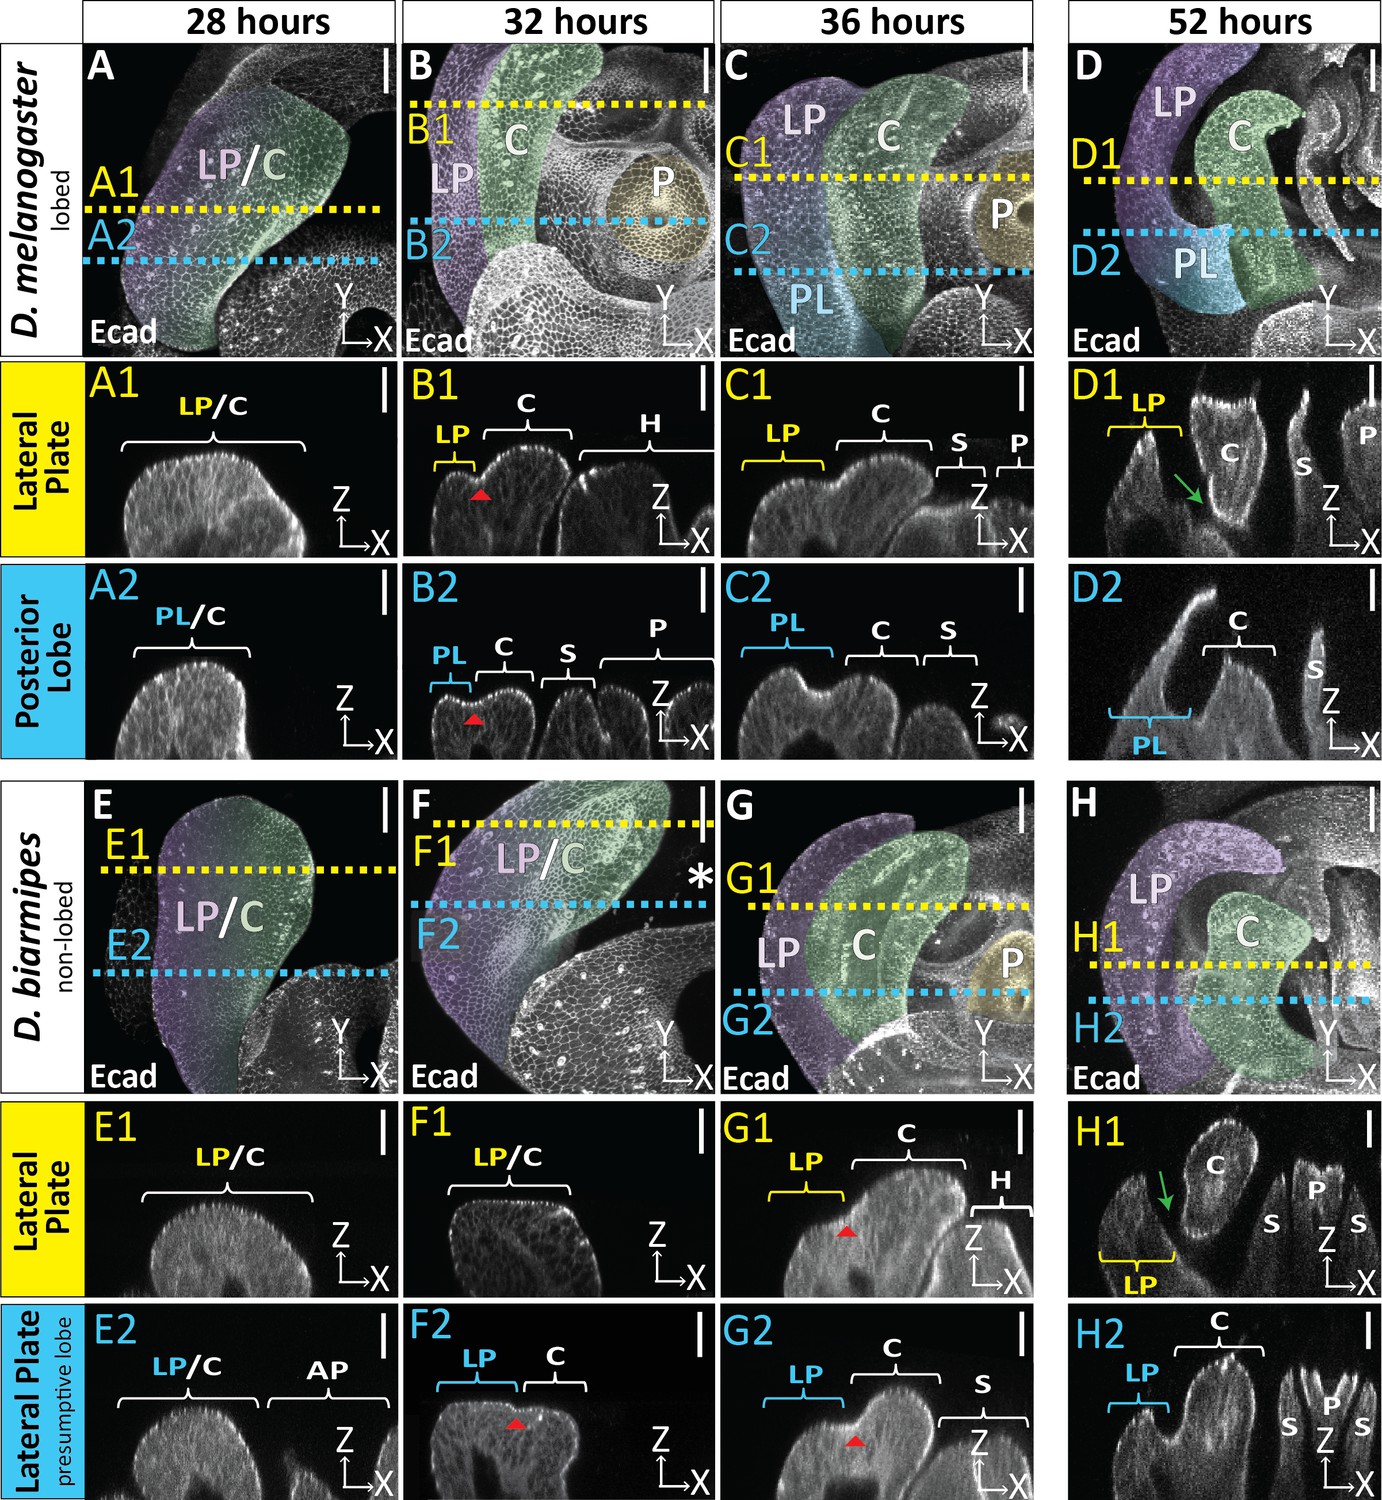
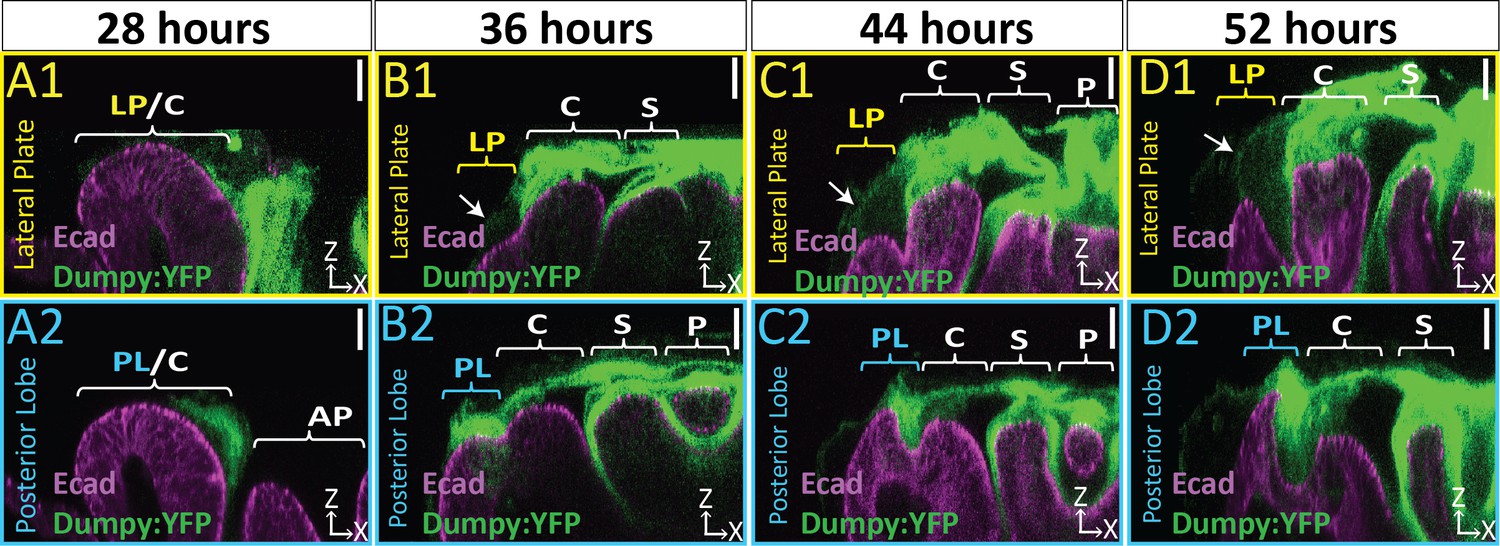
Developmental timing of lobed vs non-lobed genitalia.
Developmental time course of the lobed species D. melanogaster (A–D) and the non-lobed species D. biarmipes (E–H) with E-cadherin (Ecad) label. Location of respective cross sections indicated in yellow for lateral plate and blue for posterior lobe (D. melanogaster) or equivalent location in non-lobed species (D. biarmipes). Relevant structures are labeled: posterior lobe (PL), lateral plate (LP), clasper (C), sheath (S), and phallus (P). Scale bar, 20 μm. At 28 hr APF the genitalia looks relatively similar between D. melanogaster (A–A2) and D. biarmipes (E–E2). At 32 hr APF in D. melanogaster the clasper and lateral plate have fully begun to cleave (B1-2 red arrowhead = cleavage), the lateral plate is lower than the clasper (B1), and the hypandrium, sheath, and phallus have fully everted and are neighboring the clasper and lateral plate (B1-2). D. biarmipes lags behind approximately 4 hr. At 32 hr APF there is slight cleavage near the dorsal side of the lateral plate and clasper (F2 red arrowhead), but no cleavage has occurred at the ventral side (F1). In addition, the sheath, hypandrium, and phallus have not everted yet (F1-2). At 36 hr APF in D. biarmipes, cleavage has begun along the full length of the lateral plate and clasper (G1-2 red arrowhead), the lateral plate is lower than the clasper (G1-2), and the hypandrium, sheath, and phallus have everted and are next to the lateral plate and clasper (G1-2). As development proceeds later at 52 hr APF the lateral plate and clasper fully separate at the ventral side of the genitalia in both D. melanogaster (D1 green arrow) and D. biarmipes (H1 green arrow). Full cleavage does not span the length of the lateral plate and clasper (D2 and H2) and stops right before the posterior lobe forms (D2) and also stops before reaching the very dorsal side of the lateral plate and clasper in D. biarmipes (H2).
Figure 1—video 1
The posterior lobe protrudes from the lateral plate.
Three-dimensional projections of D. biarmipes (left) and D. melanogaster (right) samples at 52 hr APF labeled with E-cadherin.
Figure 2 with 3 supplements
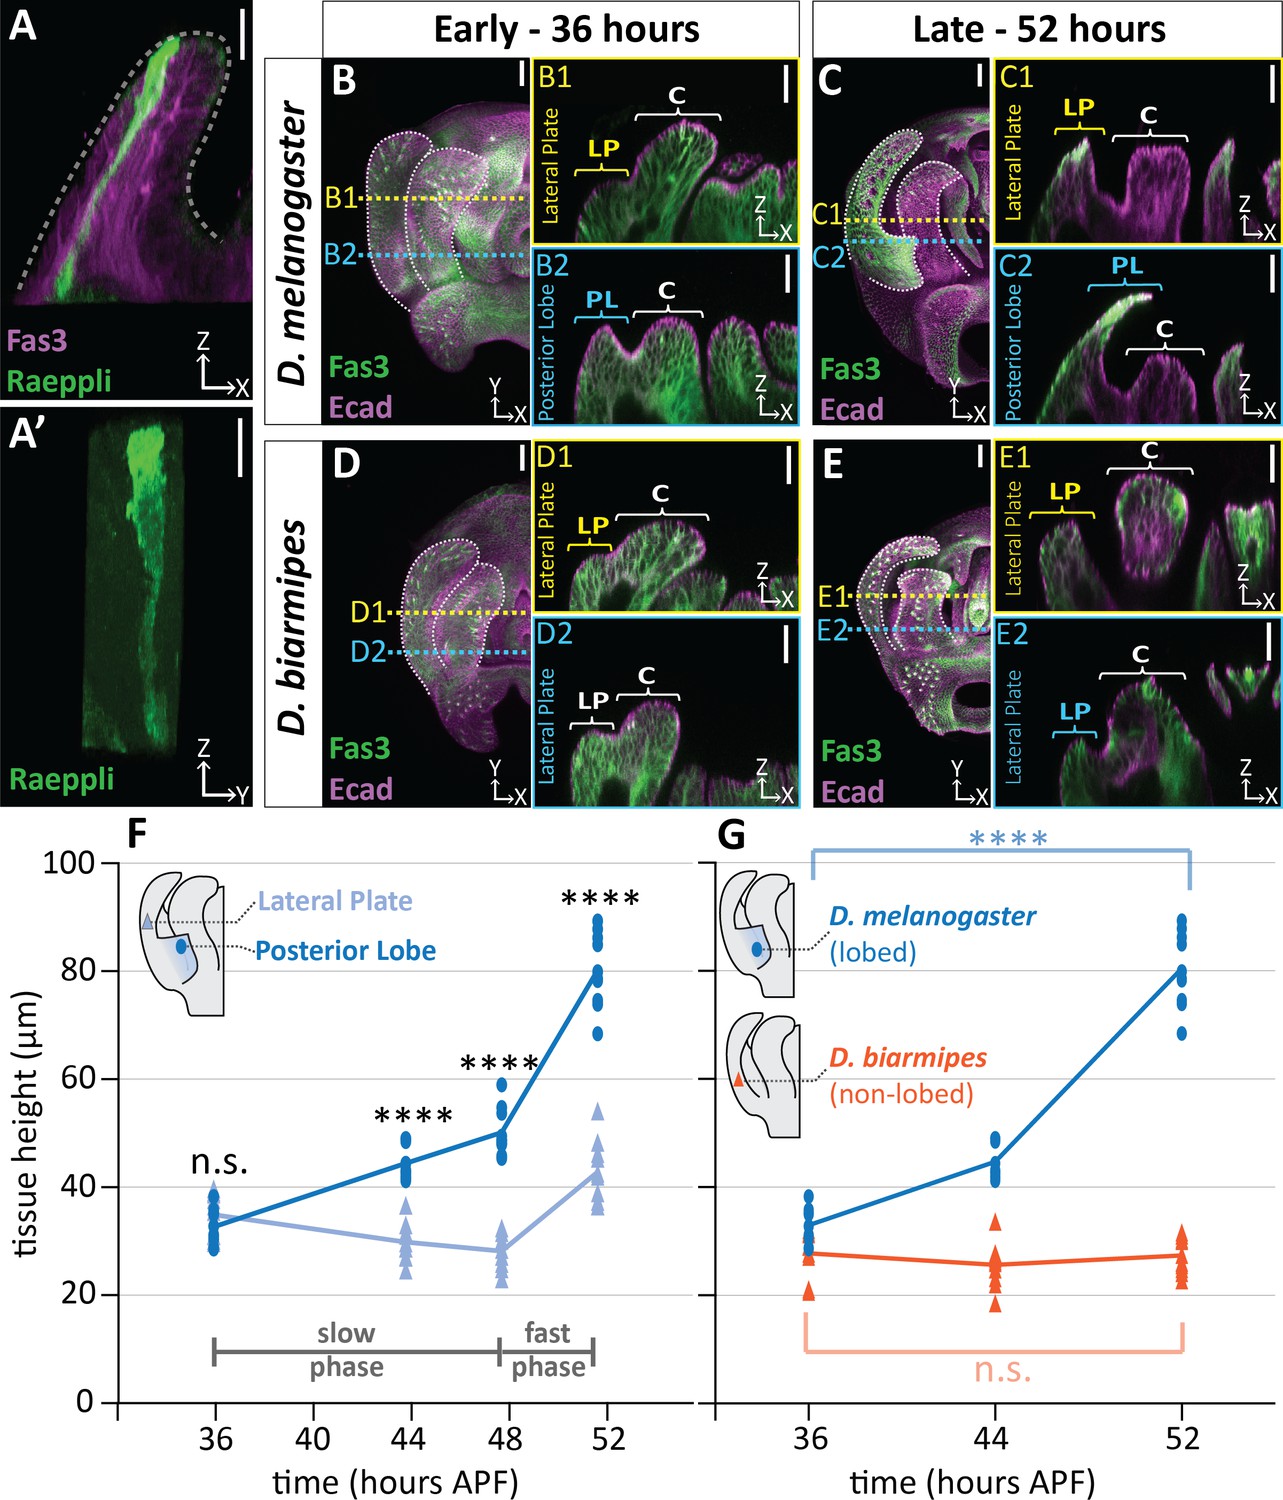
Posterior lobe cells increase in height to project out from the lateral plate.
(A) A single cell in the posterior lobe labeled with Raeppli-mTFP1 (green) spans the height of the tissue labeled with lateral membrane marker Fasciclin III (Fas3; magenta). Apical side of posterior lobe identified with dotted line. Sample is 44 hr after pupal formation (APF), but was heat shocked for 1 hr at 24 hr APF causing it to develop faster and more closely resembles a 48 hr APF sample. Scale bar, 10 μm. n = 10 cells (B–E) Maximum projections of early (36 hr APF) and late (52 hr APF) genital samples labeled with Fas3 (lateral membranes, green) and E-Cadherin (Ecad; apical membranes; magenta). Location of respective cross sections indicated in yellow for lateral plate (B1–E1) and blue for posterior lobe (D. melanogaster) (B2–C2) or equivalent location in non-lobed species (D. biarmipes) (D2–E2). Scale bar, 20 μm. Relevant structures are labeled: posterior lobe (PL), lateral plate (LP), clasper (C). (F) Quantification of tissue thickness of the lateral plate (light blue) and posterior lobe (dark blue). Illustration represents approximate location of cross-section that was used for tissue height measurement. Individual data points are presented; n = 10 per each time point. (G) Quantification of tissue thickness of the posterior lobe in D. melanogaster (dark blue) and equivalent location in non-lobed species D. biarmipes (orange). Illustration represents approximate location of cross-section that was used for tissue thickness measurement. Individual data points are presented; n ≥ 9 per each time point. Statistical significance is indicated (unpaired t-test; ****p≤0.0001; n.s. = not significant p≥0.05). D. melanogaster tissue height measures in (G) are replotted from (F) to facilitate direct comparisons with D. biarmipes.
-
Figure 2—source data 1
Individual measurements of tissue thickness over time.
- https://cdn.elifesciences.org/articles/55965/elife-55965-fig2-data1-v2.xlsx
Figure 2—figure supplement 1
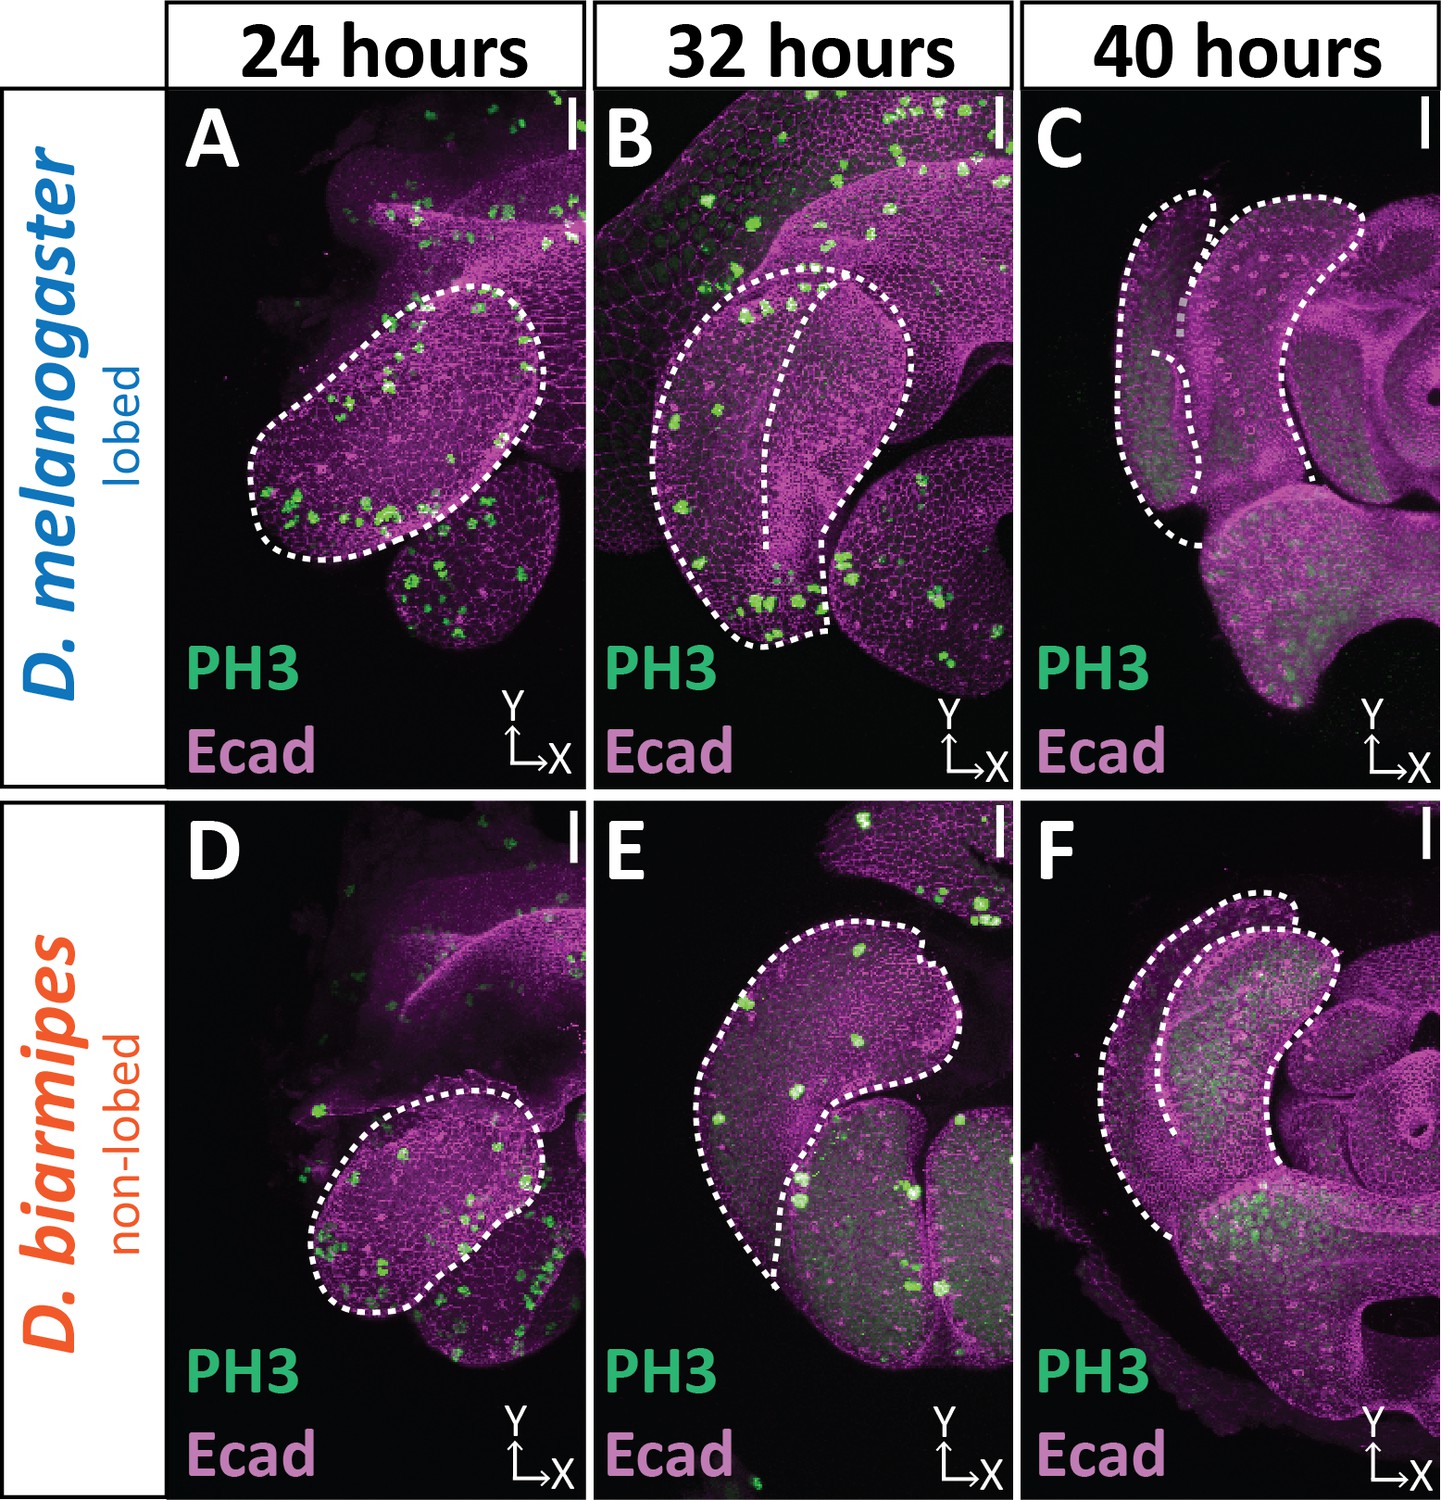
Cell division dynamics do not differ between lobed and non-lobed species.
Developmental time course with Phospho-Histone H3 (Ser 10) (PH3; green) labeling actively dividing cells and E-cadherin (Ecad; magenta) labeling the apical membrane of the tissue. Only superficial slices are shown to avoid fat body signals beneath lateral plate and clasper. n ≥ 3 per each time point. Scale bar, 20 μm. In both D. melanogaster and D. biarmipes cell division is widespread at 24 hr APF (A and D). Cell division is decreased by 32 hr APF (B and E). By 40 hr APF no cell division is observed (C and F).
Figure 2—figure supplement 2
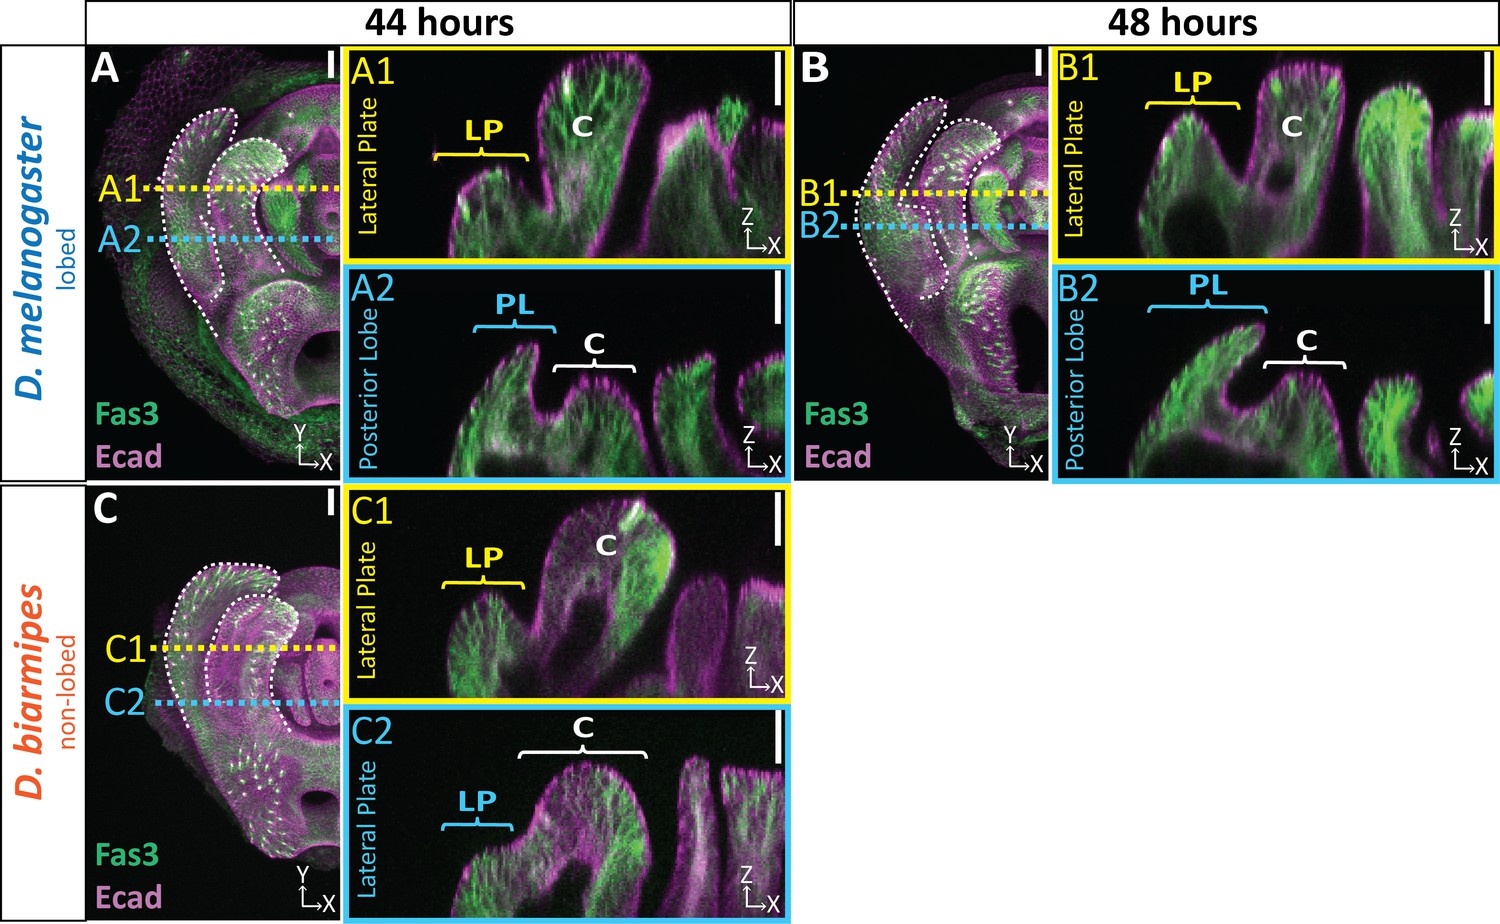
Extended time course of tissue thickness in lobed and non-lobed species.
Extended time course for samples quantified in Figure 2F–G. (A–C) Max and cross-section view of 44 hr APF (A and C) and 48 hr APF (B) genital samples with lateral membrane labeled with Fasciclin III (Fas3; green) and apical membrane labeled with E-cadherin (Ecad; magenta). Location of respective cross sections indicated in yellow for lateral plate (A1–C1) and blue for posterior lobe (D. melanogaster) or equivalent location in non-lobed species (D. biarmipes) (A2–C2). n ≥ 9 per experiment. Scale bar, 20 μm.
Figure 2—video 1
Cell rearrangement during posterior lobe development.
Live imaging of posterior lobe development with GFP tagged armadillo (apical membrane marker) illustrating a cell dropping from the apical surface and a neighboring cell filling in the gap. Imaging starts at approximately 36 hr APF. Due to uncontrolled temperatures during imaging that were cooler than normal growing conditions, the posterior lobe develops slower and the time indicated is not comparable to other images in the manuscript which were all grown under temperature-controlled settings. Based on the thickness of the posterior lobe at the end of the movie, the sample is between 48 and 52 hr APF. Cells were tracked manually and indicated with colored dots. Some dots disappear towards the end of the movie as they become difficult to track due to the signal from cells on the medial side of the posterior lobe.
Figure 3 with 1 supplement
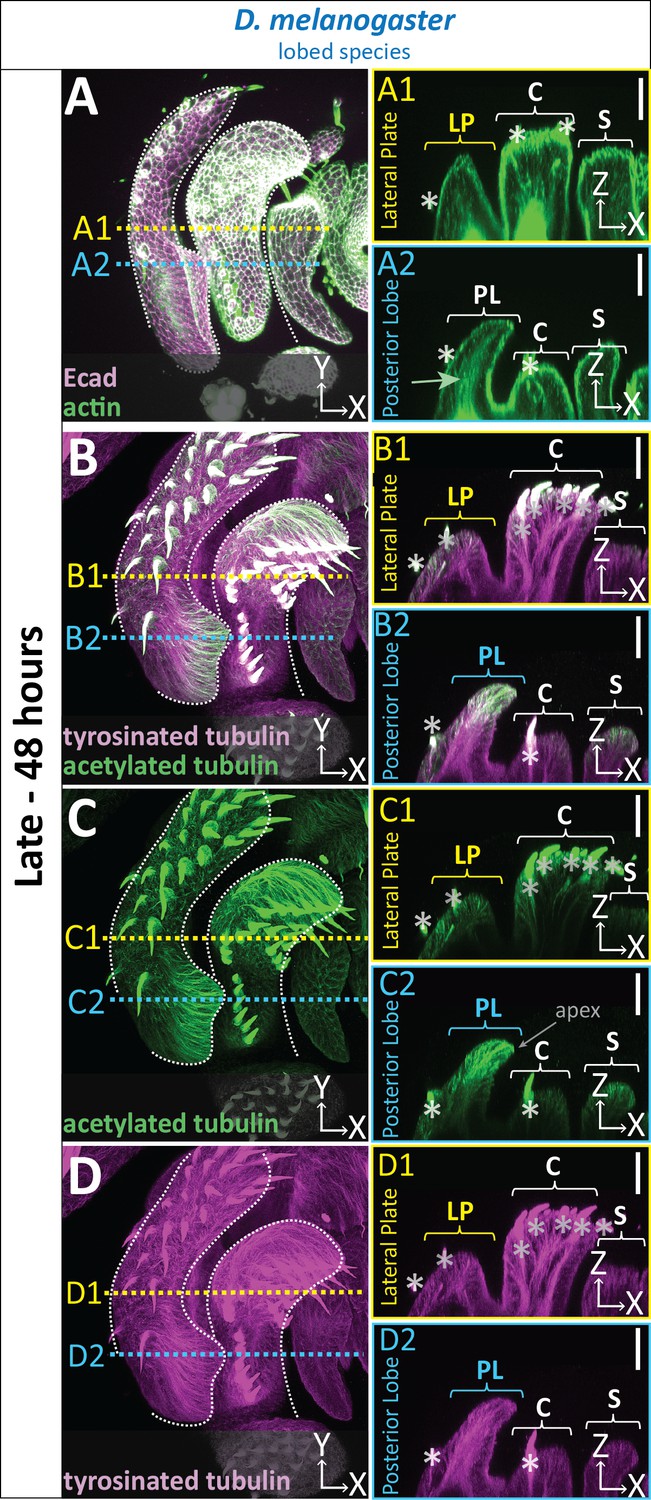
Cytoskeletal components are increased in posterior lobe cells.
(A–D) Maximum projection, and respective cross-sections of late (48 hr APF) genital samples of the lobed species D. melanogaster labeled with F-actin/phalloidin (actin; green) and E-cadherin (Ecad; magenta) (A), acetylated tubulin (green) (B,C), and tyrosinated tubulin (magenta) (B,D). Location of respective cross sections indicated in yellow for lateral plate (A1–D1) and blue for posterior lobe (A2–D2). Cross-sections are maximum projections of a restricted 5.434 μm thick section to provide a complete view of cytoskeletal components along the apico-basal axis. All cross-sections are oriented with apical side at the top and basal side at the bottom. Asterisk identifies bristles which have high levels of F-actin and tubulin. Bright basal signal in A1 and A2 are fat bodies. Bottom layers were removed in panel A to remove fat body signal which overwhelmed other details. (B–D2) Panels C and D show separate channels of panel B. Relevant structures labeled: Posterior lobe (PL), lateral plate (LP), clasper (C), and sheath (S). Scale bar, 20 μm. n ≥ 3 per experiment.
Figure 3—figure supplement 1
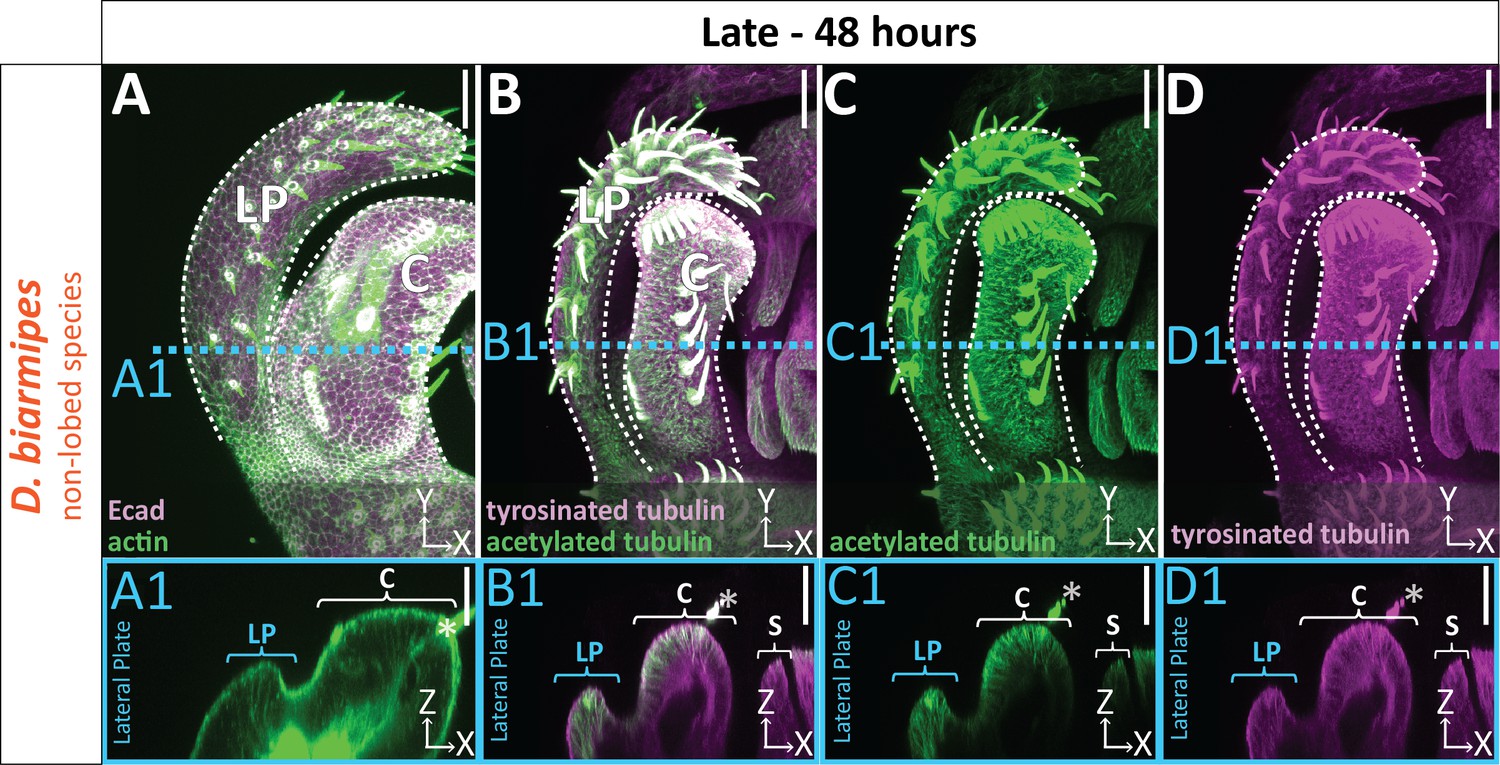
Uniform level of cytoskeletal components in non-lobed species.
(A–D) Max projections of late (48 hr APF) genital samples of non-lobed species D. biarmipes labeled with F-actin/phalloidin (green) and E-cadherin (Ecad; magenta) (A), acetylated tubulin (green) (B,C), and tyrosinated tubulin (magenta) (B,D). Location of respective cross sections indicated in blue for presumptive posterior lobe cells (A1–D1). Cross-sections are maximum projection of a restricted 5.434 μm thick section to display the full view of the cytoskeleton along the apico-basal axis. All cross-sections are oriented with apical side at the top and basal side at the bottom. Asterisk identifies bristles which have high levels of F-actin and tubulin. Bright basal signal in A1 is from fat bodies. Bottom layers were removed in panel A to avoid fat body signal which masked other details. Panels C and D show separate channels of panel B. Relevant structures labeled: Lateral plate (LP), clasper (C), and sheath (S) labeled. Scale bar, 20 μm. n ≥ 3 per experiment.
Figure 4 with 6 supplements
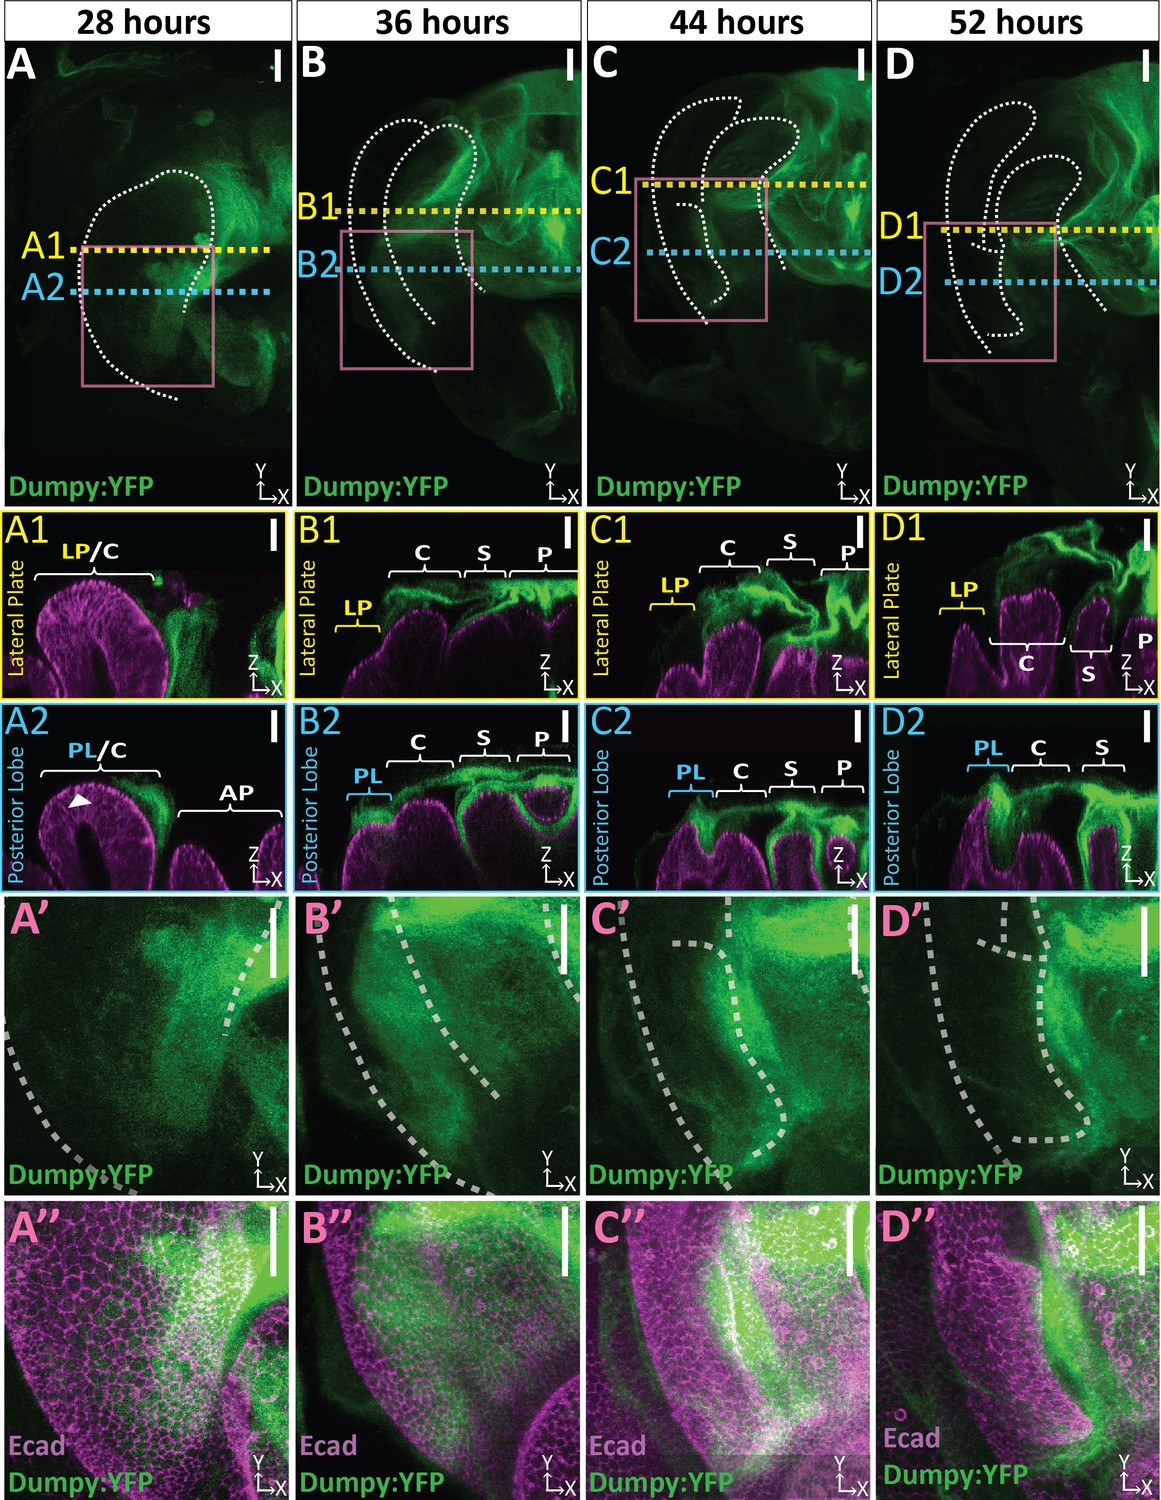
Dumpy deposition is correlated with posterior lobe development.
(A–D) Maximum projection and (A’–B’’) respective zoom, indicated with pink box, labeled with Dumpy:YFP (green) and E-cadherin (Ecad; magenta) for each time point. Location of respective cross sections indicated in yellow for lateral plate (A1–D1) and blue for posterior lobe (A2–D2). Arrowhead in (A2) indicates future posterior lobe cells. Cross-sections are oriented with apical side at the top and basal side at the bottom. Relevant structures labeled: Posterior lobe (PL), lateral plate (LP), clasper (C), sheath (S), and phallus (P). Scale bar, 20 μm. n ≥ 4 per experiment. Images were independently brightened to show relevant structures.
Figure 4—figure supplement 1
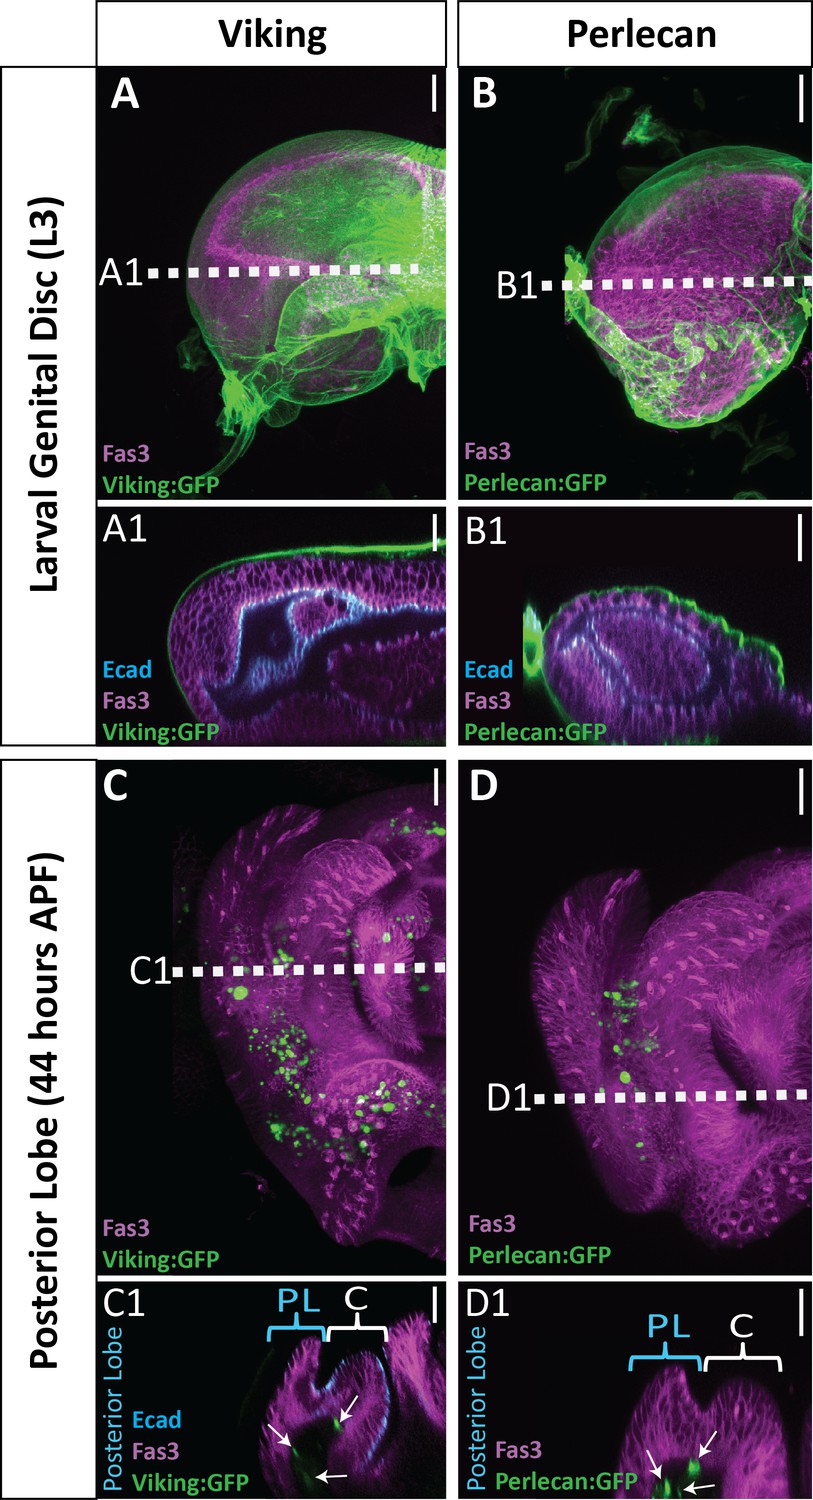
Limited basal ECM present during posterior lobe morphogenesis.
Basal ECM markers Collagen IV (Viking:GFP; green)(A and C) and Perlecan (Perlecan:GFP; green) (B and D) in L3 larval genital disc (A and B) and 44 hr APF genitalia (C and D). Apical membrane labeled with E-cadherin (Ecad; cyan) and lateral membrane labeled with Fasciclin III (Fas3; magenta). Image settings were the same for each marker between larval and pupal samples. Sporadic dots observed are fat bodies (white arrows in cross section), which fill the basal lumen of the pupal genital epithelium. Location of respective cross sections indicated in white. Cross-sections for larval samples are oriented basal sides out, as the disc has not yet everted. Pupal samples are oriented with apical side at the top and basal side at the bottom. Higher amounts of basal ECM are observed in larvae compared to 44 hr APF genital samples. Relevant structures labeled: Posterior lobe (PL) and clasper (C). Scale bar, 20 μm.
Figure 4—figure supplement 2
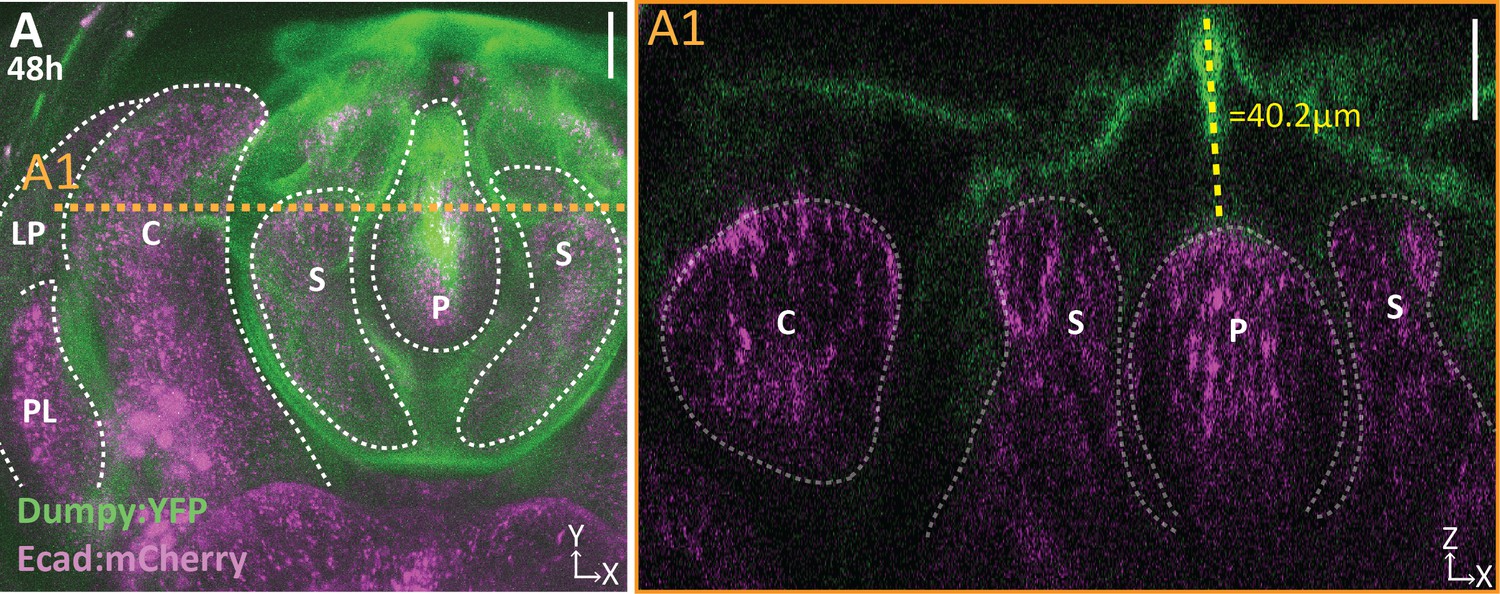
Dumpy extends above the apical surface of the phallus.
(A) Projection of Dumpy:YFP (green) and E-cadherin:mCherry (Ecad:mCherry; magenta) imaged live at 48 hr APF. Location of respective cross sections indicated in orange. (A1) Cross section showing extent of Dumpy:YFP observed above the surface of the genitalia. Relevant structures labeled: Posterior lobe (PL), lateral plate (LP), clasper (C), sheath (S), and phallus (P). Scale bar, 20 μm. n = 3.
Figure 4—figure supplement 3
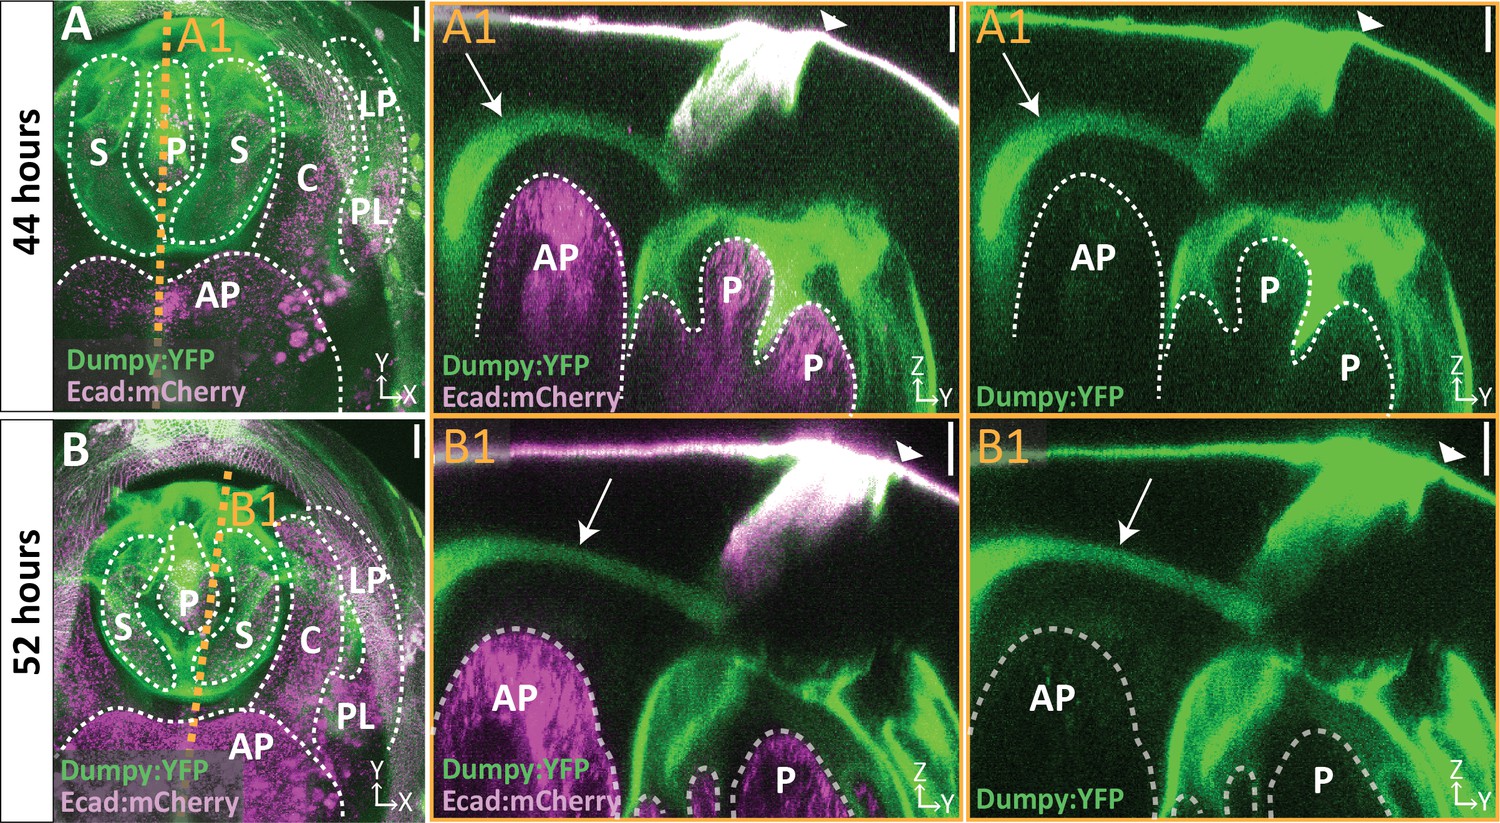
A bundle of Dumpy connects the genitalia to the pupal cuticle membrane that encases the developing pupa.
(A–B) Live imaging of Dumpy:YFP (green) and Ecadherin:mCherry (Ecad:mCherry; magenta) at respective time points. Location of respective cross sections indicated in orange. (A1–B1) Cross-sections are max projection of a 4.94 μm (A1) and 1.73 μm (B1) thick section to show the full bundle (arrow) and its connection to the cuticle (arrowhead) and anal plate. All cross-sections are oriented with apical side at the top and basal side at the bottom. Relevant structures labeled: Posterior lobe (PL), lateral plate (LP), clasper (C), sheath (S), phallus (P), and anal plate (AP). Scale bar, 20 μm. n = 1 per each time point.
Figure 4—figure supplement 4
Weak aECM connections extend to the lateral plate.
(A–D) Brightened images of respective cross sections from Figure 2 of lateral plate (A1–D1) in yellow and posterior lobe in blue (A2–D2). Cross-sections are oriented with apical side at the top and basal side at the bottom. Relevant structure labeled: Posterior lobe (PL), lateral plate (LP), clasper (C), sheath (S), and phallus (P). Scale bar, 20 μm. n ≥ 4 per experiment. Images were overexposed to the same extent to show relevant structures.
Figure 4—video 1
Three-dimensional structure of Dumpy on developing genitalia.
Part 1 of the movie shows 3D rotation of 52 hr APF genital sample with Dumpy:YFP (green) and E-cadherin (magenta) labels. Part 2 of the movie shows a cross-sectional view starting at the ventral side of the posterior lobe and moving towards the dorsal side, and part three shows the same view, but starting at the ventral tip of the lateral plate and moving towards the ventral side of the posterior lobe. In the upper-right corner, there is a guide that roughly depicts the running location of the cross section. Cross-sections are oriented with apical side at the top and basal side at the bottom. Relevant structures labeled: Posterior lobe (PL), lateral plate (LP), clasper (C), sheath (S), and phallus (P).
Figure 4—video 2
A bundle of Dumpy connects the genitalia to the surrounding cuticle.
3D rotation of Dumpy:YFP (green) and Ecadherin:mCherry (magenta) imaged live at 44 hr APF. Relevant structures labeled: Posterior lobe (PL), lateral plate (LP), clasper (C), sheath (S), phallus (P), and anal plate (AP).
Figure 5 with 3 supplements
aECM is spatially expanded in lobed species compared to non-lobed species.
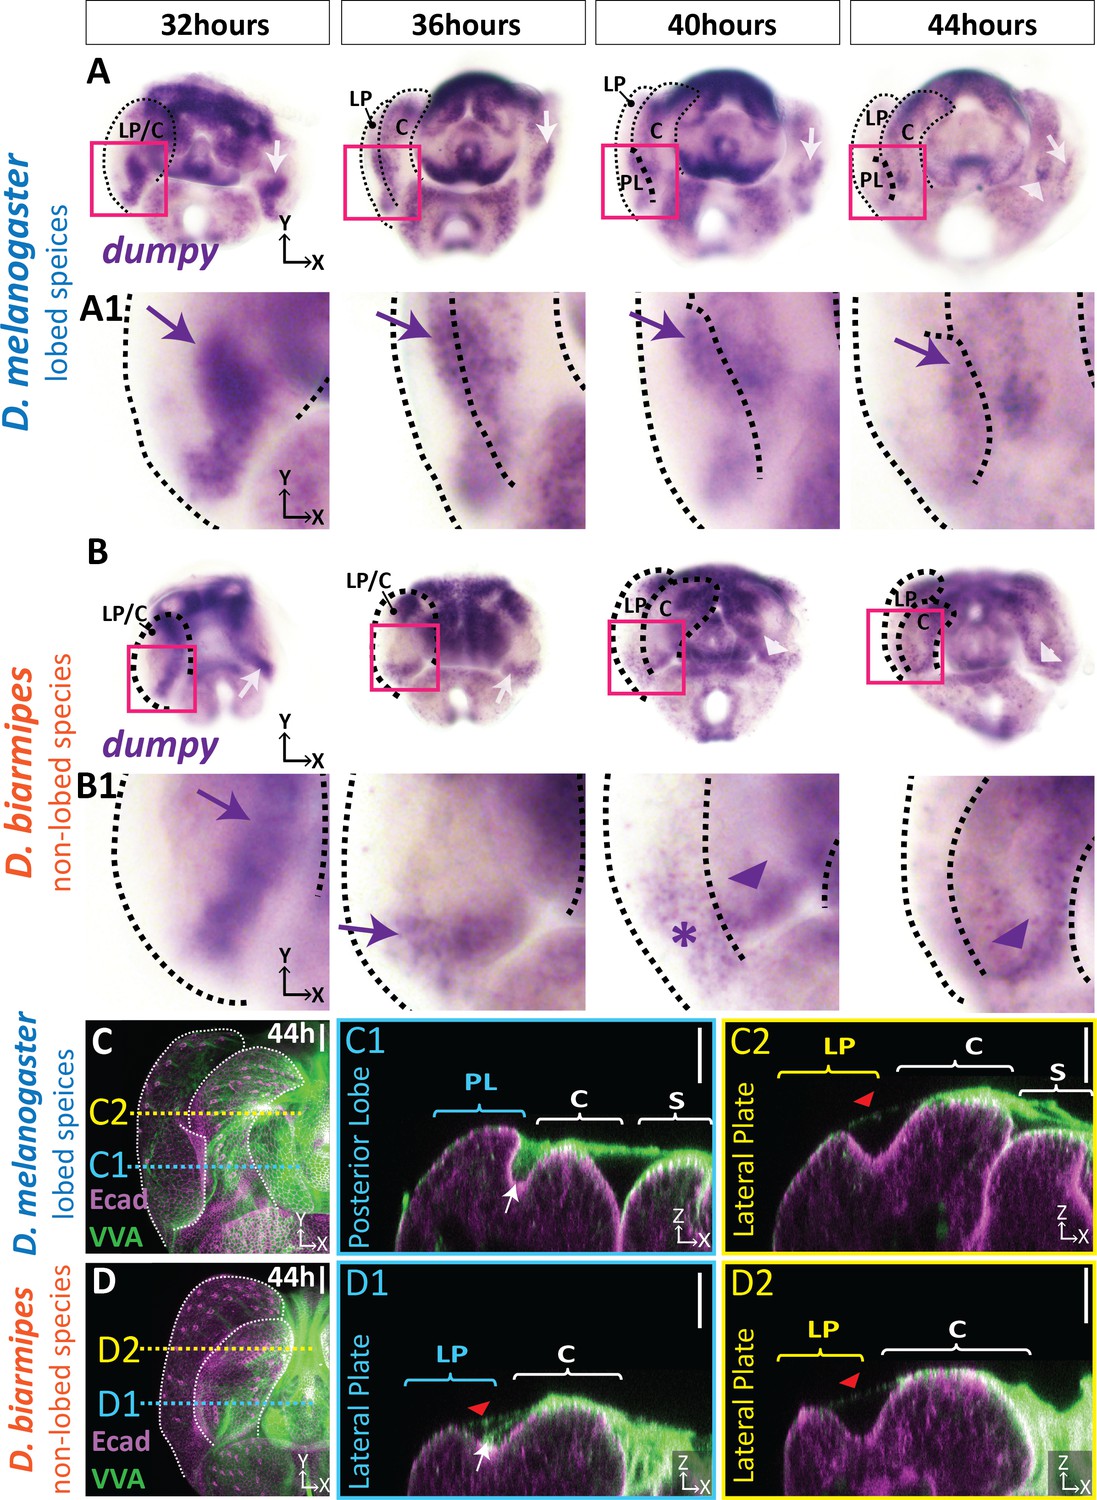
(A–B) in situ hybridization for dumpy mRNA in the lobed species D. melanogaster (A) and the non-lobed species D. biarmipes (B). Pink box outlines location of zoomed in images presented in A1 and B1. Relevant expression highlighted with arrow (purple/white) for strong expression, asterisk for weak expression, and arrowhead for clasper-specific expression. Expression observed in D. melanogaster at 44 hr APF is not present in all samples (see Figure 5—figure supplement 1). (C–D) aECM is labeled with Vicia villosa lectin (VVA; green) and apical membrane labeled with E-cadherin (Ecad; magenta) at 44 hr APF in D. melanogaster (C) and D. biarmipes (D). Location of respective cross sections indicated in yellow for lateral plate (C2–D2) and blue for posterior lobe in D. melanogaster (C1) and corresponding position in D. biarmipes (D1). All cross-sections are oriented with apical side at the top and basal side at the bottom. White arrows highlight the crevice localization between the lateral plate and clasper, which the aECM fills in D. melanogaster (C1), but only a weakly stained strand-like structure of aECM appears in D. biarmipes (D1). Tendrils of aECM can also be observed connecting to the lateral plate in both species (red arrowheads). Relevant structures labeled: Posterior lobe (PL), lateral plate (LP), clasper (C), sheath (S), and phallus (P). Scale bar, 20 μm. n = at least five per experiment.
Figure 5—figure supplement 1
aECM spatially expanded in lobed species compared to non-lobed species.
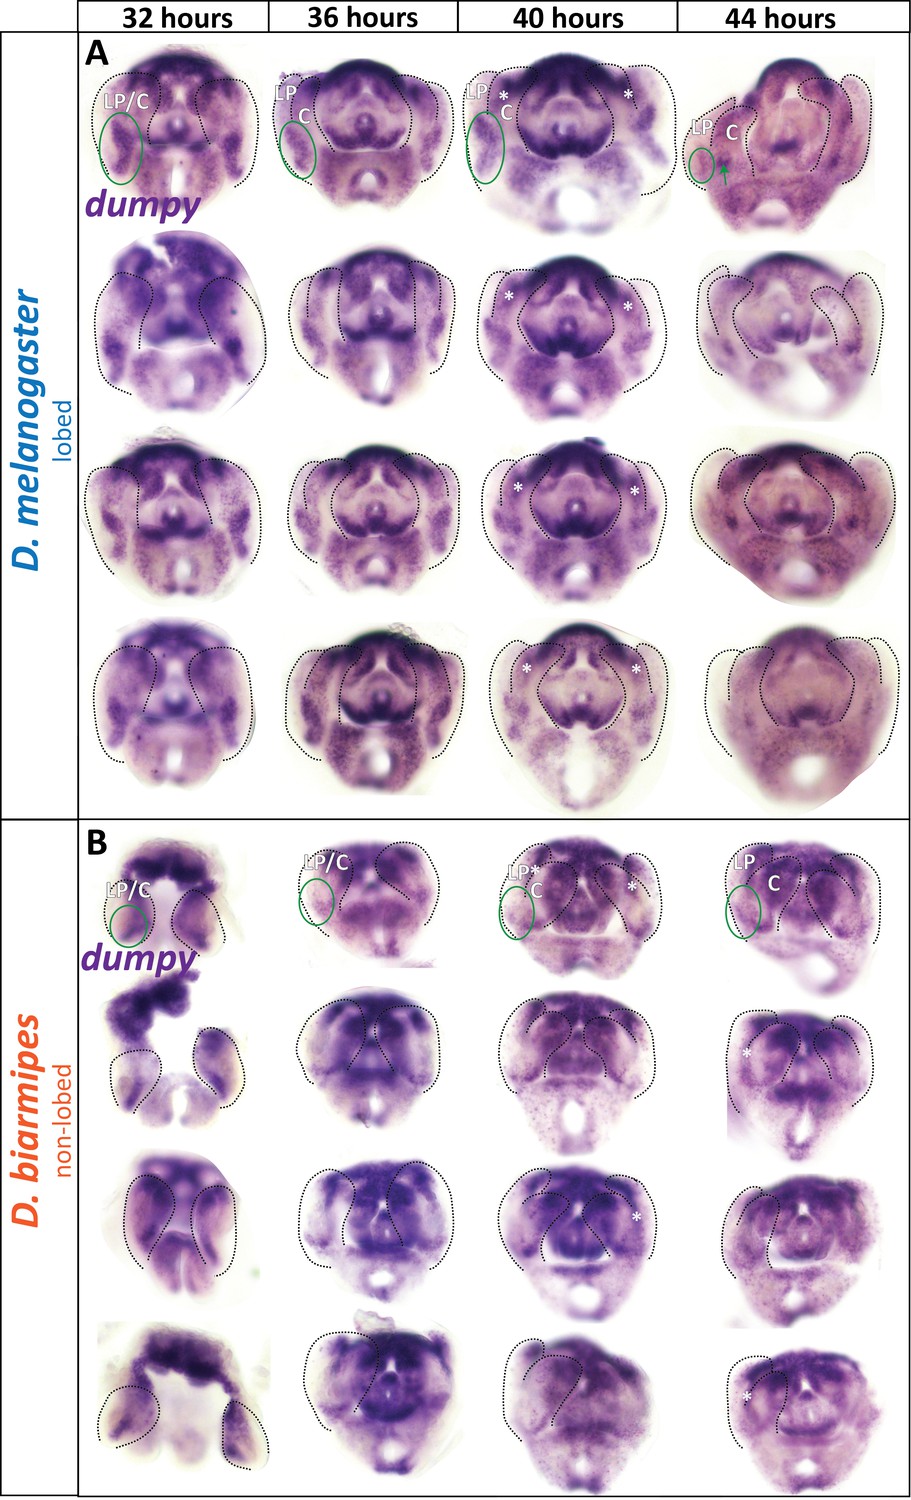
(A–B) Additional in situ hybridization samples for dumpy mRNA in lobed species D. melanogaster (A) and non-lobed species D. biarmipes (B) to show full range of expression observed in experiment. Outlines are approximations as details of structures. Samples without outlines on one side are due to the tissue being damaged on that side. Green circle in first image highlights relevant location at the base of the lateral plate, but not included in the remaining images to leave images unobstructed. Asterisk indicates the expression is deep in the sample and not expressed in lateral plate or clasper cells. n = 4 per experiment.
Figure 5—figure supplement 2

VVA staining mimics Dumpy:YFP localization.
(A) Dumpy:YFP (green) or (B) VVA (green) localization with apical membrane labeled with E-cadherin (Ecad; magenta) at 44 hr APF in D. melanogaster. Gross similarities in the structure of Dumpy:YFP and VVA can be observed across the genitalia (A’ and B’). In addition, both Dumpy:YFP and VVA can be observed spanning from the clasper to the sheath (arrow), creating an region where neither is present (asterisks). Some tissue deformation occurs in the VVA samples due to treatment with trichloroacetic acid, which is used to help precipitate the sugar molecules attached to the ECM and give a more refined appearance. All cross-sections are oriented with apical side at the top and basal side at the bottom. Relevant structures labeled: Posterior lobe (PL), clasper (C), and sheath (S), Scale bar, 20 μm. n = at least five per experiment.
Figure 5—figure supplement 3
aECM is expanded in the lobed D. sechellia but not in the non-lobed species D. ananassae.
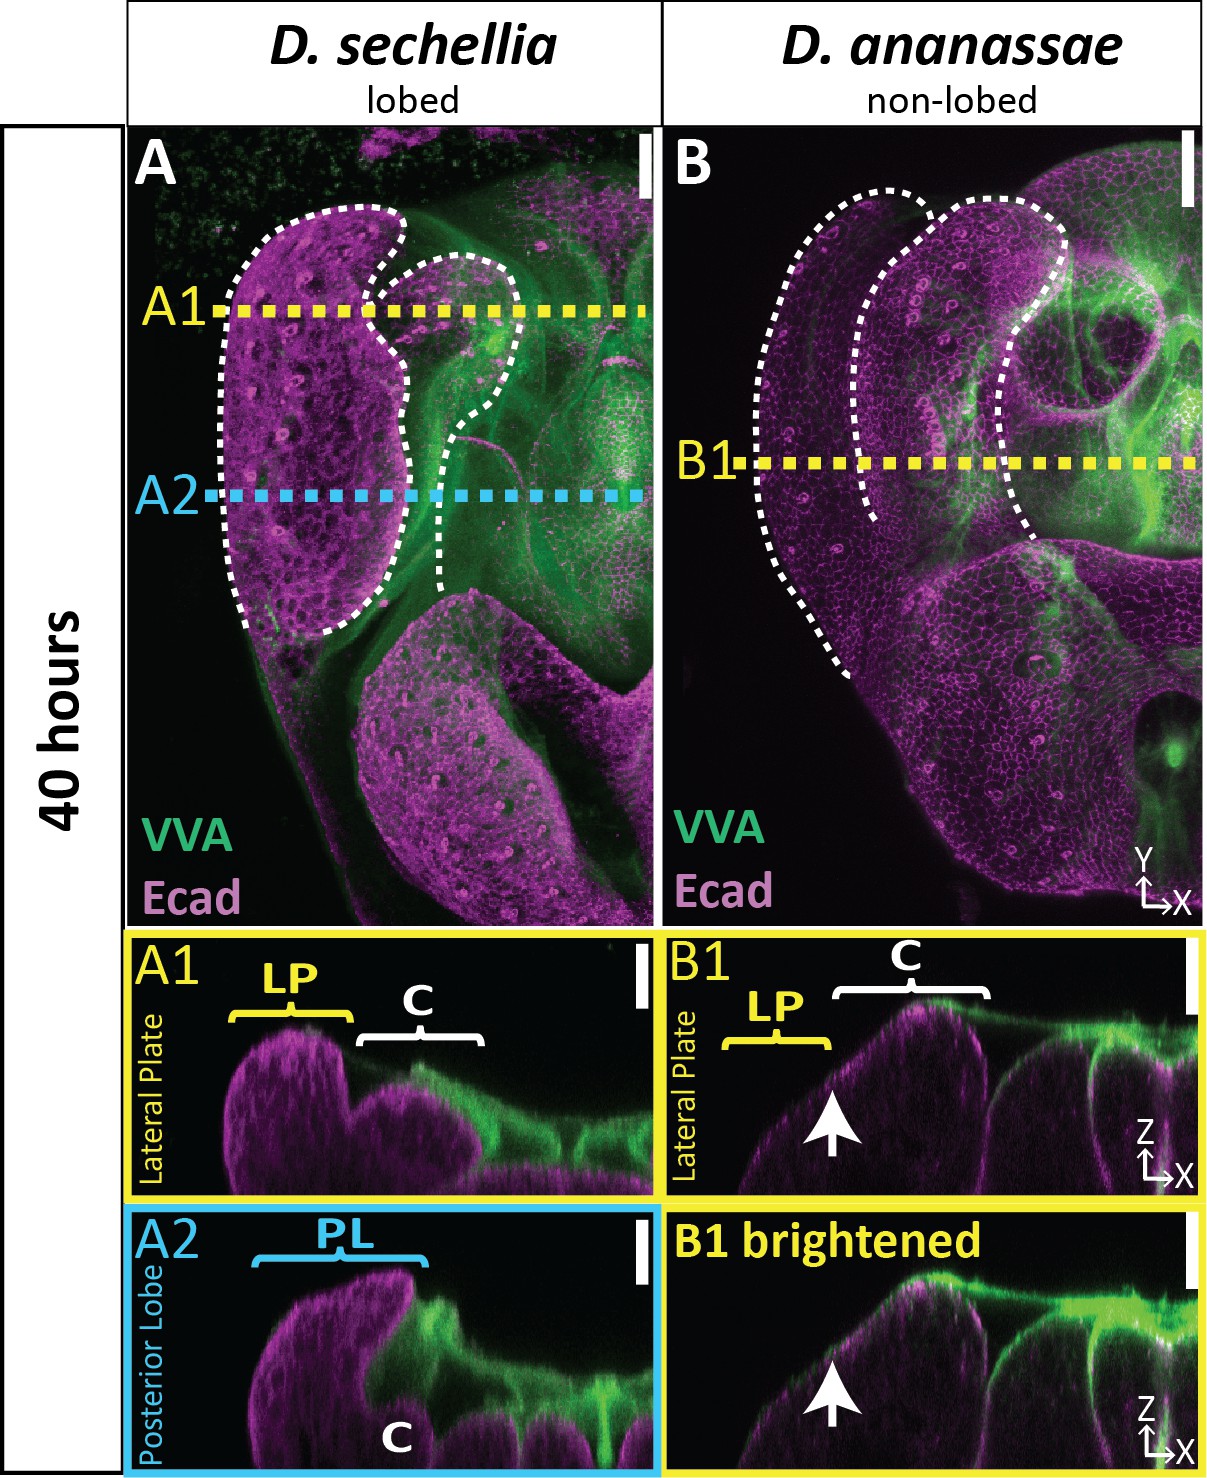
(A–B) aECM labeled with VVA (green) and apical membrane labeled with E-cadherin (Ecad; magenta) at 40 hr APF in the lobed species D. sechellia (A) and the non-lobed species D. ananassae (B). Location of respective cross-sections indicated in yellow for lateral plate and blue for posterior lobe. In D. sechellia a ‘strand’ of VVA can be observed connecting the clasper to the lateral plate (A1), in addition to a large accumulation of VVA associated with the poster lobe (A2), similar to what is observed in D. melanogaster. (B1) Top cross-section displayed with normal brightness to show details and bottom cross-section has been brightened to show where all populations of aECM are located. All cross-sections are oriented with apical side at the top and basal side at the bottom. White arrow highlights the ‘crevice’ between the lateral plate and clasper, which is not pronounced at 40 hr APF in D. ananassae. Relevant structures labeled: lateral plate (LP), posterior lobe (PL), and clasper (C). Scale bar, 20 μm. n = at least two per experiment.
Figure 6 with 1 supplement
Dumpy is required for proper posterior lobe formation.
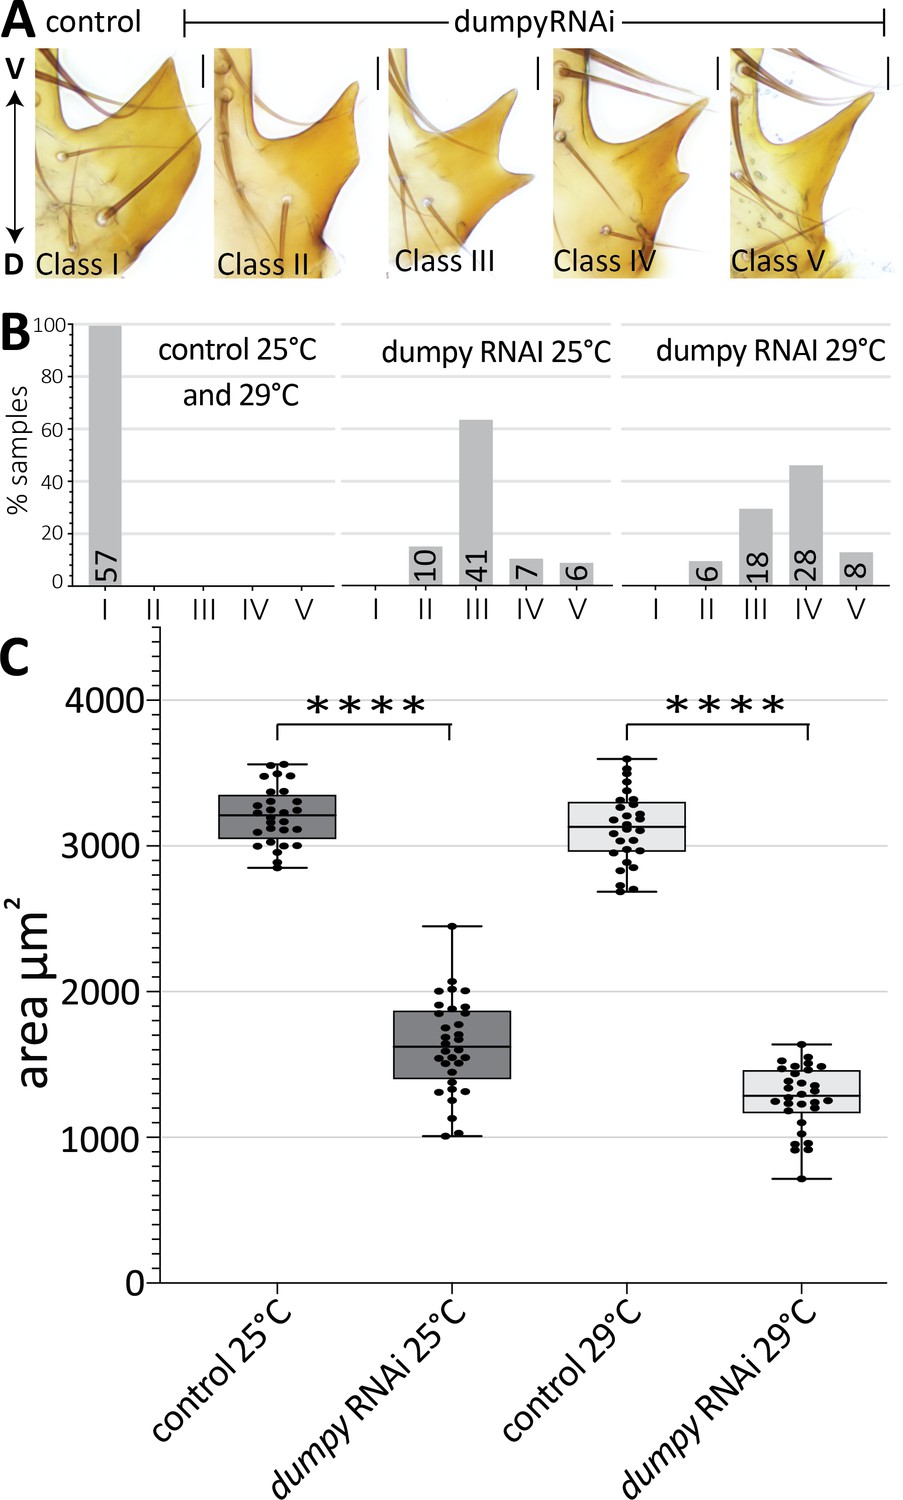
(A) Range of adult posterior lobe phenotypes produced by control (mCherry RNAi) and dumpy RNAi animals. Phenotypic classes defined from wild type (I) to most severe (V). Scale bar, 20 μm. (B) Percentage of posterior lobes in each class for control, dumpy RNAi at 25°C, and dumpy RNAi at 29°C. (C) Quantification of area of adult posterior lobes of mCherry RNAi (control) and dumpy RNAi at 25°C and 29°C. Statistical significance is indicated (unpaired t-test; ****p≤0.0001).
-
Figure 6—source data 1
Individual measurements of dumpy-RNAi adult cuticle phenotypes.
- https://cdn.elifesciences.org/articles/55965/elife-55965-fig6-data1-v2.xlsx
Figure 6—figure supplement 1
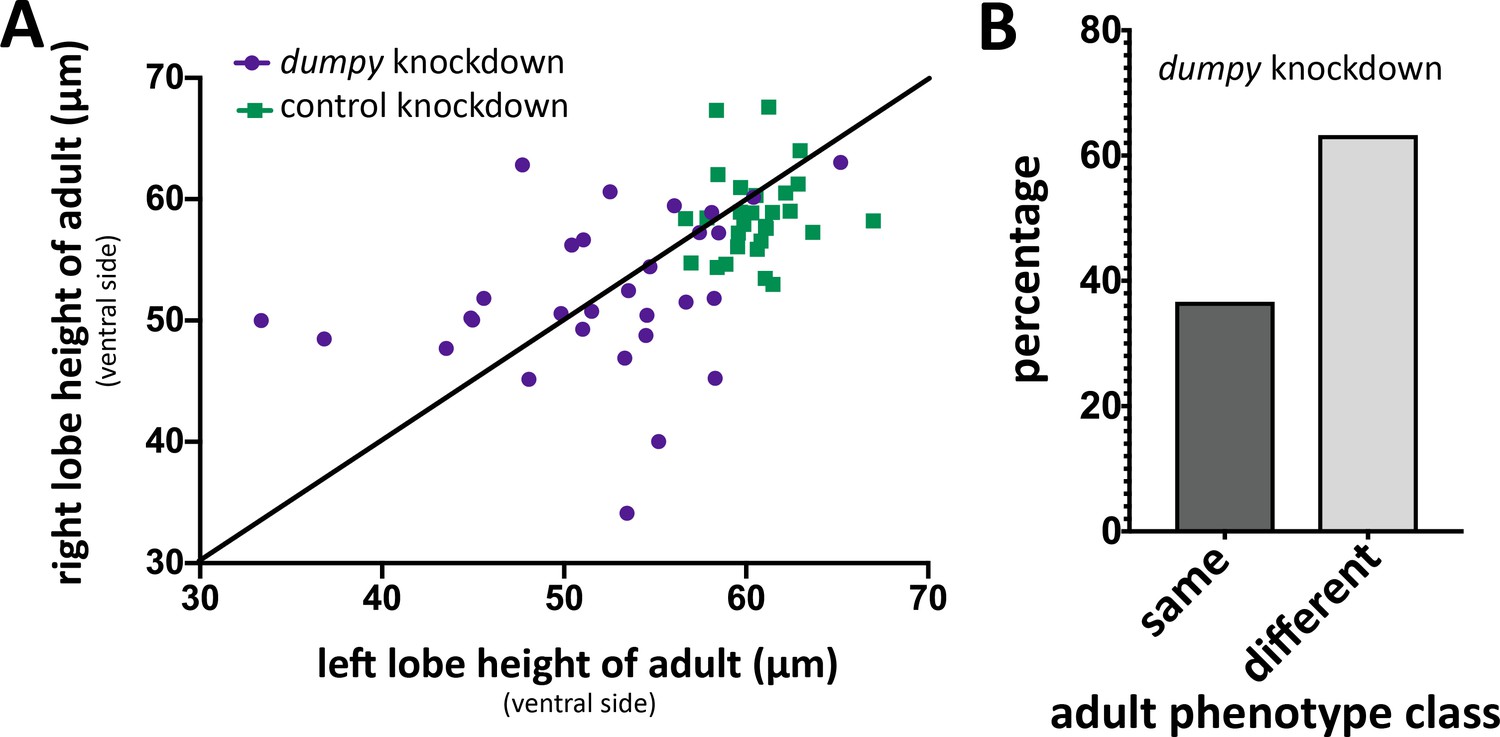
Increased left-right variability of posterior lobe phenotype upon dumpy knockdown.
(A) Comparison of dumpy knockdown (purple circles) and control knockdown (green squares) of left and right adult posterior lobes in single individuals grown at 29°C measuring height at the ventral side of the posterior lobe (single individual represented as a single dot or square). Black line represents predicted perfect correlation in height. dumpy knockdown individuals appear less correlated, indicating that the height of the posterior lobe varies more in the dumpy knockdown. (B) Percentage of dumpy knockdown individuals plotted in (A) in which both posterior lobes were categorized into the same or different phenotypes classes (as defined in Figure 6).
Figure 7 with 3 supplements
Correlation between the deposition of Dumpy and knockdown phenotype.
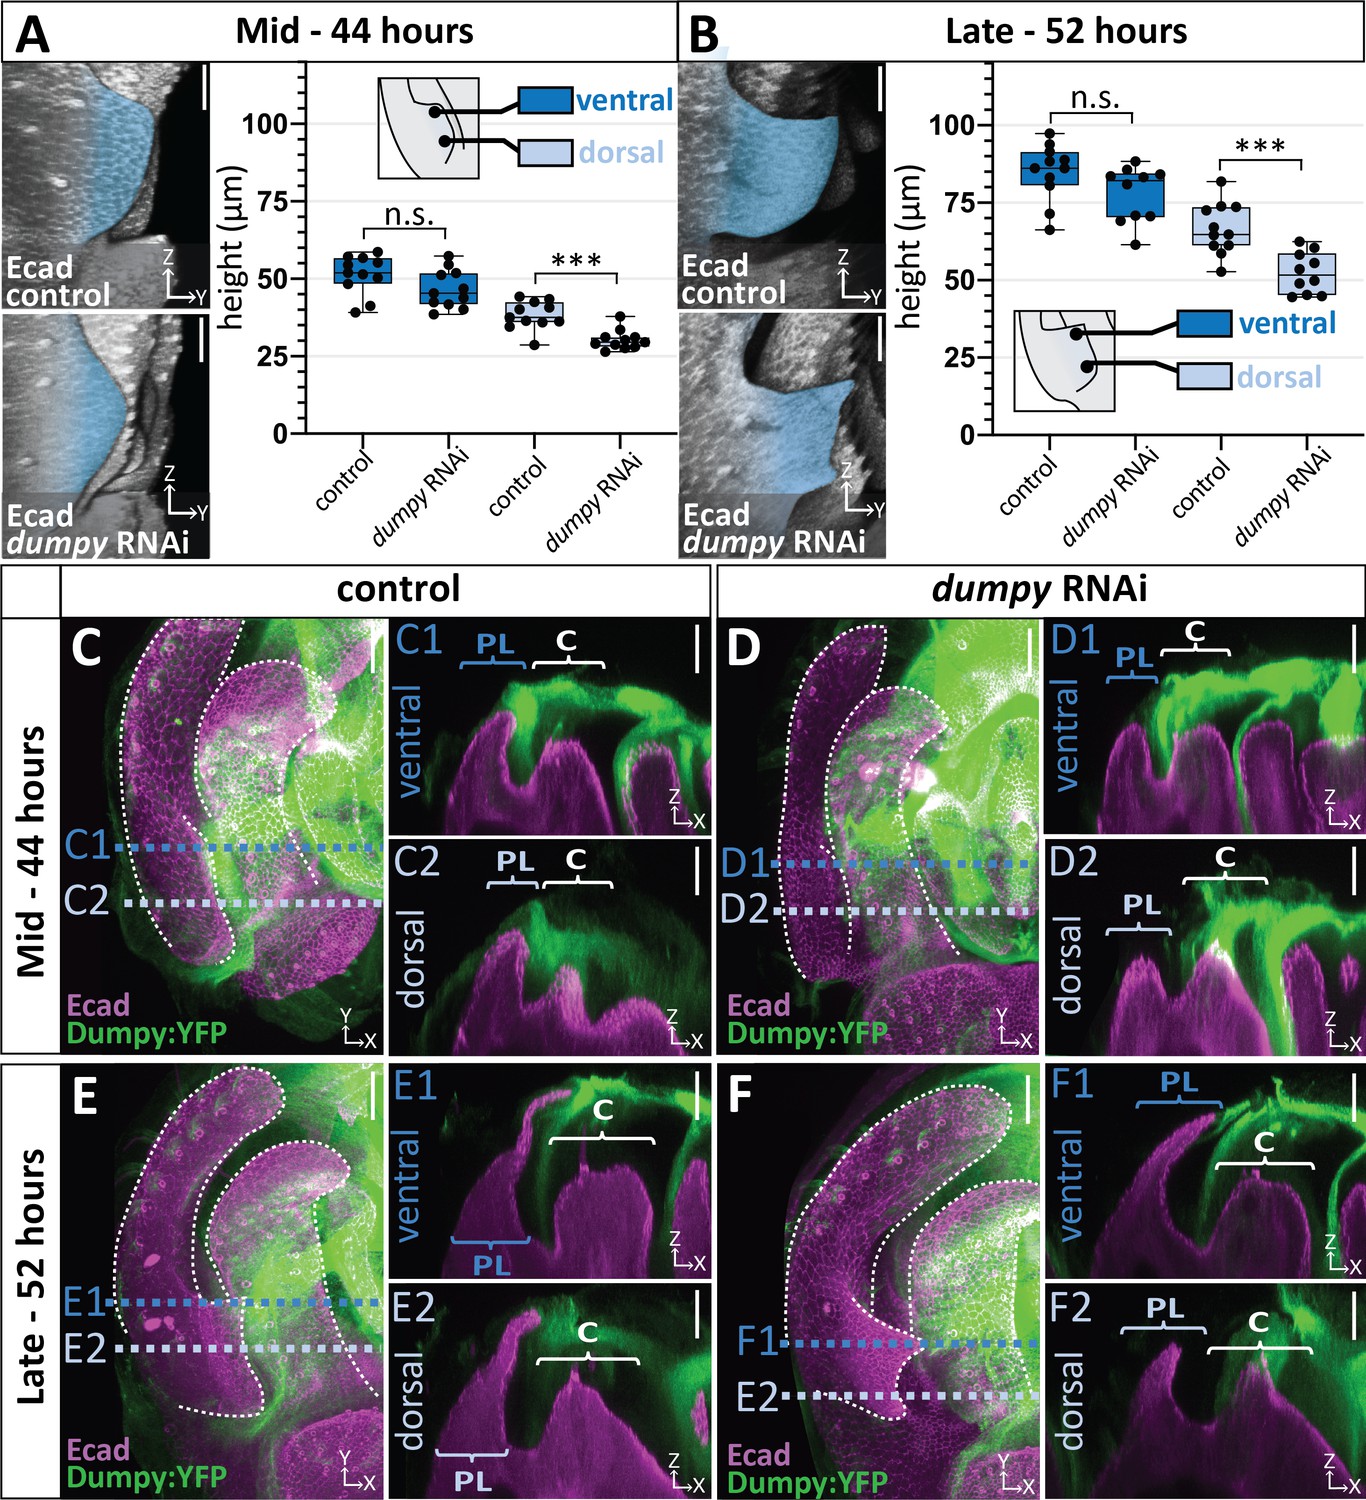
(A–B) Comparison of mCherry RNAi (control) and dumpy RNAi at 44 hr APF (A) and 52 hr APF (B). Images are rotated in 3D to visualize the full shape of the posterior lobe labeled with E-cadherin (Ecad). Quantification of tissue height at the ventral tip (dark blue) and dorsal base (light blue) of the posterior lobe. Cartoon represents relative locations of cross-sections used for tissue thickness measurements. Individual data points presented; n = at least 10 per time point. The ventral tip is defined as the location where the posterior lobe is at its maximum height. The base was determined by moving 19.76 μm dorsally from the ventral tip. Statistical significance for each time point is indicated (unpaired t-test; ***p≤0.001; n.s. = not significant p≥0.05). (C–F) Comparison of mCherry RNAi (control) (C and E) and dumpy RNAi (D and F) at 44 hr APF and 52 hr APF labeled with with Dumpy:YFP (Green) and E-cadherin(Ecad; Magenta). GFP antibody was used to increase YFP signal. All cross-sections are oriented with apical side at the top and basal side at the bottom. Relevant structures labeled: Lateral plate (LP) posterior lobe (PL), and clasper (C). Cross-sections are max projections of 5.434 μm sections to show full Dumpy connection. Images were independently brightened to show relevant structures. Scale bar, 20 μm. n = at least five per experiment.
-
Figure 7—source data 1
Individual measurements of dumpy-RNAi effects on the posterior lobe during its development.
- https://cdn.elifesciences.org/articles/55965/elife-55965-fig7-data1-v2.xlsx
Figure 7—figure supplement 1
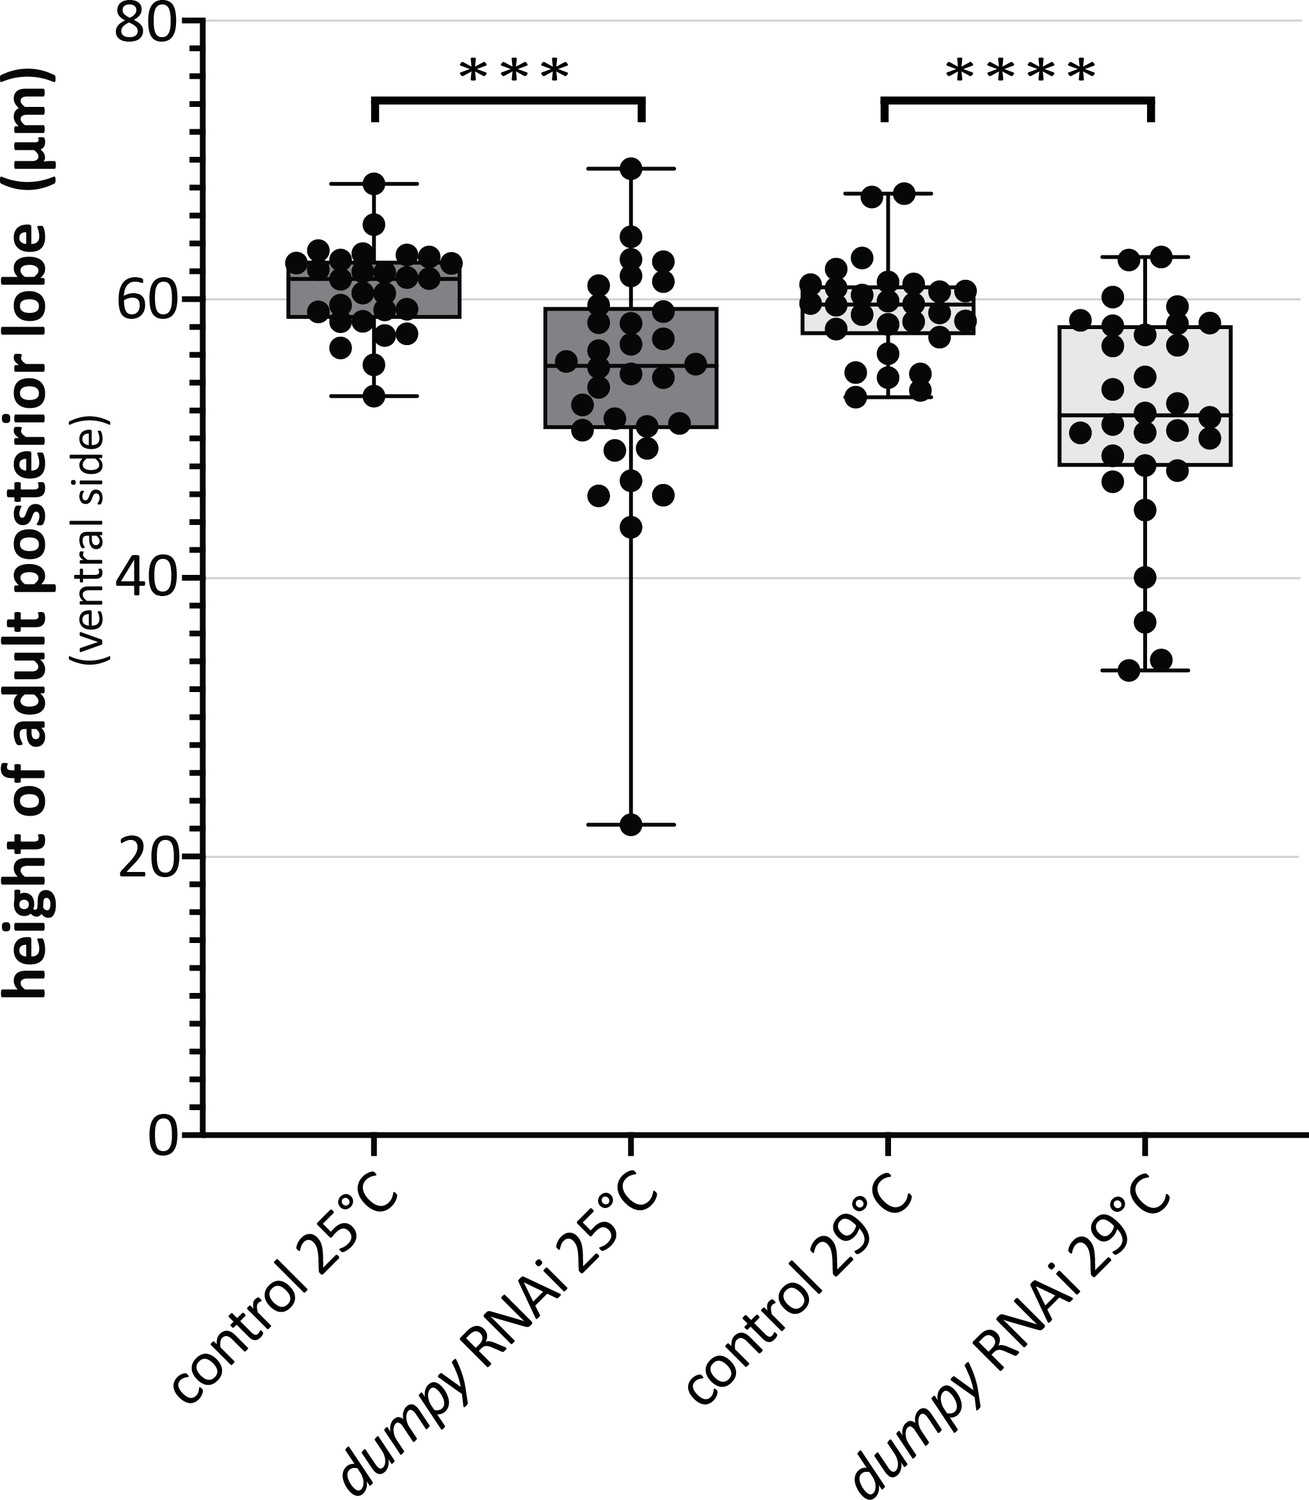
Variability in height of adult posterior lobe in dumpy knockdown.
Comparison of mCherry RNAi (control) and dumpy RNAi adults. Quantification of height of cuticle at the ventral side of the posterior lobe. (unpaired t-test; ***p≤0.001; ****p≤0.0001; n ≥ 28).
Figure 7—figure supplement 2
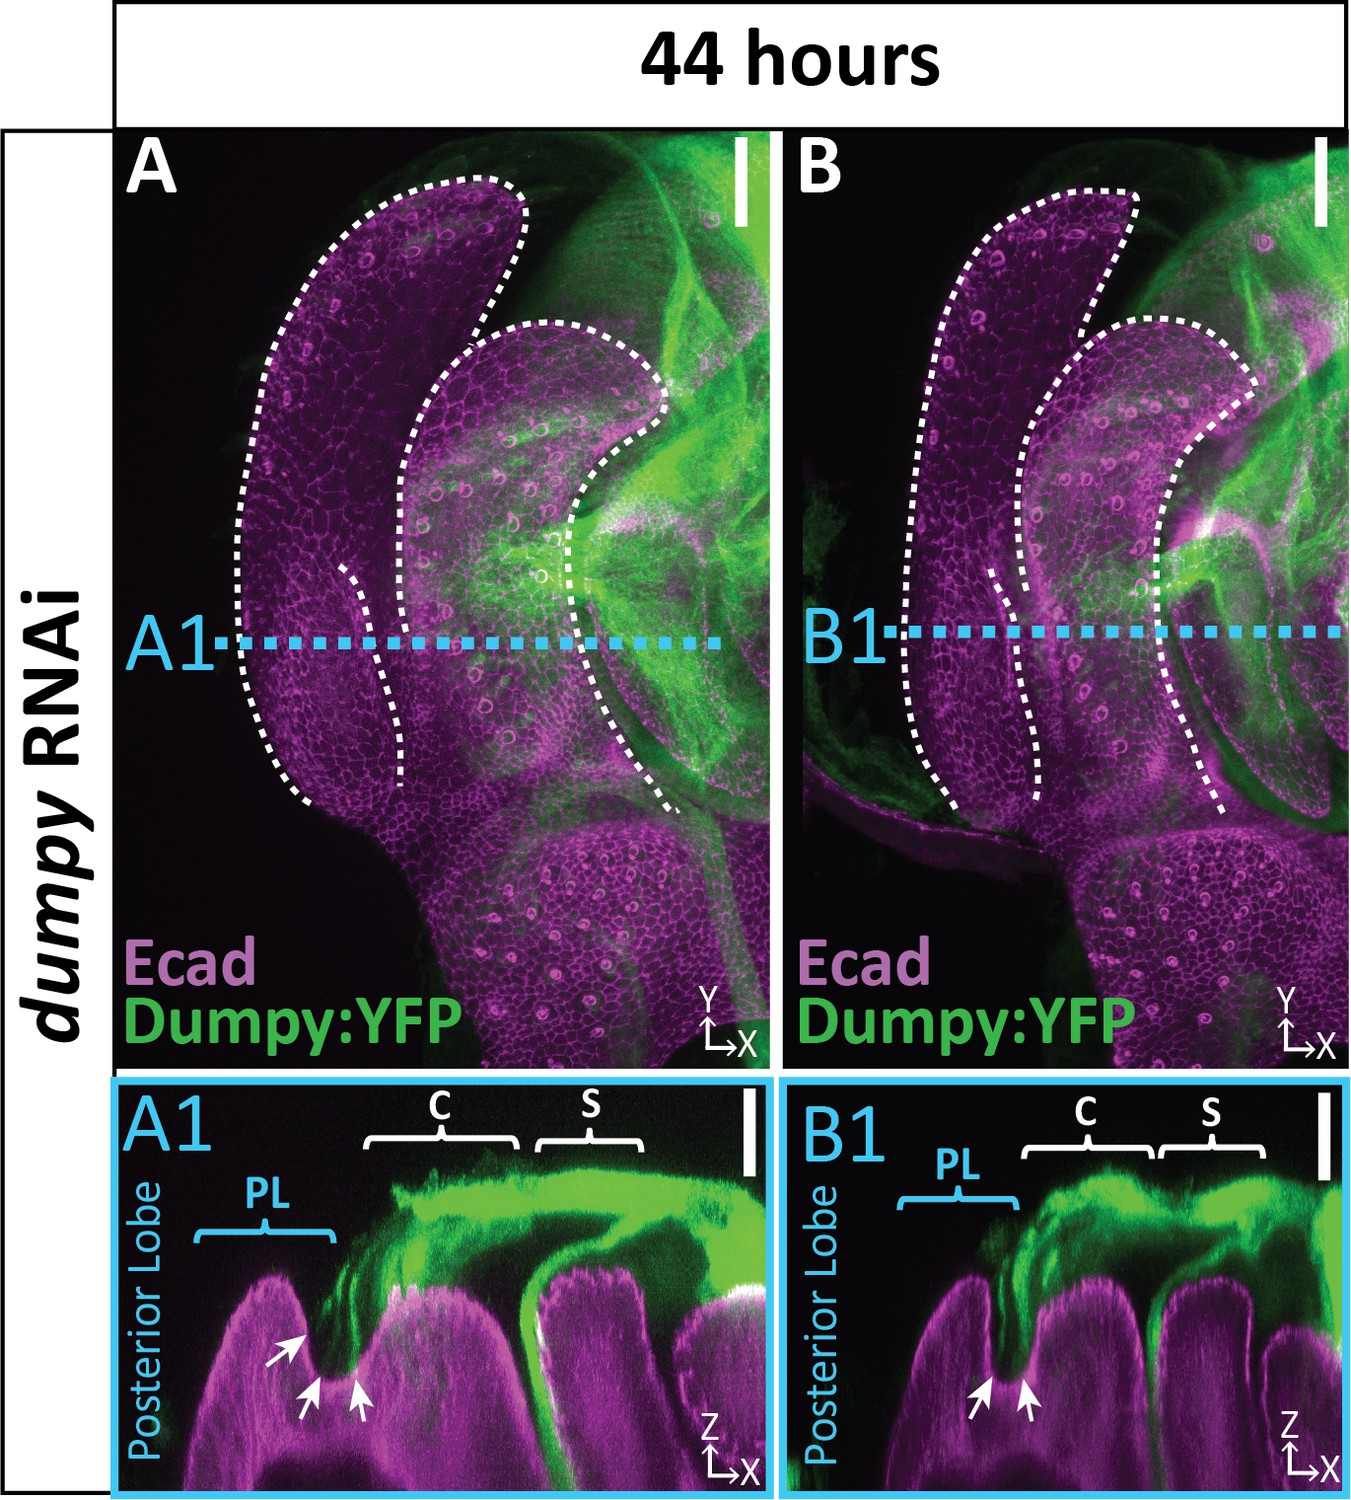
Remaining strands of Dumpy in dumpy knockdown.
(A and B) dumpy RNAi at 44 hr APF with Dumpy:YFP (green) and apical membrane labeled with E-cadherin (Ecad; magenta) showing strands of Dumpy connecting to the crevice between the lateral plate and clasper (arrow). Relevant structures labeled: Lateral plate (LP) posterior lobe (PL), and clasper (C). Cross-sections are max projection of 5.434 μm section to show full Dumpy connection. Scale bar, 20 μm.
Figure 7—figure supplement 3
Correlation between VVA signal and dumpy knockdown phenotype.
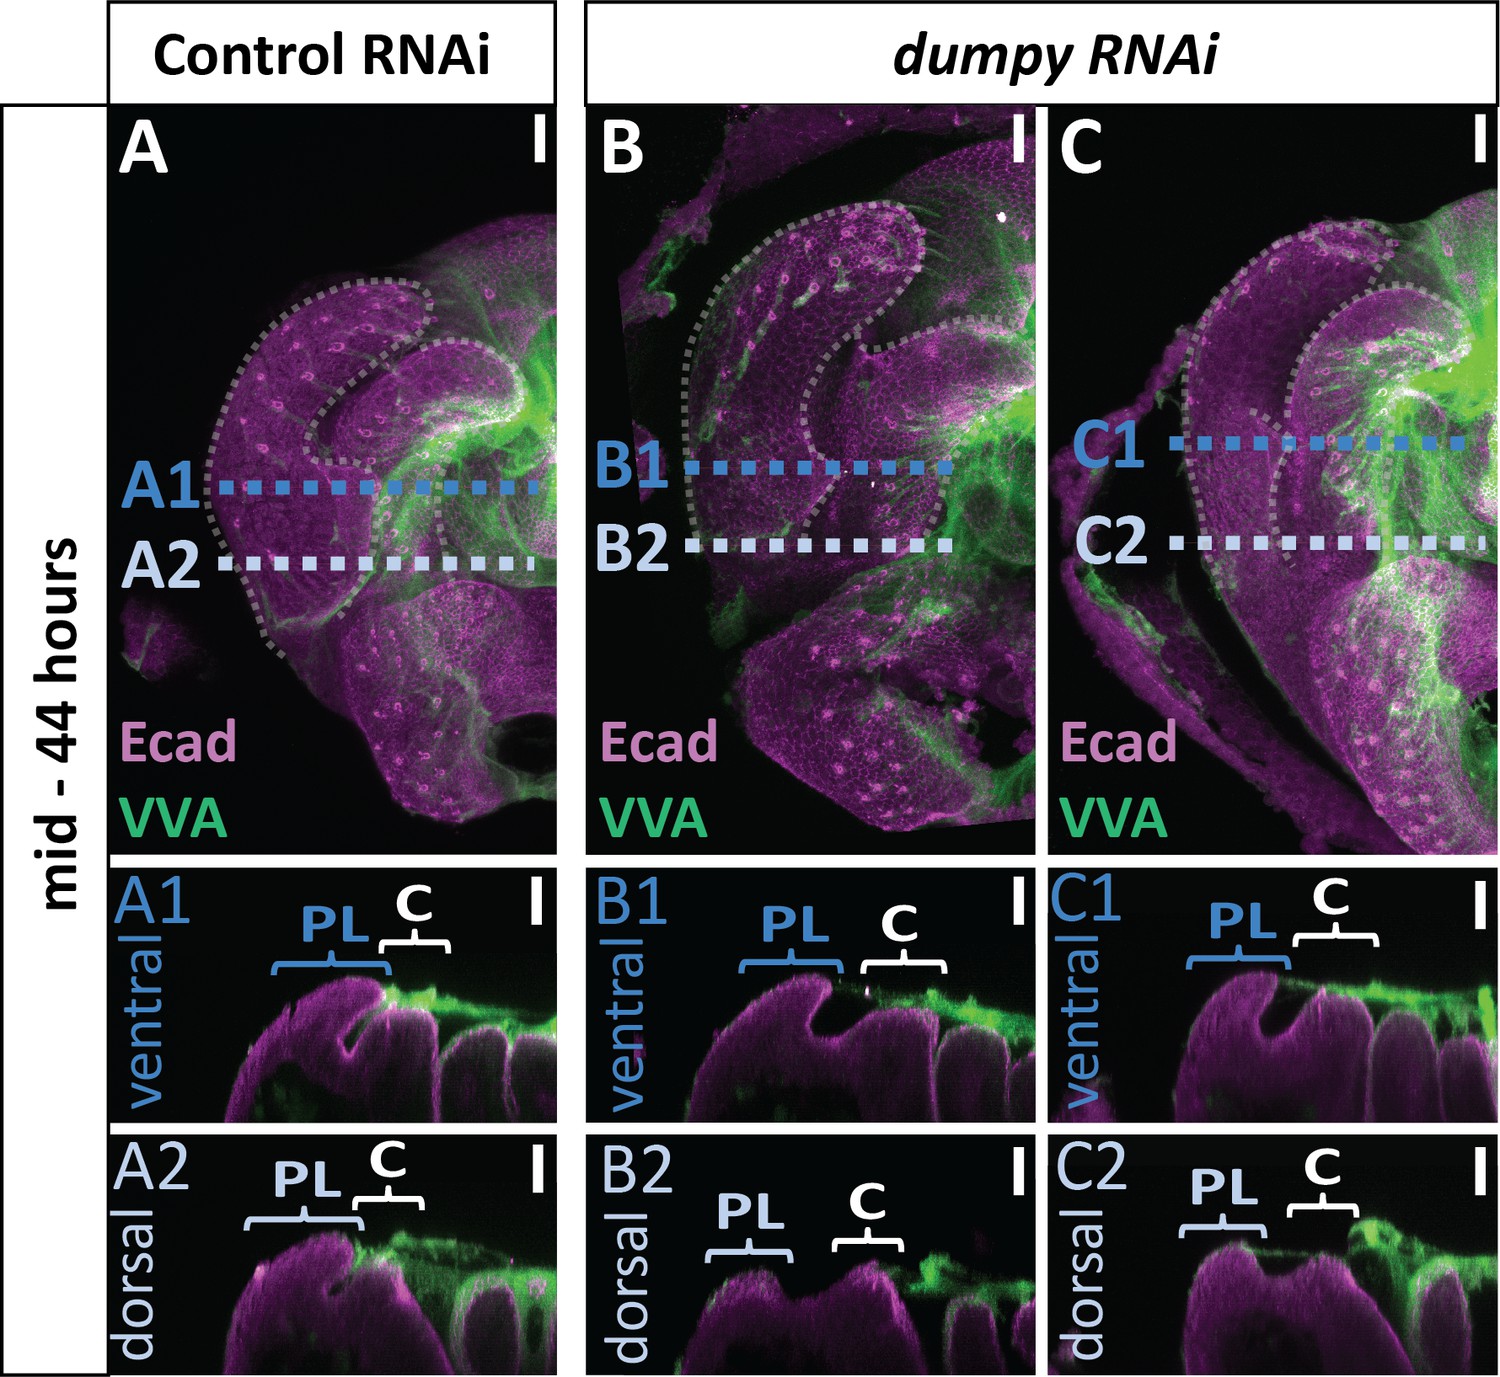
Comparison of mCherry RNAi (control) (A) and dumpy RNAi (B and C) at 44 hr APF with VVA (Green) and E-cadherin (Ecad; Magenta). All cross-sections are oriented with apical side at the top and basal side at the bottom. Relevant structures labeled: posterior lobe (PL) and clasper (C). Cross-sections are max projections of 5.434 μm sections to show full Dumpy connection. Images were independently brightened to show relevant structures. Scale bar, 20 μm. n = 3 per experimental condition.
Figure 8 with 1 supplement
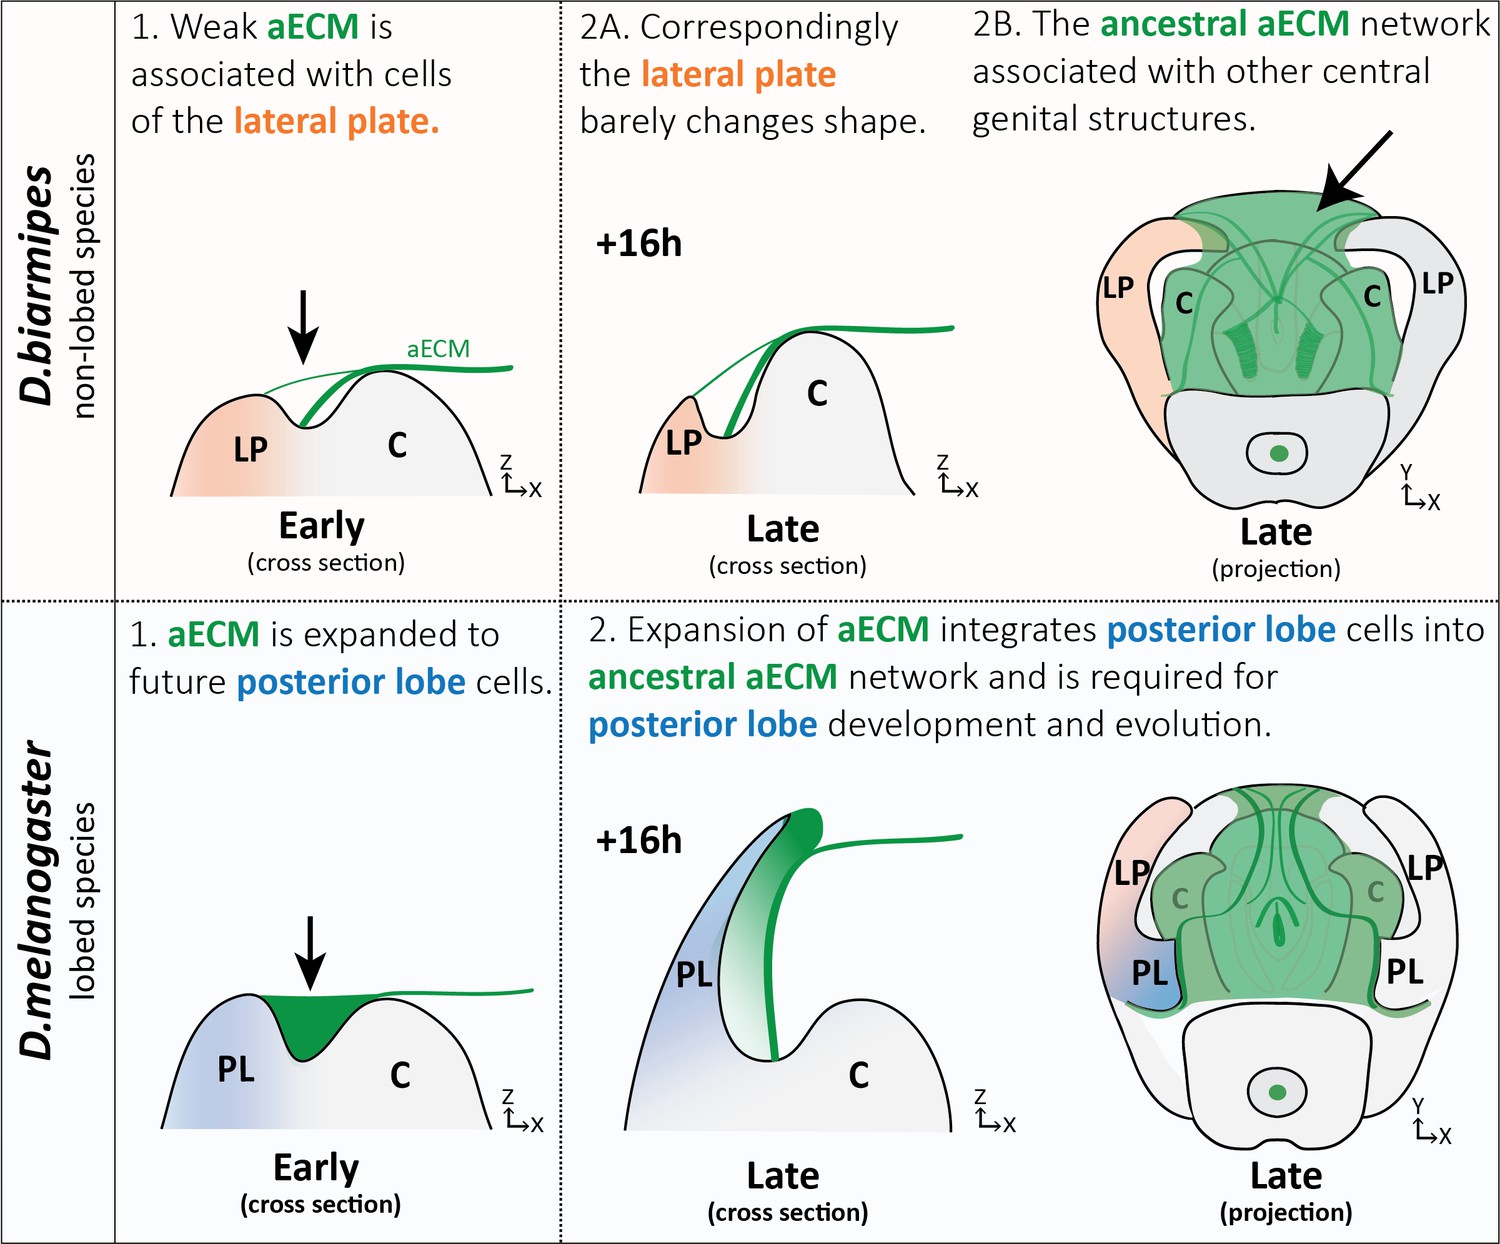
Expansion of aECM associated with the evolution of a morphological novelty.
(Top) Illustration of non-lobed species, D. biarmipes, with ancestral aECM network covering central genital structures (2B) including the clasper (C), sheath, and phallus. Weak connections of aECM span from the clasper to the lateral plate (LP) during early development (1 and 2A - top). (Bottom) Illustration of lobed species, D. melanogaster. The aECM network has expanded to fill the crevice between the lateral plate and clasper (1-bottom) integrating these cells into the ancestral aECM network (2-bottom). This aECM population is needed for cells to properly project from the lateral plate, forming the posterior lobe.
Figure 8—figure supplement 1
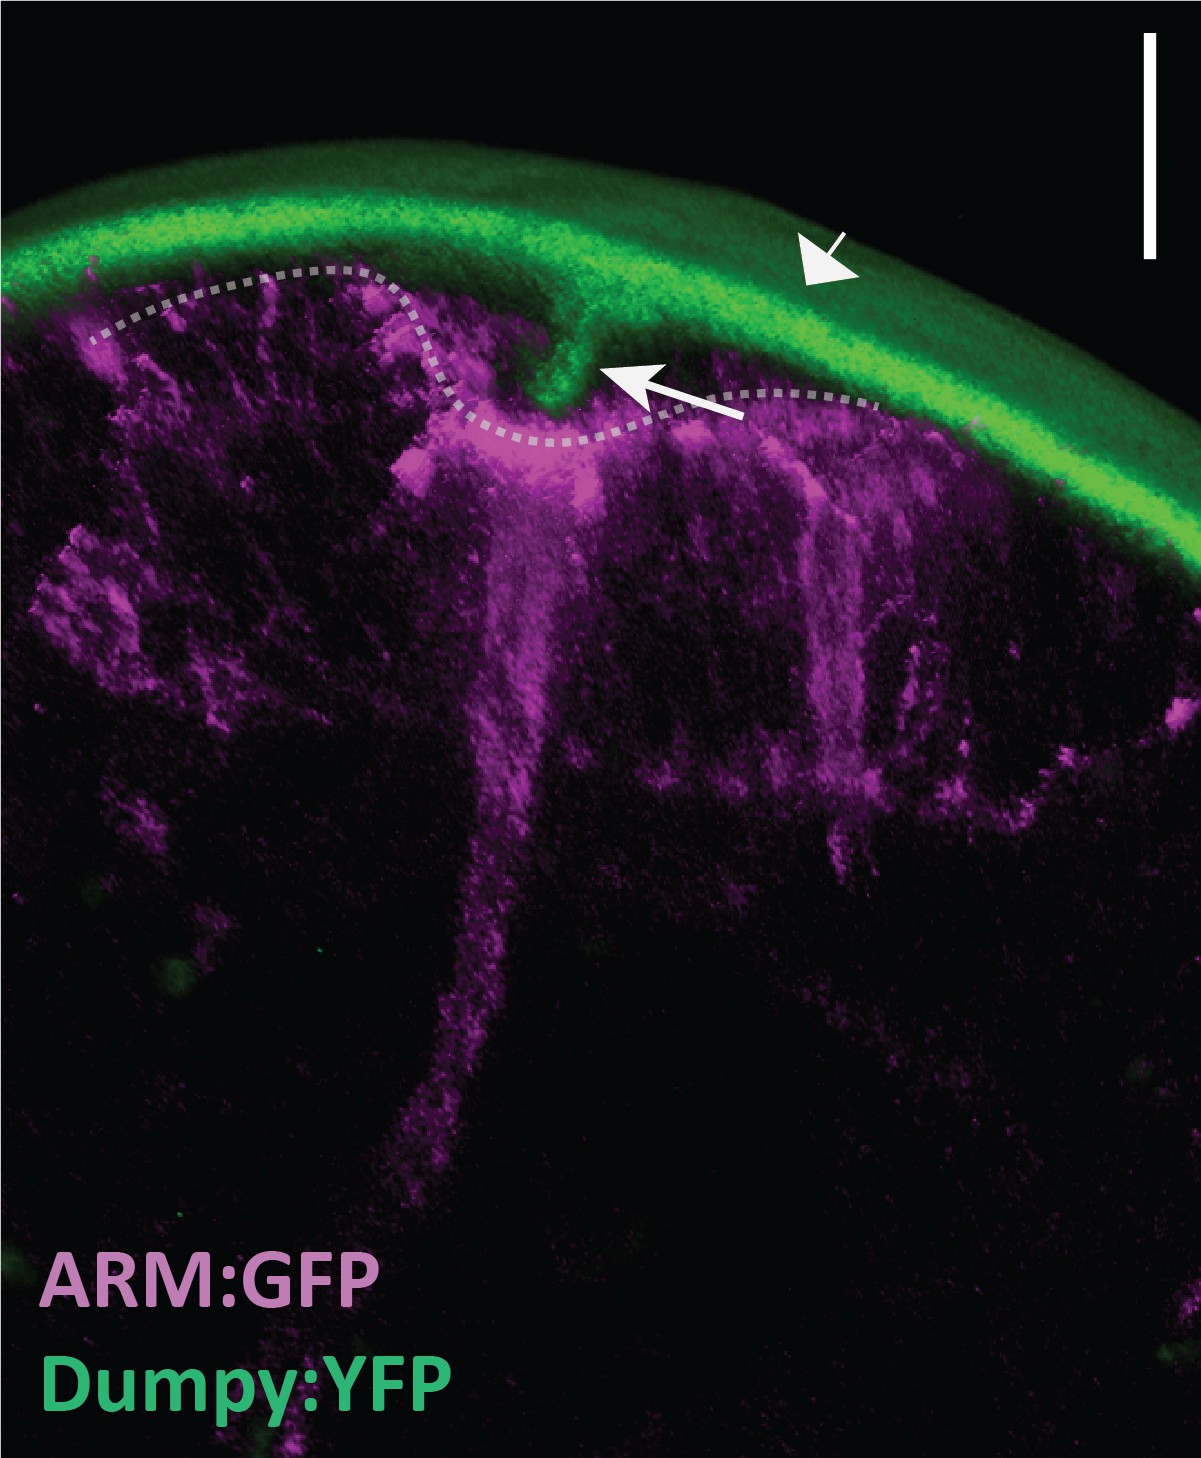
Dumpy anchors posterior spiracles to surrounding cuticle.
Live imaging of Dumpy:YFP (green) and Armadillo:GFP (ARM:GFP; magenta) in the embryonic posterior spiracles. Posterior spiracle (dotted line) is connected to the cuticle (arrowhead) via a tether of dumpy (arrow). Scale bar, 10 μm. n = 4.
Tables
Key resources table
| Reagent type (species) or resource | Designation | Source or reference | Identifiers | Additional information |
|---|---|---|---|---|
| Antibody | Monoclonal rat anti-alpha tubulin (tyrosinated) | MilliporeSigma | Millipore Cat# MAB1864, RRID:AB_2210391 | IHC (1:500) |
| Antibody | Monoclonal mouse anti-alpha tubulin (acetylated) | Sigma-Aldrich | Sigma-Aldrich Cat# T6793, RRID:AB_477585 | IHC (1:500) |
| Antibody | Monoclonal rat anti-Ecadherin | DSHB | DSHB Cat# DCAD2, RRID:AB_528120 | IHC (1:500) |
| Antibody | Monoclonal mouse anti-Fasciclin III | DSHB | DSHB Cat# 7G10 anti-Fasciclin III, RRID:AB_528238 | IHC (1:500) |
| Antibody | Polyclonal rabbit anti-histone H3 (phospho S10) | Abcam | Abcam Cat# ab5176, RRID:AB_304763 | IHC (1:50) |
| Antibody | Polyclonal goat anti-GFP | Abcam | Abcam Cat# ab6662, RRID:AB_305635 | IHC (1:300) |
| Lectin | fluoresceinVicia Villosa Lectin (VVA) | Vector Laboratories | Vector Laboratories Cat# FL-1231, RRID:AB_2336856 | IHC (1:200) |
| Chemical compound, drug | rhodamine phalloidin | Thermo Fisher Scientific | Thermo Fisher Scientific Cat# R415, RRID:AB_2572408 | IHC (1:200) |
| Strain, strain background (Drosophila melanogaster) | y1w1Drosophila melanogaster | BloomingtonDrosophilaStock Center | BDSC Cat# 1495, RRID:BDSC_1495 | |
| Strain, strain background (Drosophila biarmipes) | wild type | NationalDrosophilaSpecies Stock Center (NDSSC) | NDSSC Stock #:14023–0361.10 RRID:FlyBase_FBst0203870 | |
| Strain, strain background (Drosophila ananassae) | wild type | NationalDrosophilaSpecies Stock Center (NDSSC) | NDSSC Stock #:14024–0371.13 RRID:FlyBase_FBst0201380 | No longer available |
| Strain, strain background (Drosophila pseudoobscura) | wild type | NationalDrosophilaSpecies Stock Center (NDSSC) | NDSSC Stock #:14011–0121.87 RRID:FlyBase_FBst0200074 | No longer available |
| Strain, strain background (Drosophila sechellia) | Wild type | NationalDrosophilaSpecies Stock Center (NDSSC) | NDSSC Stock #: #14021–0248.03 RRID:FlyBase_FBst0201190 | No longer available |
| Genetic reagent (Drosophila melanogaster) | UAS-Raeppli-CAAX | Bloomington Drosophila Stock Center (BDSC) | BDSC Cat# 55084, RRID:BDSC_55084 | |
| Genetic reagent (Drosophila melanogaster) | Pox neuro-Gal4 | (Boll and Noll, 2002) | Construct #13 | |
| Genetic reagent (Drosophila melanogaster) | D. simulans Pox neuro-Gal4 | This paper | Can be obtained from Mark Rebeiz,rebeiz@pitt.edu | |
| Genetic reagent (Drosophila melanogaster) | hs – flippase122 | Gift from Erika A. Bach | Flybase: FBtp0001101 | |
| Genetic reagent (Drosophila melanogaster) | armadillo-GFP | (Huang et al., 2012) | ||
| Genetic reagent (Drosophila melanogaster) | Dumpy:YFP | Drosophila Genomics and Genetic Resources | DGGR Cat# 115238, RRID:DGGR_115238 | |
| Genetic reagent (Drosophila melanogaster) | Viking:GFP | Drosophila Genomics and Genetic Resources | DGGR Cat# 110626, RRID:DGGR_110626 | |
| Genetic reagent (Drosophila melanogaster) | Perlecan:GFP | Drosophila Genomics and Genetic Resources | DGGR Cat# 110807, RRID:DGGR_ 110807 | |
| Genetic reagent (Drosophila melanogaster) | E-cadherin:mCherry | Bloomington Drosophila stock center | BDSC Cat# 59014, RRID:BDSC_59014 | |
| Genetic reagent (Drosophila melanogaster) | UAS-dumpyRNAi | ViennaDrosophilaResource Center | VDRC Cat#44029, RRID:FlyBase_FBst0465370 | |
| Genetic reagent (Drosophila melanogaster) | UAS-mCherryRNAi | Bloomington Drosophila stock center | BDSC Cat# 35785, RRID:BDSC_35785 | |
| Recombinant DNA reagent | pS3aG4 | Gift from Benjamin Prud'homme | Gal4 vector used to make D. simulans Pox neuro gal4 line | |
| Sequence-based reagent | GCCACTAACAATCCATGCGGTT | This paper | dumpy probe forward primer. Obtained from Integrated DNA Technologies. | |
| Sequence-based reagent | TAATACGACTCACTATAGGGAGAAATAGCCCTGTCCTTGGAATCC | This paper | dumpy probe reverse primer with T7 primer. Obtained from Integrated DNA Technologies. | |
| Sequence-based reagent | TTCCGGGCGCGCCTCGGTGGCTTAACACGCGCATT | This paper | D. simulans Pox neuro forward primer for gal four line. Obtained from Integrated DNA Technologies. | |
| Sequence-based reagent | TTGCCCCTGCAGGATCGCTGATTCCATGGCCCAGT | This paper | D. simulans Pox neuro reverse primer for gal four line. Obtained from Integrated DNA Technologies. | |
| Software algorithm | Fiji (ImageJ v2.0) | (Schindelin et al., 2012) | RRID:SCR_002285 | |
| Software algorithm | GenePalette | (Rebeiz and Posakony, 2004; Smith et al., 2017) | ||
| Software algorithm | Leica Application Suite X | Leica | RRID:SCR_013673 | |
| Software algorithm | Microsoft Excel | Microsoft | RRID:SCR_016137 | |
| Software algorithm | MorphoGraphX | (Barbier de Reuille et al., 2015) | ||
| Software algorithm | Prism 8 | GraphPad | RRID:SCR_002798 |
Additional files
Download links
A two-part list of links to download the article, or parts of the article, in various formats.
Downloads (link to download the article as PDF)
Open citations (links to open the citations from this article in various online reference manager services)
Cite this article (links to download the citations from this article in formats compatible with various reference manager tools)
Evolutionary expansion of apical extracellular matrix is required for the elongation of cells in a novel structure
eLife 9:e55965.
https://doi.org/10.7554/eLife.55965


