A dynamic charge-charge interaction modulates PP2A:B56 substrate recruitment
- Department of Chemistry and Biochemistry, University of Arizona, United States
- The Novo Nordisk Foundation Center for Protein Research, Faculty of Health and Medical Sciences, University of Copenhagen, Denmark
- Department of Biochemistry and Cell Biology, Geisel School of Medicine at Dartmouth, United States
- Norris Cotton Cancer Center, Geisel School of Medicine at Dartmouth, Medical Center Drive, United States
Figures
Figure 1 with 2 supplements
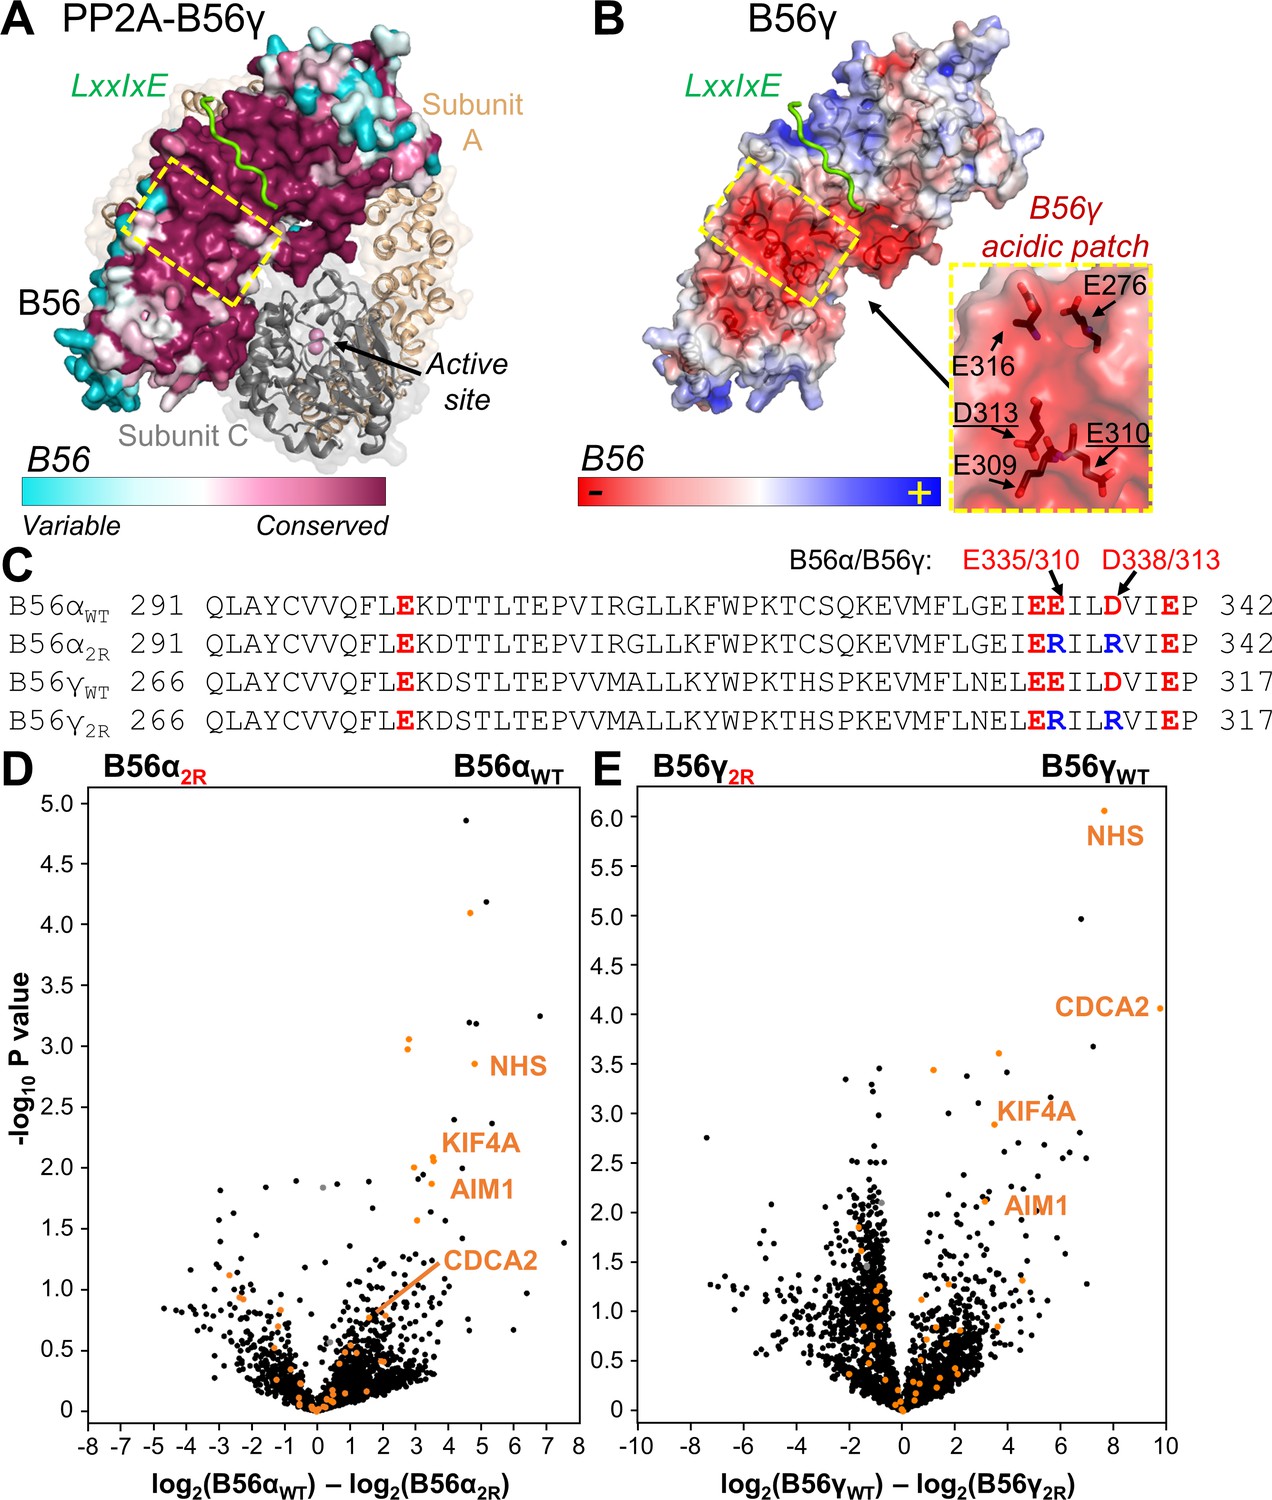
The PP2A:B56 holoenzyme uses a conserved acidic patch to bind to B56-specific interactors.
(A) PP2A:B56γ holoenzyme (PDBID 2NPP): scaffolding subunit A (beige) and catalytic subunit C (grey; bound metals shown as pink spheres) illustrated as cartoons with transparent surfaces. The regulatory B subunit, B56, is shown as a surface and colored by sequence conservation. An LxxIxE peptide (RepoMan: 588PLLpSPIPELPE598; p indicates residue is phosphorylated) bound to B56γ is shown in green (PDBIDs 5SW9 and 2NPP superimposed using B56). The location of the conserved acidic patch in B56 (see B) is highlighted with a dashed, yellow square. (B) The B56γ:LxxIxE complex (PDBID 5SW9) colored according to electrostatic potential; LxxIxE peptide is in green. The B56 residues that comprise the conserved acidic patch (yellow dashed square) are shown as sticks and labeled (right; residues mutated in the ‘2R’ mutants underlined). (C) Sequences of B56α and B56γ that comprise the acidic patch, with the acidic residues colored red. The B56 ‘2R’ variants indicate the acidic residues mutated to arginine ‘R’. (D) Volcano plot representing the mass spectrometry-identified proteins co-purifying with YFP-B56α versus YFP-B56α2R (E335R/D338R) from mitotic HeLa cells expressing YFP-B56α or YFP-B56α2R. PPP2R1A (PP2A regulatory subunit A, α isoform), PPP2CA (PP2A catalytic subunit, α isoform) are labeled in grey. Predicted and confirmed LxxIxE containing proteins (Hertz et al., 2016; Wang et al., 2016) are highlighted in orange. Four of the six most significantly affected LxxIxE containing B56 interactors selected for further study [NHS, AIM1, CDCA2 (RepoMan) and KIF4A] are labeled. (E) Same as (D) except for YFP-B56γ versus YFP-B56γ2R (E310R/D313R).
-
Figure 1—source data 1
List of B56 acidic patch dependent interactors.
- https://cdn.elifesciences.org/articles/55966/elife-55966-fig1-data1-v2.xlsx
Figure 1—figure supplement 1
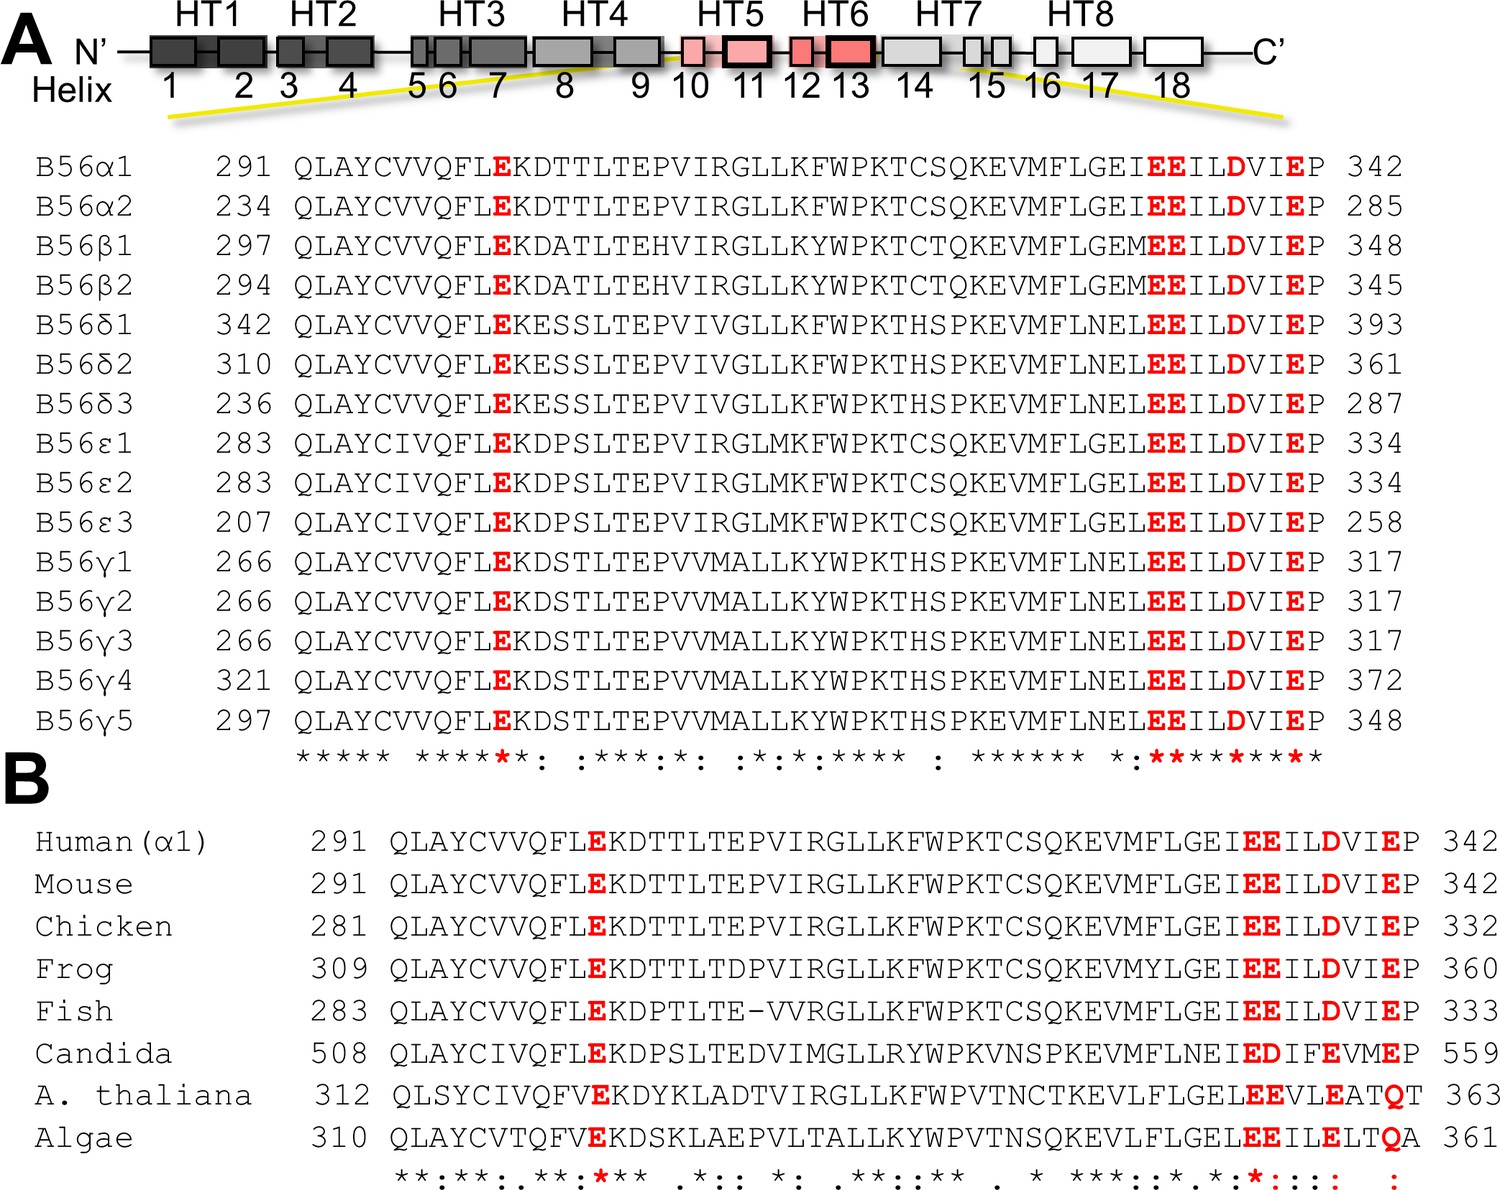
Sequence alignment of the B56 acidic patch.
(A) Human B56 variants. (B) B56 from various organisms. Residues that define the acidic patch are highlighted in red (human B56α1: E301, E334, E335, D338, E341). The species are: Homo sapiens (human), Mus musculus (mouse), Gallus gallus (chicken), Danio rerio (fish), and Xenopus laevis (frog), Candida albicans (Candida), Arabidopsis thaliana (A. thaliana), Chlamydomonas reinhardtii (Algae).
Figure 1—figure supplement 2
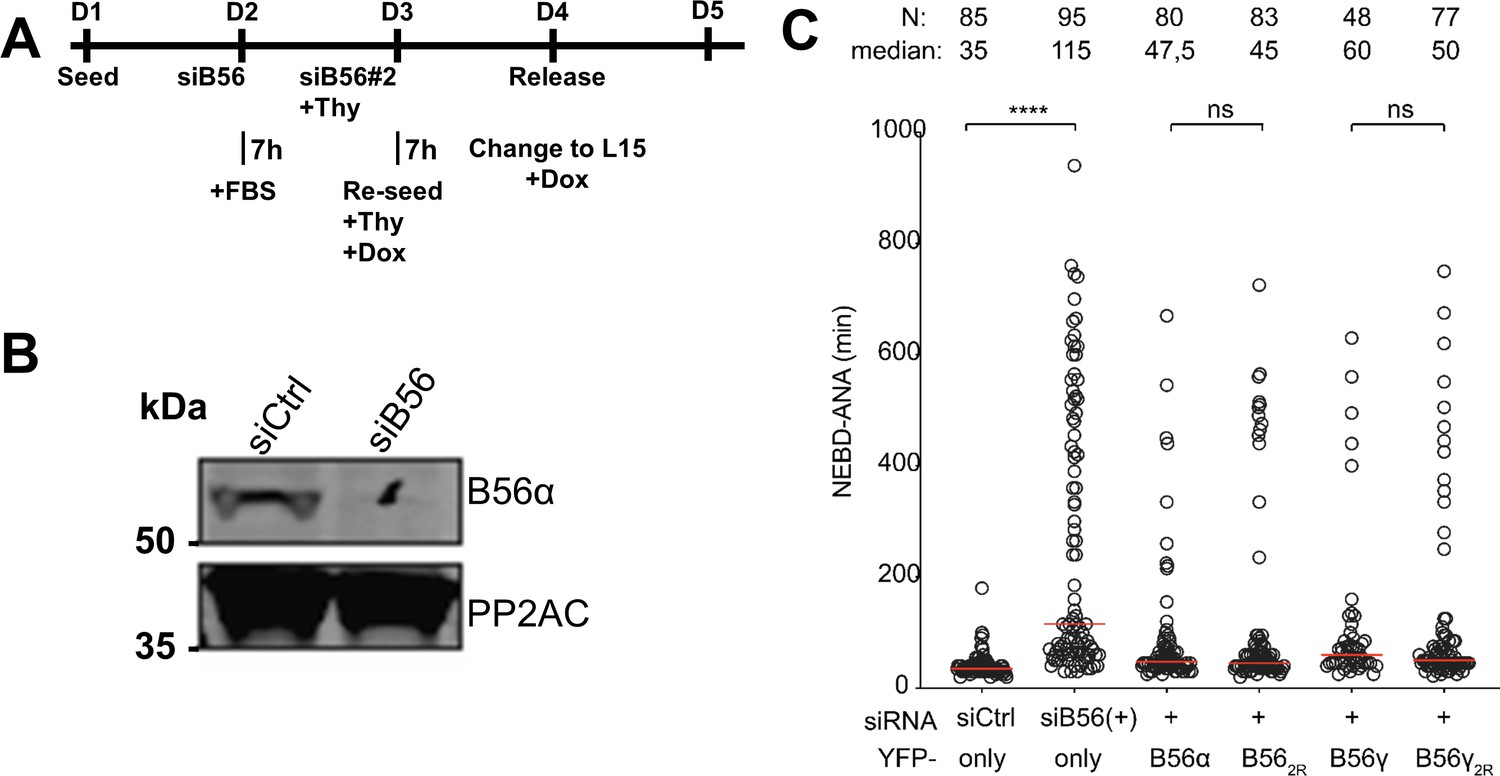
The impact of altering the B56 acidic patch in mitotic progression.
(A) Protocols by which endogenous B56 (all isoforms except β) was depleted by RNAi and complemented with the indicated YFP-B56 variants. (B) Depletion efficiency of endogenous B56 using RNAi. (C) The time spent from the nuclear envelope breakdown (NEBD) to the completion of anaphase was determined from at least two independent experiments. Circles represent single cells. The number of cells and median (red line) times are indicated. Mann–Whitney test was used to determine the p-values indicated. ∗∗∗∗ p<0.0001; *p<0.05; ns, not significant.
Figure 2 with 3 supplements
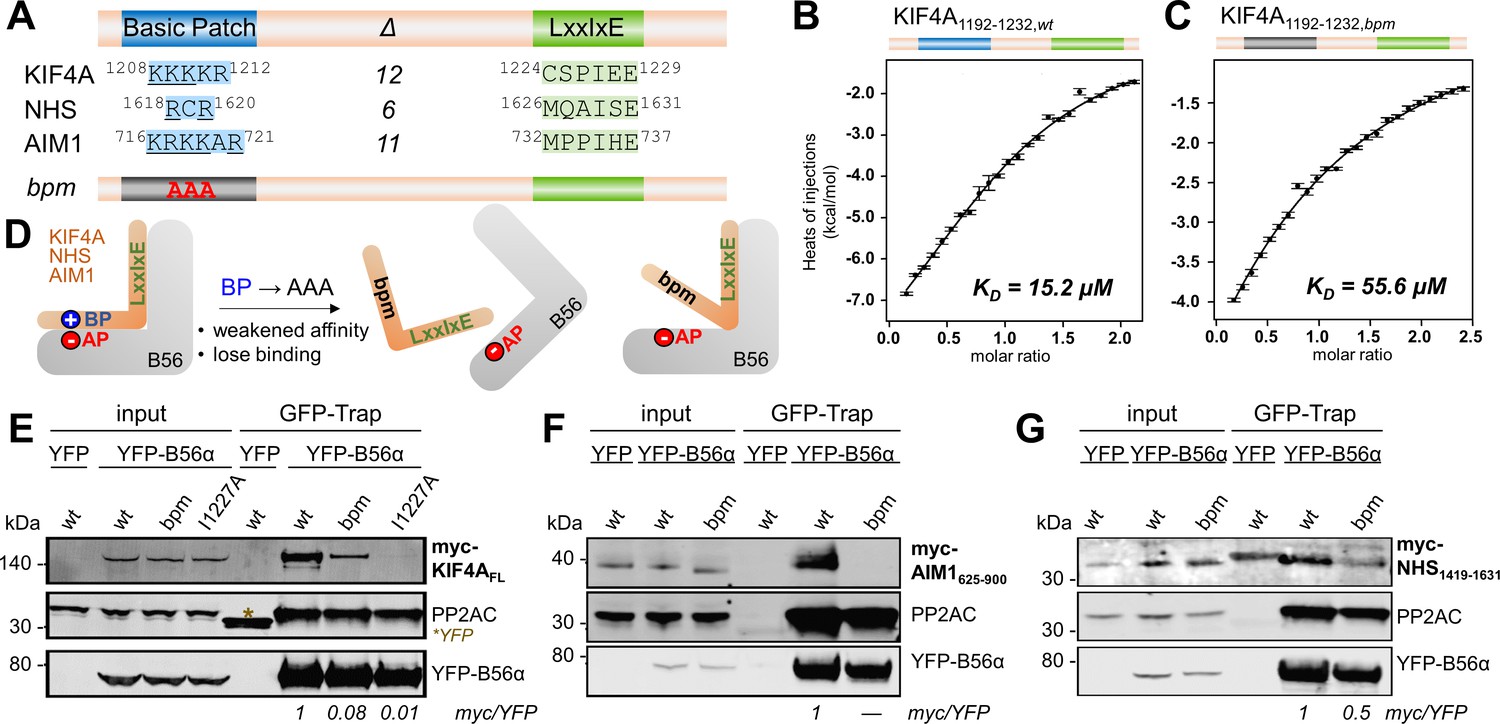
KIF4A binds to B56 via a conserved basic patch and an LxxIxE motif.
(A) B56 interactors with the basic patch (blue) and LxxIxE motif (green) sequences shown; Δ indicates the number of residues between the basic patch and the LxxIxE motif. (B) Binding isotherm of WT KIF4A1192-1232 with B56γ. (C) Binding isotherm of KIF4A1192-1232,bpm (1208KKK1210 to AAA) with B56γ. (D) Cartoon representation of the effect of mutating the basic patch (BP) of the bp-dependent interactors on their interaction with B56 (AP, acidic patch). (E) Immunoprecipitation of YFP-B56α from cells stably expressing YFP-B56α and transfected with the indicated myc-tagged full-length KIF4A variants; asterisk indicates YFP, which was used as a control. The amounts of myc-KIF4AFL co-purified with YFP-B56α were normalized to the band intensity of YFP. The wt is set to 1. (F) Immunoprecipitation of YFP-B56α from cells stably expressing YFP-B56α and transfected with the indicated myc-tagged AIM1625-900 variants. The amounts of myc- AIM1625-900 co-purified with YFP-B56α were normalized to the band intensity of YFP. (G) Immunoprecipitation of YFP-B56α from cells stably expressing YFP-B56α and transfected with the indicated myc-tagged NHS1419-1631 variants. The amounts of myc-NHS1419-1631 co-purified with YFP-B56α were normalized to the band intensity of YFP.
Figure 2—figure supplement 1
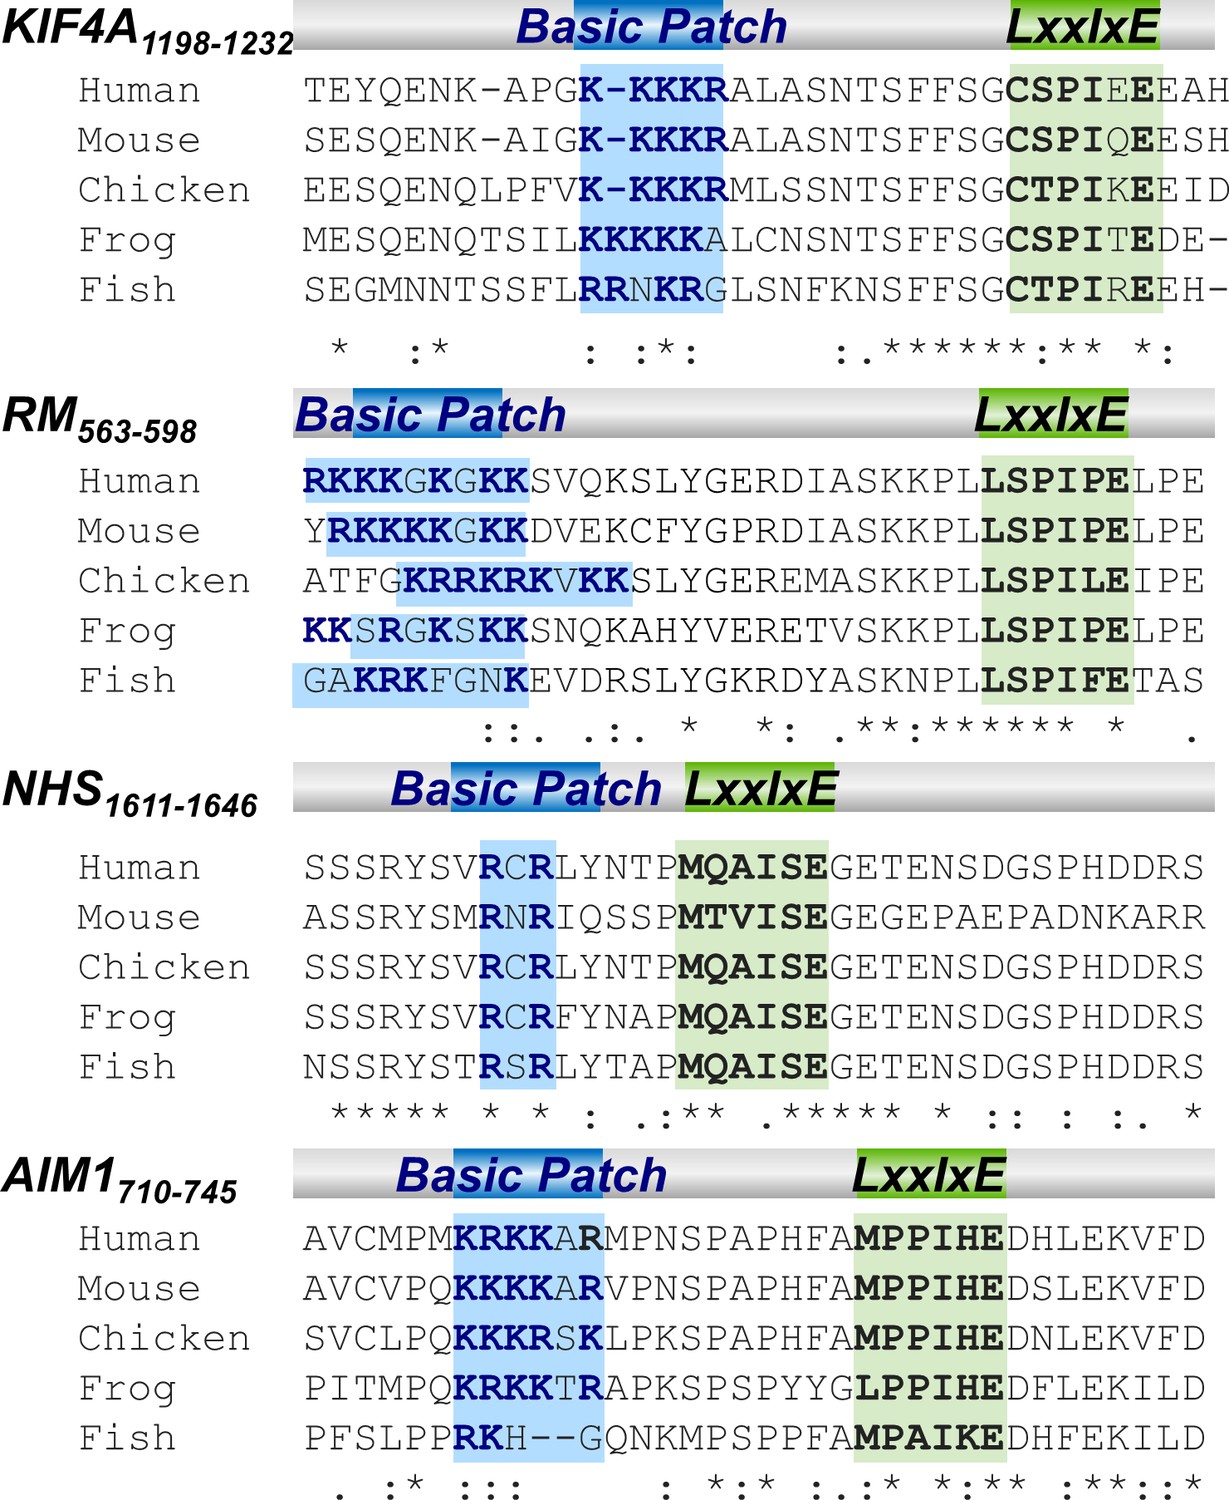
The basic patches of PP2A-B56 basic patch-specific interactors are conserved throughout evolution.
Sequence alignment of the basic patch and the proximal LxxIxE motif of KIF4A, RepoMan, NHS and Aim1 (Residue are numbered based on human proteins).
Figure 2—figure supplement 2
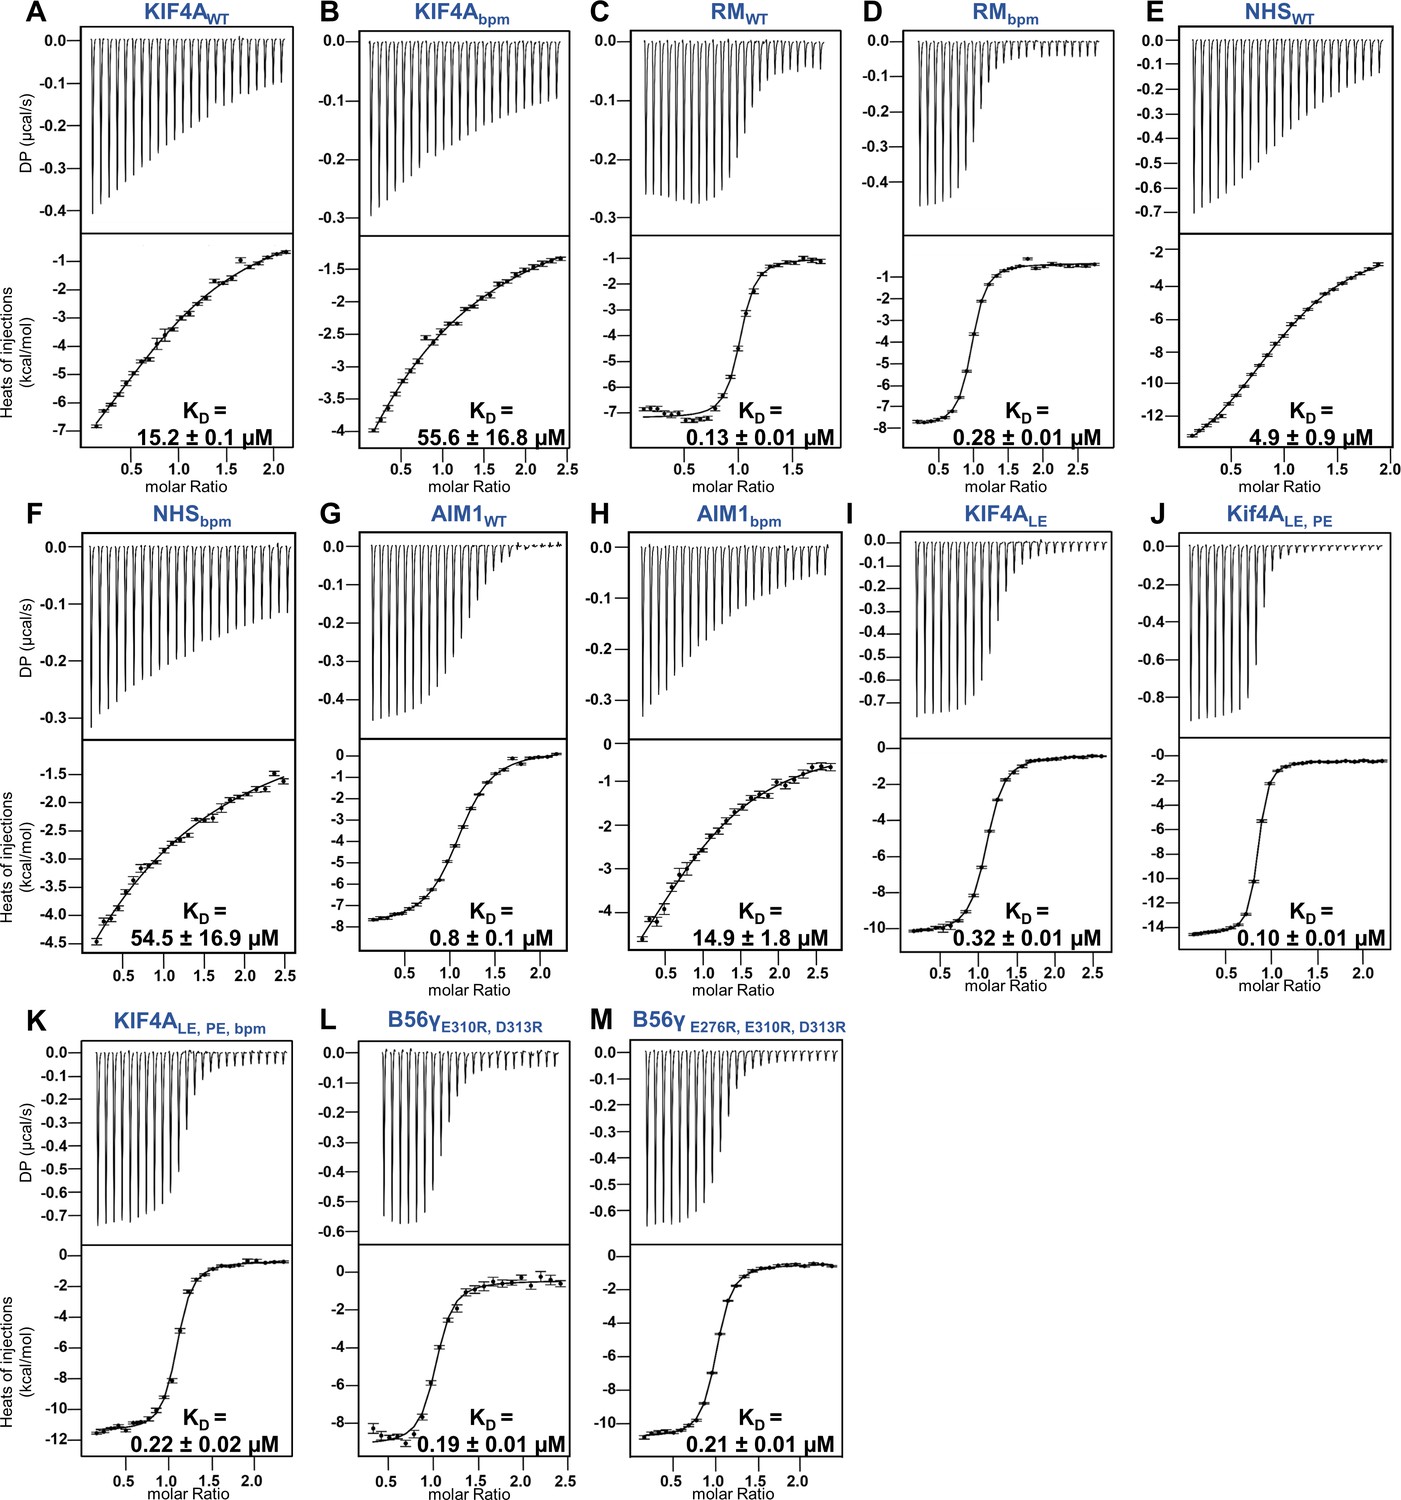
ITC thermograms for various PP2A-B56 interactors (WT and bpm) with B56γ (WT and acidic patch mutants).
(A) ITC data for B56WT with KIF4AWT(1192–1232). (B) ITC data for B56WT with KIF4Abpm(1192–1232; 1208KKK1210 to AAA). (C) ITC data for B56WT with RepoMan (533-603; RM). (D) ITC data for B56WT with RMbpm(533–603, 563RKKK566 to AAAA). (E) ITC data for B56WT with NHS (1616–1635). (F) ITC data for B56WT with NHSbpm(1616–1635, 1618RCR1620 to AAA). (G) ITC data for B56WT with AIM1 (716–741). (F) ITC data for B56WT with AIM1bpm (716-741; 716KRKKAK721 to AAAAA). (I) ITC data for B56WT with KIF4ALE(1192–1232; 1224CS1225 to LE). (J) ITC data for B56WT with KIF4ALE,PE(1192–1232; 1224CS1225 to LE, 1231AH1232 to PE). (K) ITC data for B56WT with KIF4ALE,PE, bpm(1192–1232; 1224CS1225 to LE, 1231AH1232 to PE, 1208KKK1210 to AAA). (L) ITC data for B56γ2R (E310R/D313R) with KIF4ALE,PE. (M) ITC data for B56γ3R (E276R/E310R/D313R) with KIF4ALE,PE.
Figure 2—figure supplement 3
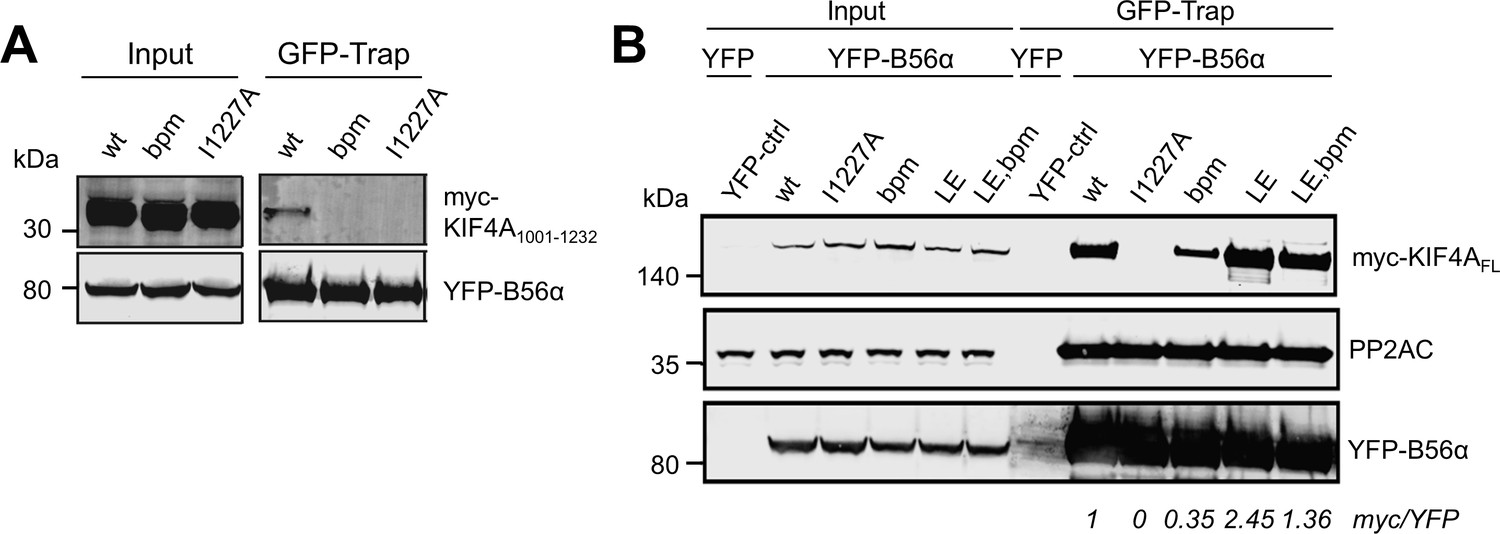
Mutating the basic patch or the LxxIxE motif of KIF4A reduces KIF4A:B56 binding.
(A) Mutating the basic patch or the LxxIxE motif of KIF4A1001-1232 reduces KIF4A:B56α binding. Immunoprecipitation of YFP-B56α from cells stably expressing YFP-B56α and transfected with the indicated myc-tagged KIF4A1001-1232 C-terminal variants (bpm: 1209KKK1211 to AAA). (B) Mutating the basic patch or the LxxIxE motif of KIF4ALE also reduces KIF4A:B56α binding. Immunoprecipitation of YFP-B56α from cells stably expressing YFP-B56α and transfected with the indicated myc-tagged KIF4AFL variants (LE: 1224CS1225 to LE).
Figure 3 with 3 supplements
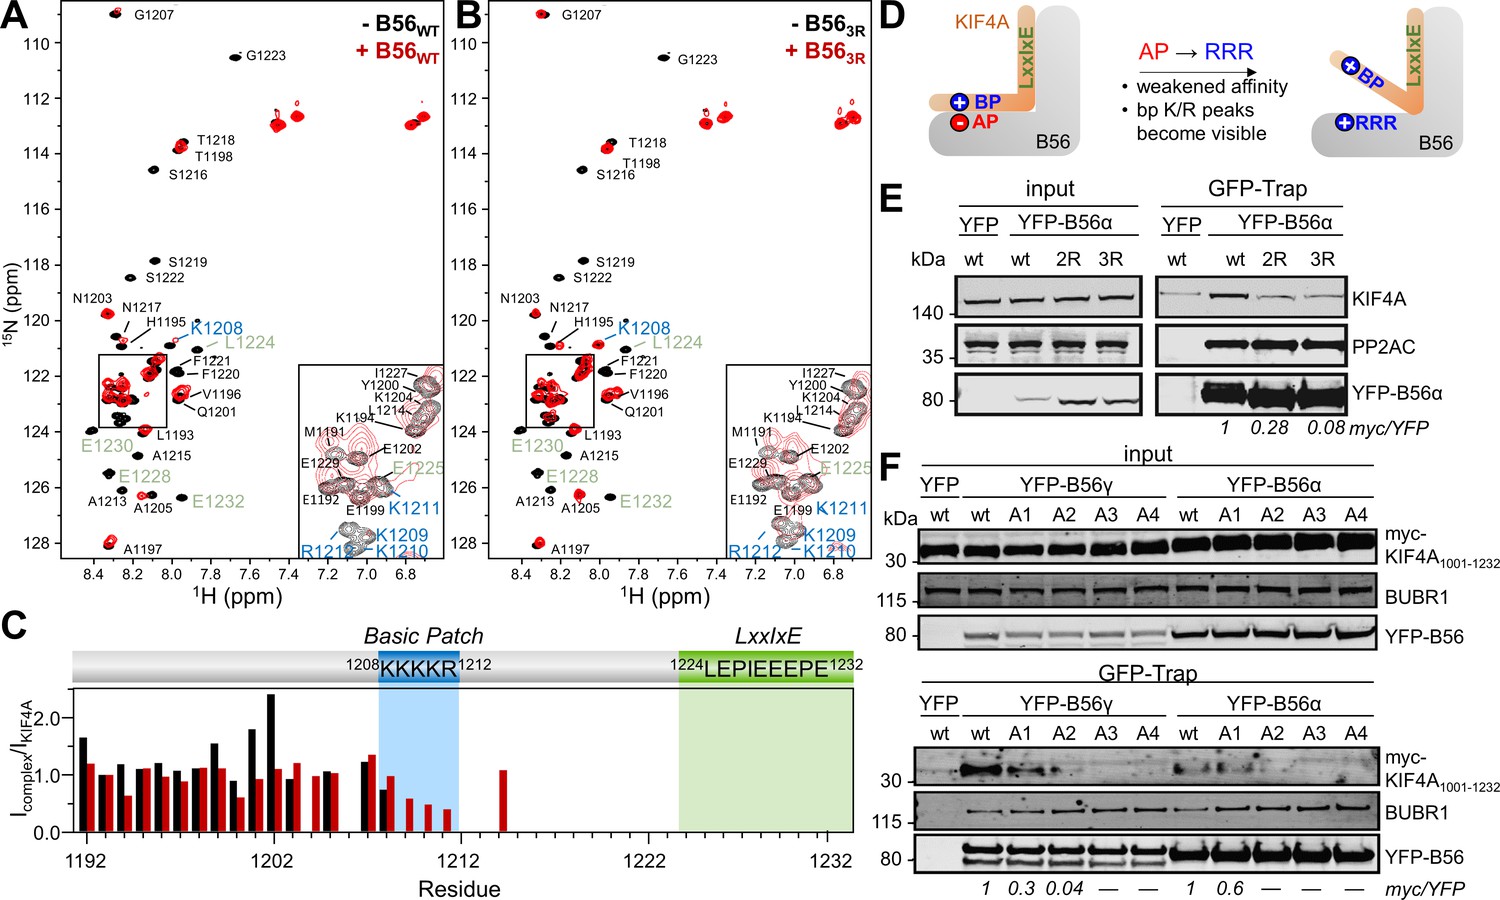
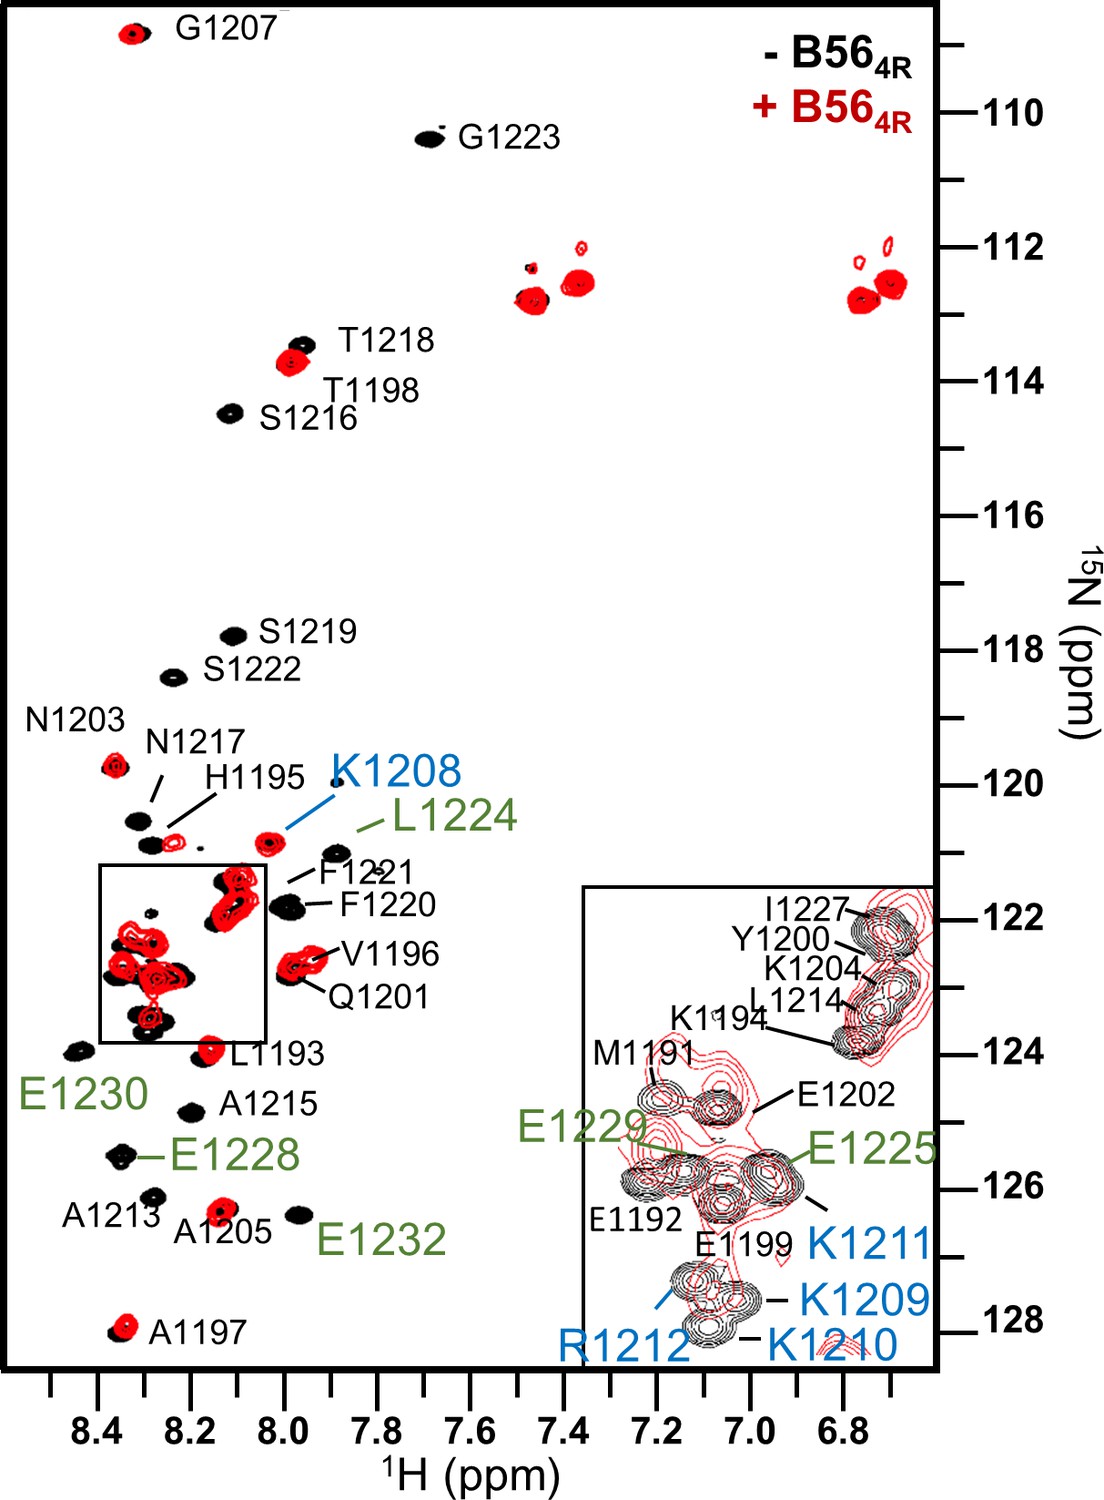
The basic patch in B56-specific regulators binds B56 via a dynamic charge-charge interaction.
(A) Overlay of the 2D [1H,15N] HSQC spectra of 15N-labeled KIF4A1192-1232,LE,PE in the presence (red) and absence (black) of B56γ (1:1 ratio); basic patch and LxxIxE residues labeled blue and green, respectively. (B) Overlay of the 2D [1H,15N] HSQC spectra of 15N-labeled KIF4A1192-1232,LE,PE in the presence (red) and absence (black) of B56γ3R E276R/E310R/E316R (1:1 ratio); basic patch and LxxIxE residues highlighted in blue and green, respectively. (C) [1H,15N] HSQC peak intensity ratios for spectra shown in A, B (black, red, respectively). (D) Cartoon representation of the effect of mutating the acidic patch (AP) of B56 on KIF4A:B56 binding (AP: acidic patch, BP: basic patch). (E) Immunoprecipitation of stably expressed YFP-B56α variants (wt, B56α2R: E335R/D338R, and B56α3R E301R/E335R/D338R and probed for endogenous KIF4A, PP2AC (PP2A catalytic subunit) and GFP (YFP-B56α). (F) Immunoprecipitation of transiently transfected myc-tagged KIF4A1001-1232 C-terminal variants (A1: K1208A; A2: 1208KK1209 to AA; A3: 1208KKK1210 to AAA; A4: 1208KKKK1211 to AAAA) from cells stably expressing YFP-B56α or YFP-B56γ. The amounts of myc-KIF4A co-purified with YFP-B56 were normalized to the band intensity of YFP.
Figure 3—figure supplement 1

Crystal structures of KIF4ALE,PE:B56γ complex and AIM1:B56γ.
(A) KIF4ALE,PE peptide (1192–1232; 1224CS1225 to LE, 1231AH1232 to PE; yellow sticks) binds B56 between heat repeats 3 and 4 (HR3 and 4; lavender and blue; B56 heat repeat schematic, with corresponding helices numbered, is shown below). (B) The KIF4ALE,PE:B56γ and AIM1:B56γ complexes are superimposed on the pS-RepoMan:B56γ complex (PDB: 5SW9) via B56γ. B56γ is colored according to electrostatic potential; KIF4A, AIM1 and RepoMan peptides are shown as yellow, purple and green sticks, respectively. The sequences of KIF4ALE,PE, AIM1, and RepoMan that include the basic patch (colored in blue) and the LxxIxE motif are shown below. The residues with electron density in the KIF4ALE,PE:B56γ, AIM1:B56γ, and pS-RepoMan:B56γ complexes are highlighted in yellow, purple and green, respectively. (C) Electrostatic and hydrogen bonding interactions between phosphomimetic KIF4ALE,PE S1225E (yellow) and B56γ H187/R188 (orange). (D) Electrostatic and hydrogen bonding interactions between RepoMan pS591 (green) and B56γ H187/R188 (blue, 5SW9). (E) The B56γ LxxIxE binding pocket (colored in light blue) and the electron density (2Fo–Fc, σ = 1.0) of the AIM1 peptide; 14 residues of the AIM1 peptide were modeled into the electron density (purple: 716KRKKARMPNSPAPHFAMPPIHEDHLE741). (F) The C-terminal residues of AIM1 peptide also interact with B56γ, with the formation of a bidentate salt bridge between AIM1 E741 and B56γ R201.
Figure 3—figure supplement 2
Mutating the acidic patch of B56γ reduces the binding of the KIF4A basic patch to B56γ.
Overlay of the 2D [1H,15N] HSQC spectra of 15N-labeled KIF4ALE,PE(1192–1232; 1224CS1225 to LE, 1231AH1232 to PE) in the presence (red) and absence (black) of B564R (B56γ E276R/E310R/D313R/E316R; 1:1 ratio).The residues corresponding to the basic patch of KIF4A are labeled in blue and those corresponding to the LxxIxE motif are labeled in green. The rest are labeled in black.
Figure 3—figure supplement 3
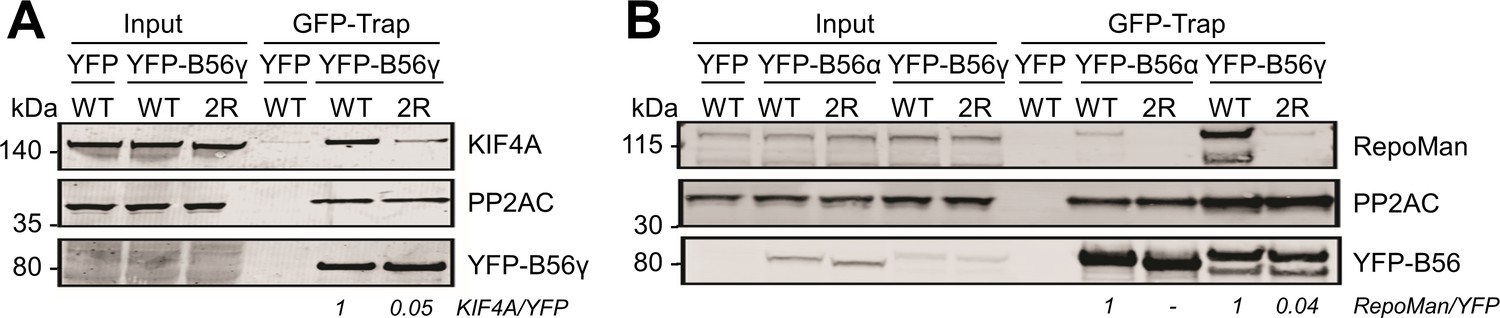
Mutating the acidic patch of B56 reduces KIF4A:B56 and RepoMan:B56 binding in cells.
(A) Immunoprecipitation of YFP-B56 from cells stably expressing YFP-B56γWT or YFP-B56γ2R (E310R/D313R) and probed for the indicated proteins: KIF4A, GFP (YFP-B56) and PP2AC (PP2A catalytic subunit). (B) Immunoprecipitation of YFP-B56 from cells stably expressing YFP-B56γWT, YFP-B56γ2R (E310R/D313R) YFP-B56αWT, YFP-B56α2R (E3335R/D338R) and probed for the indicated proteins: RepoMan, GFP (YFP-B56) and PP2AC (PP2A catalytic subunit).
Figure 4
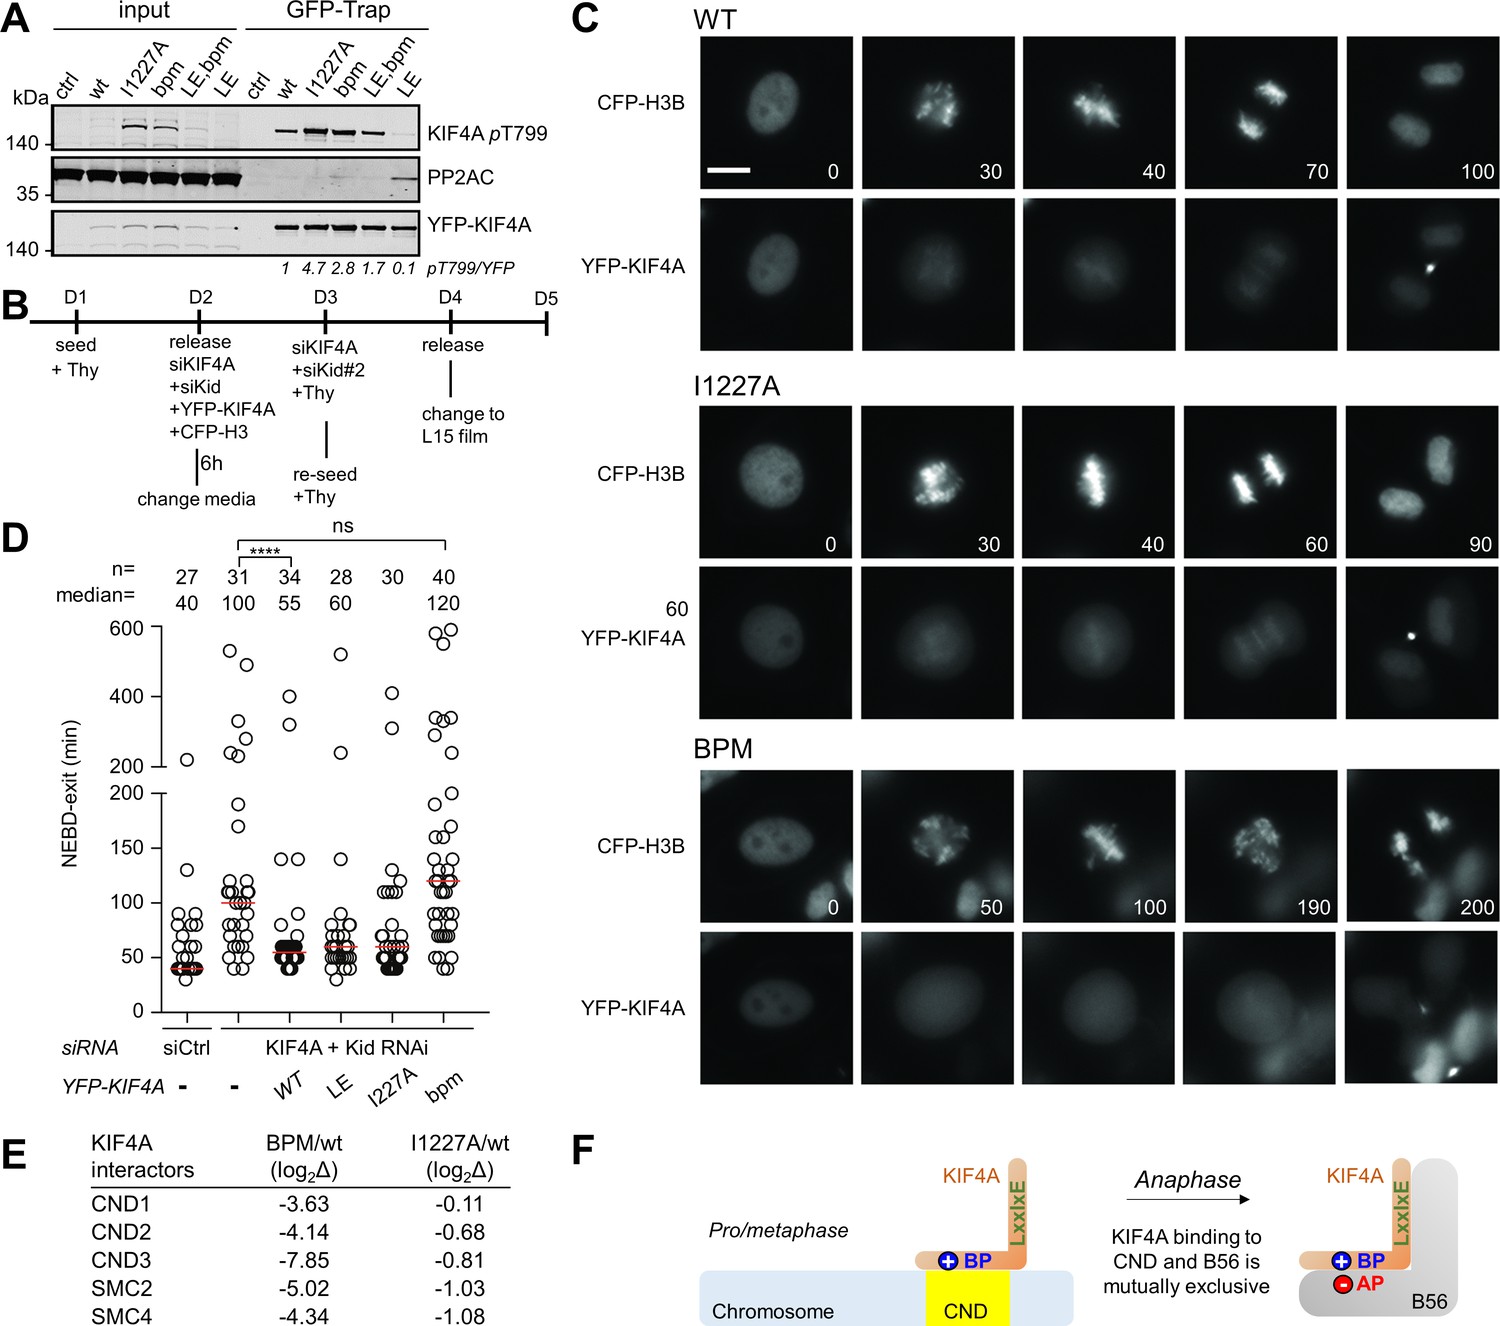
The basic patch regulates KIF4A dephosphorylation by PP2A, as well as KIF4A localization in cells.
(A) The indicated YFP-KIF4A constructs were purified using GFP-Trap and analyzed for phosphorylation by immunoblotting. The T799-phospho signal was normalized to YFP. YFP only was used as a control. (B) Endogenous KIF4A was depleted by RNAi and complemented with the indicated YFP-KIF4A variants. (C) Live cell imaging of cells expressing YFP-KIF4A variants as they go through mitosis. The beginning of the NEBD was considered as time 0 (min). Bar represents 5 μm. CFP, cyan fluorescent protein. (D) Quantification of mitotic duration. Circles represent single cells. The number of cells and median (red line) times are indicated from at least two independent experiments. Mann-Whitney test was used to determine the p-values indicated. ∗∗∗∗ p<0.0001; *p<0.05; ns, not significant. (E) The mass spectrometry-identified condensin complex associated proteins co-purifying with YFP-KIF4Awt versus KIF4Abpm or KIF4AI1227A from mitotic HeLa cells stably expressing YFP-KIF4A variants. (F) The binding of chromosome and B56 to KIF4A is mutually exclusive because both binding events strictly require the basic patch.
-
Figure 4—source data 1
Separate excel.
- https://cdn.elifesciences.org/articles/55966/elife-55966-fig4-data1-v2.xlsx
Figure 5
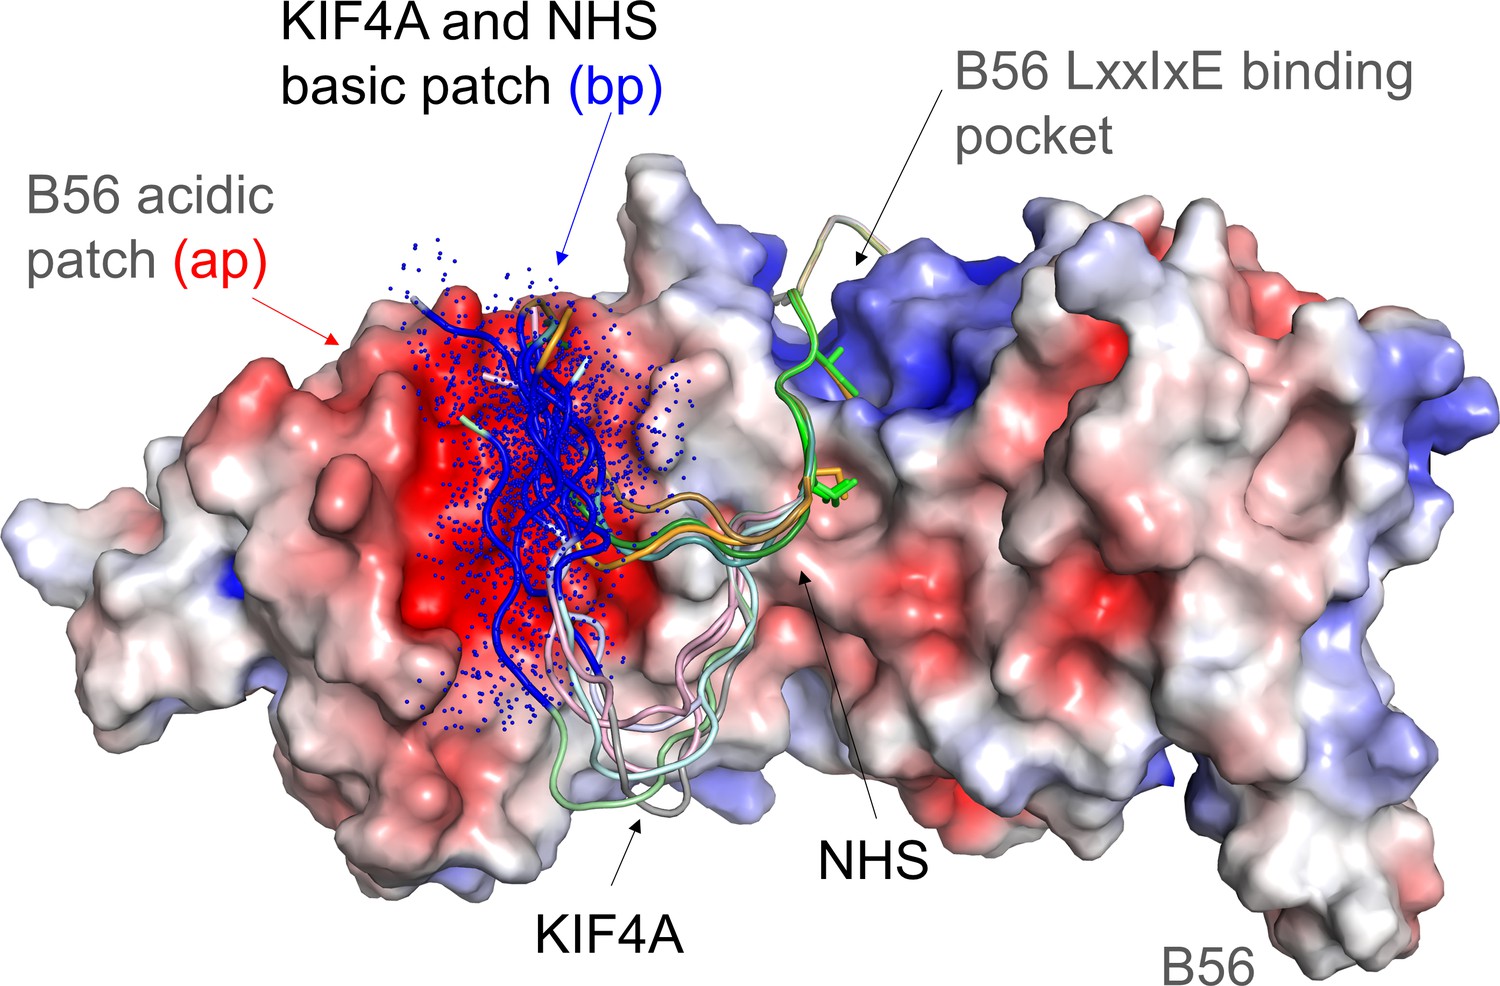
Model of the dynamic interaction between the KIF4A basic patch (BP) and the B56 acidic patch.
B56 is shown as an electrostatic surface with KIF4A and NHS shown as cartoons. The LxxIxE sequences of KIF4A and NHS bind B56 in a single conformation in the LxxIxE binding pocket (NHS sequence in this pocket modeled using the KIF4A structure, PDBID). As can be seen by these models (generated using COOT and PYMOL), the KIF4A (KKKKR) and NHS (RCR) basic patches (bp, colored dark blue) are optimally positioned to interact dynamically with the B56 acidic patch (ap, red). The dots reflect that these sequences do not adopt a single conformation, but instead retain their intrinsic disorder when bound to the acidic patch.
Tables
Table 1
Isothermal titration calorimetry (ITC) measurements between B56γ and KIF4A.
| B56γ12-380 | Titrant | KD (µM)* | ΔH (kcal/mol) | TΔS (kcal/mol) |
|---|---|---|---|---|
| WT | KIF4A‡ WT | 15.2 ± 0.1 | −11.7 ± 0.7 | −5.1 ± 0.7 |
| WT | KIF4Abpm† (K1208A/K1209A/K1210A) | 55.6 ± 16.8 | −11.5 ± 2.2 | −5.6 ± 2.4 |
| WT | KIF4ALE (C1224L/S1225E) | 0.32 ± 0.01 | −10.0 ± 0.1 | −2.0 ± 0.1 |
| WT | KIF4ALE,PE (C1224L/S1225E/A1231P/H1232E) | 0.10 ± 0.01 | −13.1 ± 1.1 | −3.6 ± 1.1 |
| WT | KIF4ALE,PE,bpm (K1208A/K1209A/K1210A/C1224L/ S1225E/A1231P/H1232E) | 0.22 ± 0.02 | −10.7 ± 0.1 | −1.6 ± 0.3 |
| E310R D313R | KIF4ALE,PE (C1224L/S1225E/A1231P/H1232E) | 0.19 ± 0.01 | −11.7 ± 0.1 | −2.5 ± 0.1 |
| E276R E310R D313R | KIF4ALE,PE (C1224L/S1225E/A1231P/H1232E) | 0.21 ± 0.01 | −8.2 ± 0.4 | −0.9 ± 0.3 |
| WT | RM§ WT | 0.13 ± 0.01 | −6.0 ± 0.1 | 3.3 ± 0.1 |
| WT | RMbpm (R563A/K564A/K565A/K566A) | 0.28 ± 0.01 | −7.5 ± 0.1 | 1.4 ± 0.1 |
| WT | NHS¶WT | 4.9 ± 0.9 | −17.0 ± 2.2 | −9.8 ± 2.1 |
| WT | NHSbpm (R1618A/R1620A) | 54.5 ± 16.9 | −18.1 ± 2.7 | −12.2 ± 2.5 |
| WT | AIM1** WT | 0.80 ± 0.09 | −9.2 ± 0.4 | −0.9 ± 0.5 |
| WT | AIM1bpm (K716A/R717A/K718A/K719A/K721A) | 14.9 ± 1.8 | −8.2 ± 0.2 | −1.6 ± 0.2 |
-
*All reported measurements are performed with ITC buffer (50 mM sodium phosphate pH 7.5, 150 mM NaCl, 0.5 mM TCEP). Errors are from duplicate or triplicate measurements.
† bpm, basic patch mutant.
-
‡KIF4A variants, KIF4A1192-1232.
§RepoMan (RM) variants, RM533-603.
-
¶NHS variants, NHS1616-1635.
**AIM1 variants, AIM1716-741.
Table 2
Data collection and refinement statistics.
| B56:KIF4ALE,PE*,† | B56:AIM1*,‡ | |
|---|---|---|
| PDB Data collection | 6OYL | 6VRO |
| Space group | P 21 21 21 | I4 |
| Cell dimensions | ||
| a, b, c (Å) | 53.3, 108.0, 117.8 | 111.0, 111.0, 108.9 |
| Α, β, γ(°) | 90, 90, 90 | 90, 90, 90 |
| Resolution (Å) | 39.52–3.15 | 39.26–2.45 |
| Rmerge | 0.100 (1.104) | 0.091 (1.721) |
| Mean I /σI | 11.5 (1.8) | 12.4 (1.2) |
| Completeness (%) | 96.6 (83.1) | 99.8 (99.4) |
| Multiplicity | 8.2 (7.7) | 7.0 (7.0) |
| CC1/2 | 0.999 (0.730) | 0.999 (0.673) |
| Refinement | ||
| Resolution (Å) | 39.52–3.15 (3.26–3.15) | 38.88–2.45 (2.54–2.45) |
| No. reflections | 11868 | 24208 |
| Rwork/Rfree | 0.22 (0.36)/0.24 (0.41) | 0.22 (0.33)/0.23 (0.38) |
| No. atoms | ||
| Protein | 2796 | 2777 |
| Water | 7 | 36 |
| B-factors | ||
| Protein | 66.4 | 70.1 |
| Water | 60.4 | 62.1 |
| RMS deviations | ||
| Bond lengths (Å) | 0.002 | 0.002 |
| Bond angles (°) | 0.54 | 0.54 |
| Ramachandran | ||
| Outliers (%) | 0.3 | 0.9 |
| Allowed (%) | 5.8 | 3.4 |
| Favored (%) | 93.9 | 95.7 |
| Clashscore | 4.3 | 2.7 |
-
*Data was collected from a single crystal.
†KIF4ALE,PE 1192ELKHVATEYQENKAPGKKKKRALASNTSFFSGLEPIEEEPE1232.
-
‡AIM1 716KRKKARMPNSPAPHFAMPPIHEDHLE741.
*Values in parentheses are for highest-resolution shell.
Additional files
Download links
A two-part list of links to download the article, or parts of the article, in various formats.
Downloads (link to download the article as PDF)
Open citations (links to open the citations from this article in various online reference manager services)
Cite this article (links to download the citations from this article in formats compatible with various reference manager tools)
A dynamic charge-charge interaction modulates PP2A:B56 substrate recruitment
eLife 9:e55966.
https://doi.org/10.7554/eLife.55966


