Centromere deletion in Cryptococcus deuterogattii leads to neocentromere formation and chromosome fusions
- Department of Molecular Genetics and Microbiology, Duke University Medical Center, United States
Figures
Figure 1 with 5 supplements
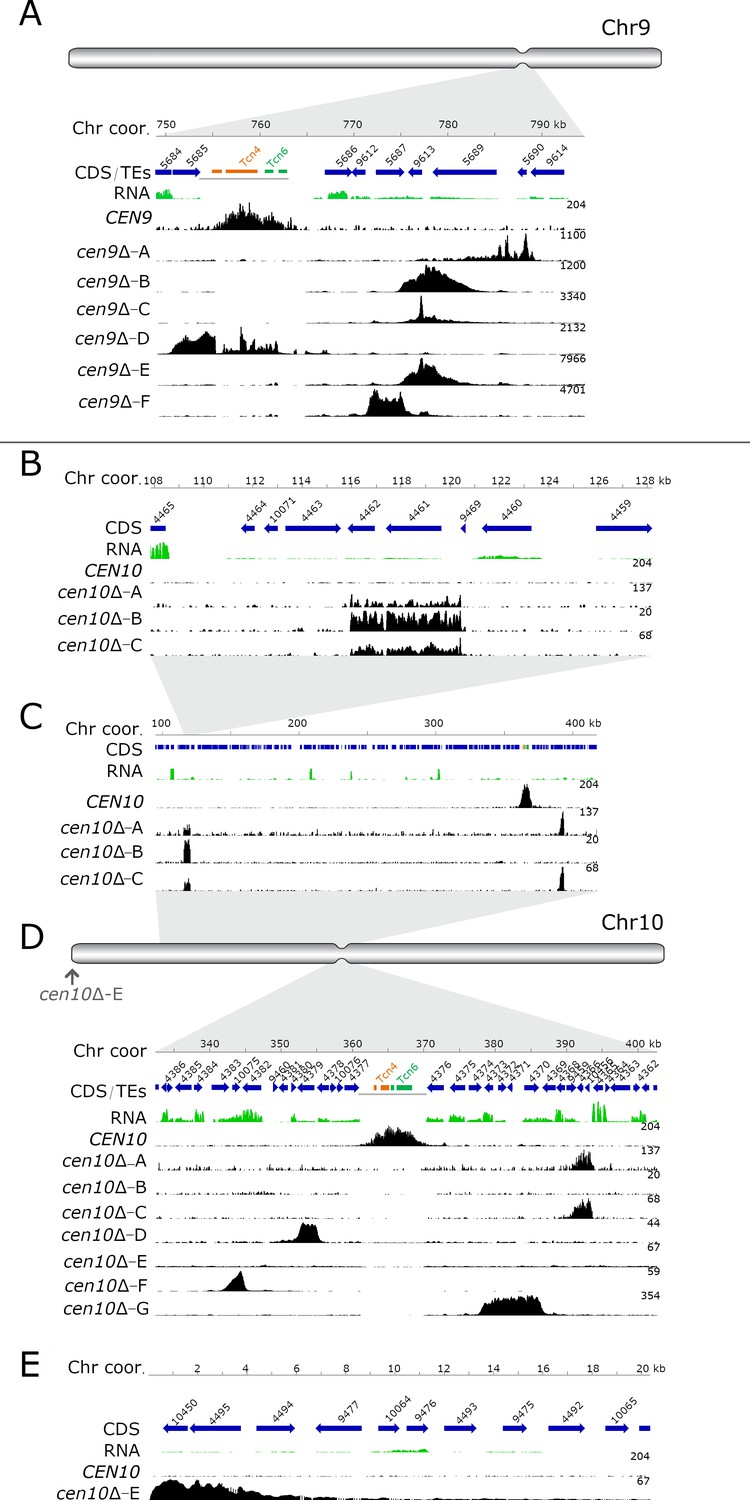
Centromere deletion leads to neocentromere formation.
For each panel, the chromosome coordinates are indicated. Genes (CDS) are shown in blue arrows and the truncated transposable elements, located in the native centromere (CEN9 or CEN10), are colored according to their class (Tcn4 in orange and Tcn6 in green). Previously generated RNA-sequencing obtained from wild-type cells was re-mapped and shown in green. In each panel, the wild-type CENP-A content is shown. In the wild type, CENP-A is only enriched at the native centromeres. For each cenΔ mutant, the neocentromeric region is shown by enrichment of CENP-A and the fold enrichment is indicated on the right of each ChIP-seq track. (A) Schematic full overview of chromosome 9, the indentation represents the native centromere 9 position. The light grey area points to the zoomed-in chromosomal region shown with the detailed view of the native centromere (CEN9) and the location of the cen9∆ mutant neocentromeres. Neocentromeres of cen9∆-B, cen9∆-C and cen9∆-E formed at the same chromosomal location. The dark gray line, below the transposable elements, indicates the deleted region in the cen9∆ mutants (B) Detailed view of the neocentromere of cen10∆-B and the secondary CENP-A peak of cen10∆-A and cen10∆-C. (C) Overview of the chromosomal 10 region spanning 100 to 410 kb. cen10∆-A and cen10∆-C have two regions enriched with CENP-A (primary and secondary). (D) Schematic full overview of the full chromosome 10, the indentation represents the chromosomal location of the native centromere (CEN10). The light grey areas point to the zoomed-in chromosomal regions shown in panel C and below. The neocentromere of cen10∆-E is indicated with an arrow. Lower panel, detailed view of the native centromere (CEN10) and the neocentromeres formed in cen10∆-A, cen10∆-C, cen10∆-D, cen10∆-F and cen10∆-G mutants. The dark gray line, below the transposable elements, indicates the deleted region in the cen10∆ mutants (E) Detailed view of the telocentric neocentromere of cen10∆-E.
Figure 1—figure supplement 1
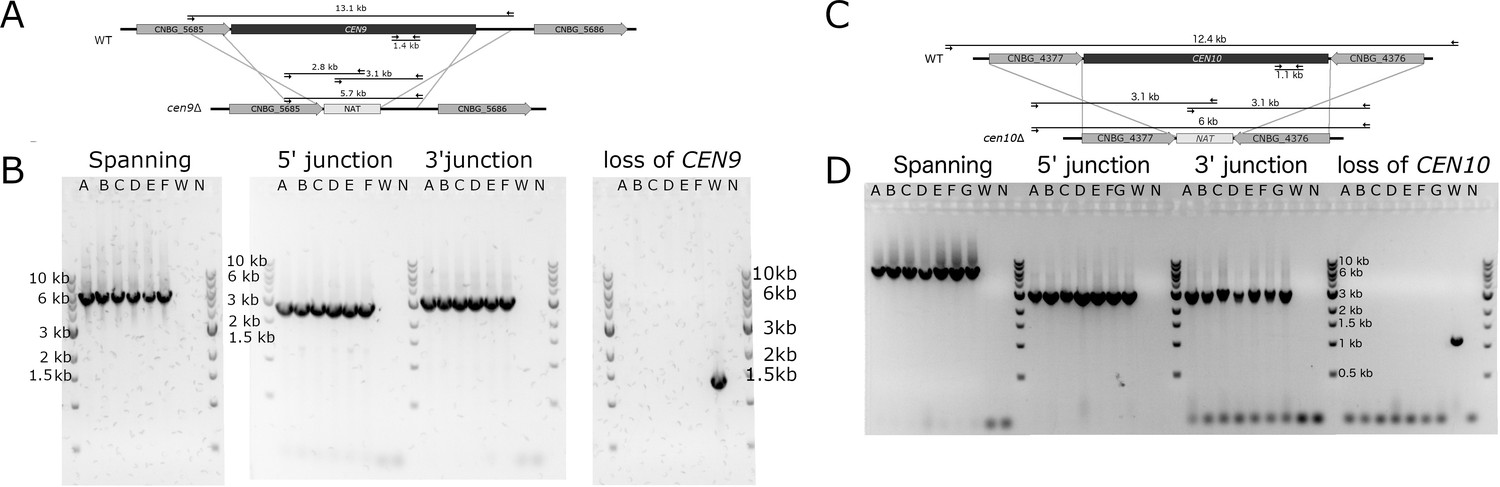
Confirmation of centromere 9 and 10 deletion by PCR.
(A) The native centromeric regions of chromosome 9 in the wild type and cen9∆ mutants are shown. Genes flanking the centromeric region in the WT strain are indicated with an arrow and gene ID. The centromere was replaced by a nourseothricin (NAT) drug-resistance gene cassette, indicated with a rectangle (labelled NAT). Black lines indicate the length of the PCR product used to confirm the centromere 9 deletion. Black arrows indicate primers. (B) PCR confirmation of the centromere 9 deletion in cen9∆ mutants ran on an ethidium bromide-stained gel. The WT (W) and no-template control (B) are included as controls. For the spanning PCR, both primers are located outside of the transformed product and for the junction PCRs, one primer is outside of the transformed product and one primer is located inside the nourseothricin (NAT) drug-resistance gene cassette. (C) Centromere 10 region of the wild type (WT) and cen10∆ mutants are shown. Genes and nourseothricin (NAT) drug-resistance gene cassette, primers, and the length of the PCR product are labeled as in A. (D) PCR confirmation of the centromere 10 deletion in cen10∆ mutants ran on an ethidium bromide-stained gel. The WT and no-template control (B) are included as controls.
Figure 1—figure supplement 2
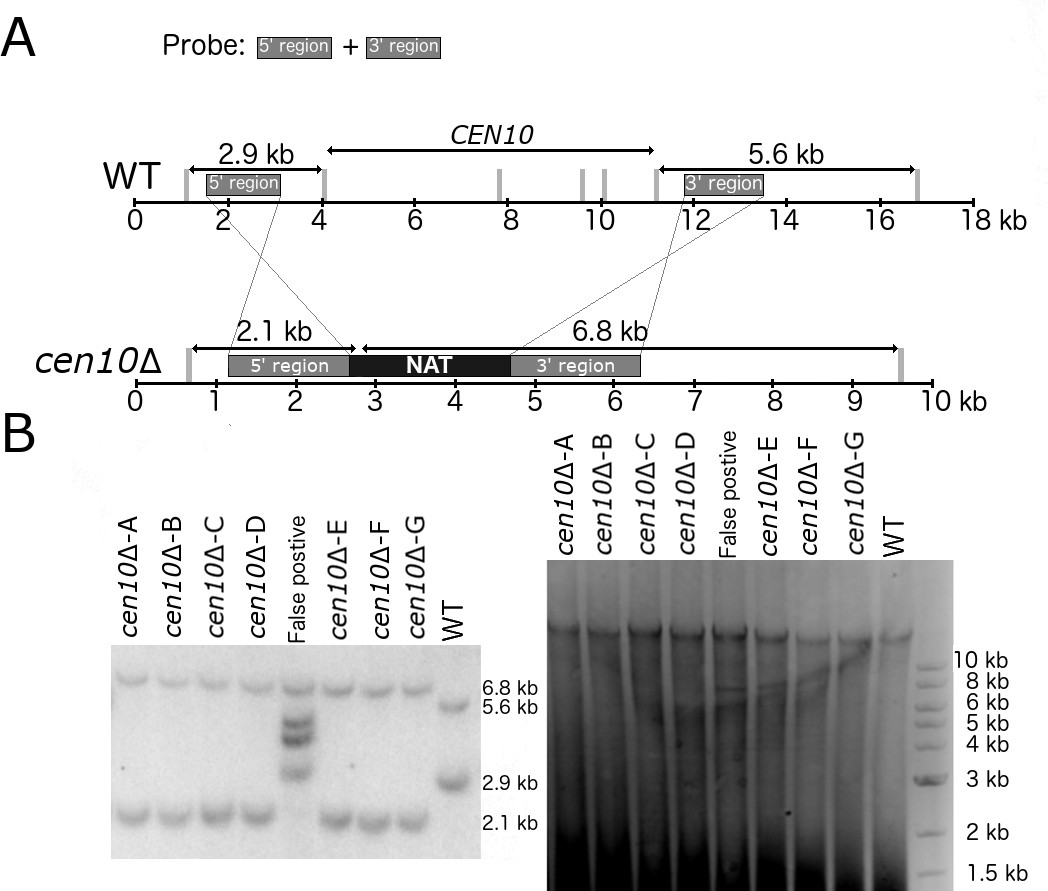
Centromere 10 is deleted in cen10∆ isolates.
(A) The region corresponding to the native centromere 10 of the wild type and cen10∆ mutants is shown. Upstream and downstream flanking regions, used for homologous recombination, are indicated with rectangles (labeled ‘5’ region’ or ‘3’ region’). The nourseothricin drug resistance gene cassette is indicated with a rectangle, (labeled NAT). Grey lines indicate XbaI restriction sites. PCR products of the 5’ and 3’ regions were used as Southern blot probes, and the expected restriction pattern is indicated above. (B) Southern blot analysis for the wild-type and cen10∆ mutant strains is presented. Left panel shows the Southern blot, right panel shows the ethidium bromide-stained gel prior to Southern blotting. Both the wild type and cen10∆ mutants have the expected restriction pattern which is shown in panel A.
Figure 1—figure supplement 3
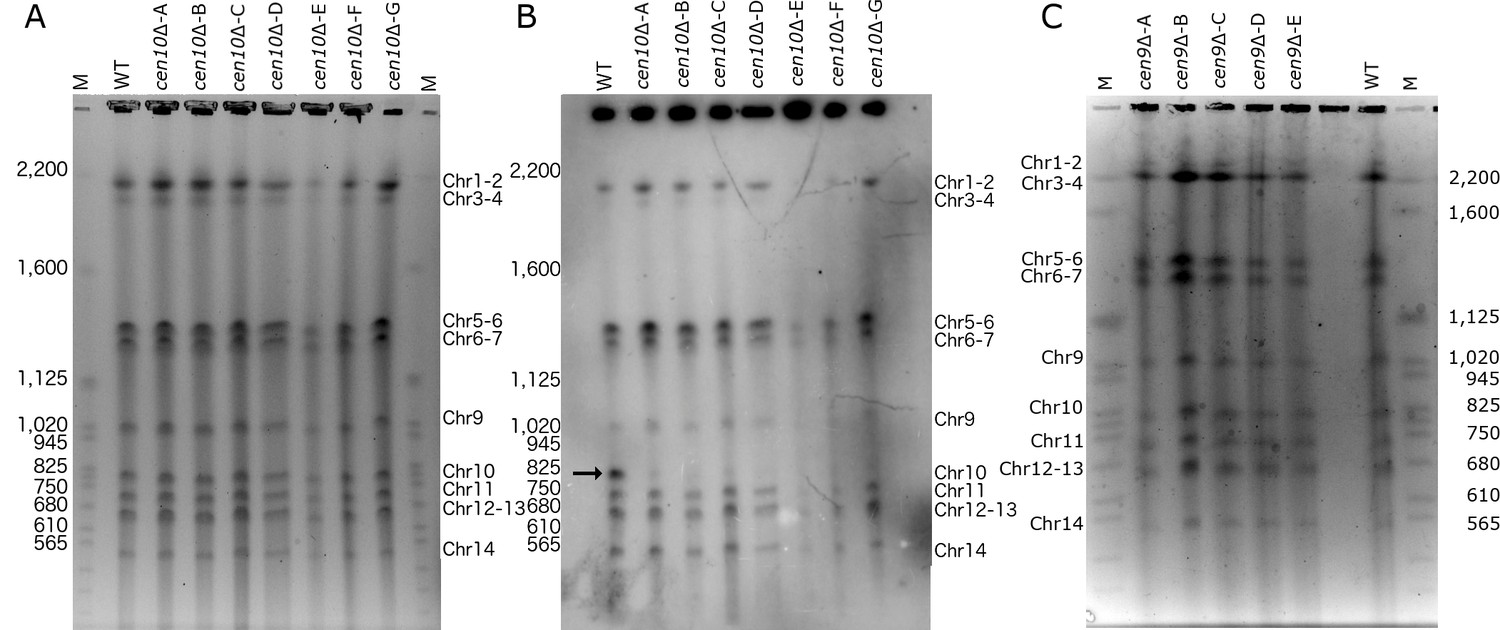
cen9∆ and cen10∆ mutants have a wild-type karyotype.
PFGE analysis with the wild type and cen9∆ and cen10∆ mutants. Cells were isolated from growing at 30°C. S. cerevisiae chromosomes serve as size markers and are indicated with ‘M’ on both sides of the ethidium bromide stained gel (Chromosome sizes shown on the left side). The chromosome sizes of the reference strain R265 are shown on the right side. In several cases, chromosomes co-migrate as indicated. (A) PFGE analysis of cen10∆ mutants. Order of samples from left to right are wild type and cen10∆ mutants (-A to -G). (B) Southern blot analysis of the PFGE from panel A. A region of CEN10 served as the probe. On chromosome 10, the probe only has homology with the centromere. In the wild-type strain, the probe hybridized to chromosome 10 (arrow). cen10∆ mutants lack centromere 10 and thus do not show hybridization of the probe. The probe has homology to centromeres of other chromosomes, resulting in cross-hybridization. (C) PFGE analysis of cen9∆ mutants. Order of samples from left to right are cen9∆ mutants (-A to -D) and wild type.
Figure 1—figure supplement 4

ChIP-qPCR with additional kinetochore proteins.
To confirm the binding of the kinetochore to the CENP-A-enriched regions, two additional kinetochore proteins were tagged with GFP and ChIP-qPCR analysis was performed. cen9∆ mutants were transformed with a construct expressing CENP-C-GFP and cen10∆ mutants were transformed with a construct expressing Mis12-GFP. As a control, the wild type was transformed with a construct expressing CENP-C-GFP or Mis12-GFP. For each, ChIP-qPCR data are shown for 1) the internal positive control (CEN6), 2) primer pair(s) specific for the neocentromere(s) and 3) enrichment compared to actin (set to 1). Error bars show standard deviation. (A) qPCR results of the ChIPs with cen10∆ mutants transformed with Mis12-GFP. cen10∆-A and cen10∆-C have two CENP-A-enriched regions (primary peak and secondary peak) and this is indicated in the figure. (B) qPCR results of ChIPs with cen9∆ mutants transformed with CENP-C-GFP. (C) qPCR results of the ChIP with the wild-type strain transformed with Mis12-GFP. This panel serves as a control for the ChIP-qPCRs performed in panel A. As the neocentromere of cen10∆-B and the secondary peak of cen10∆-A and cen10∆-C are formed in the same chromosomal region, the qPCR reaction for this chromosomal region in the wild type is only shown once. Similarly, the primary peak of cen10∆-A and cen10∆-C formed in the same chromosomal location, and this region is only shown once in the wild type. (D) qPCR results of the ChIP with the wild-type strain transformed with CENP-C-GFP. These qPCRs serve as a control for the ChIP-qPCRs performed in panel B. Three mutants have neocentromeres formed at the same chromosomal location (cen9∆-B, cen9∆-C and cen9∆-E) and the CENP-C enrichment of this region in the wild type is only shown once.
Figure 1—figure supplement 5
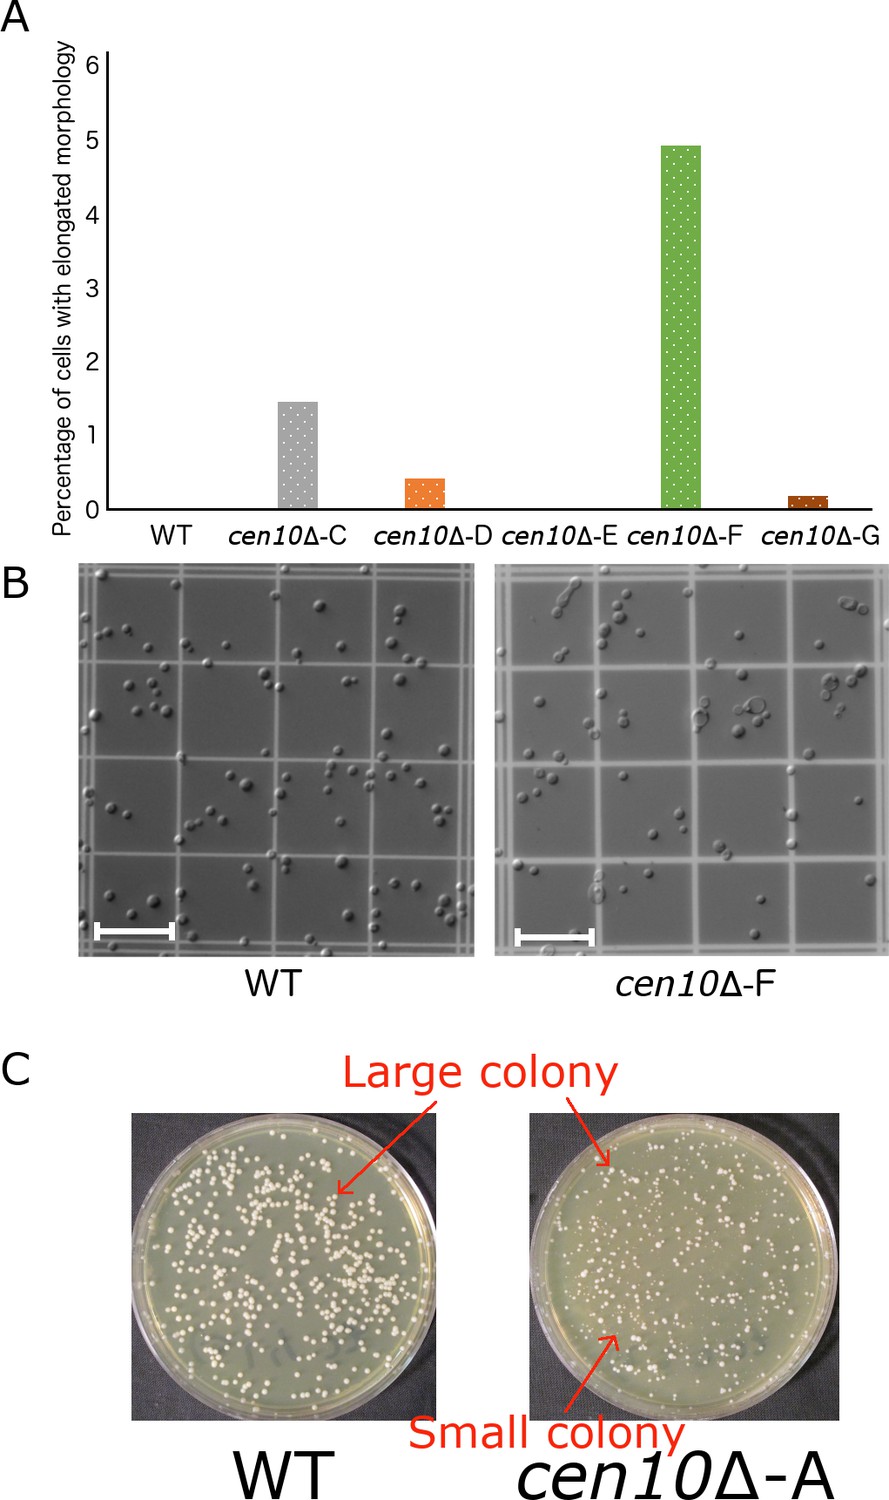
cen10∆ mutants have elongated cell morphology.
Cell morphology of >1000 cells each for the wild-type strain and five cen10∆ mutant strains was analyzed, counted, and plotted as a percentage of total cell number. L = large, S = small, Scale bar = 10 μm. (A) Percentage of cells with elongated cell morphology. Formation of abnormal cell morphology is rare. The cen10∆-C and cen10∆-F mutants have an increased number of elongated cells. cen10∆-D, cen10∆-E, and cen10∆-G mutants had <0.5% elongated cell morphology. (B) Representative view of wild-type and cen10∆-F mutant cells. Several cen10∆-F mutants had enlarged cell shapes and formed elongated cell clusters. (C) Representative view of wild-type colonies and a population of mixed colony sizes of cen10∆ mutants. Shown here is cen10∆-A. Large colonies have a size to similar to wild type.
Figure 2
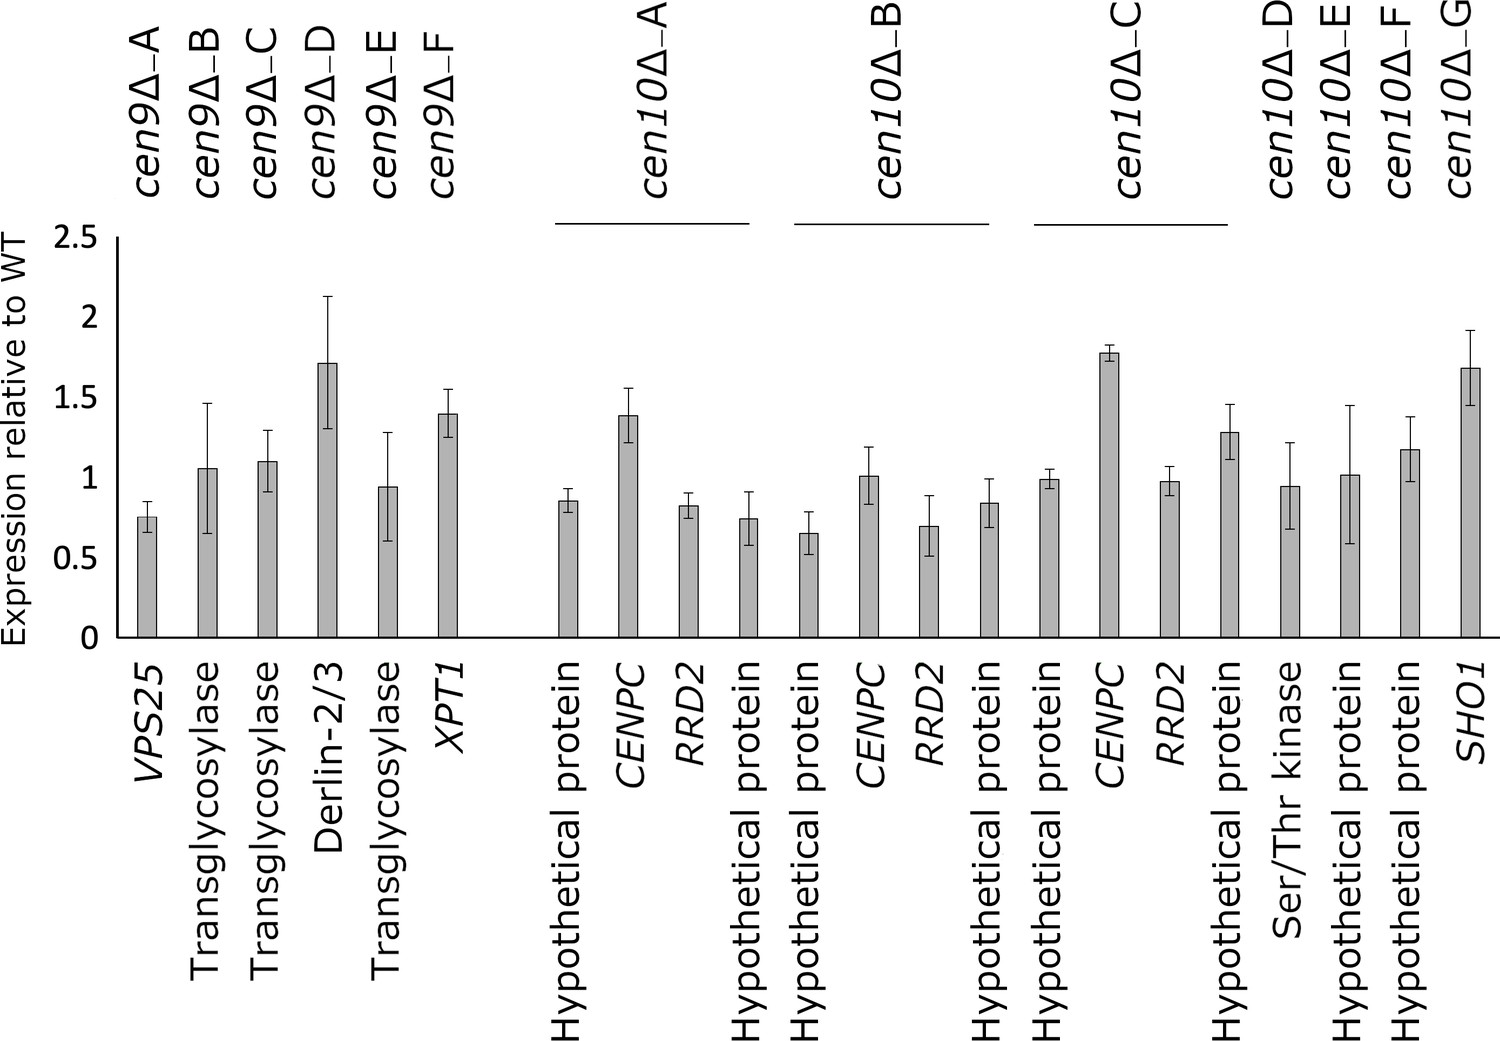
Expression of neocentromeric genes.
Expression of the neocentromeric genes was assessed by qPCR for all cenΔ mutants and expression is shown as Log2ΔΔCt. For cen10∆-A, cen10∆-B and cen10∆-C, two genes were selected from each neocentromeric region, all other cen∆ mutants are represented by one gene spanned by CENP-A. cen10∆-B has only one CENP-A-enriched region, and in this case, the genes located within primary peak of cen10∆-A and cen10∆-C served as controls. The qPCRs of cen10∆ mutants are normalized with a housekeeping gene located on chromosome 10. The qPCRs of cen9∆ mutants are normalized with actin. Error bars show standard deviation.
Figure 3 with 1 supplement
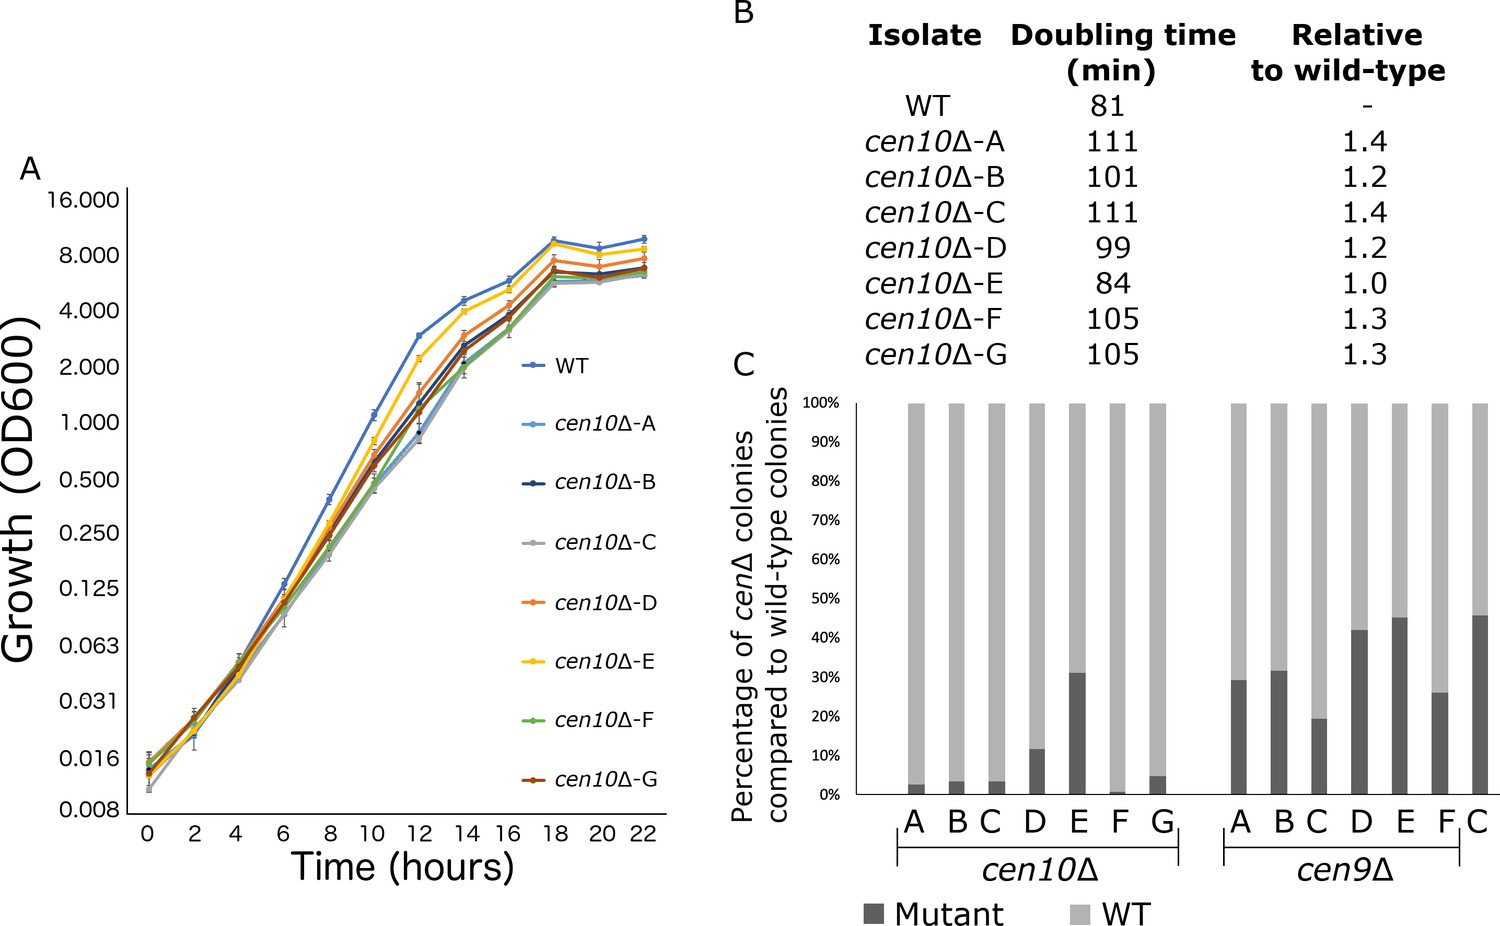
cen10∆ mutant strains have reduced fitness compared to the wild-type strain.
(A) Six out of seven cen10∆ mutants had a longer doubling time and slower growth than the wild-type strain. In contrast cen10∆-E grows similarly to the wild type. Error bars show standard deviation. (B) Doubling times and fold change compared to wild type are shown. (C) Competition assays with the wild type and cen9∆ and cen10∆ mutant strains. Mixed cultures (1:1) were grown overnight and plated with and without selection agents. After four days, colonies were counted and the percentage of cenΔ mutants (black) and wild type (grey) in each culture was plotted. As a control (C) a wild-type strain with a NAT marker was mixed with the wild type.
Figure 3—figure supplement 1
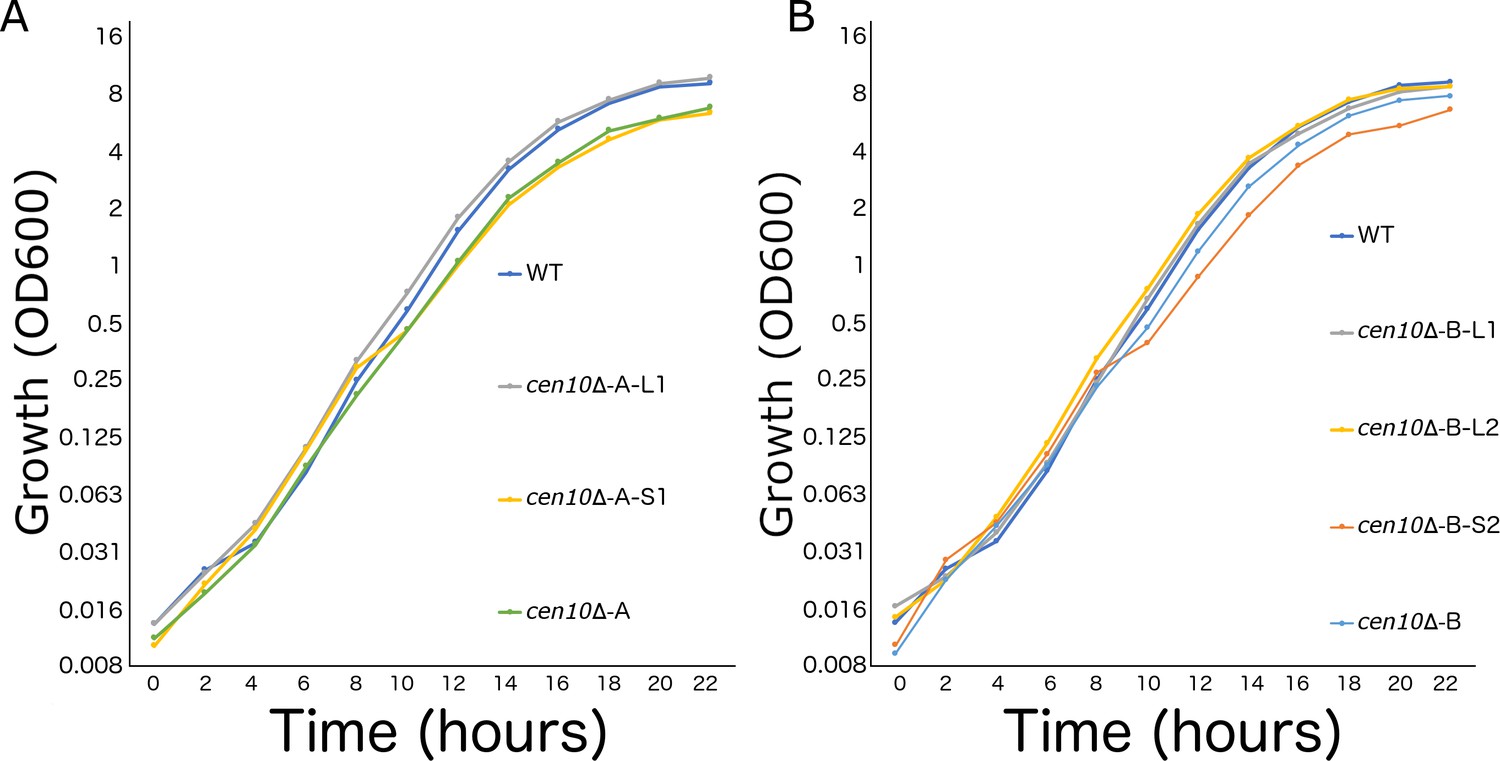
cen10∆ mutants with chromosomal fusion have a wild-type growth rate.
The doubling times of large and small colonies derived from cen10∆ mutants at 30°C were determined. Large colonies had a growth rate similar to the wild-type strain, while small colonies and the initial cen10∆ mutants had a similar growth rate with one another but that was slower than the wild-type strain and the derived large colonies. (A) Growth curves for cen10∆-A-derived isolates and the wild-type strain are shown. (B) Growth curves for cen10∆-B-derived isolates and the wild-type strain are shown.
Figure 4 with 1 supplement

cen10∆ mutants are aneuploid.
The whole genomes of small and large colonies derived from four cen10∆ mutants were sequenced and read coverage (corresponding to ploidy levels) was plotted. Small colonies of cen10∆ mutants were partially aneuploid for chromosome 10, while the large colonies are euploid. (A) Genome-wide read depth coverage for small and large colonies. On the right, the fold coverage for the highest ploidy level is indicated for each sample. For example, chromosome 10 of cen10∆-B-S1 had an aneuploidy level of 1.35-fold compared to the wild-type strain. Chromosome 4 had a small region with increased read depth due to the ribosomal rDNA gene cluster and was excluded from the analysis. Chromosome 8 of cen10∆-E was duplicated. In addition, cen10∆-E-S3 had an additional duplicated region of 162 kb of chromosome 5 that spans the sequence of native centromere 5. (B) Detailed view of read depth of chromosome 10. As in panel A, read depth is indicated on the right. The native centromeric location is shown by a black square. Due to the deletion of centromere 10, the location of the native centromere lacks sequence reads for each sample.
Figure 4—figure supplement 1
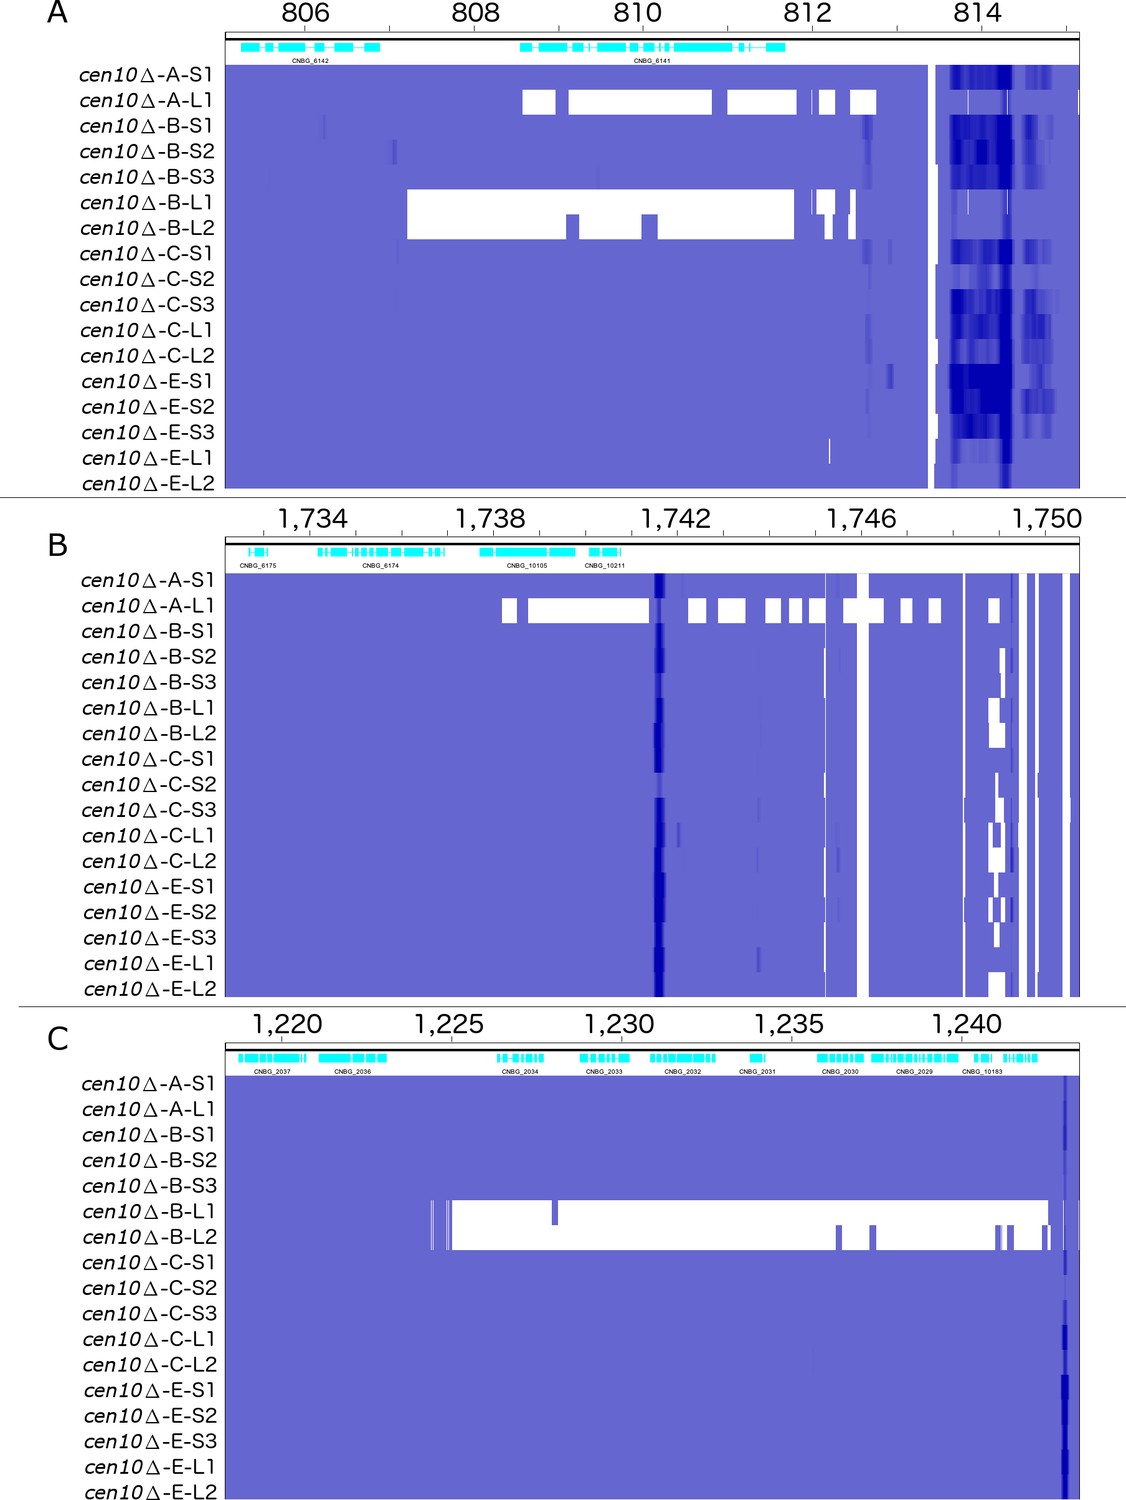
Deletion within subtelomeric regions in chromosome fusion isolates.
Sequence reads were mapped to the reference R265 genome. Regions with sequence coverage are shown in blue, and those without sequence coverage are shown in white. Subtelomeric regions of the large cen10∆ colonies have lost sequence coverage, whereas cen10∆ small colonies have wild-type sequence coverage. Telomeric loss was not observed for the large colonies of cen10Δ∆-E. For all panels, genes (CDS) are shown on the top (light blue). (A) Detailed view of the 3’ subtelomeric region of chromosome 10. Large colonies of cen10∆-A and cen10∆-B lost sequences corresponding to a region of 6.5 and ~8 kb. (B) Detailed view of the 3’ subtelomeric region of chromosome 4. Large colonies of cen10∆-A have lost sequences corresponding to a 12 kb region. (C) Detailed view of the 3’ subtelomeric region of chromosome 7. Large colonies of cen10∆-B lost sequences corresponding to an ~18.5 kb region.
Figure 5 with 1 supplement
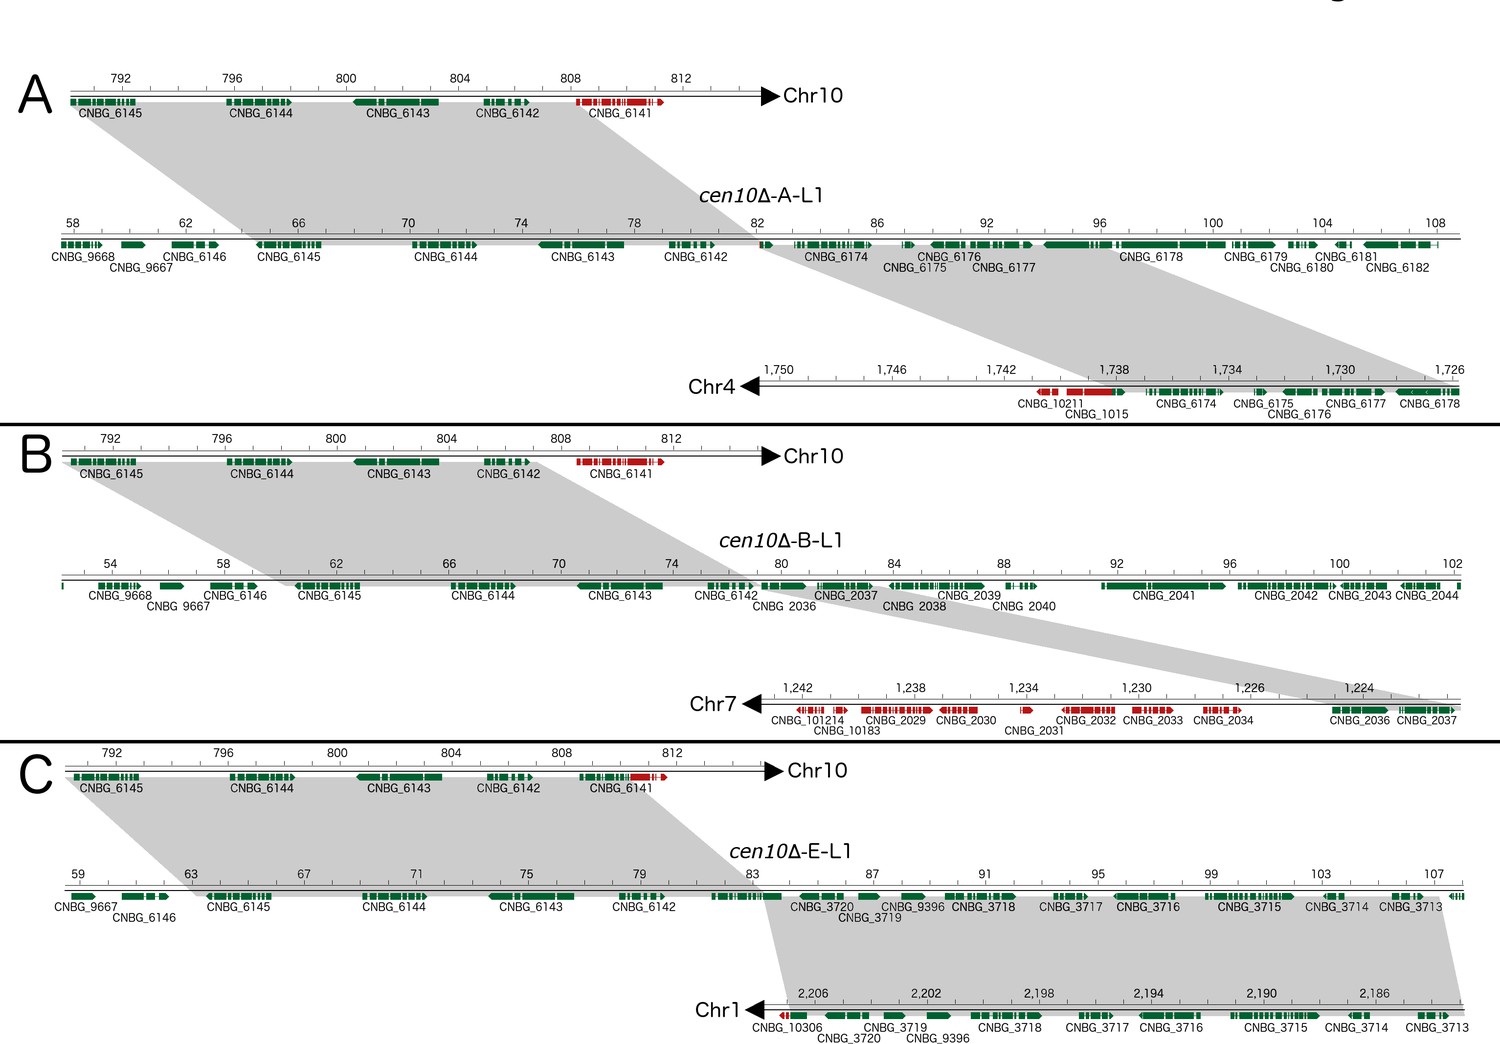
cen10∆ mutants undergo chromosome fusion leading to improved fitness at 37°C.
Chromosomal fusions were studied in detail for three cen10∆ mutants restored to wild-type growth levels at 37°C (large colonies). After chromosome fusion, the fused chromosomes of cen10∆-A-L and cen10∆-B-L lost the gene CNBG_6141, which is located in the 3’ subtelomeric region of chromosome 10. Genes present in the fused chromosome are depicted in green, and genes lost after chromosome fusion are indicated in red. Gray highlights indicate regions present in both the parental and fused chromosomes. Each fusion occurred in a unique nonrepetitive region. (A) cen10∆-A-L1, the fusion occurred between chromosome 10 and chromosome 4. (B) In cen10∆-B-L1, chromosomal fusion occurred between chromosomes 10 and 7. (C) cen10∆-E-L1 chromosomal fusion occurred between chromosomes 10 and 1.
Figure 5—figure supplement 1
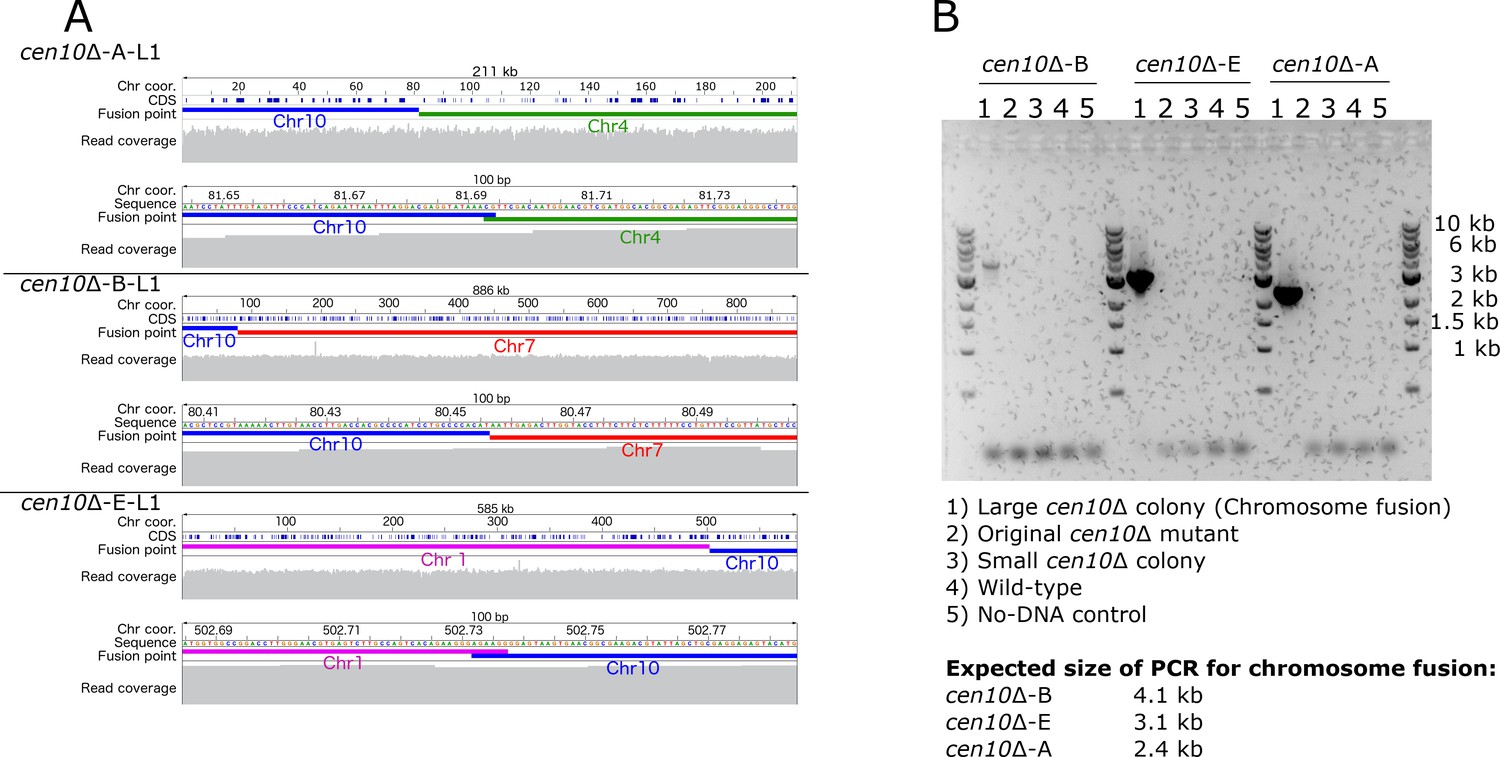
Chromosome fusion in large cen10∆ colonies.
Sequence reads were mapped back to the de novo cen10∆ genome assemblies to verify the quality of the de novo cen10∆ mutant genome assemblies. For each panel the full length of the scaffold, which includes the fusion point, and a 100 bp detailed region is shown. Sequences homologous to chromosome 10 are depicted in blue and sequence reads mapped back to the de novo genome assemblies are shown in grey. (A) The de novo genome assembly of cen10∆-A-L1 contains a scaffold (~211 kb) of a fused chromosome and this scaffold consists of an 81.97 kb region of chromosome 10 (blue) and a 129.38 kb region of chromosome 4 (green). The sequence coverage of this scaffold is 104 fold. The chromosome fusion occurred with a 2 bp overlap between chromosome 4 and 10. (B) The de novo genome assembly of cen10∆-B-L1 contains a scaffold (~886 kb) and consists of an 80.46 kb region of chromosome 10 (blue) and an 806.09 kb region of chromosome 7 (red). The fusion point lacks overlap between chromosomes 7 and 10. The sequence coverage of this scaffold is 104 fold. (C) The de novo genome assembly of cen10∆-E-L1 consists of a scaffold (~585 kb) of a fused chromosome and this scaffold consists of an 83.59 kb region of chromosome 10 (blue) and 501.37 kb of chromosome 1 (pink). The sequence coverage of this scaffold is 140 fold. The chromosome fusion occurred with a 6 bp overlap between chromosome 1 and 10. (D) PCR confirmation of the chromosome fusion occurring in the large colonies derived from cen10∆-B, cen10∆-C, and cen10∆-A. For each chromosomal fusion, a PCR spanning the fusion was performed. For each chromosome fusion, PCRs were performed for: 1) a large colony derived from the cen10∆ mutant, 2) the original cen10∆ mutant, 3) a small colony derived from growth at 37°C, and 4) the wild type.
Figure 6
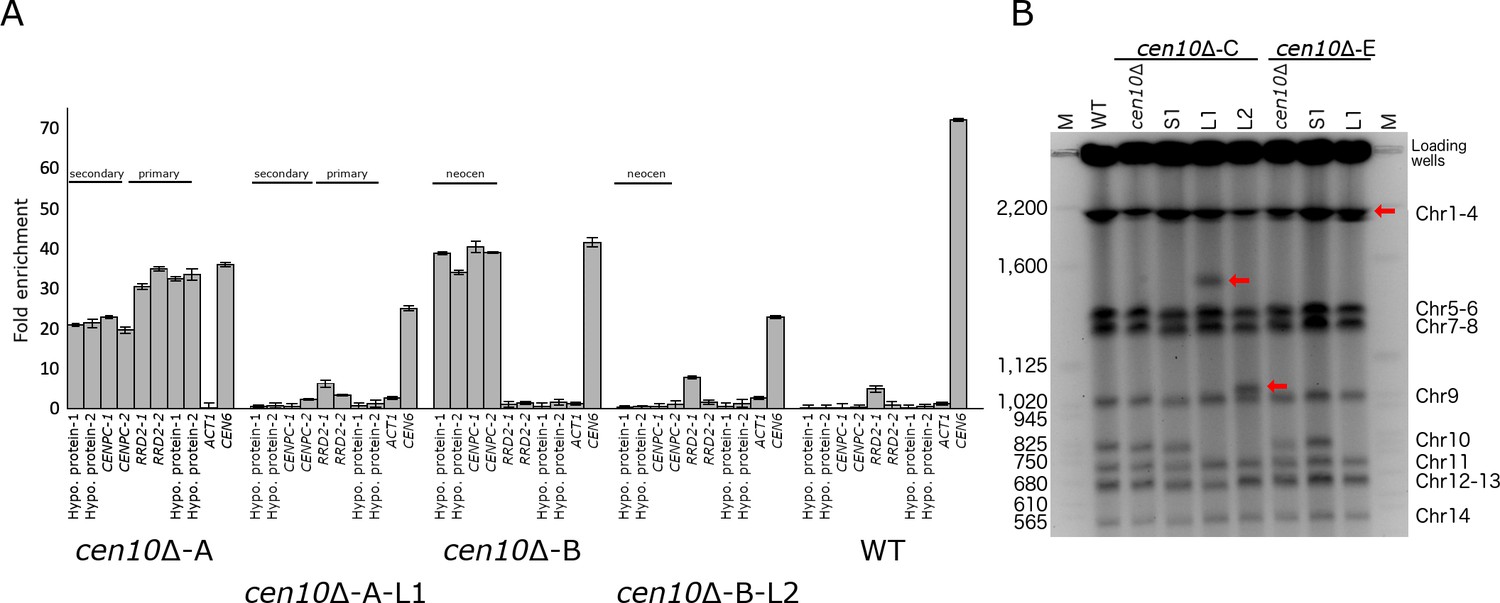
Chromosome fusion results in neocentromere inactivation and karyotype reduction.
(A) Neocentromeres are inactive after chromosomal fusion. For each neocentromere two qPCR primer pairs located in genes spanned by the neocentromere in cen10∆-A and cen10∆-B mutant were used in a ChIP-qPCR experiment. Analyzed is the CENP-A enrichment of 1) a cen10∆ mutant, 2) a large colony derived from the cen10∆ mutant, and 3) the wild-type strain. Centromere 6 (CEN6) was included as a positive control, and actin was included as a negative control. Data are shown for cen10∆-A, cen10∆-A-L1, cen10∆-B, cen10∆-B-L2, and wild type. For cen10∆-A and cen10∆-A-L1 mutants, the chromosomal regions investigated are indicated according to the primary and secondary CENP-A peaks of the cen10∆-A mutant. The cen10∆-B mutant has only one CENP-A-enriched region which co-localized with the secondary CENP-A peak of cen10∆-A and this region is labeled with neocen in cen10∆-B and cen10∆-B-L1. Error bars show standard deviation. (B) PFGE analysis shows that the band corresponding to chromosome 10 was lost in the large colonies and instead larger bands appear due to the fusion of chromosome 10 with other chromosomes. cen10∆ deletion mutants and small colonies derived from 37°C show a wild-type karyotype. Chromosome 10 of the large colonies was fused to chromosome 13, 10, or 1, respectively. Due to limitations of PFGE conditions, the chromosome 10–chromosome 1 fusion did not separate from chromosomes 2, 3, and 4. The positions of the fused chromosomes are indicated with arrows.
Tables
Table 1
Genes located inside neocentromeres.
The chromosomal locations, sizes, and GC content (%) for the native centromere and cen∆ mutants are shown. For the neocentromeres, gene ID, predicted function, and the amount of CENP-A coverage are indicated.
| Chr coor (bp) | Size (kb) | Size compared to native centromere (%) | GC% | Genes spanned by neocentromere | Gene ID | % covered by Neocentromere | Exons inside neocentromere | |
|---|---|---|---|---|---|---|---|---|
| Native centromere 9 | Chr9:755,771–762,621 | 6.84 | - | 43.6 | - | - | - | - |
| cen9∆-A | Chr9:785,352–789,247 | 3.87 | 56.6 | 46.1 | Escrt-II complex subunit (VPS25) | CNBG_5690 | 100 | |
| Iron regulator 1 | CNBG_9614 | 14.6 | Last exon | |||||
| cen9∆-B | Chr9:775,164–780,756 | 4.41 | 64.5 | 46.6 | Xylosylphosphotransferase (XPT1) | CNBG_5687 | 6.9 | |
| Transglycosylase SLT domain-containing protein | CNBG_9613 | 100 | ||||||
| Glutamate synthase (NADPH/NADH) | CNBG_5689 | 33.7 | ||||||
| cen9∆-C | Chr9:775,164–780,756 | 4.41 | 64.5 | 46.6 | Xylosylphosphotransferase (XPT1) | CNBG_5687 | 6.9 | |
| Transglycosylase SLT domain-containing protein | CNBG_9613 | 100 | ||||||
| Glutamate synthase (NADPH/NADH) | CNBG_5689 | 33.7 | ||||||
| cen9∆-D | Chr9:750,902–755,294 | 4.37 | 63.9 | 41.9 | Hypothetical protein | CNBG_5684 | 92.8 | |
| Derlin-2/3 | CNBG_5685 | 100 | ||||||
| cen9∆-E | Chr9:775,164–780,756 | 5.56 | 81.3 | 50 | Xylosylphosphotransferase (XPT1) | CNBG_5687 | 6.9 | |
| Transglycosylase SLT domain-containing protein | CNBG_9613 | 100 | Last exon | |||||
| Glutamate synthase (NADPH/NADH) | CNBG_5689 | 33.7 | Last exon | |||||
| cen9∆-F | Chr9:771,614–775,469 | 3.83 | 56.0 | 51.5 | Xylosylphosphotransferase (XPT1) | CNBG_5687 | 100 | |
| Native centromere 10 | Chr10:362,876–369,657 | 6.77 | - | 42.6 | - | - | - | - |
| cen10∆-A | Chr10:115,954–120,422 | 4.46 | 65.9 | 46.9 | CENPC/MIF2 | CNBG_4461 | 88.3 | 1, 2, 3, 4 (only5th is outside) |
| Hypothetical protein | CNBG_4462 | 100 | ||||||
| Chr10:391,090–393,946 | 2.85 | 42.1 | 48.9 | Serine/threonine-protein phosphatase 2A activator 2(RRD2) | CNBG_9459 | 10.6 | Last exon (5th) | |
| Hypothetical protein | CNBG_4366 | 100 | ||||||
| Hypothetical protein | CNBG_4365 | 23.4 | Last exon (3th) | |||||
| cen10∆-B | Chr10:115,954–120,422 | 4.46 | 65.9 | 46.9 | CENPC/MIF2 | CNBG_4461 | 88.3 | 1, 2, 3, 4 (only 5th is outside) |
| Hypothetical protein | CNBG_4462 | 100 | ||||||
| cen10∆-C | Chr10:115,954–120,422 | 4.46 | 65.9 | 46.9 | CENPC/MIF2 | CNBG_4461 | 88.3 | 1, 2, 3, 4 (only 5th is outside) |
| Hypothetical protein | CNBG_4462 | 100 | ||||||
| Chr10:391,090–393,946 | 2.85 | 42.1 | 48.9 | Serine/threonine-protein phosphatase 2A activator 2(RRD2) | CNBG_9459 | 10.6 | Last exon (5th) | |
| Hypothetical protein | CNBG_4366 | 100 | ||||||
| Hypothetical protein | CNBG_4365 | 23.4 | Last exon (3th) | |||||
| cen10∆-D | Chr10:352,648–355,154 | 2.51 | 37.1 | 48 | Ser/Thr protein kinase | CNBG_4379 | 88.4 | |
| cen10∆-E | Chr10:1–4,385 | 4.38 | 64.7 | 53.2 | Hypothetical protein | CNBG_10450 | 100 | |
| Hypothetical protein | CNBG_4495 | 100 | ||||||
| cen10∆-F | Chr10:342,517–345,159 | 2.64 | 39.0 | 45.5 | Hypothetical protein | CNBG_4383 | 18.6 | Last two exons |
| Hypothetical protein | CNBG_10075 | 100 | ||||||
| Hexokinase (HXK1) | CNBG_4382 | 15.3 | Last three exons | |||||
| cen10∆-G | Chr10:378,389–386,366 | 7.97 | 117.7 | 46.5 | High osmolarity signaling protein (SHO1) | CNBG_4373 | 100 | |
| Hypothetical protein | CNBG_4372 | 100 | ||||||
| Hypothetical protein | CNBG_4371 | 100 | ||||||
| Hypothetical protein | CNBG_4370 | 100 | ||||||
Key resources table
| Reagent type (species) or resource | Designation | Source or reference | Identifiers | Additional information |
|---|---|---|---|---|
| Genetic reagent Cryptococcus deuterogattii | R265 | This study | R265 expressing mCherry-CENPA | |
| Genetic reagent Cryptococcus deuterogattii | cen10△-A | This study | R265 centromere 10 deletion mutant with expressing mCherry-CENPA | |
| Genetic reagent Cryptococcus deuterogattii | cen10△-B | This study | R265 centromere 10 deletion mutant with expressing mCherry-CENPA | |
| Genetic reagent Cryptococcus deuterogattii | cen10△-C | This study | R265 centromere 10 deletion mutant with expressing mCherry-CENPA | |
| Genetic reagent Cryptococcus deuterogattii | cen10△-D | This study | R265 centromere 10 deletion mutant with expressing mCherry-CENPA | |
| Genetic reagent Cryptococcus deuterogattii | cen10△-E | This study | R265 centromere 10 deletion mutant with expressingmCherry-CENPA | |
| Genetic reagent Cryptococcus deuterogattii | cen10△-F | This study | R265 centromere 10 deletion mutant with expressing mCherry-CENPA | |
| Genetic reagent Cryptococcus deuterogattii | cen10△-G | This study | R265 centromere 10 deletion mutant with expressing mCherry-CENPA | |
| Genetic reagent Cryptococcus deuterogattii | cen10△-A-S1 | This study | Small colony derived from R265 centromere 10A deletion mutant with expressing mCherry-CENPA | |
| Genetic reagent Cryptococcus deuterogattii | cen10△-A-L1 | This study | Large colony derived from R265 centromere 10A deletion mutant with expressingmCherry-CENPA | |
| Genetic reagent Cryptococcus deuterogattii | cen10△-B-S1 | This study | Small colony derived from R265 centromere 10B deletion mutant with expressing mCherry-CENPA | |
| Genetic reagent Cryptococcus deuterogattii | cen10△-B-S2 | This paper | Small colony derived from R265 centromere 10B deletion mutant with expressing mCherry-CENPA | |
| Genetic reagent Cryptococcus deuterogattii | cen10△-B-S3 | This study | Small colony derived from R265 centromere 10B deletion mutant with expressing mCherry-CENPA | |
| Genetic reagent Cryptococcus deuterogattii | cen10△-B-L1 | This study | Large colony derived from R265 centromere 10B deletion mutant with expressing mCherry-CENPA | |
| Genetic reagent Cryptococcus deuterogattii | cen10△-B-L2 | This study | Large colony derived from R265 centromere 10B deletion mutant with expressing mCherry-CENPA | |
| Genetic reagent Cryptococcus deuterogattii | cen10△-C-S1 | This study | Small colony derived from R265 centromere 10C deletion mutant with expressing mCherry-CENPA | |
| Genetic reagent Cryptococcus deuterogattii | cen10△-C-S2 | This study | Small colony derived from R265 centromere 10C deletion mutant with expressing mCherry-CENPA | |
| Genetic reagent Cryptococcus deuterogattii | cen10△-C-S3 | This study | Small colony derived from R265 centromere 10C deletion mutant with expressing mCherry-CENPA | |
| Genetic reagent Cryptococcus deuterogattii | cen10△-C-L1 | This study | Large colony derived from R265 centromere 10C deletion mutant with expressing mCherry-CENPA | |
| Genetic reagent Cryptococcus deuterogattii | cen10△-C-L2 | This study | Large colony derived from R265 centromere 10C deletion mutant with expressing mCherry-CENPA | |
| Genetic reagent Cryptococcus deuterogattii | cen10△-E-S1 | This study | Small colony derived from R265 centromere 10E deletion mutant with expressing mCherry-CENPA | |
| Genetic reagent Cryptococcus deuterogattii | cen10△-E-S2 | This study | Small colony derived from R265 centromere 10E deletion mutant with expressing mCherry-CENPA | |
| Genetic reagent Cryptococcus deuterogattii | cen10△-E-S3 | This study | Small colony derived from R265 centromere 10E deletion mutant with expressing mCherry-CENPA | |
| Genetic reagent Cryptococcus deuterogattii | cen10△-E-L1 | This study | Large colony derived from R265 centromere 10E deletion mutant with expressing mCherry-CENPA | |
| Genetic reagent Cryptococcus deuterogattii | cen10△-E-L2 | This study | Large colony derived from R265 centromere 10E deletion mutant with expressing mCherry-CENPA | |
| Genetic reagent Cryptococcus deuterogattii | cen9△-A | This study | R265 centromere 9 deletion mutant with expressing mCherry-CENPA | |
| Genetic reagent Cryptococcus deuterogattii | cen9△-B | This study | R265 centromere 9 deletion mutant with expressing mCherry-CENPA | |
| Genetic reagent Cryptococcus deuterogattii | cen9△-C | This study | R265 centromere 9 deletion mutant with expressing mCherry-CENPA | |
| Genetic reagent Cryptococcus deuterogattii | cen9△-D | This study | R265 centromere 9 deletion mutant with expressing mCherry-CENPA | |
| Genetic reagent Cryptococcus deuterogattii | cen9△-E | This study | R265 centromere 9 deletion mutant with expressing mCherry-CENPA | |
| Genetic reagent Cryptococcus deuterogattii | cen9△-F | This study | R265 centromere 9 deletion mutant with expressing mCherry-CENPA | |
| Genetic reagent Cryptococcus deuterogattii | R265 MIS12 | This study | R265 expressing GFP-MIS12 and mCherry-CENPA | |
| Genetic reagent Cryptococcus deuterogattii | cen10△-A MIS12 | This study | R265 Centromere 10 mutant with expressing GFP-MIS12 and mCherry-CENPA | |
| Genetic reagent Cryptococcus deuterogattii | cen10△-B MIS12 | This study | R265 Centromere 10 mutant with expressing GFP-MIS12 and mCherry-CENPA | |
| Genetic reagent Cryptococcus deuterogattii | cen10△-C MIS12 | This study | R265 Centromere 10 mutant with expressing GFP-MIS12 and mCherry-CENPA | |
| Genetic reagent Cryptococcus deuterogattii | cen10△-D MIS12 | This study | R265 Centromere 10 mutant with expressing GFP-MIS12 and mCherry-CENPA | |
| Genetic reagent Cryptococcus deuterogattii | cen10△-E MIS12 | This study | R265 Centromere 10 mutant with expressing GFP-MIS12 and mCherry-CENPA | |
| Genetic reagent Cryptococcus deuterogattii | R265 CENPC | This study | R265 with expressing GFP-CENPC and mCherry-CENPA | |
| Genetic reagent Cryptococcus deuterogattii | cen9△-A CENPC | This study | R265 Centromere 9 mutant with expressing GFP-CENPC and mCherry-CENPA | |
| Genetic reagent Cryptococcus deuterogattii | cen9△-B CENPC | This study | R265 Centromere 9 mutant with expressing GFP-CENPC andmCherry-CENPA | |
| Genetic reagent Cryptococcus deuterogattii | cen9△-C CENPC | This study | R265 Centromere 9 mutant with expressing GFP-CENPC andmCherry-CENPA | |
| Genetic reagent Cryptococcus deuterogattii | cen9△-D CENPC | This study | R265 Centromere 9 mutant with expressing GFP-CENPC and mCherry-CENPA | |
| Genetic reagent Cryptococcus deuterogattii | cen9△-E CENPC | This study | R265 Centromere 9 mutant with expressing GFP-CENPC and mCherry-CENPA | |
| Antibody | Anti-mCherry antibody(Rabbit polyclonal) | Abcam | Cat. no. ab183628 | ChIP (1/5000) |
| Antibody | Anti-GFP (Rabbit polyclonal) antibody | Abcam | Cat. no. ab290 | ChIP (5 µg for 1 µg of chromatin) |
| Other | Dynabeads Protein A for Immunoprecipitation | Invitrogen | Cat. no. 10001D | ChIP (20 µl per500 µl fraction) |
| Software, algorithm | Bowtie2 | Langmead, 2010 | ||
| Software, algorithm | Spades | Bankevich et al., 2012 | ||
| Software, algorithm | IGV | Thorvaldsdóttir et al., 2013 | ||
| Software, algorithm | HISAT2 | Pertea et al., 2016 | ||
| Sequence-based reagent | List of primers used in this study | Sigma | In Supplementary file 4 |
Additional files
-
Supplementary file 1
Neocentromeres are not enriched with transposable elements.
To exclude the possibility that transposable elements were deposited into the neocentromeres, BlastN searches in a database with de novo genome assemblies of cen10∆-A, cen10∆-B, cen10∆-C, and cen10∆-E were performed. As input the homologous wild-type sequence of the chromosomal location of the neocentromeres was used. All neocentromeres of the tested cen10∆ mutants have the same length as the homologous sequence in the wild -type.
- https://cdn.elifesciences.org/articles/56026/elife-56026-supp1-v2.xlsx
-
Supplementary file 2
Neocentromeric regions are expressed in the wild-type strain.
Expression levels of genes where neocentromeres formed in the cenΔ mutants were analyzed in the R265 wild-type strain. Previously generated RNA sequencing data were remapped to the R265 reference genome, and the expression levels (FPKM) were analyzed for the native genes in each region wherein a neocentromere was formed in the cenΔ mutants. Expression analysis of several housekeeping genes was included for control purposes, and the median RNA expression level of all genes located on chromosomes 9 and 10 are listed. Expression levels of genes located in the subtelomeric regions were also analyzed.
- https://cdn.elifesciences.org/articles/56026/elife-56026-supp2-v2.xlsx
-
Supplementary file 3
Genes located in subtelomeric regions of chromosomes 1, 4, 7, and 10.
We have indicated whether each gene located in the subtelomeric regions was lost in the chromosomal fusion of the large-colony cen10∆ mutants. For each gene in the subtelomeric region of chromosome 1, 4, 7, and 10, several characteristics, such as the chromosomal location, putative function, and the presence of putative C. neoformans homologs in existing mutant libraries, are indicated. There is no correlation between the loss of genes with or without predicted function.
- https://cdn.elifesciences.org/articles/56026/elife-56026-supp3-v2.xlsx
-
Supplementary file 4
Primers used in this study.
For each primer, the lab identifier, purpose, and sequence are shown.
- https://cdn.elifesciences.org/articles/56026/elife-56026-supp4-v2.xlsx
-
Supplementary file 5
Strains used in this study.
For each strain used in this study, the lab strain identifier, description, and parental strain are indicated.
- https://cdn.elifesciences.org/articles/56026/elife-56026-supp5-v2.xlsx
-
Transparent reporting form
- https://cdn.elifesciences.org/articles/56026/elife-56026-transrepform-v2.pdf
Download links
A two-part list of links to download the article, or parts of the article, in various formats.
Downloads (link to download the article as PDF)
Open citations (links to open the citations from this article in various online reference manager services)
Cite this article (links to download the citations from this article in formats compatible with various reference manager tools)
Centromere deletion in Cryptococcus deuterogattii leads to neocentromere formation and chromosome fusions
eLife 9:e56026.
https://doi.org/10.7554/eLife.56026


