Delta glutamate receptor conductance drives excitation of mouse dorsal raphe neurons
- National Institute on Drug Abuse Intramural Research Program, National Institutes of Health, United States
- Center on Compulsive Behaviors, National Institutes of Health, United States
- Johns Hopkins Medicine, Neurology Department, United States
Figures
Figure 1
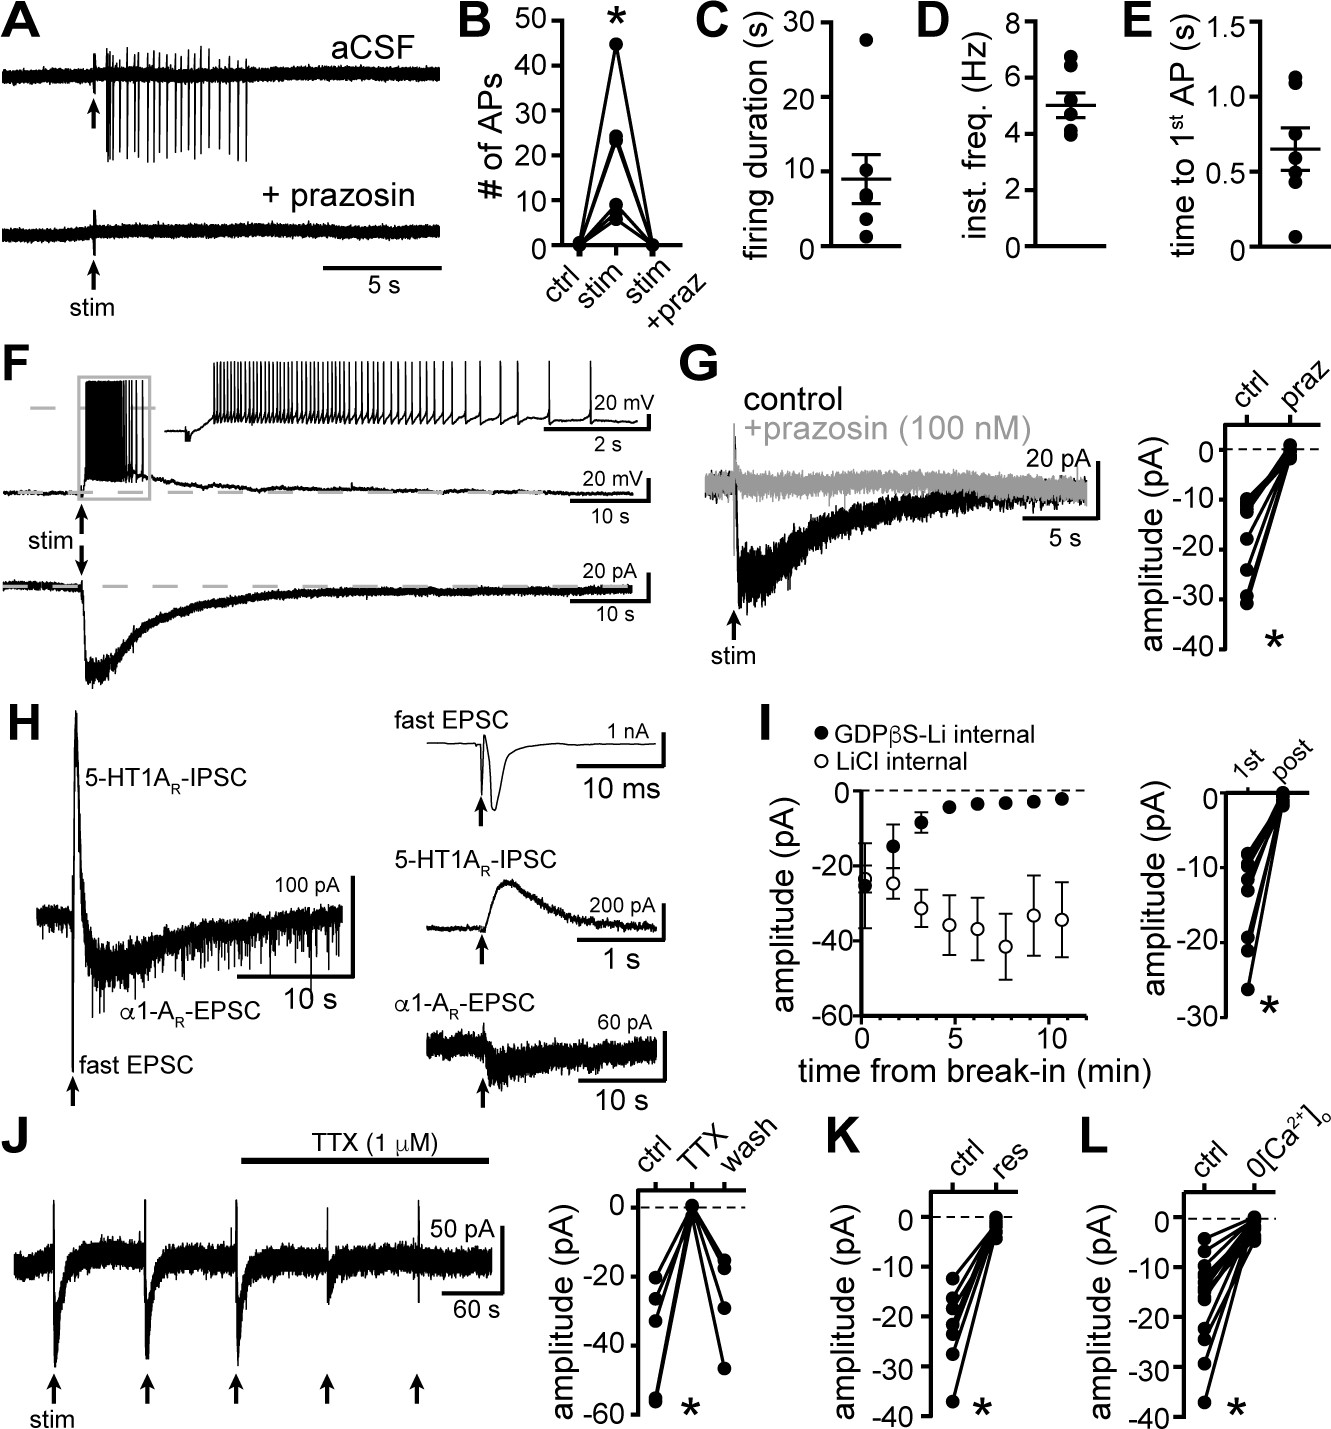
Electrical stimulation evokes long-lasting action potential firing produced by an α1-adrenergic receptor-dependent EPSC.
(A) Representative traces of cell-attached recording where stimulation of the brain slice (5 stims at 60 Hz) produced action potential firing that was abolished by application of the α1-adrenergic receptor antagonist, prazosin (100 nM). (B) Plot of number of action potentials showing the stimulation-induced increase in frequency (p=0.004, n = 6). (C) Plot of duration of action potential firing. (D) Plot of mean instantaneous frequency of action potential firing over the first 10 s of firing. (E) Plot of the latency from stimulation onset to the first action potential. (F) Example whole-cell recordings in the same cell, where electrical stimulation of the slice produced prolonged action potential firing in current-clamp (upper trace) and a slow EPSC in voltage-clamp mode (lower trace). (G) Bath application of prazosin eliminated the slow EPSC shown in a representative trace (left, baseline adjusted) and in grouped data (right, p=0.002, n = 10). (H) Representative traces of a whole-cell recording when the brain slice was stimulated in the absence of antagonists showing the kinetics of the α1-AR-EPSC relative to the fast EPSC (peak has been truncated) and 5HT1AR-IPSC (left). Subsequent addition of AMPAR/KainateR and GABA-AR and 5-HT1AR antagonists revealed the remaining synaptic current produced by α1-AR activation (right). Time of stimulations are marked by arrows. (I) With GDPβS-Li3-containing internal solution, the amplitude of the α1-AR-EPSC ran down within ~5–20 min of break-in to whole-cell mode; shown in a plot compared with control internal solution containing LiCl only (left) and in grouped data (right, p=0.004, n = 9, 1st: first EPSC; post: post-dialysis). (J) Bath application of tetrodotoxin (TTX, 1 μM) reversibly eliminated the α1-AR-EPSC shown in a representative trace (left, α1-AR-EPSC evoked every 90 s (arrows)) and in grouped data (right, p=0.009, n = 4). (K) Plot of the inhibition of α1-AR-EPSC amplitude by application of reserpine (res, 1 μM, p=0.016, n = 7). (L) Plot of the inhibition of α1-AR-EPSC amplitude by removal of external Ca2+ (0[Ca2+]o, p=0.0001, n = 14). Line and error bars represent mean ± SEM, * denotes statistical significance.
-
Figure 1—source data 1
Numerical data that were used to generate graphs in Figure 1.
- https://cdn.elifesciences.org/articles/56054/elife-56054-fig1-data1-v2.xlsx
Figure 2 with 1 supplement
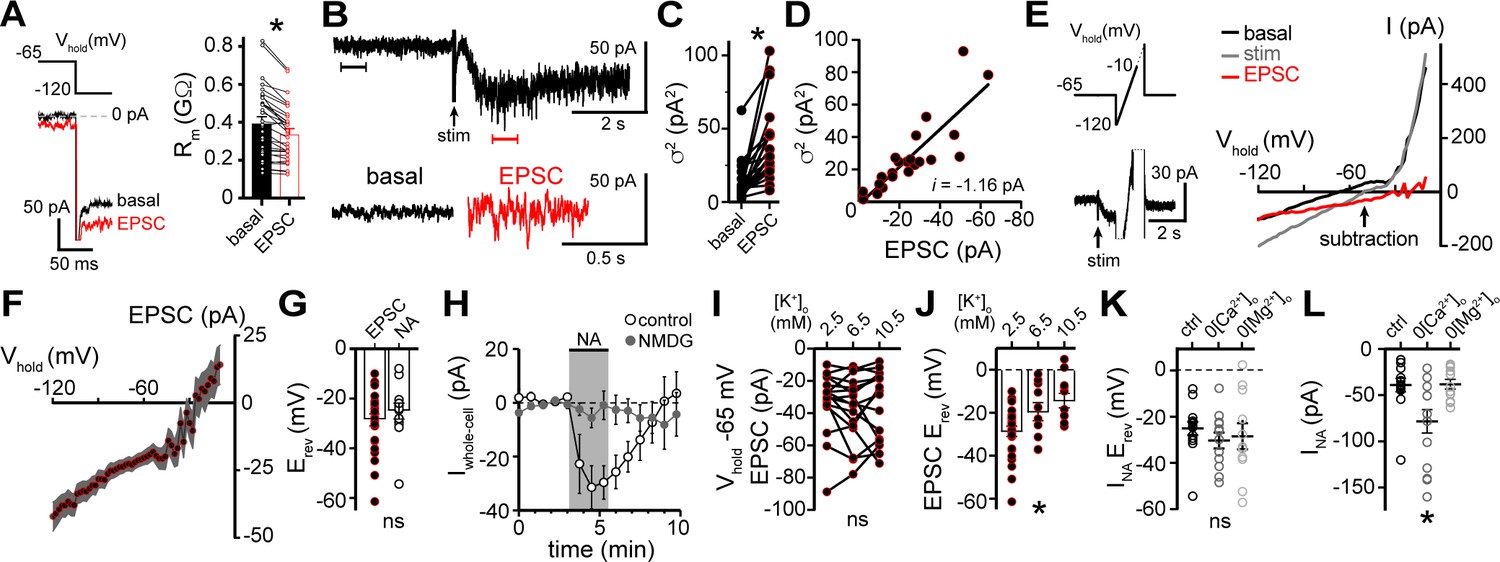
α1-adrenergic receptor-dependent inward current is carried by sodium entry.
(A) Membrane resistance (Rm, ΔV −65 to −120 mV) decreased during the α1-AR-EPSC indicating an opening of ion channels, as shown in an example trace (left) and in grouped data (right, p<0.0001, n = 31). (B) Representative trace of membrane noise during the α1-AR-EPSC, brackets denote segments shown below on an expanded scale. (C) Membrane noise (variance, σ2) increased during the α1-AR-EPSC (p<0.0001, n = 22). (D) Plot of α1-AR-EPSC variance versus mean amplitude, linear fit represents mean unitary current (i, r2 = 0.713, p<0.0001). (E) Slow voltage ramps (1 mV/10 ms, analyzed from −120 to −10 mV) were used to determine the current-voltage relationship of the α1-AR-EPSC (subtraction), determined by subtracting current at the peak of the α1-AR-EPSC (stim) from current measured in control conditions just prior to stimulation (basal). Current generated during ramps were truncated for clarity. (F) Current-voltage relationship of the α1-AR-EPSC from grouped data. Shaded area represents mean ± SEM. (G) Plot of reversal potentials (Erev) of the α1-AR-EPSC and INA (p>0.999, n = 26 and 14). (H) Replacing 126 mM NaCl with NMDG eliminated inward INA, shown in a time-course plot (Vhold−65 mV, p<0.0001, n = 14 and 13). (I) Plot of α1-AR-EPSC amplitudes measured at Vhold−65 mV, in 2.5, 6.5, and 10.5 mM [K+]o (p=0.162, n = 17). (J) Plot of α1-AR-EPSC reversal potential (Erev) with varying concentration of external K+ ([K+]o), demonstrating a depolarizing shift in Erev as external K+ was increased (p=0.010, n = 26, 10, and 11). (K) Plot of reversal potentials (Erev) of INA, demonstrating no significant difference between control conditions (ctrl), and after removal of external Ca2+ (0[Ca2+]o, p=0.49, n = 14 and 12) or Mg2+ (0[Mg2+]o, p=0.73, n = 14 and 11). (L) Plot of the amplitude of INA (Vhold−65 mV) demonstrating an augmented INA amplitude in 0[Ca2+]o (p=0.017, n = 14), but not in 0[Mg2+]o, (p>0.9999, n = 11) as compared with control conditions (n = 14). Line and error bars represent mean ± SEM, * denotes statistical significance, ns denotes not significant.
-
Figure 2—source data 1
Numerical data that were used to generate graphs in Figure 2.
- https://cdn.elifesciences.org/articles/56054/elife-56054-fig2-data1-v2.xlsx
Figure 2—figure supplement 1
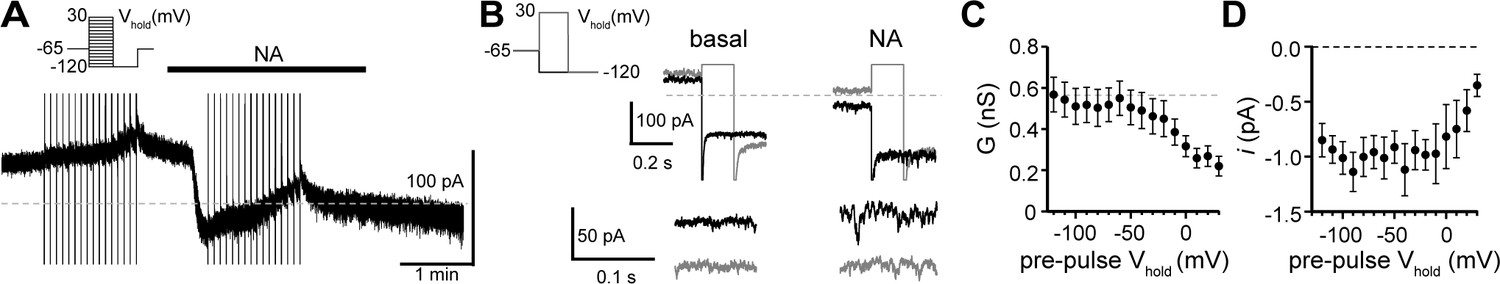
Tail current analysis reveals voltage-dependence of the α1-adrenergic receptor-dependent inward current.
(A) INA was isolated using a two-pulse voltage protocol by subtracting current measured during voltage steps (shown in left inset) at the peak of inward current from noradrenaline application from current measured in control conditions just prior to noradrenaline application. (B) Representative traces of current at Vhold−120 mV following conditioning pre-pulses to −120 mV (black) or to 30 mV (gray) in control conditions (basal) and after noradrenaline. Traces below show membrane noise at Vhold−120 mV on an expanded scale. (C) Conductance (GNA) was measured at peak INA from Vhold−120 mV, calculated using a Erev of −25.1 mV. Plot of GNA versus pre-pulse Vhold, demonstrating a decrease in GNA with depolarizing pre-pulses (linear trend of −0.022 nS/mV, p<0.0001). (D) Plot of unitary current (i, measured at Vhold−120 mV) versus pre-pulse Vhold demonstrating a decrease in i with depolarizing pre-pulses (linear trend of 0.026 pA/mV, p=0.002). Line and error bars represent mean ± SEM, * denotes statistical significance.
Figure 3
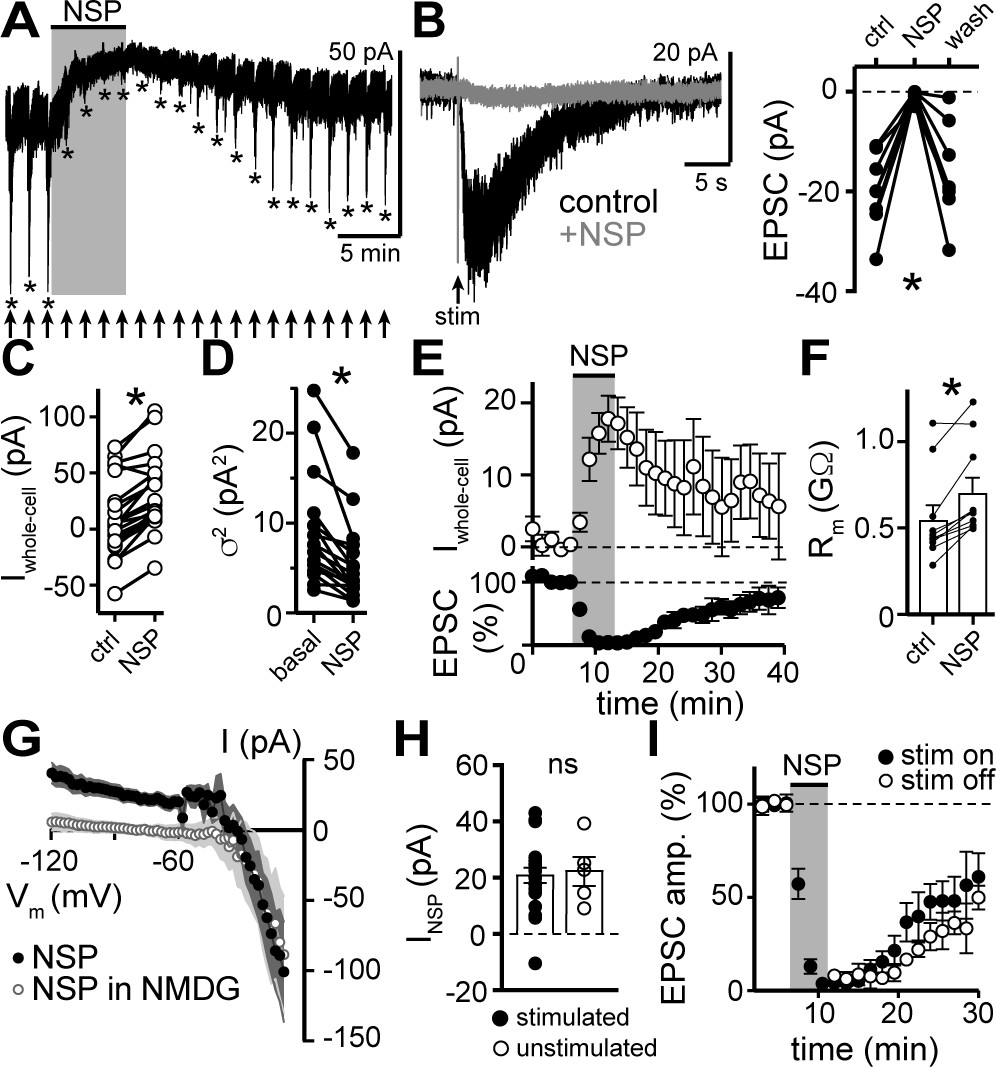
NASPM blocks the α1-AR-EPSC and a tonic sodium inward current.
(A) Example whole-cell voltage-clamp recording of the basal whole-cell current and the α1-AR-EPSC evoked every 90 s prior to, during, and after bath application of NASPM (NSP, 100 μM). Time of stimulations are marked by arrows and peak of the α1-AR-EPSC are marked by asterisks. (B) NASPM completely eliminated the α1-AR-EPSC shown in representative traces (left, baseline adjusted) and in grouped data (right, p=0.001, n = 8). (C) Bath application of NASPM produced an apparent outward current (p<0.0001, n = 21). (D) Membrane noise (variance, σ2) decreased following NASPM (NSP, p<0.0001, n = 19).(E) Time course of the inhibition of the α1-AR-EPSC amplitude (bottom) and apparent outward current (top) by application of NASPM. (F) Membrane resistance (Rm, ΔV −65 to −75 mV) increased during bath application of NASPM, indicating the apparent outward current was due to ion channels closing (p=0.004, n = 10). (G) Current-voltage relationship of apparent outward current produced by NASPM (n = 8). Replacing 126 mM NaCl eliminated the apparent outward current (n = 11), suggesting a block of a tonic inward Na+ current. Shaded area represents mean ± SEM. (H) Plot of amplitude of NASPM-induced apparent outward current in stimulated and unstimulated brain slices demonstrating no effect of prior electrical stimulation (p=0.850, n = 21 and 5). (I) Time course of the inhibition of the α1-AR-EPSC amplitude by application of NASPM, demonstrating identical block of the α1-AR-EPSC whether or not α1-AR-EPSCs were evoked during NASPM application. Line and error bars represent mean ± SEM, ns indicates not significant, * denotes statistical significance.
-
Figure 3—source data 1
Numerical data that were used to generate graphs in Figure 3.
- https://cdn.elifesciences.org/articles/56054/elife-56054-fig3-data1-v2.xlsx
Figure 4
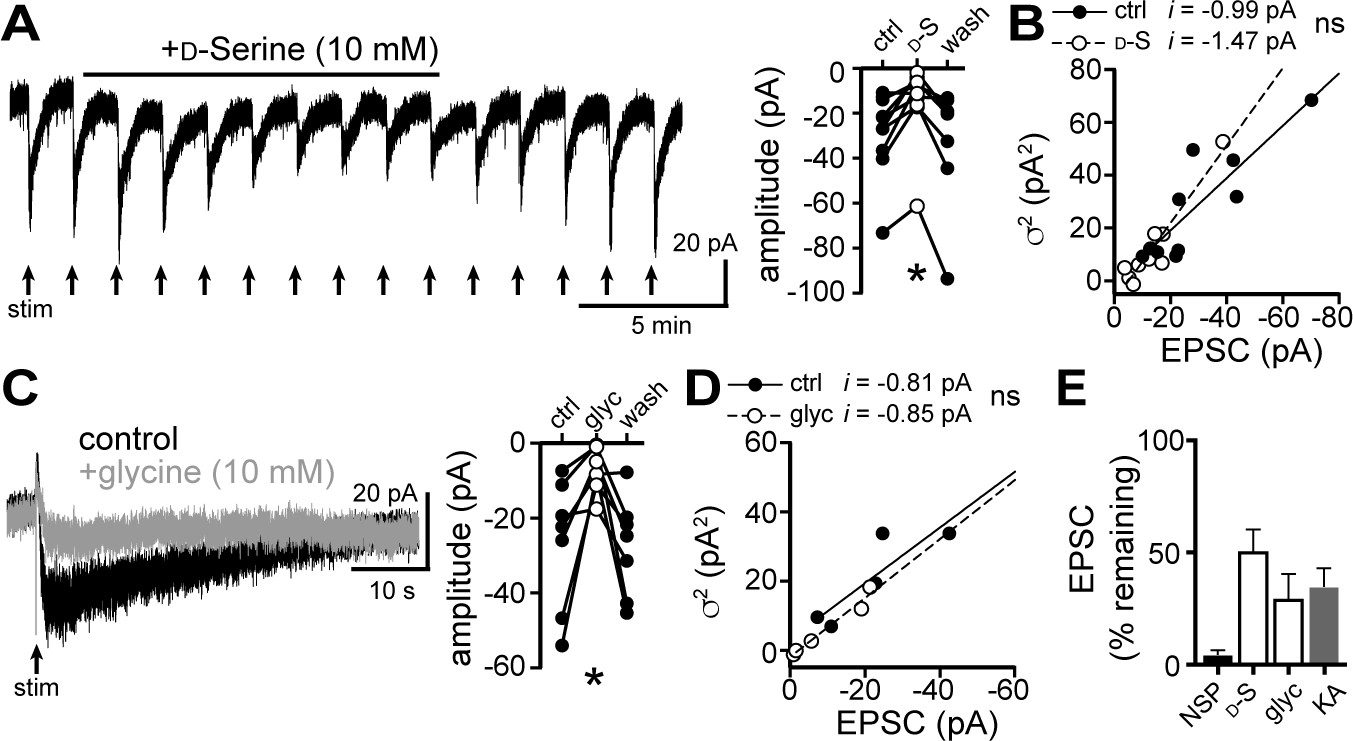
D-serine and glycine reduce the α1-AR-EPSC.
(A) Bath application of D-serine (10 mM) reversibly reduced the α1-AR-EPSC, shown in a representative trace (left) and in grouped data (right, p=0.001, n = 7). (B) Plot of α1-AR-EPSC variance versus mean amplitude prior to (ctrl) and after reduction by D-serine (D–S), linear fit represents mean unitary current (i), demonstrating no change in i with D-serine (p=0.165, n = 10 and 10). (C) Bath application of glycine (10 mM) reversibly reduced the α1-AR-EPSC, shown in representative traces (left, baseline adjusted) and in grouped data (right, p=0.015, n = 7). (D) Plot of α1-AR-EPSC variance versus mean amplitude prior to (ctrl) and after reduction by glycine (glyc), linear fit represents mean unitary current (i), demonstrating no change in i with glycine (p=0.895, n = 5 and 5). (E) Summarized data of percent remaining in α1-AR-EPSC after NASPM (NSP, 100 μM), D-serine (D-S, 10 mM), glycine (glyc, 10 mM), or kynurenic acid (KA, 1 mM). Line and error bars represent mean ± SEM, ns indicates not significant, * denotes statistical significance.
-
Figure 4—source data 1
Numerical data that were used to generate graphs in Figure 4.
- https://cdn.elifesciences.org/articles/56054/elife-56054-fig4-data1-v2.xlsx
Figure 5 with 1 supplement
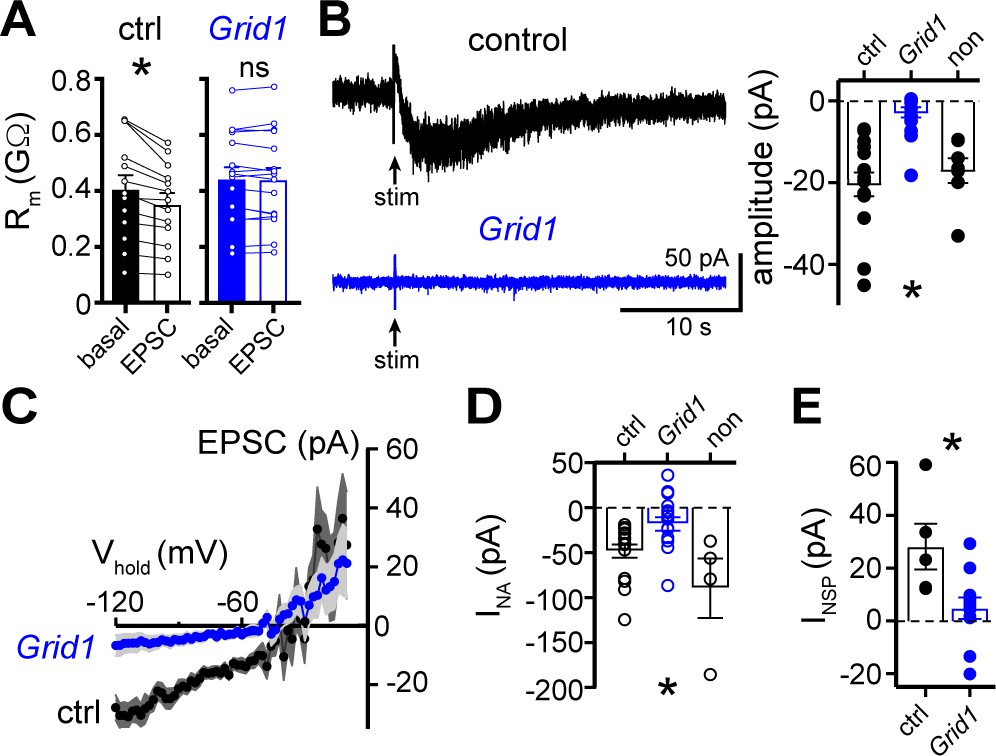
The α1-AR-EPSC is eliminated by targeting of GluD1R-channels via CRISPR/Cas9.
(A) Membrane resistance (Rm, ΔV −65 to −120 mV) decreased after stimulation in transduced neurons from mice injected with AAV-Cas9 and AAV-empty (ctrl, p=0.0002, n = 13), but not in transduced neurons from mice injected with AAV-Cas9 and AAV-Grid1 (Grid1, p=0.562, n = 16). (B) Representative traces (left) and grouped data (right, p<0.0001, n = 15 and 16 and 7) demonstrating the presence of an α1-AR-EPSC in transduced neurons from control mice, but not from Grid1 mice. Neighboring non-transduced neurons from mice injected with AAV-Cas9 and AAV-Grid1 (non) had an α1-AR-EPSC that was indistinguishable from transduced neurons from control mice (p>0.999). (C) Current-voltage relationship of the α1-AR-EPSC from control (n = 13) and Grid1 (n = 16) grouped data. Shaded area represents mean ± SEM. (D) Targeting GluD1R reduced the inward current to noradrenaline (NA, INA,30 μM) as compared to transduced neurons from control mice and neighboring non-transduced neurons (p=0.004, n = 16 and 16 and 4). Inward INA in non-transduced neurons from mice injected with AAV-Cas9 and AAV-Grid1 was similar to transduced neurons from control mice (p=0.631). (E) Targeting GluD1R reduced the tonic inward current revealed by bath application of NASPM (100 μM, INSP) as compared to transduced neurons from control mice (p=0.009, n = 5 and 11). Line and error bars represent mean ± SEM, * denotes statistical significance, ns denotes not significant.
-
Figure 5—source data 1
Numerical data that were used to generate graphs in Figure 5.
- https://cdn.elifesciences.org/articles/56054/elife-56054-fig5-data1-v2.xlsx
Figure 5—figure supplement 1

Design and testing of guide RNA targeting mouse Grid1.
(A) A graphic representation of AAV vectors used in conjunction with AAV-Cas9 to encode eGFP reporter only (top, AAV-empty) and mouse Grid1 guide RNA with eGFP reporter (bottom, AAV-Grid1). (B) A graphic representation of the third exon of mouse Grid1, marked with the location of the gRNA (390F) and the overlapping Bgl I restriction site. Filled arrows represent the location of primers used for PCR amplification while the hollow arrow indicates the primer used for sequencing. (C) A nucleotide representation of gRNA target site with the translated peptide sequence underneath. The Bgl I recognition site (GCCNNNN^NGGC) is contained by the grey box and overlaps with the predicted Cas9 cleavage site (|). (D) Fragment analysis on Bgl I-digested Grid1 PCR products amplified from the dorsal raphe of mice injected with (AAV-Cas9 and AAV-empty) or (AAV-Cas9 and AAV-Grid1). ‘% PCR undigested’ refers to the amount of the undigested PCR product relative to the total PCR product as determined by AATI fragment analysis.
Figure 6

Loss of functional GluD1 receptors in the dorsal raphe produces an anxiogenic behavioral phenotype in mice.
(A) Example maximum intensity projection confocal image of spread of viral transduction following dorsal raphe microinjection of AAV-Cas9 and AAV-Grid1 using an eGFP reporter; scale bars, 0.5 mm. Image was registered and aligned with plate 69 (Franklin and Paxinos mouse brain atlas) with dorsal raphe outlined in solid white. (B) Plot of distance traveled in 30 mins in a dark arena, demonstrating no difference in horizontal locomotion between mice with dorsal raphe microinjections with AAV-Cas9 and AAV-empty (ctrl) versus with AAV-Cas9 and AAV-Grid1 (p=0.762, n = 18 and 15). (C) In an elevated plus maze, Grid1 mice spent less time in the open arms as compared with control-transduced mice (p=0.007, n = 10 and 10). (D) Grid1 mice made proportionally fewer entries to the open arms compared to control-transduced mice (p=0.033, n = 10 and 10). (E) Plot of cumulative time spent in the open arms of an elevated plus maze (EPM). (F) Plot of time spent grooming, demonstrating no different between control-transduced and Grid1 mice (p=0.481, n = 10 and 10). (G) Plot of time spent in stretched-attend posture, demonstrating no difference between control-transduced and Grid1 mice (p=0.968, n = 10 and 9). (H) Grid1 mice spent less time looking over the edge of the open arms (head-dip) than control-transduced mice (p=0.018, n = 10 and 10). (I) Plot of time spent rearing in the enclosed arms, demonstrating no difference between control-transduced and Grid1 mice (p=0.143, n = 10 and 10). Line and error bars represent mean ± SEM, n = number of mice, * denotes statistical significance, ns denotes not significant.
-
Figure 6—source data 1
Numerical data that were used to generate graphs in Figure 6.
- https://cdn.elifesciences.org/articles/56054/elife-56054-fig6-data1-v2.xlsx
Tables
Key resources table
| Reagent type (species) or resource | Designation | Source or reference | Identifiers | Additional information |
|---|---|---|---|---|
| Strain, strain background (Mus musculus) | C57BL/6J | The Jackson Laboratory | Stock# 000664 RRID:IMSR_JAX:000664 | males and females |
| Strain, strain background (E. coli) | NEB Stable | New England Biolabs | Cat# C3040H | - |
| Genetic reagent (adeno-associated virus) | AAV-Cas9 | PMIDs:25326897 30792150 | NIDA IRP Core Facility, AAV1, pX551, RRID:Addgene_60957 | Lot# AAV692 |
| Genetic reagent (adeno-associated virus) | AAV-Grid1 | This paper | NIDA IRP Core Facility, AAV1, pOTTC1706, Addgene 131683 | Lot# AAV732 |
| Genetic reagent (adeno-associated virus) | AAV-empty | This paper | NIDA IRP Core Facility, AAV1, pOTTC1553, Addgene 131682 | Lot# AAV746 |
| Chemical compound, drug | Bgl I restriction enzyme | New England Biolabs | Cat# R0143S | - |
| Chemical compound, drug | D-serine | Millipore Sigma | Cat# S4250 | 10 mM |
| Chemical compound, drug | GDPβS-Li3 | Millipore Sigma | Cat# G7637 | 1.8 mM |
| Chemical compound, drug | Glycine | Millipore Sigma | Cat# G7126 | 10 mM |
| Chemical compound, drug | Idazoxan | Millipore Sigma | Cat# I6138 | 1 μM |
| Chemical compound, drug | Kynurenic acid | Millipore Sigma | Cat# K3375 | 1 mM |
| Chemical compound, drug | MK-801 | Tocris Bioscience | Cat #0924 | 5 μM |
| Chemical compound, drug | NASPM | Tocris Bioscience | Cat #2766 | 100 μM |
| Chemical compound, drug | NBQX | Tocris Bioscience | Cat #1044 | 3 μM |
| Chemical compound, drug | NMDG | Millipore Sigma | Cat# 66930 | 126 mM |
| Chemical compound, drug | Noradrenaline | Tocris Bioscience | Cat #5169 | 30 μM |
| Chemical compound, drug | Picrotoxin | Tocris Bioscience | Cat #1128 | 100 μM |
| Chemical compound, drug | Prazosin | Millipore Sigma | Cat# P7791 | 100 nM |
| Chemical compound, drug | Reserpine | Millipore Sigma | Cat# R0875 | 1 μM |
| Chemical compound, drug | Strychnine | Millipore Sigma | Cat# S8753 | 10 μM |
| Chemical compound, drug | Tetrodotoxin | Tocris Bioscience | Cat# 1069 | 1 μM |
| Chemical compound, drug | WAY-100635 | Tocris Bioscience | Cat# 4380 | 300 nM |
| Sequence-based reagent | Forward amplification primer | IDTDNA | tgattacgccaagctt GGTGGAGCTGTGTGGATGAAGC | - |
| Sequence-based reagent | Forward sequence primer | IDTDNA | CCAGCCTGTGACCTCATGACC | - |
| Sequence-based reagent | Reverse amplification primer | IDTDNA | gacggccagtgaattc CTTCAGCTGTCATGATAAGGTGATGTTG | - |
| Commercial assay, kit | In-Fusion HD Cloning | Takara Bio Clontech | Cat# 639647 | - |
| Software, algorithm | Clampfit 10.7 | Axon Instruments | RRID:SCR_011323 | https://www.moleculardevices.com/products/axon-patch-clamp-system |
| Software, algorithm | EthoVision XT | Noldus Information Technology | RRID:SCR_000441 | https://www.noldus.com/ethovision-xt |
| Software, algorithm | Fiji | PMID:22743772 | RRID:SCR_002285 | http://fiji.sc |
| Software, algorithm | Prism 8 | GraphPad | RRID:SCR_002798 | http://www.graphpad.com |
| Software, algorithm | VersaMax Analyzer | Omnitech-electronics, Inc | http://www.omnitech-electronics.com/product/VersaMax-Legacy-Open-Field---Locomotor-Activity/1930 | - |
Additional files
Download links
A two-part list of links to download the article, or parts of the article, in various formats.
Downloads (link to download the article as PDF)
Open citations (links to open the citations from this article in various online reference manager services)
Cite this article (links to download the citations from this article in formats compatible with various reference manager tools)
Delta glutamate receptor conductance drives excitation of mouse dorsal raphe neurons
eLife 9:e56054.
https://doi.org/10.7554/eLife.56054


