Dynamic control of adipose tissue development and adult tissue homeostasis by platelet-derived growth factor receptor alpha
- Department of Physiology and Biophysics, College of Medicine, The University of Illinois, United States
- Department of Pharmacology, College of Medicine, The University of Illinois, United States
- Division of Endocrinology, Department of Medicine, The University of Illinois at Chicago, United States
- Division of Nutritional Sciences, Cornell University, United States
Figures
Figure 1 with 1 supplement
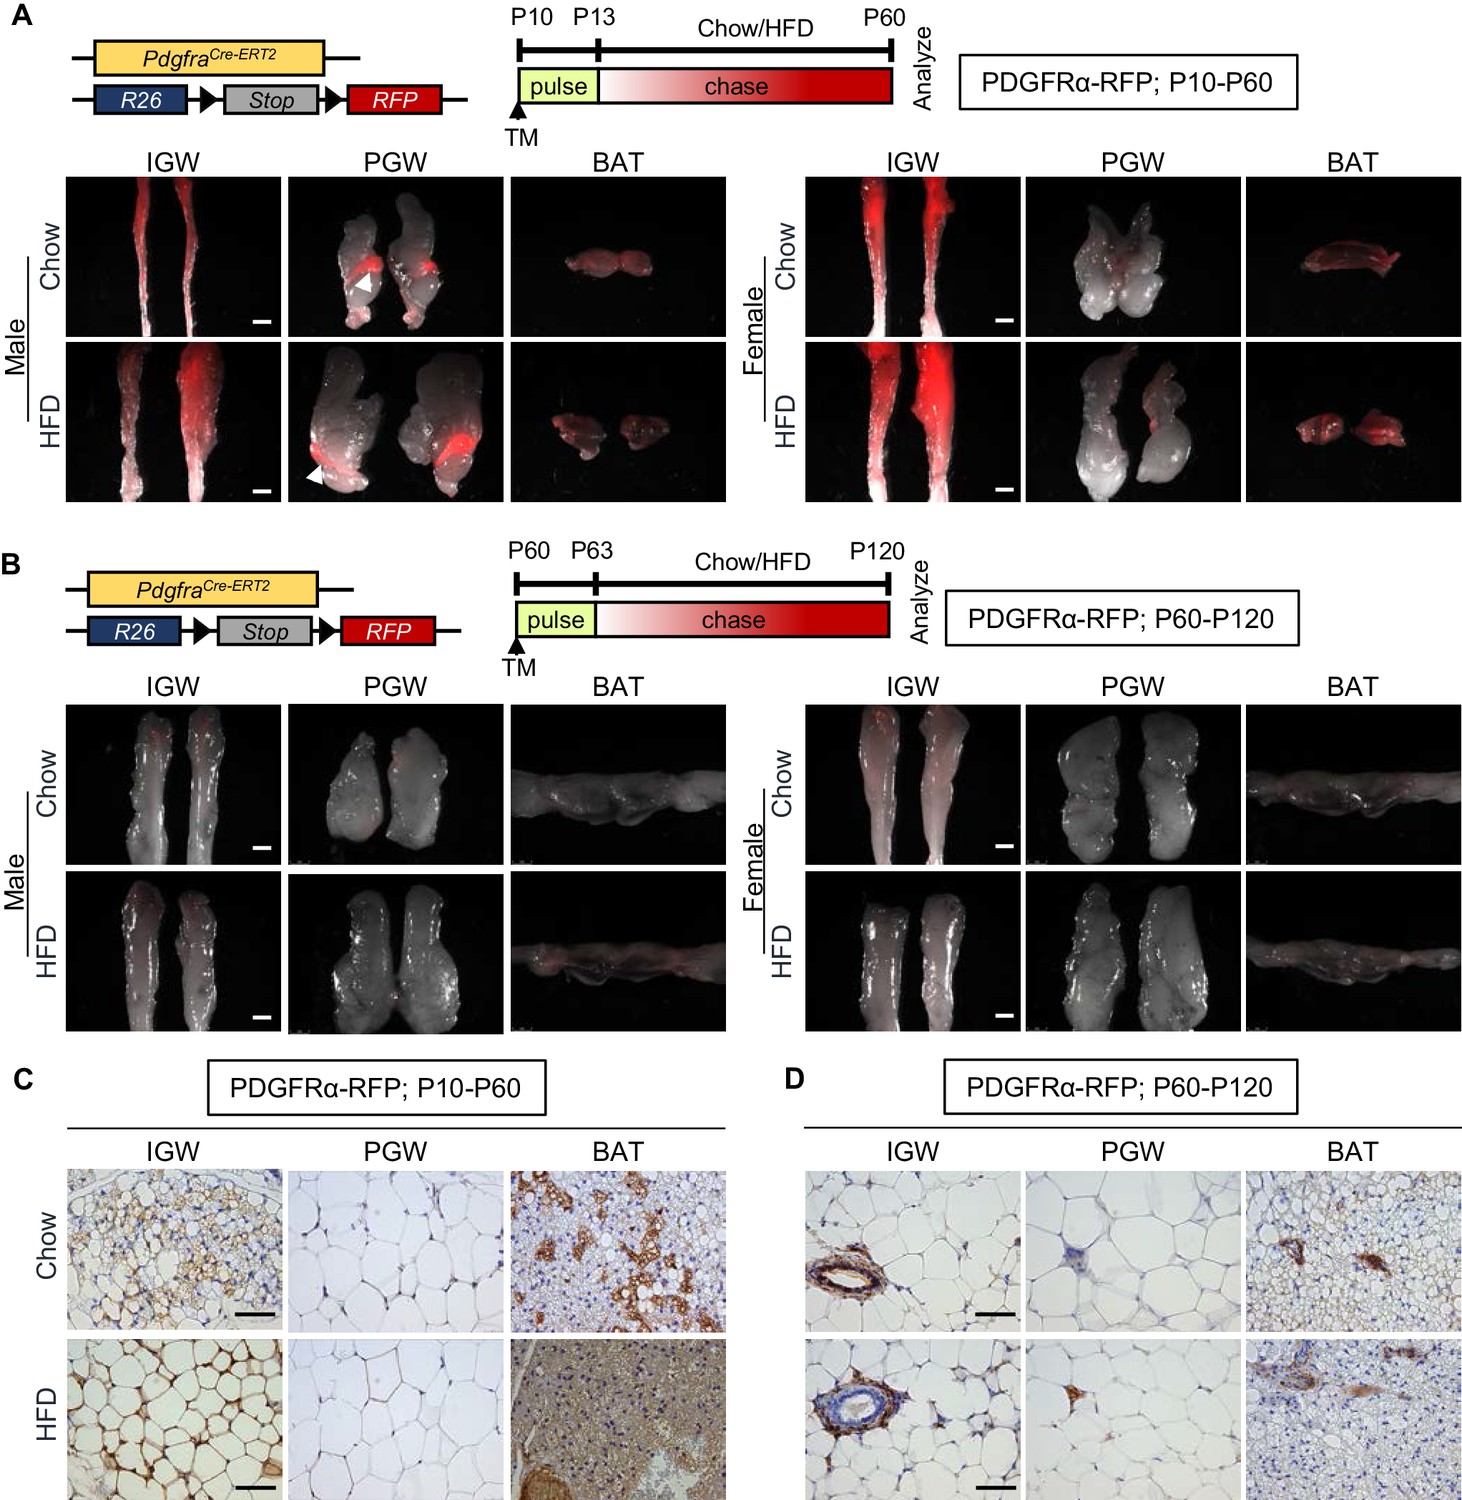
Developmental, but not adult, adipocytes derive from a PDGFRα+ cell source.
(A–B) PdgfraCre-ERT2; Rosa26RRFP (PDGFRα-RFP) mice were administered tamoxifen (TM) (A) at postnatal day 10 (P10) and fed chow or HFD until P60 or (B) at P60 and fed chow or HFD until P120. IGW, PGW, and BATs were examined for direct RFP fluorescence either at (A) P60 or (B) P120 (chase). White arrowheads indicate the epididymis labeling. Scale = 100 μm. (C–D) RFP staining of IGW, PGW, and BATs from above P10-P60 and P60-P120 mice using immunohistochemistry (IHC). Scale = 200 μm.
Figure 1—figure supplement 1
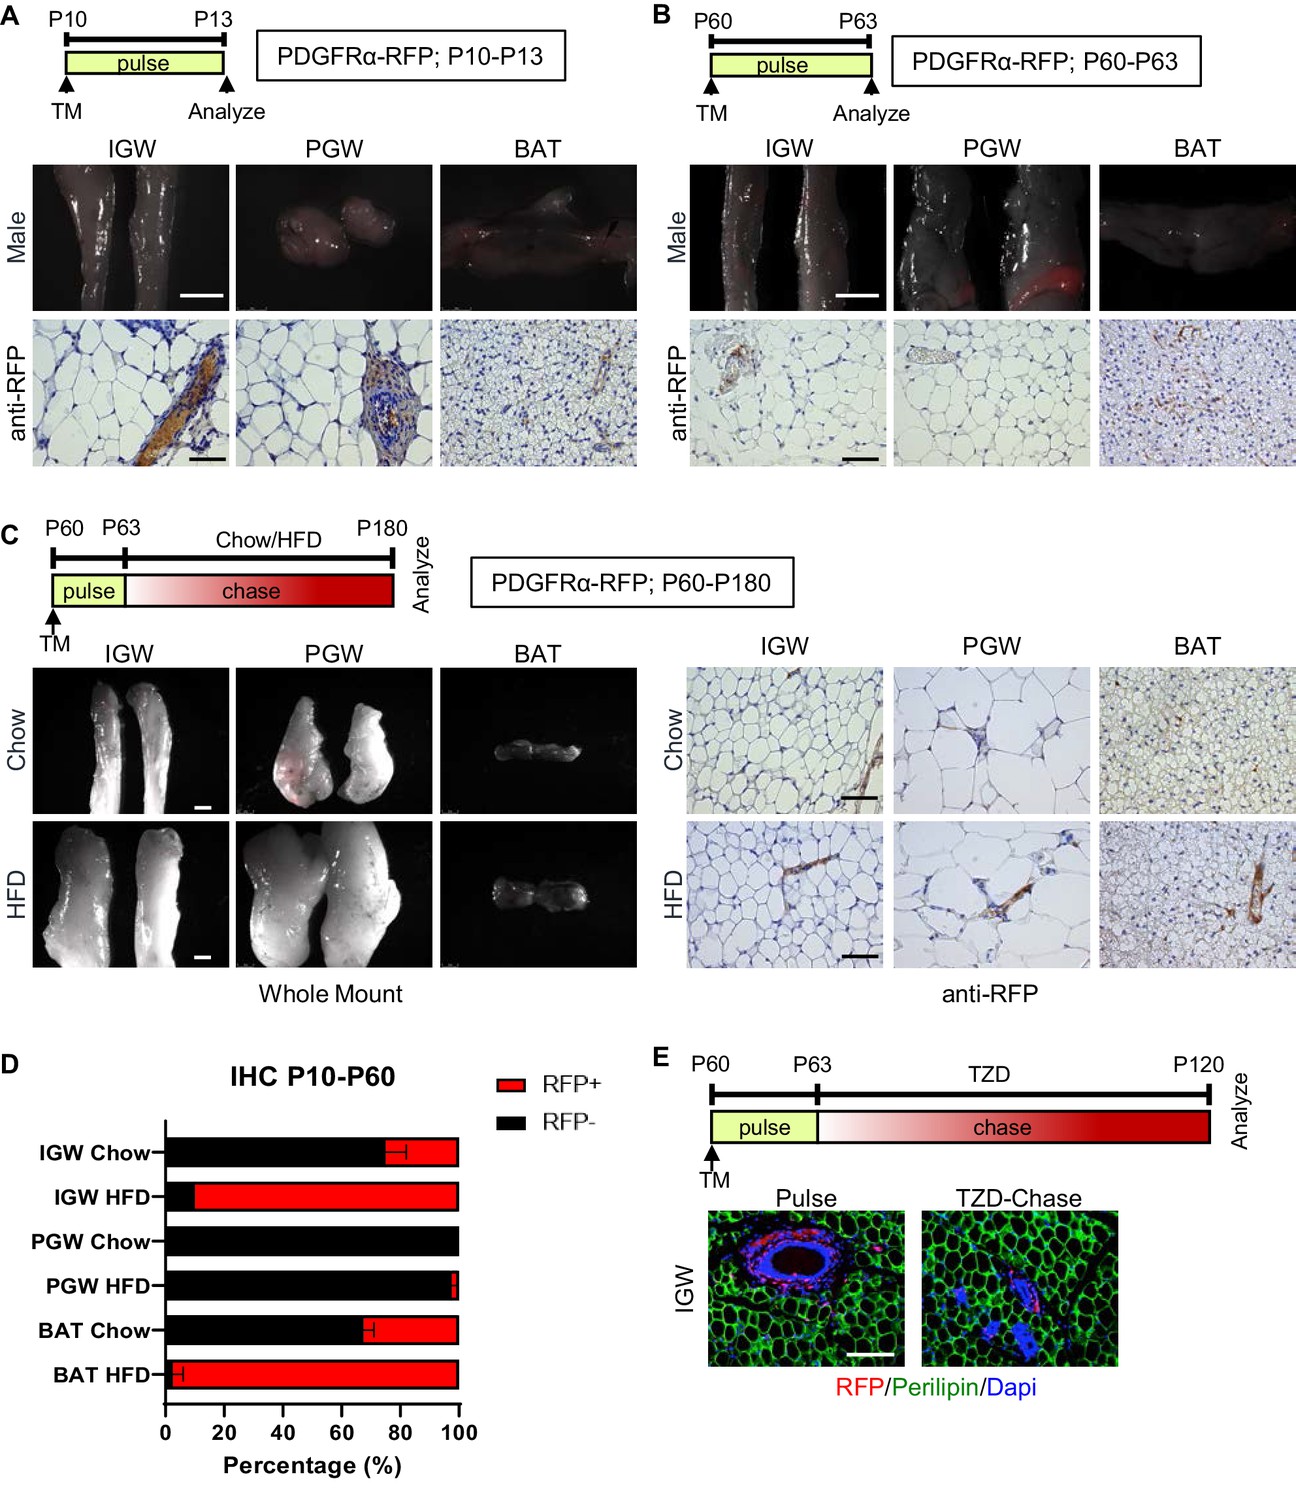
Pdgfra-dependent RFP expression at pulse, P60-P180, and P60-P120 TZD pulse-chase.
(A–B) PdgfraCre-ERT2; Rosa26RRFP (PDGFRα-RFP) mice were administered TM (A) at postnatal day (P) 10 or (B) at P60. IGW, PGW, and BATs were examined for direct RFP fluorescence and RFP IHC staining after 3 days (pulse). Scale = 200 μm. (C) PDGFRα-RFP mice were administered TM at P60 and fed chow or HFD until P180. IGW, PGW, and BATs were examined for direct RFP fluorescence and RFP IHC staining at P180 (chase). Scale = 100 μm and 200 μm. (D) Quantification of RFP+ adipocytes observed in randomly chosen 10× magnification fields from IGW, PGW, and BAT sections. (E) Confocal immunofluorescence image of a representative IGW section from animals treated with TZD. Sections were stained with anti-RFP (red) and anti-perilipin (green) antibodies and counterstained with DAPI (blue; nuclei). Scale = 200 μm.
Figure 2 with 1 supplement
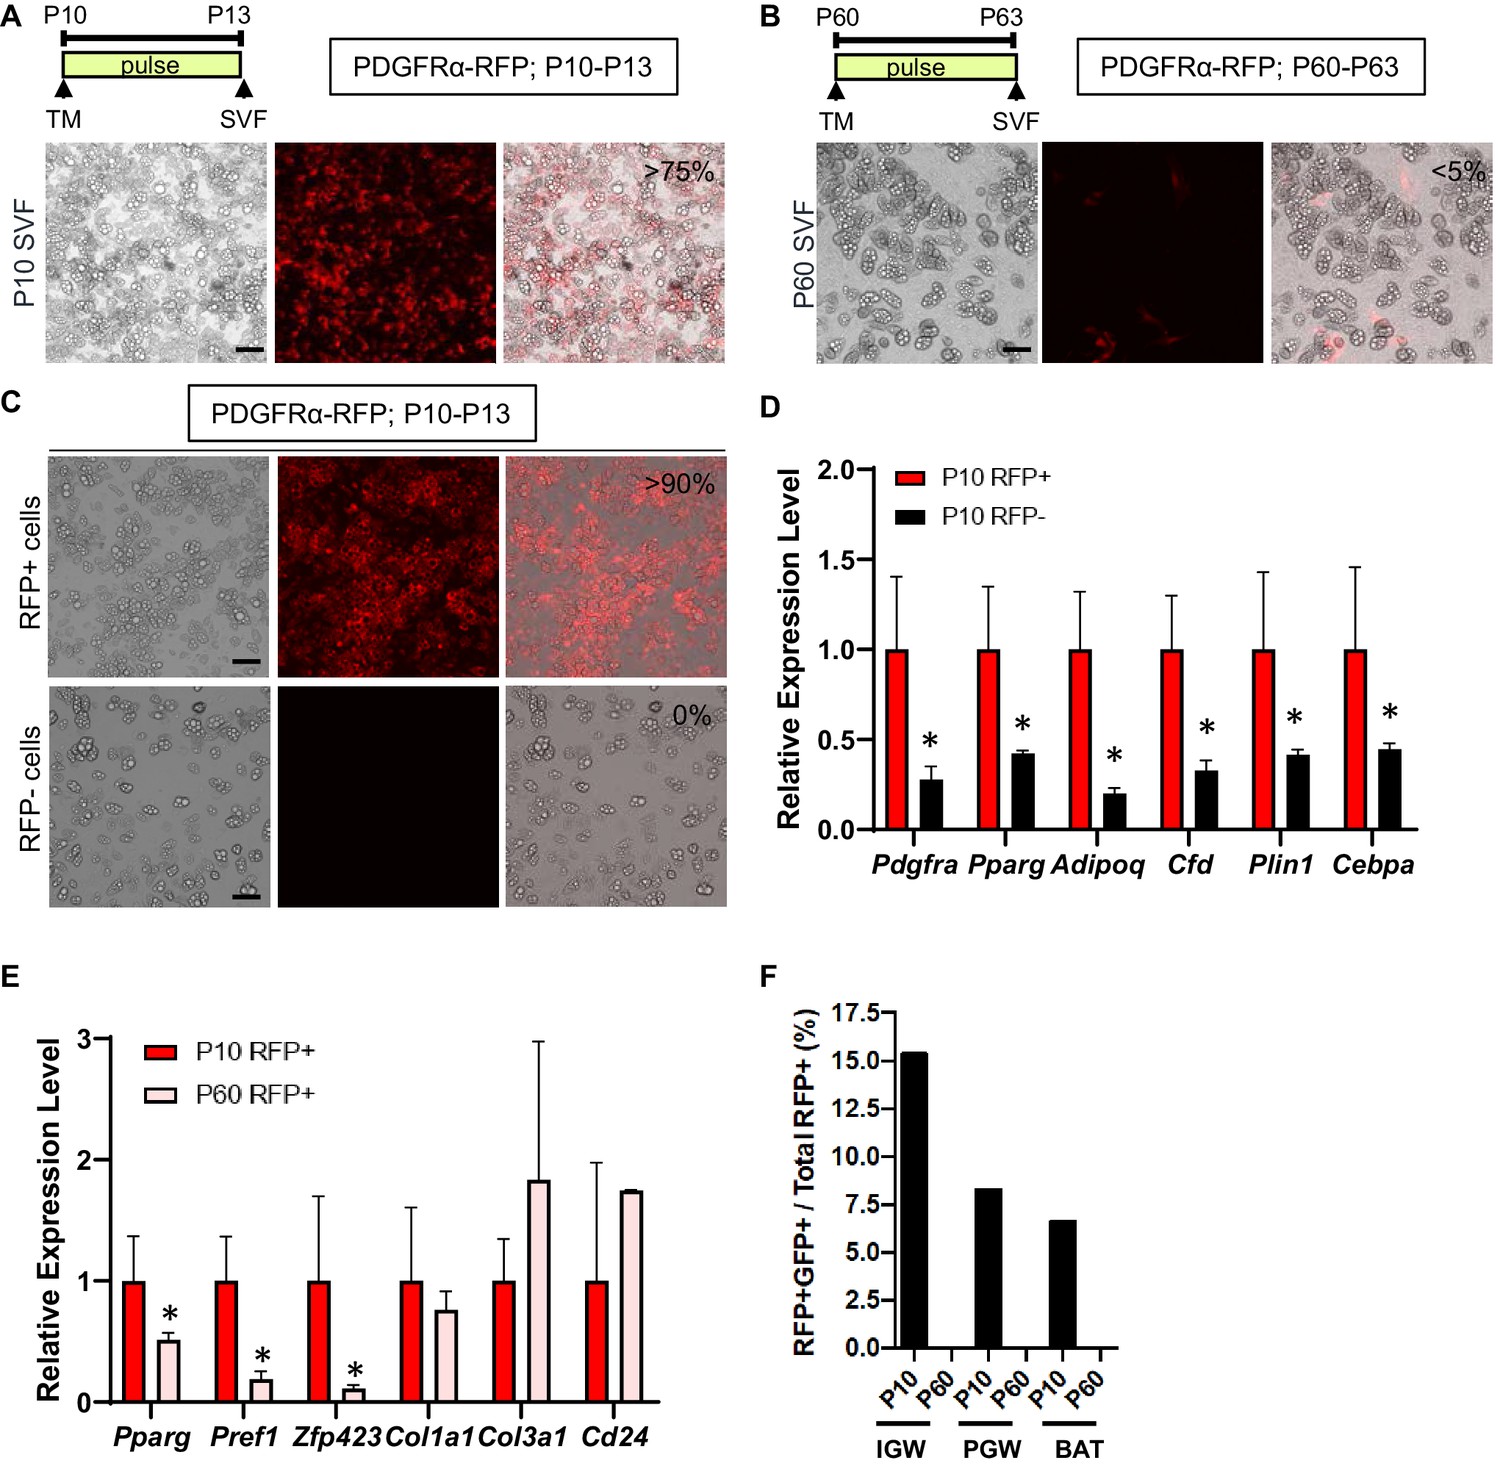
Developmental, but not adult, PDGFRα+ cells are adipogenic.
(A–B) PdgfraCre-ERT2; Rosa26RRFP (PDGFRα-RFP) male mice were administered TM at P10 (A) or P60 (B). Stromal vascular fraction of cells (SVF) were isolated from IGW of the mice after 3 days and cultured. The numbers indicate the percentage of the RFP+ labeled adipocytes. Scale = 100 μm. (C) TM-induced PDGFRα-RFP male mice either at P10 or P60 were fed chow or HFD until P120. SVF were isolated from IGW of the mice at P120, cultured, and examined for direct RFP fluorescence. Scale = 100 μm. (D) The real-time q-PCR analysis of adipogenic markers from cells described in C. *p<0.05 P10 RFP- compared to P10 RFP+ cells. (E) Gene expression levels of P10 and P60 RFP+ cells in SVF isolated from pooled IGW (n = 10). *p<0.05 P60 RFP+ compared to P10 RFP+ cells. Data are expressed as mean ± SEM. (F) PpargtTA-H2BGFP; PDGFRα-RFP male mice were administered TM at P10 or P60. SVF were isolated from the pooled IGW, PGW, and BAT depots (n = 8) after 3 days and sorted using RFP signal. GFP+RFP+ cells were quantified.
Figure 2—figure supplement 1

Developmental, but not adult, PDGFRα+ cells overlap with PPARγ+ cells.
(A) Schematic of PpargtTA-H2BGFP; PDGFRα-RFP male mice breeding. Mice were administered TM at P10 or P60. SVF were isolated after 3 days. GFP+RFP+ cells were quantified in IGW, PGW, and BAT. (B) The flow analysis of P10 labeled PDGFRα-RFP cells overlapping with PpargtTA labeled GFP+ cells. The numbers indicate the percentage of total SVF in IGW, PGW, and BAT (pooled SVF from n = 10 mice). (C) The flow analysis of P60 labeled PDGFRα-RFP cells overlapping with PpargtTA labeled GFP+ cells. The numbers indicate the percentage of total SVF in IGW, PGW, and BAT (pooled SVF from n = 8 mice).
Figure 3 with 1 supplement
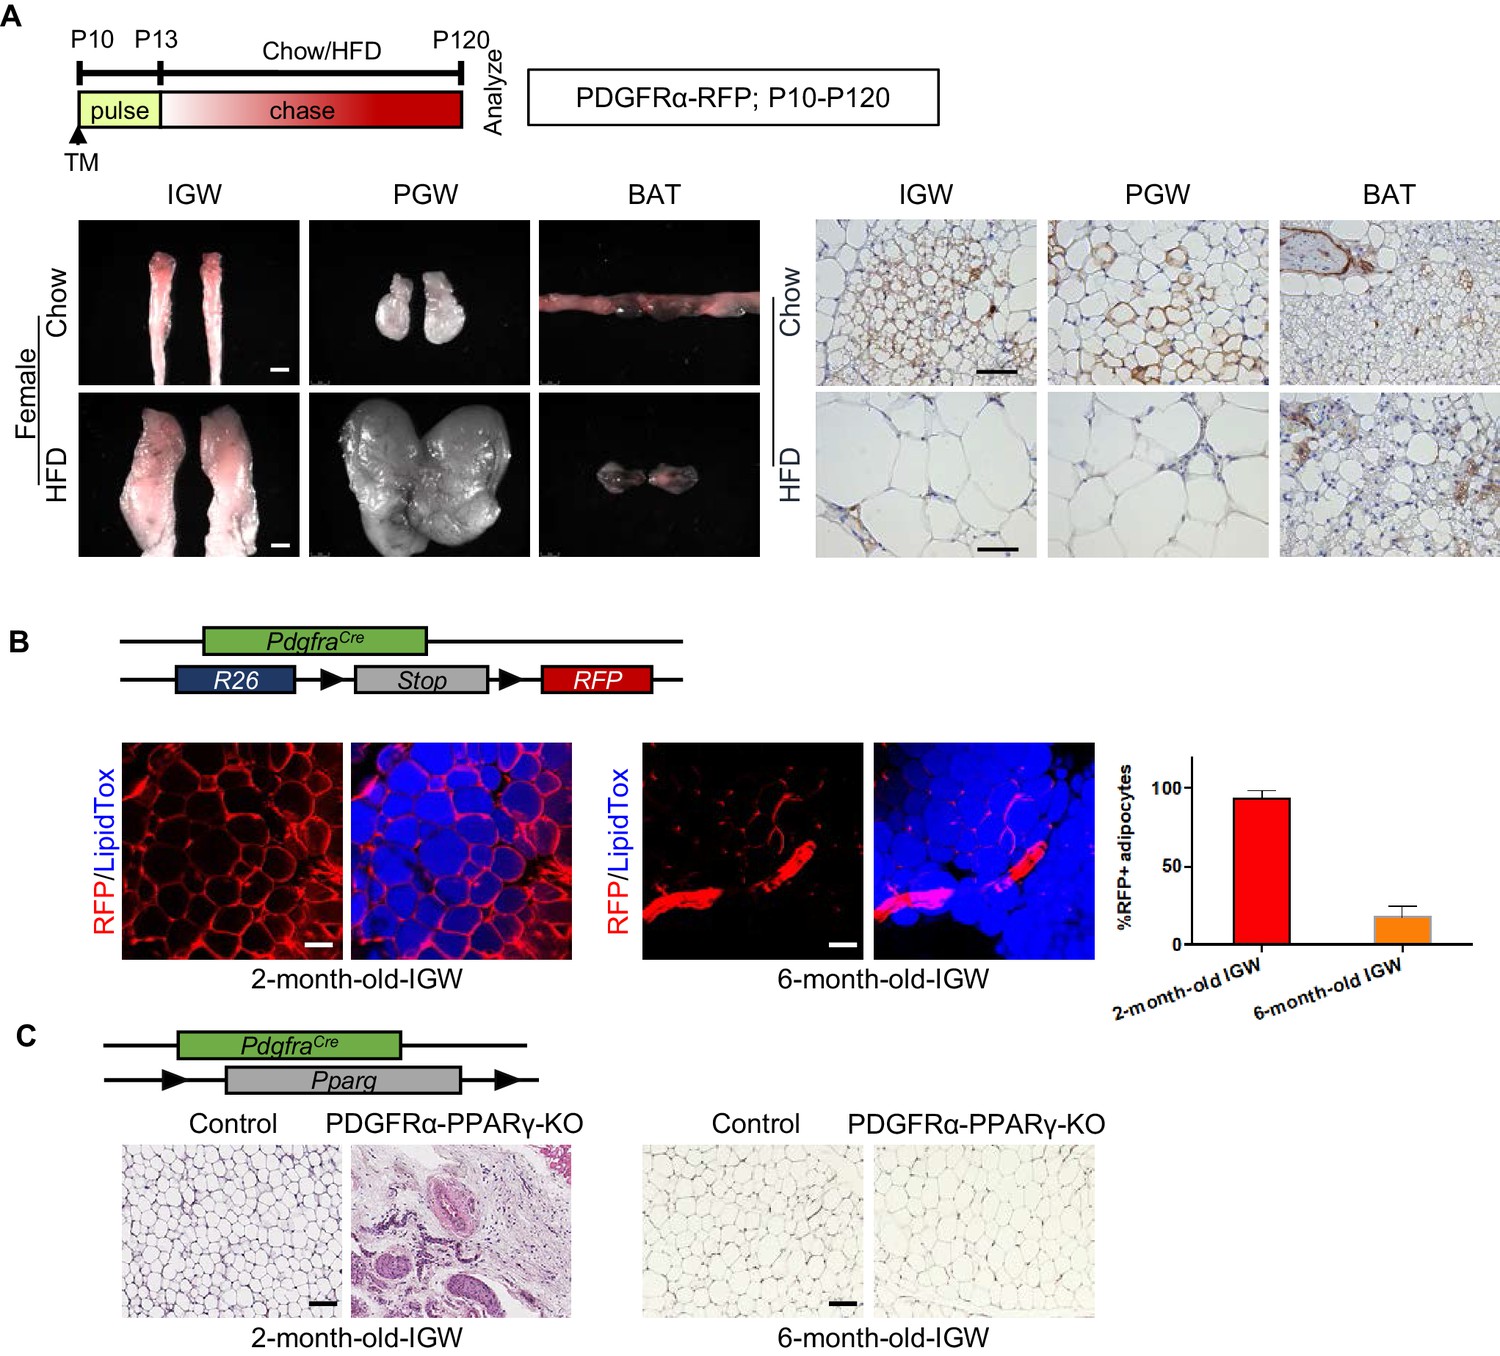
Developmental PDGFRα+ cells contribute to postnatal but not adult WAT development.
(A) PdgfraCre-ERT2; Rosa26RRFP (PDGFRα-RFP) mice were administered TM (A) at postnatal day (P) 10 and fed chow or HFD until P120. IGW, PGW, and BATs were examined for direct RFP fluorescence and RFP IHC staining. Scale = 100 μm and 200 μm. (B) A 2- and 6-month-old PDGFRα-RFP mice were analyzed. IGWs were examined for direct RFP fluorescence and stained with LipidTox (blue). The quantifications for numbers of RFP+ adipocytes were calculated. Scale = 100 μm. (C) A 2- and 6-month-old control and PdgfraCre; Ppargfl/fl (PDGFRα-PPARγ-KO) mice were analyzed. IGWs were examined using hematoxylin and eosin (H&E) staining. Scale = 100 μm.
Figure 3—figure supplement 1
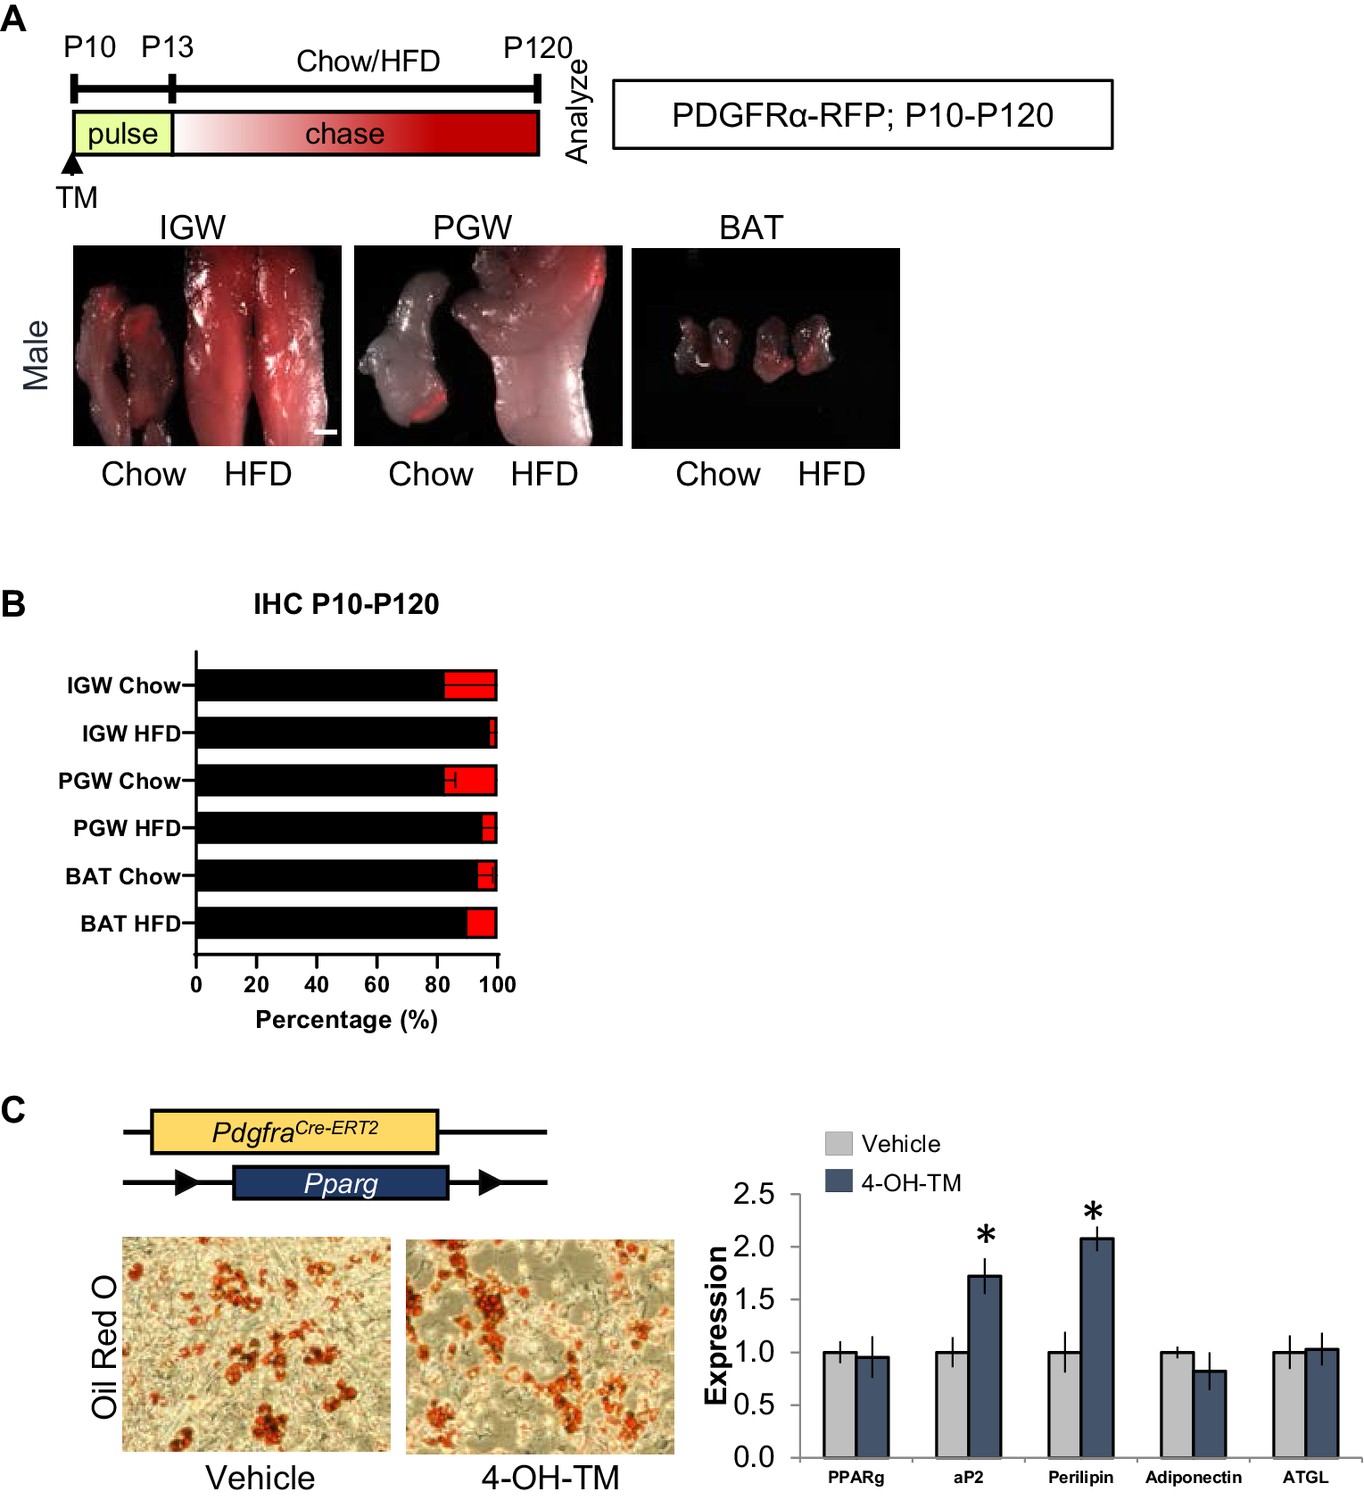
P10 PDGFRα+ cells contribute to postnatal but not adult WAT development.
(A) PdgfraCre-ERT2; Rosa26RRFP (PDGFRα-RFP) mice were administered TM (A) at postnatal day (P) 10 and fed chow or HFD until P120. IGW, PGW, and BATs were examined for direct RFP fluorescence. Scale = 100 μm. (B) Quantification of RFP+ adipocytes observed in randomly chosen 10X magnification fields from IGW, PGW, and BAT sections. (C) Oil Red O staining and gene expression analysis of SVF adipogenesis from IGW of PdgfraCre-ERT2; Ppargfl/fl male mice at P60, either veh or 4-OH-tamoxifen (4-OH-TM) treated. *p<0.05 TM compared to Veh cells. Data are expressed as mean ± SEM.
Figure 4 with 1 supplement
Deleting Pdgfra in adult SMA+ APCs is dispensable for adult white adipogenesis.
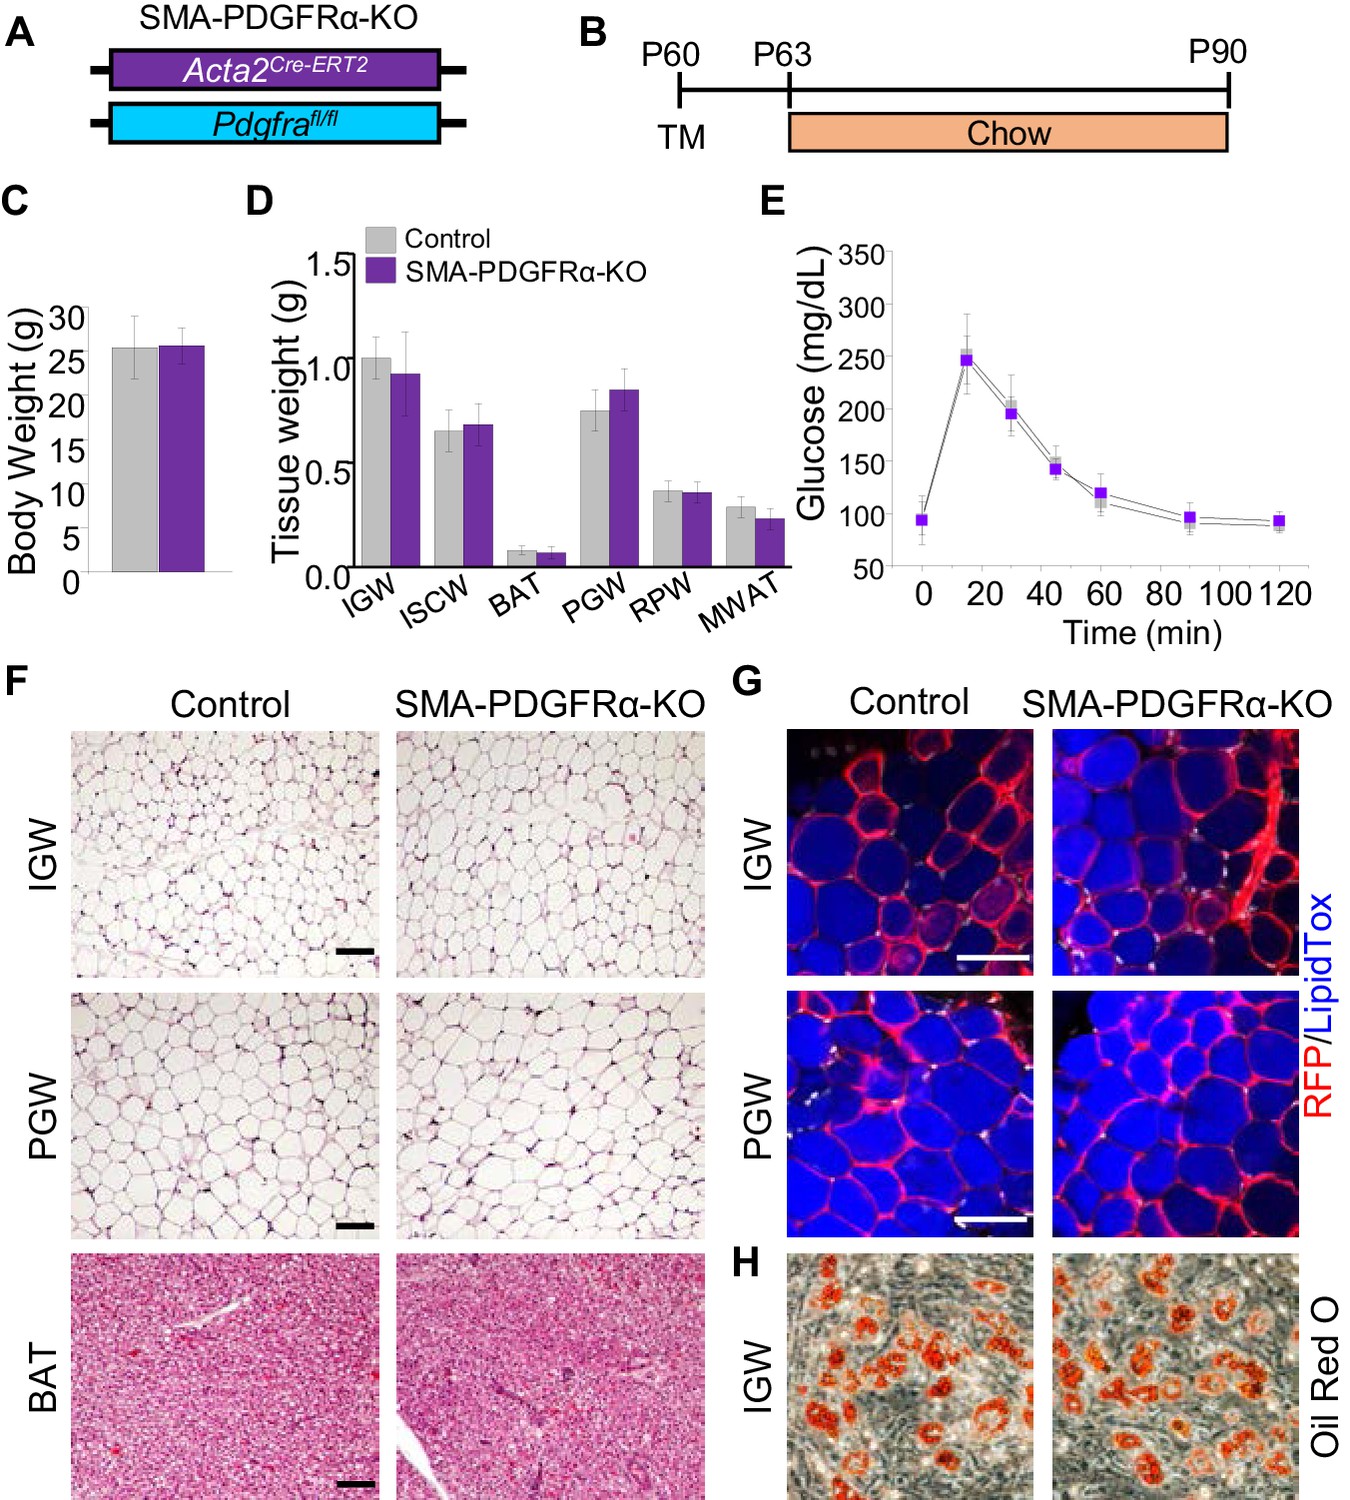
(A–B) Acta2Cre-ERT2; Pdgfrafl/fl male control and mutant (SMA-PDGFRα-KO) mice were administered TM at P60 and analyzed at P90. (C) Body weight of control and SMA-PDGFRα-KO mice at P90. Data are expressed as mean ± SEM. (D) Adipose tissue weights. Data are expressed as mean ± SEM. (E) Blood glucose level during glucose tolerance test. Data are expressed as mean ± SEM. (F) Hematoxylin and eosin (H&E) staining of IGW, PGW, and BAT. Scale = 100 μm. (G) IGW and PGW were analyzed for direct RFP fluorescence and stained with LipidTox. Scale = 200 μm. (H) Oil Red O staining of SVF adipogenesis from IGW of control and SMA-PDGFRα-KO male mice at P90.
Figure 4—figure supplement 1

SMA-PDGFRα-KO mice do not display abnormal energy expenditure.
(A) Body fat mass of Acta2Cre-ERT2; Pdgfrafl/fl male control and SMA-PDGFRα-KO mice at P90. Data are expressed as mean ± SEM. (B) Food intake of control and SMA-PDGFRα-KO mice. Data are expressed as mean ± SEM. (C) A real-time q-PCR analysis of the Pdgfra level in BAT of control and SMA-PDGFRα-KO mice. *p<0.05 SMA-PDGFRα-KO mice compared to control mice. Data are expressed as mean ± SEM. (D) Energy expenditure of control and SMA-PDGFRα-KO mice. Data are expressed as mean ± SEM. (E) Oxygen consumption of control and SMA-PDGFRα-KO mice. Data are expressed as mean ± SEM. (F) Carbon dioxide production of control and SMA-PDGFRα-KO mice. Data are expressed as mean ± SEM. (G) Respiratory exchange ratio of control and SMA-PDGFRα-KO mice. Data are expressed as mean ± SEM.
Figure 5 with 1 supplement
Deleting Pdgfra in adult SMA+ APCs is dispensable for cold-induced beige adipogenesis.
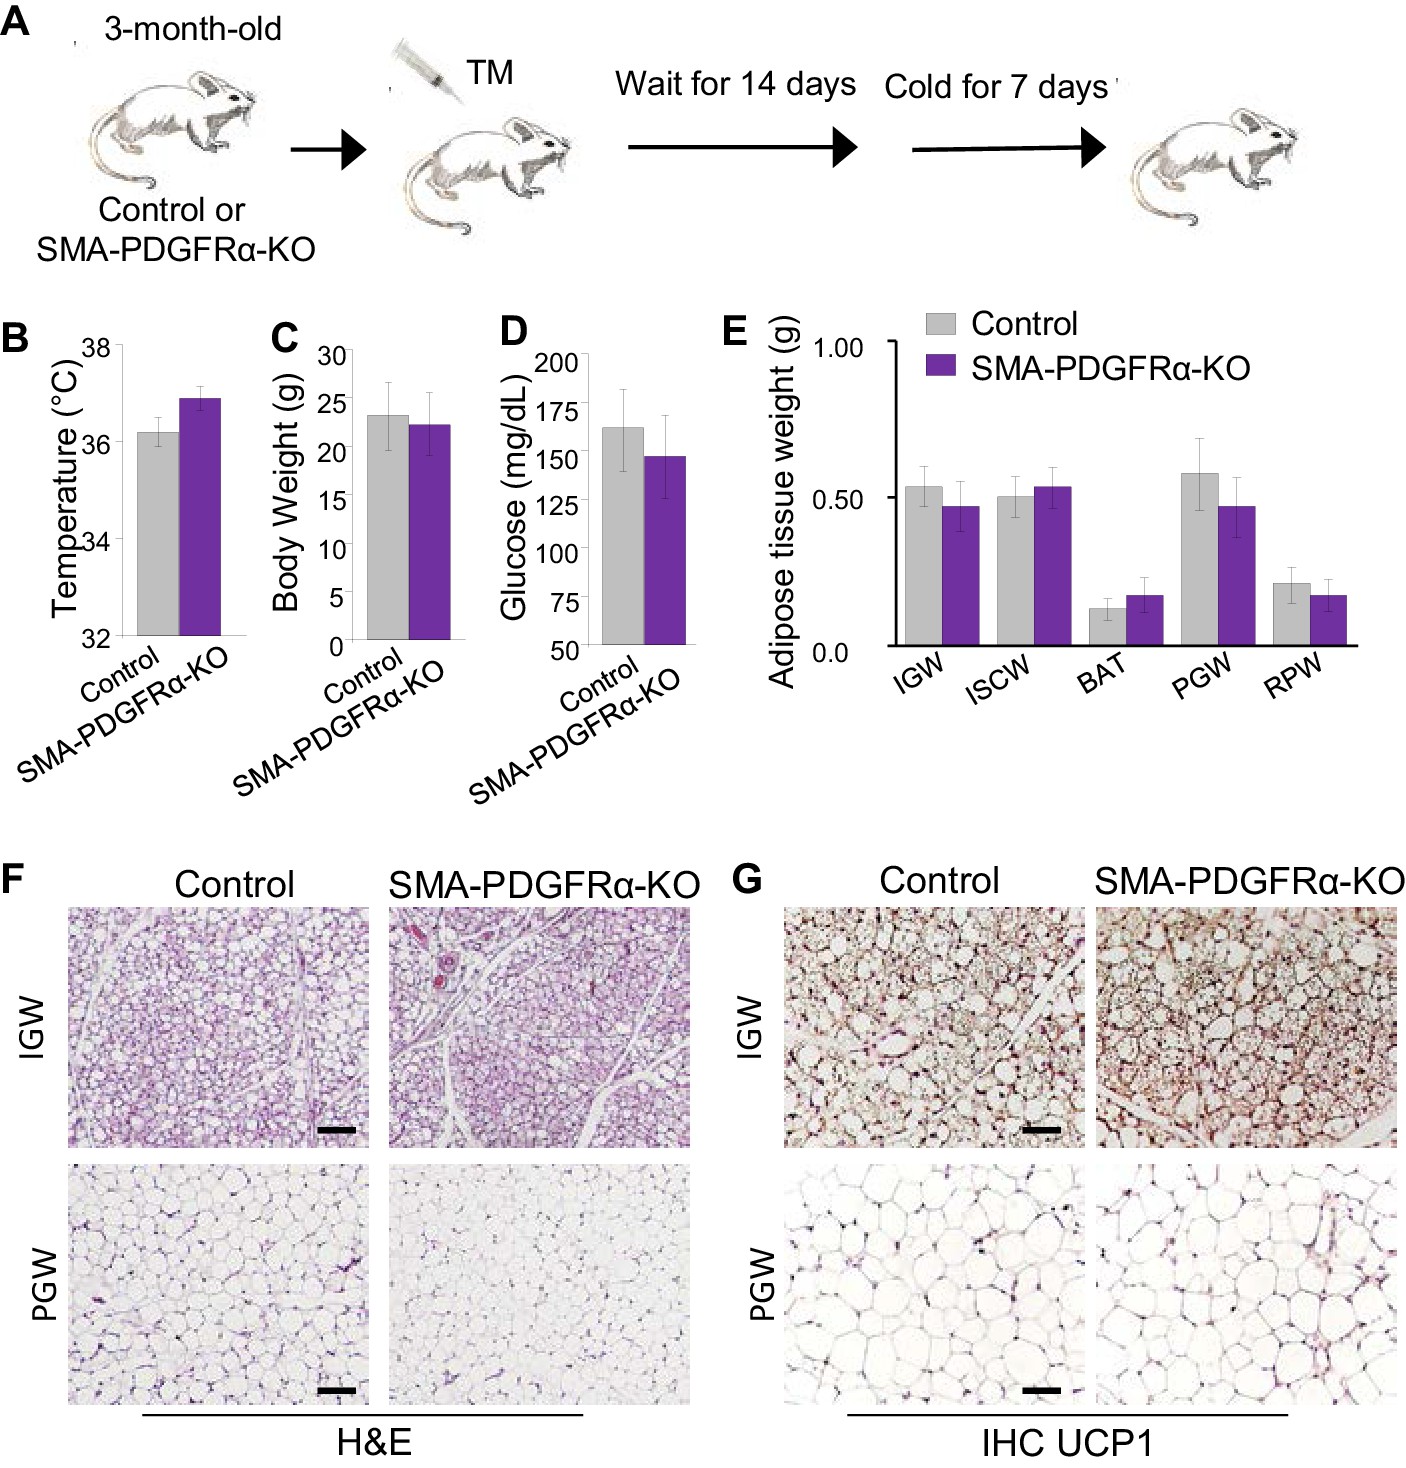
(A) A 3-month-old Acta2Cre-ERT2; Pdgfrafl/fl male control and SMA-PDGFRα-KO mice were administered TM. After 14 days of TM washout, the mice were cold-exposed for 7 days. (B) Rectal temperature after cold exposure. Data are expressed as mean ± SEM. (C) Body weight after cold exposure. Data are expressed as mean ± SEM. (D) Blood glucose after cold exposure. Data are expressed as mean ± SEM. (E) Adipose tissue weight. Data are expressed as mean ± SEM. (F) Hematoxylin and eosin (H&E) staining of IGW and PGW. Scale = 100 μm. (G) UCP1 staining of IGW and PGW using immunohistochemistry (IHC). Scale = 100 μm.
Figure 5—figure supplement 1
Deleting Pdgfra in adult SMA+ APCs is dispensable for cold-induced beige adipogenesis.
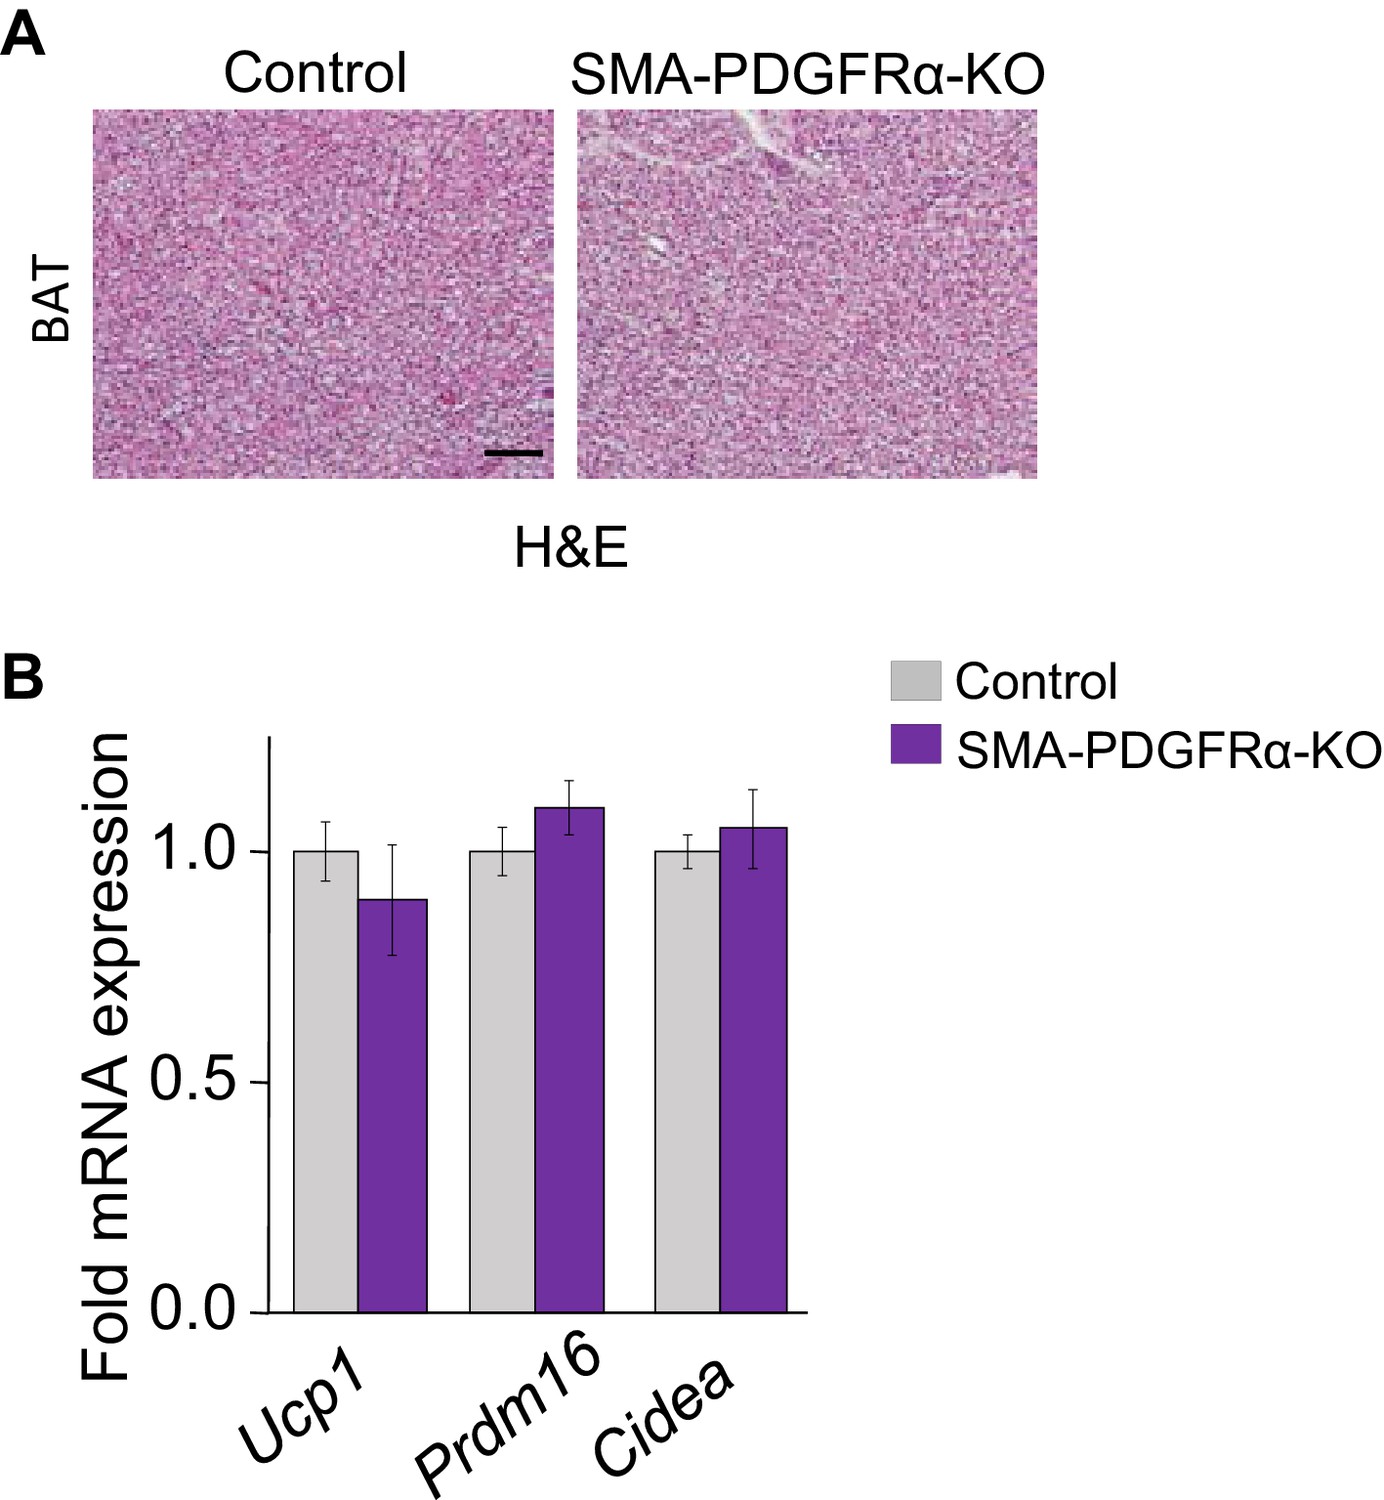
(A) A 3-month-old Acta2Cre-ERT2; Pdgfrafl/fl male control and SMA-PDGFRα-KO mice were administered TM. After 14 days of TM washout, the mice were cold-exposed for 7 days. H&E staining of BAT. Scale = 100 μm. (B) Thermogenic gene expression levels in control and SMA-PDGFRα-KO IGW. Data are expressed as mean ± SEM.
Figure 6 with 1 supplement
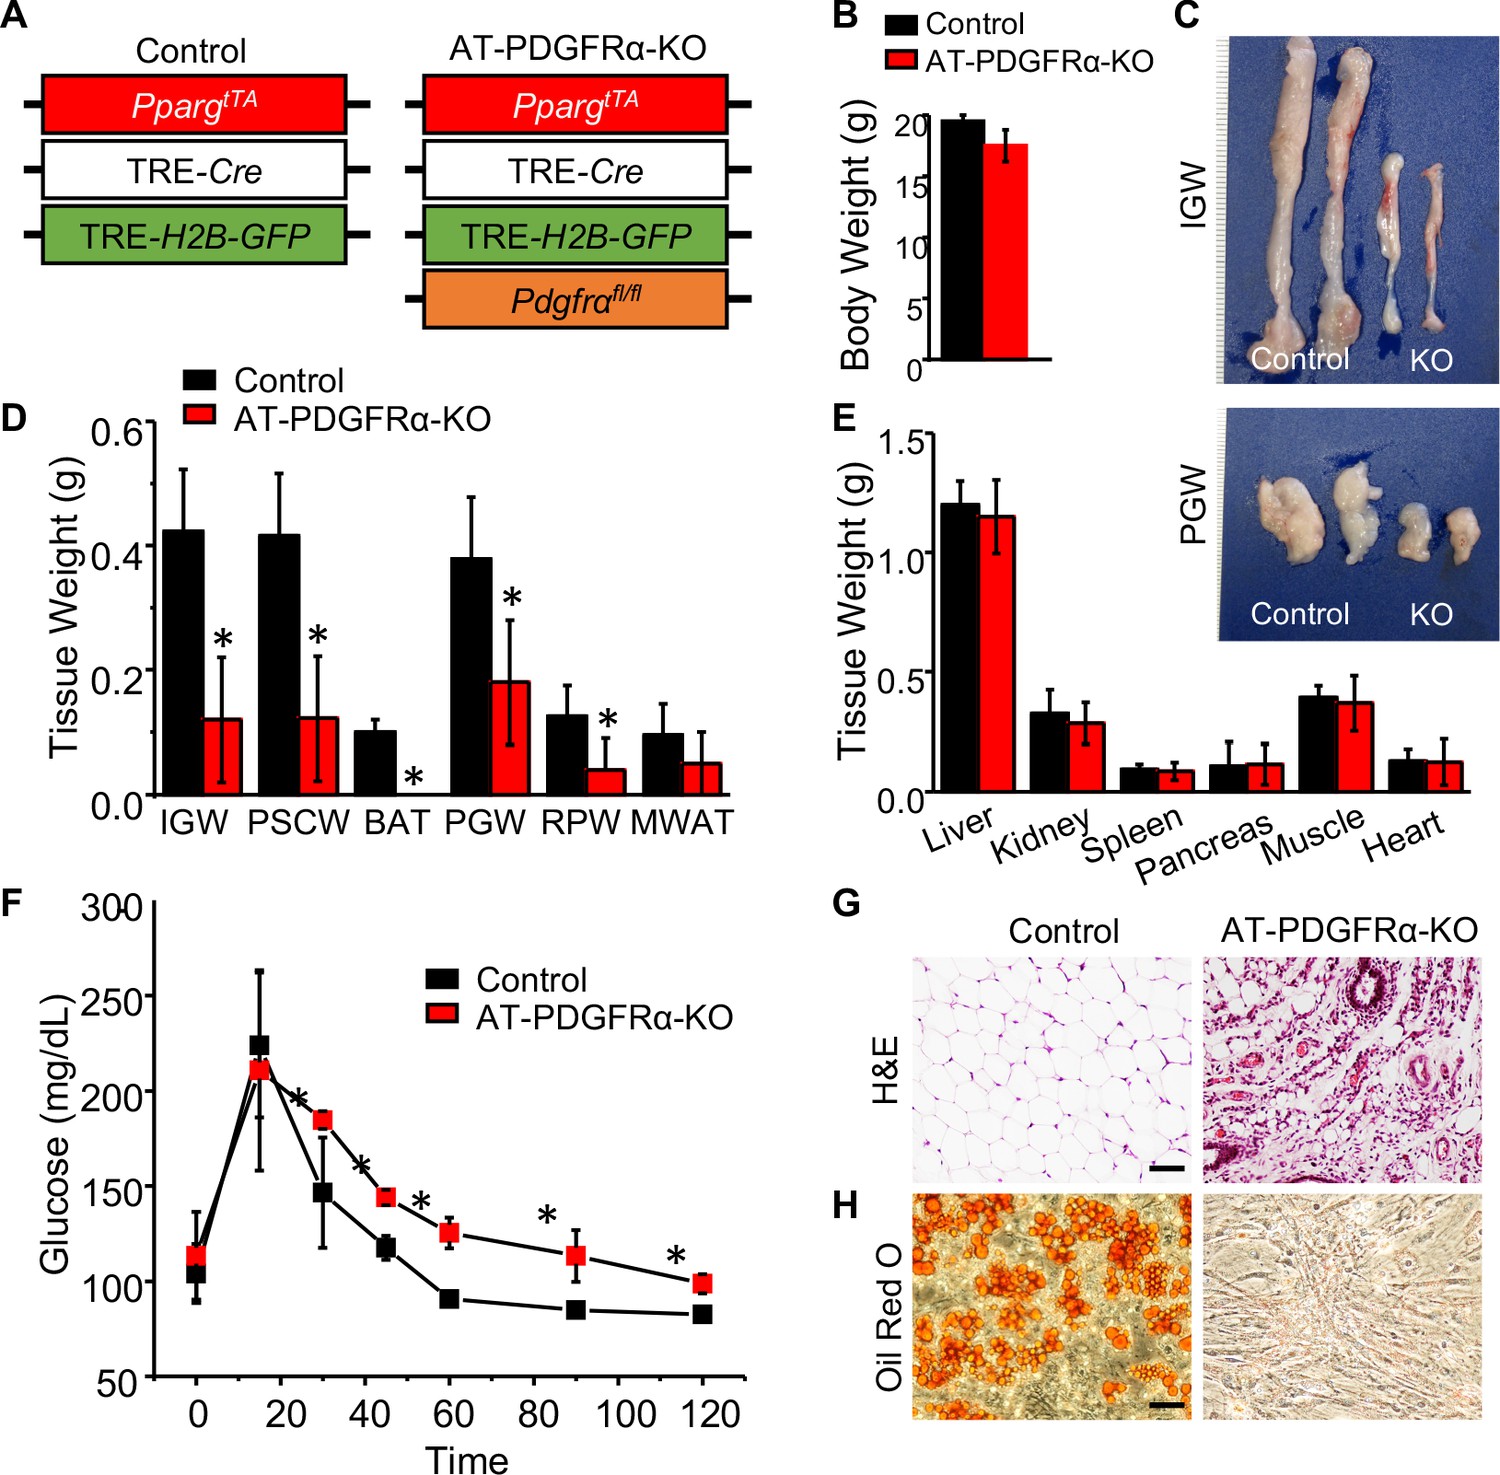
PDGFRα in developmental APCs is essential for adipose tissue development.
(A) A 2-month-old PpargtTA; TRE-Cre; TRE-H2B-GFP; Pdgfrafl/fl male control and AT-PDGFRα-KO mice were analyzed. (B) Body weight. Data are expressed as mean ± SEM. (C) IGW and PGW tissue. (D) Adipose tissue weight. *p<0.05 AT-PDGFRα compared to AT-Con mice. Data are expressed as mean ± SEM. (E) Other tissue weight. Data are expressed as mean ± SEM. (F) Blood glucose level during glucose tolerance test. *p<0.05 AT-PDGFRα-KO compared to control mice. Data are expressed as mean ± SEM. (G) Hematoxylin and eosin (H&E) staining of IGW. Scale = 100 μm. (H) Oil Red O staining of SVF isolated from IGW of control and AT-PDGFRα-KO mice.
Figure 6—figure supplement 1

PDGFRα in developmental APCs is essential for adipose tissue development.
(A) IGW tissues of 2-month-old PpargtTA; TRE-Cre; TRE-H2B-GFP; Pdgfrafl/fl male control and AT-PDGFRα-KO mice. (B) Hematoxylin and eosin (H&E) staining of ISCW and liver of control and AT-PDGFRα-KO mice. Scale = 100 μm.
Figure 7 with 1 supplement
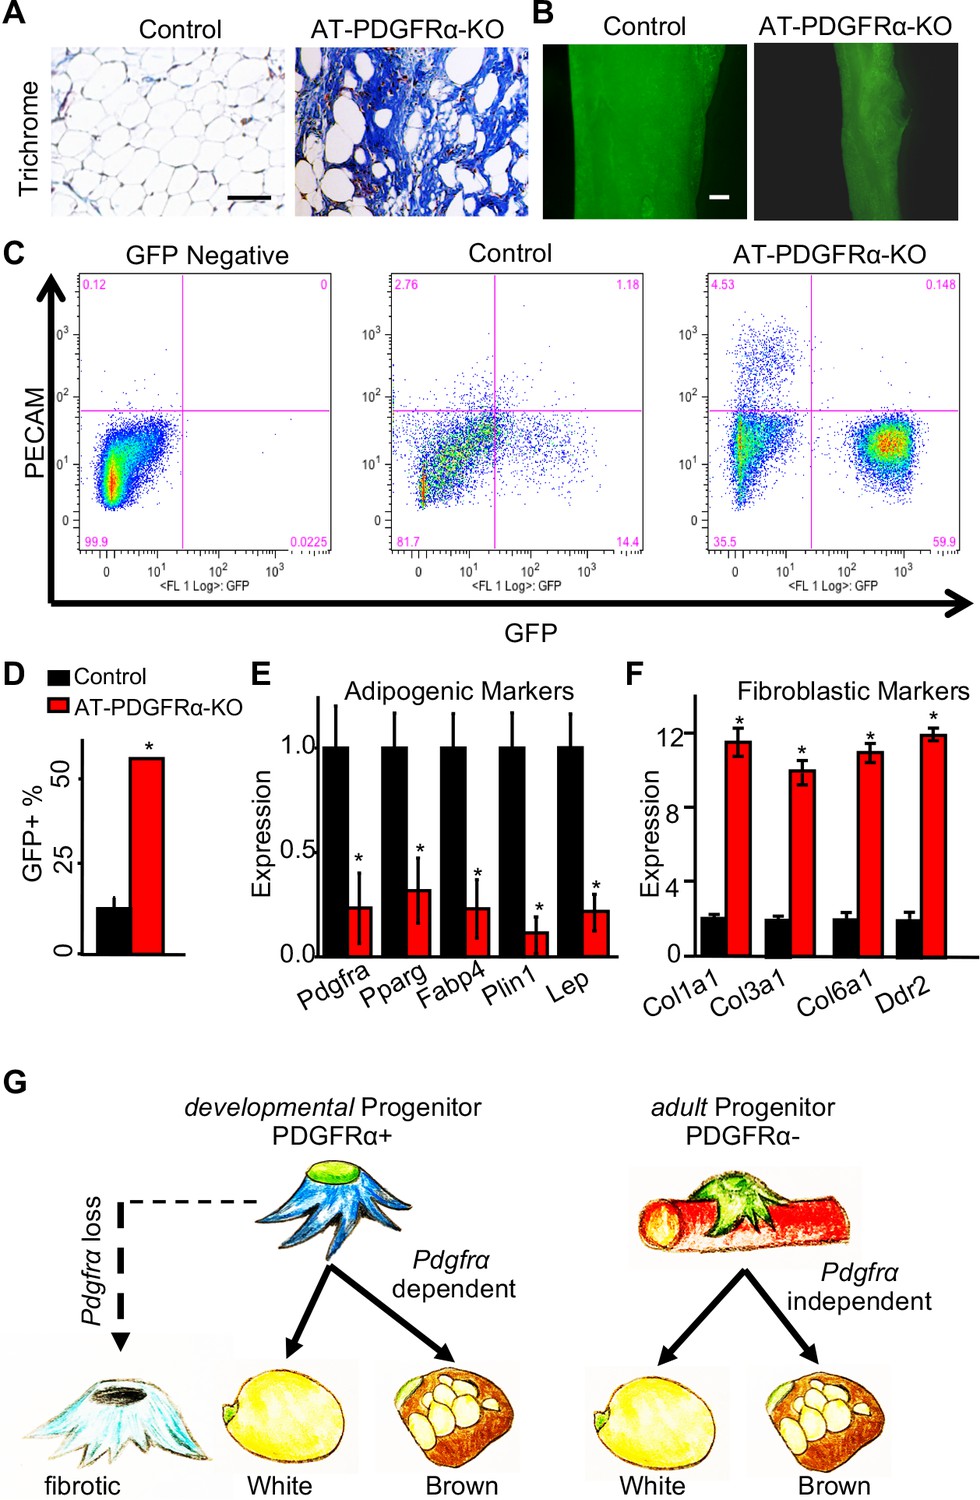
PDGFRα regulates adipose tissue development through lineage control.
(A) A 2-month-old PpargtTA; TRE-Cre; TRE-H2B-GFP; Pdgfrafl/fl male control and AT-PDGFRα-KO mice were analyzed. Trichrome staining of IGW. Scale = 200 μm. (B) Direct GFP fluorescence of IGW. Scale = 100 μm. (C) Flow cytometry profiles of SVF isolated from IGW. (D) Quantification of GFP+ adipose progenitor cell number. Data are expressed as mean ± SEM. (E) Adipogenic marker gene expression levels in GFP+ cells of SVF isolated from IGW. Data are expressed as mean ± SEM. (F) Fibrotic marker gene expression levels in GFP+ cells of SVF isolated from IGW. Data are expressed as mean ± SEM. *p<0.05 AT-PDGFRα-KO compared to control mice in D-F. (G) Working model for PDGFRα in developmental and adult progenitors. Developmental progenitors are marked by PDGFRa+ and adipogenesis is dependent on PDGFRα. In the absence of PDGFRα, developmental progenitors switch the lineage to fibrotic. Adult progenitors for WAT homeostasis are not marked by PDGFRα+ and adipogenesis during WAT homeostasis is largely PDGFRα independent.
Figure 7—figure supplement 1
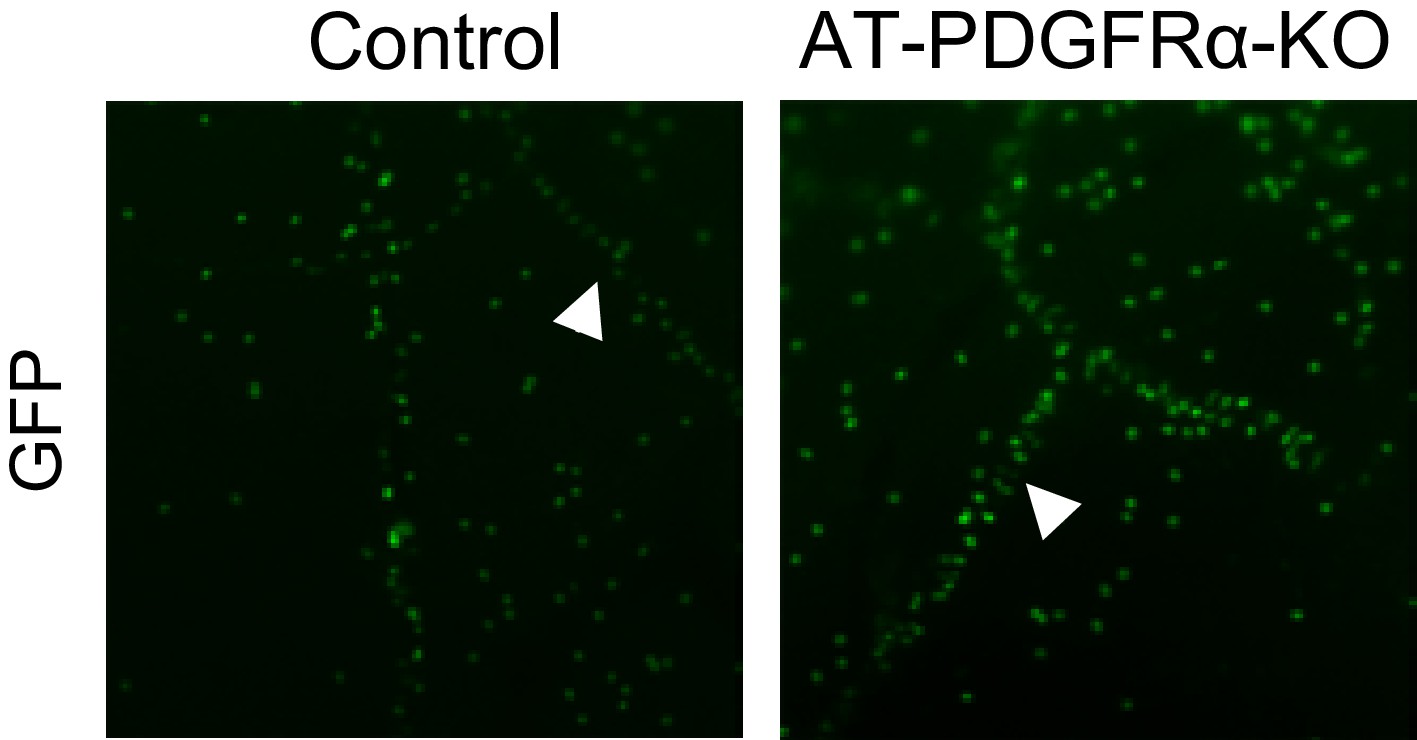
Pdgfra deletion in developmental APCs.
IGW tissues of P60 PpargtTA; TRE-Cre; TRE-H2B-GFP; Pdgfrafl/fl male control and AT-PDGFRα-KO mice. White arrowheads indicate the GFP+ progenitors align on the vasculature.
Additional files
-
Supplementary file 1
Primer sequences used.
- https://cdn.elifesciences.org/articles/56189/elife-56189-supp1-v2.docx
-
Transparent reporting form
- https://cdn.elifesciences.org/articles/56189/elife-56189-transrepform-v2.docx
Download links
A two-part list of links to download the article, or parts of the article, in various formats.
Downloads (link to download the article as PDF)
Open citations (links to open the citations from this article in various online reference manager services)
Cite this article (links to download the citations from this article in formats compatible with various reference manager tools)
Dynamic control of adipose tissue development and adult tissue homeostasis by platelet-derived growth factor receptor alpha
eLife 9:e56189.
https://doi.org/10.7554/eLife.56189


