The ribosomal RNA m5C methyltransferase NSUN-1 modulates healthspan and oogenesis in Caenorhabditis elegans
- Institute of Molecular Biotechnology, University of Natural Resources and Life Sciences, Vienna, Austria
- MDI Biological Laboratory, United States
- RNA Molecular Biology, Fonds de la Recherche Scientifique (F.R.S./FNRS), Université Libre de Bruxelles (ULB), Belgium
- Ludwig Boltzmann Institute of Experimental and Clinical Traumatology, Austria
Figures
Figure 1 with 3 supplements
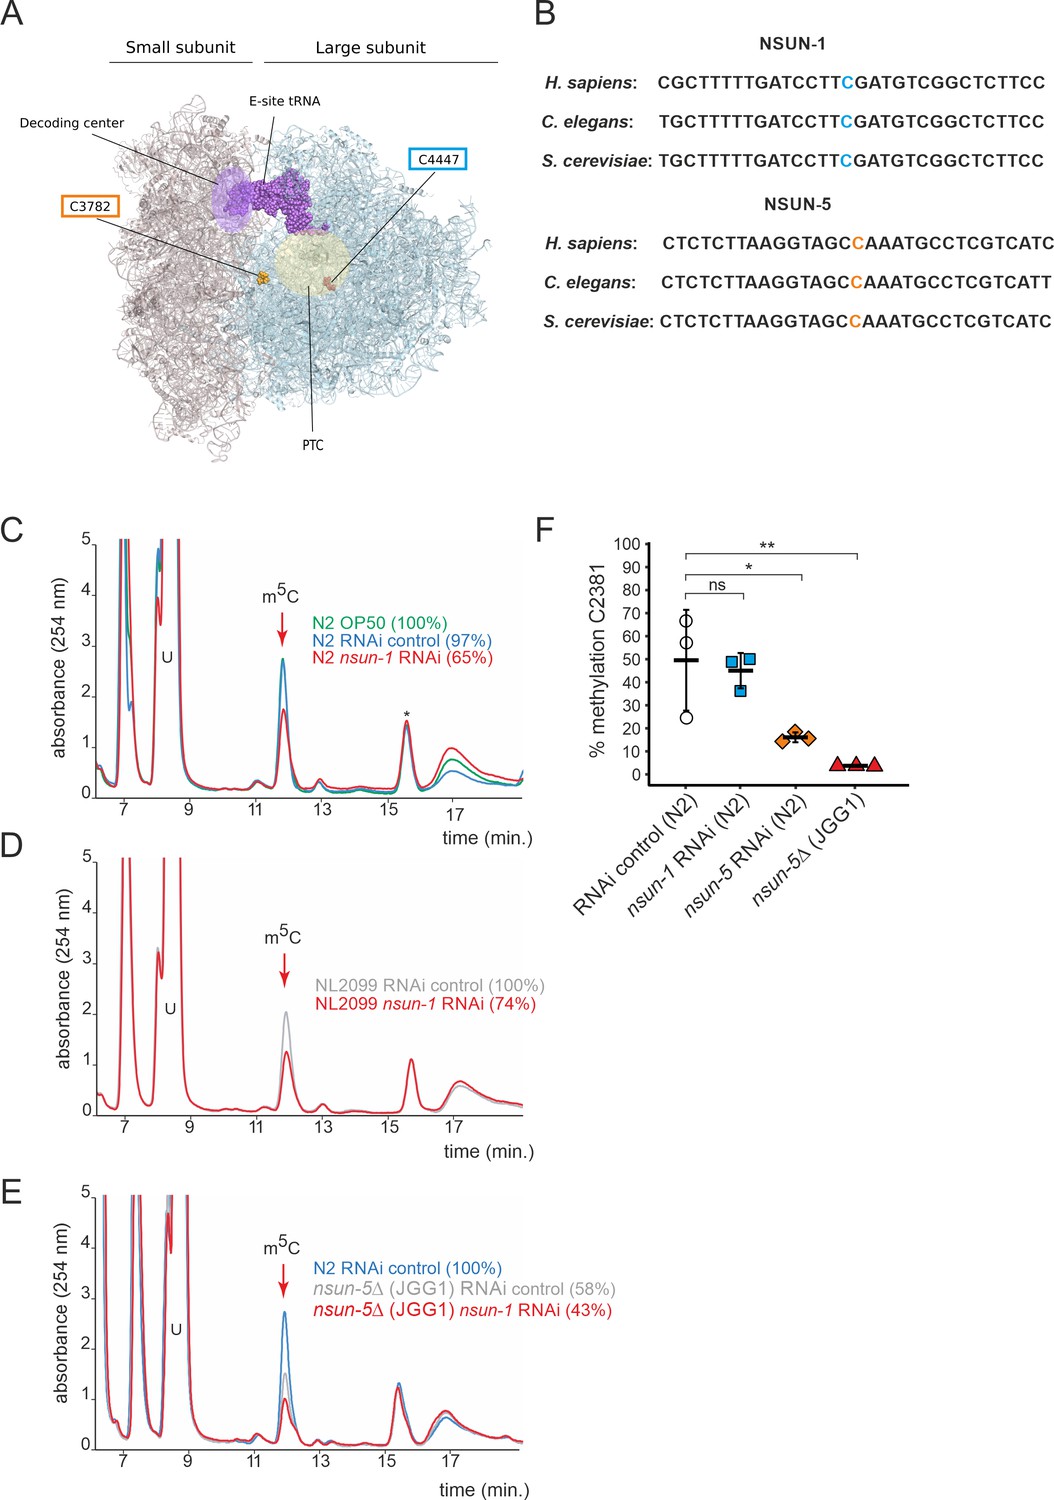
NSUN-1 is responsible for large ribosomal subunit 26S rRNA m5C methylation.
(A) Location of the two eukaryotic large ribosomal subunit m5C residues within the 3D structure of the human ribosome. For reference, important functional sites are indicated (DCS = decoding site, PTC = peptidyl transferase center). In C. elegans, NSUN-1 is responsible for m5C2982 (this work) while NSUN-5 installs m5C2381 (Schosserer et al., 2015). (B) Regions surrounding the sites modified by NSUN-1 and NSUN-5 are evolutionarily conserved between yeast, worms, and humans. The modified cytosine is indicated. (C–E) Purified 26S rRNA was isolated by sucrose gradient centrifugation, digested to single nucleotides and analyzed by quantitative HPLC. nsun-1 knockdown consistently leads to a decrease of m5C levels. (C) N2 worms were analyzed as either: untreated (OP-50), treated with an RNAi control or with a nsun-1 targeting RNAi. (D) NL2099 RNAi-hypersensitive worms were treated with the RNAi control or with the nsun-1 targeting RNAi. (E) N2 strain treated with RNAi control and the nsun-5 deletion strain (JGG1) treated with control RNAi or a nsun-1 targeting RNAi. For quantification of m5C peak area, the peak was normalized to the peak eluting at 16 min (asterisk). The experiment was independently repeated once with similar outcome (see Figure 1—figure supplement 3). (F) Quantification of the enzymatic activity of NSUN-5 using the COBRA assay for N2 worms, subjected to either nsun-5 or nsun-1 RNAi, and the nsun-5 mutant strain JGG1 (nsun-5Δ). Loss of nsun-5 leads to significantly decreased methylation levels at C2381, whereas nsun-1 RNAi does not alter methylation at this site (three independent biological replicates, one-way ANOVA with Dunnett´s post test, α = 0.05, *p<0.05, **p<0.01).
-
Figure 1—source data 1
Raw data of COBRA assays to quantify methylation levels.
ZIP-compressed archive containing two gel images, which were used for quantification, and a xlsx-file with the calculated methylation values.
- https://cdn.elifesciences.org/articles/56205/elife-56205-fig1-data1-v2.zip
Figure 1—figure supplement 1
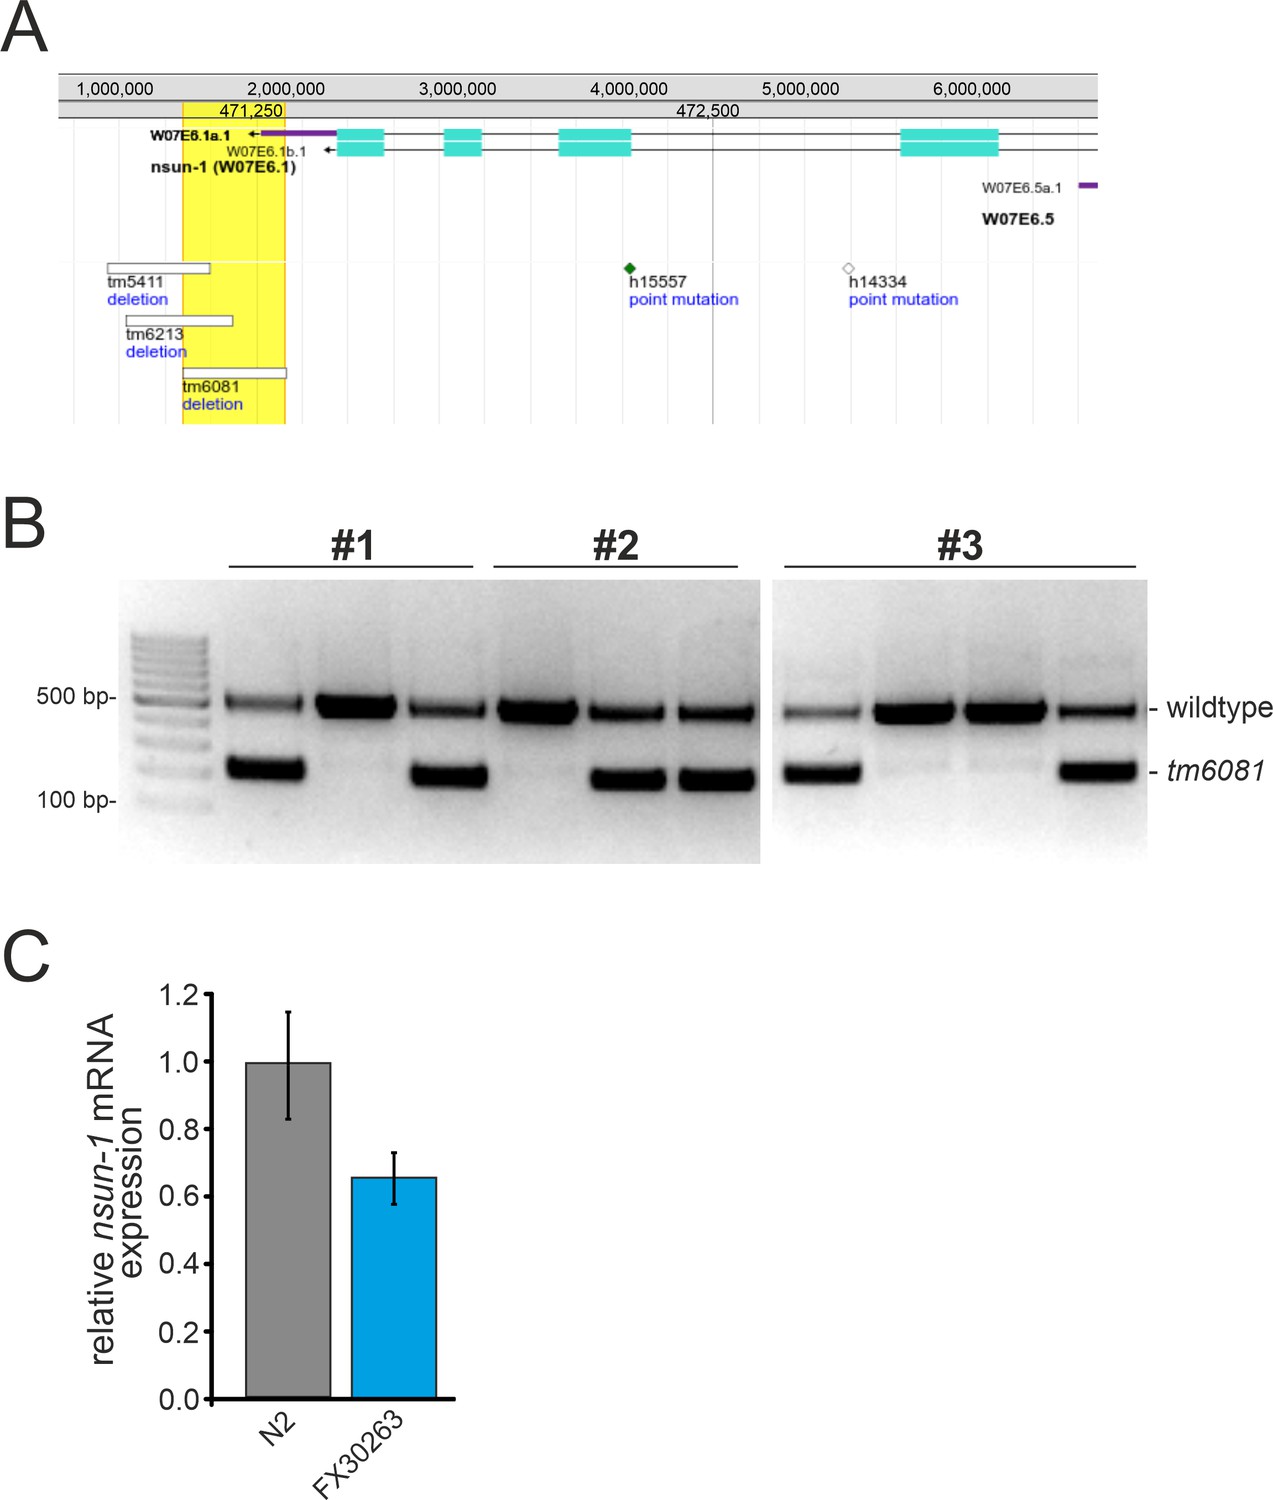
Characterization of the tm6081 allele.
(A) The tm6081 allele represents a deletion in the 3’ UTR of the nsun-1 gene. The 3’ end of the nsun-1 gene, as well as mutant alleles are depicted. The image was generated with the JBrowse genome browser implemented in WormBase (http://www.wormbase.org). (B) The homozygous tm6081 allele is lethal. Single hermaphrodites from the FX30263 strain, which were confirmed by genotyping to be heterozygous for tm6081, were put on separate plates and allowed to self-fertilize (F0). Offspring (F1) were individually genotyped by PCR. Ten F1 offspring from three F0 animals are shown as example. The upper band (482 bp) represents the wildtype allele and the lower band the tm6081 mutant allele (197 bp). Only wildtype and heterozygous F1 animals were detected. (C) Quantification of nsun-1 mRNA levels using RT-qPCR in synchronized young adult FX30263 nematodes, which were heterozygous for tm6081. nsun-1 mRNA levels were decreased by approximately 40%. act-1 was used for normalization. Error bars represent standard deviation of four technical replicates.
Figure 1—figure supplement 2
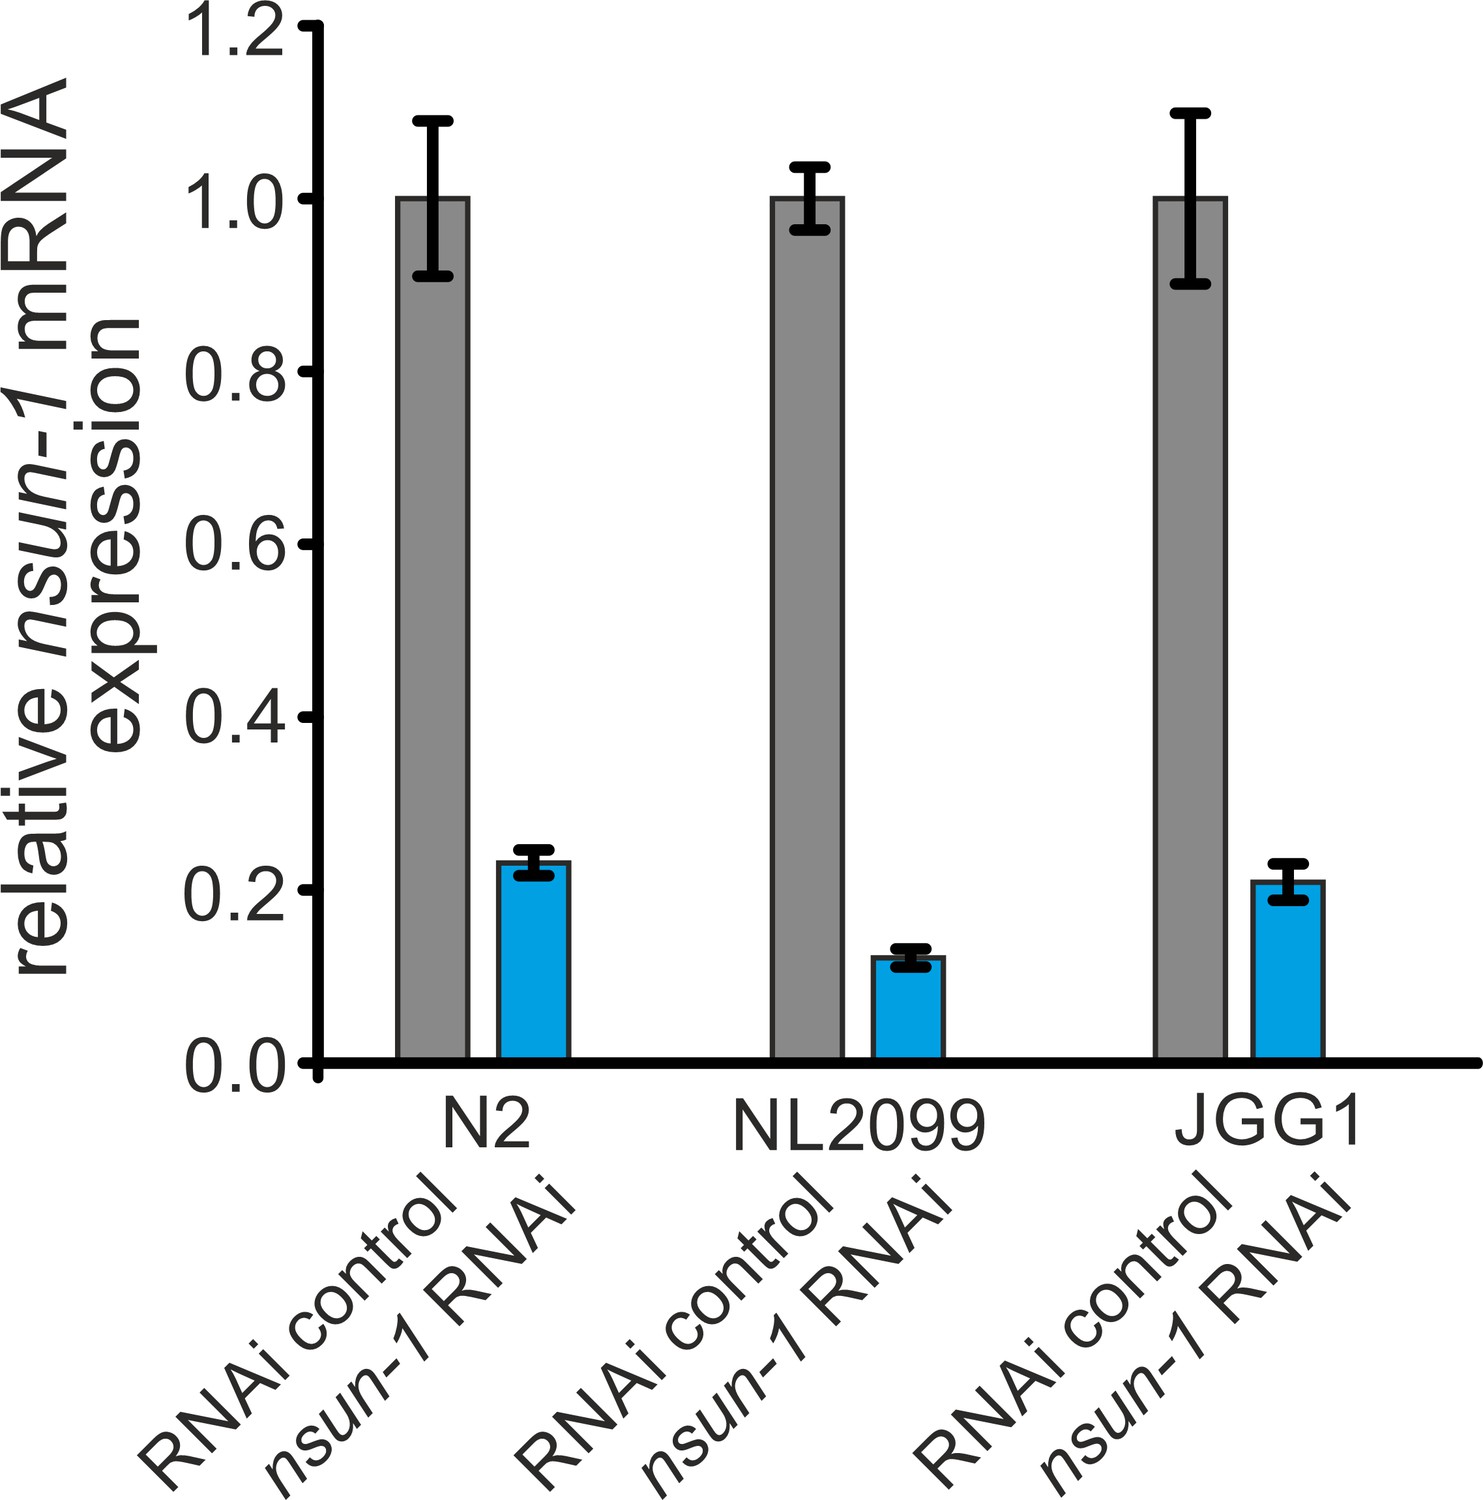
RNAi effectively depletes nsun-1 in C.elegans.
Quantification of nsun-1 mRNA levels using RT-qPCR in N2, NL2099, and JGG1 nematode strains. Worms were subjected to control and nsun-1 RNAi. nsun-1 mRNA levels were decreased by approximately80% in N2 and JGG1, as well as by 90% in the RNAi-hypersensitive strain NL2099. act-1 was used for normalization. Error bars represent standard deviation of four technical replicates. This experiment was repeated independently with similar outcome.
Figure 1—figure supplement 3
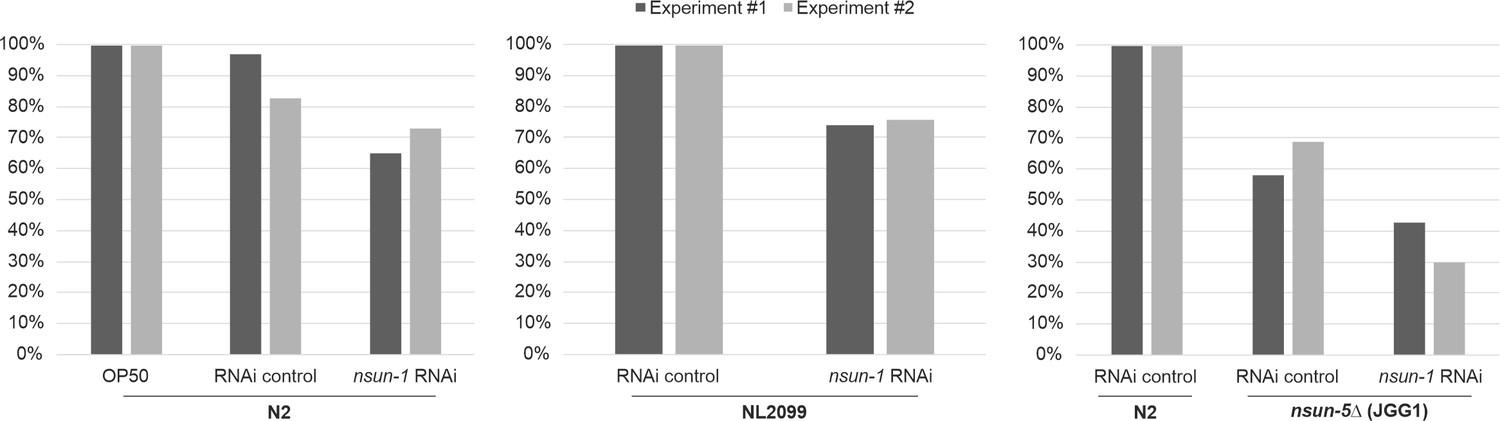
NSUN-1 methylates 26S rRNA.
Purified 26S rRNA was isolated by sucrose gradient centrifugation, digested to single nucleotides, and analyzed by quantitative HPLC. nsun-1 knockdown consistently leads to a decrease of m5C levels. N2 worms were analyzed as either: untreated (OP-50), treated with an RNAi control or with a nsun-1 targeting RNAi. NL2099 RNAi-hypersensitive worms were treated with the RNAi control or with the nsun-1 targeting RNAi. N2 strain treated with RNAi control and the nsun-5 deletion strain (JGG1) treated with control RNAi or a nsun-1 targeting RNAi. For quantification of m5C peak area, the peak was normalized to the peak eluting at 16 min. Two independent biological experiments, indicated by different shades of grey, are shown.
Figure 2
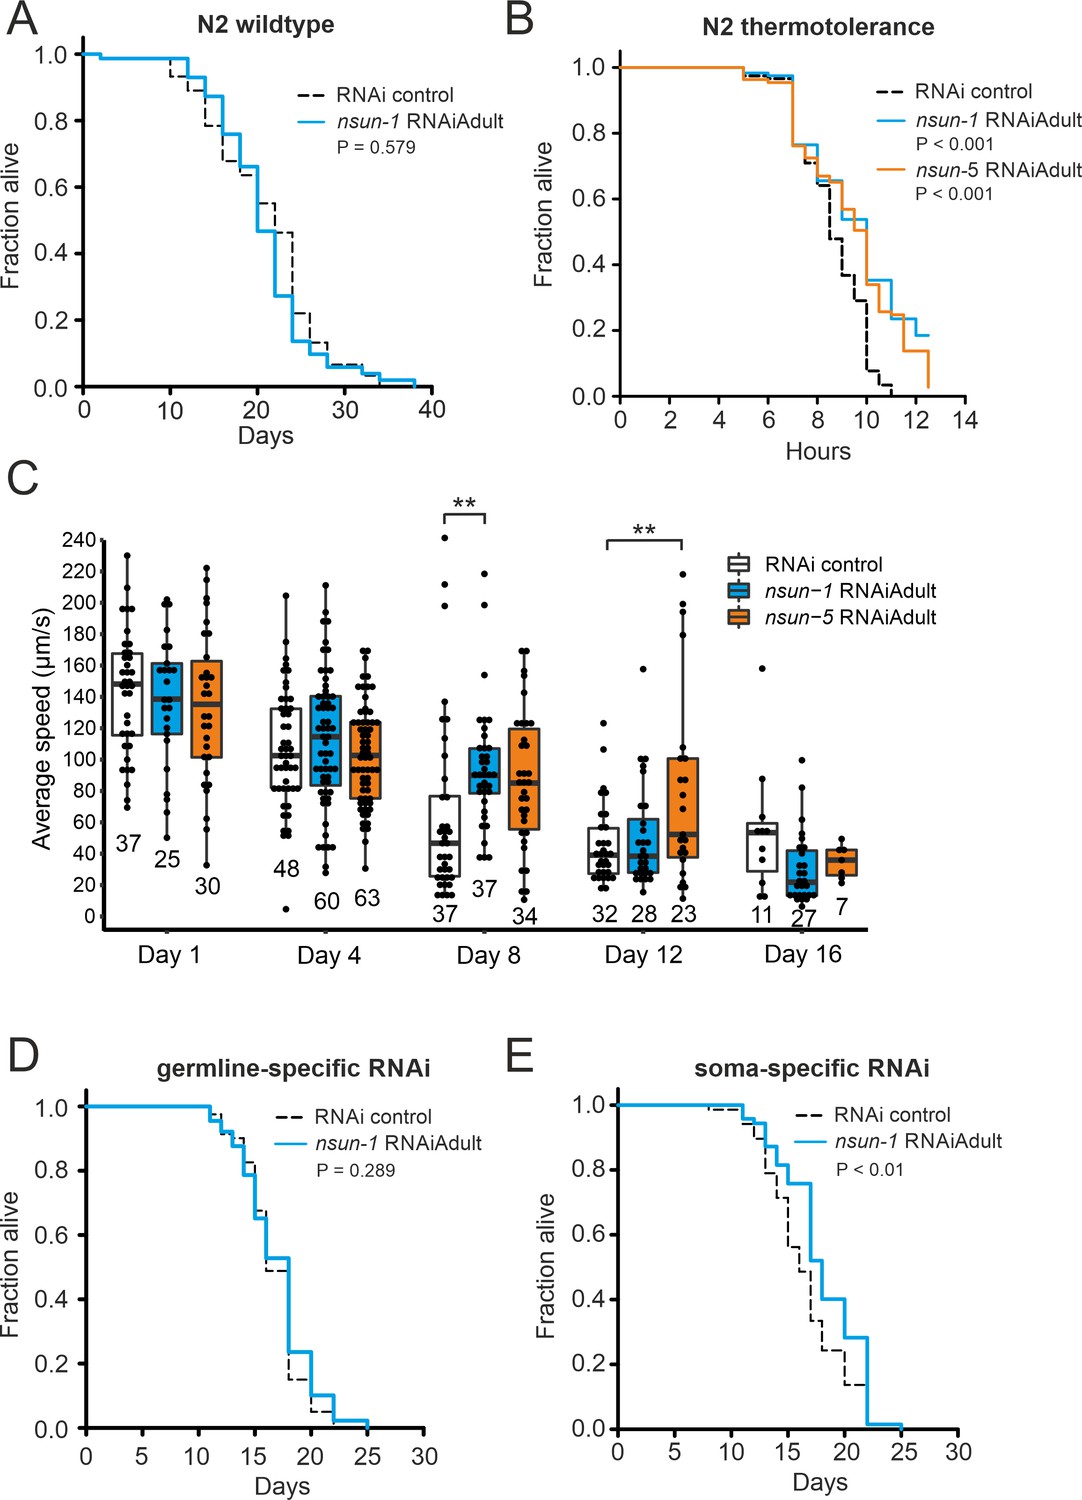
The soma-specific depletion of nsun-1 extends lifespan.
(A) Nsun-1 whole-body adult-onset RNAi (N2 wildtype strain) does not affect lifespan. Three independent biological experiments were performed. One representative replicate it shown. n = 75 animals per condition, log-rank test, not significant. (B) N2 wildtype animals treated with either nsun-1 or nsun-5 RNAi and subjected to heat stress (35°C) show increased survival compared to the RNAi control. Nine pooled biological replicates are shown. Pooled n ≥ 100 animals per condition, log-rank, p<0.001. (C) Average speed [µm/s] of N2 wildtype worms as indicator of the health status was measured at day 1, 4, 8, 12, and 16 of adulthood. Movies of animals treated with either RNAi control, nsun-1 or nsun-5 RNAi were recorded. One representative experiment is shown. Three biological replicates were performed with similar outcome. n ≥ 20 animals per condition at day 1. The black line indicates median. Statistical significance at each timepoint was determined using multiple comparison adjusted t-tests by the Holm-Sidak method. α = 0.05, **p<0.01. (D–E) Lifespan analysis of germline- (NL2098) and soma-specific RNAi strains (NL2550). Worms were treated with either RNAi control or nsun-1 RNAi (adult-onset). Only soma-specific knockdown of nsun-1 results in increased lifespan (E) while germline-specific knockdown does not (D). Two independent biological experiments were performed. One representative replicate it shown. n(NL2098)=90 animals per condition and replicate, log-rank, not significant, n(NL2550)=90 animals per condition and replicate, log-rank, (p<0.01). A summary table of the individual replicates of lifespan experiments is provided as Table 1.
-
Figure 2—source data 1
Raw data of lifespan, motility, and thermotolerance experiments.
ZIP-compressed archive containing xlsx-files for each individual lifespan experiment. Column A: plate number for lifespan (technical replicates) and biological replicate number for thermotolerance, column B: animal number. The rest of the columns are paired and contain lifespan data for the individual RNAi treatments, whereby the first column of each pair indicates the timepoint (days for lifespan, hours for thermotolerance) and the second column the scored event (either DEAD or CENSORED, for scoring criteria see Materials and Methods). Thermotolerance and motility raw data are also provided as individual xlsx-files.
- https://cdn.elifesciences.org/articles/56205/elife-56205-fig2-data1-v2.zip
Figure 3 with 1 supplement
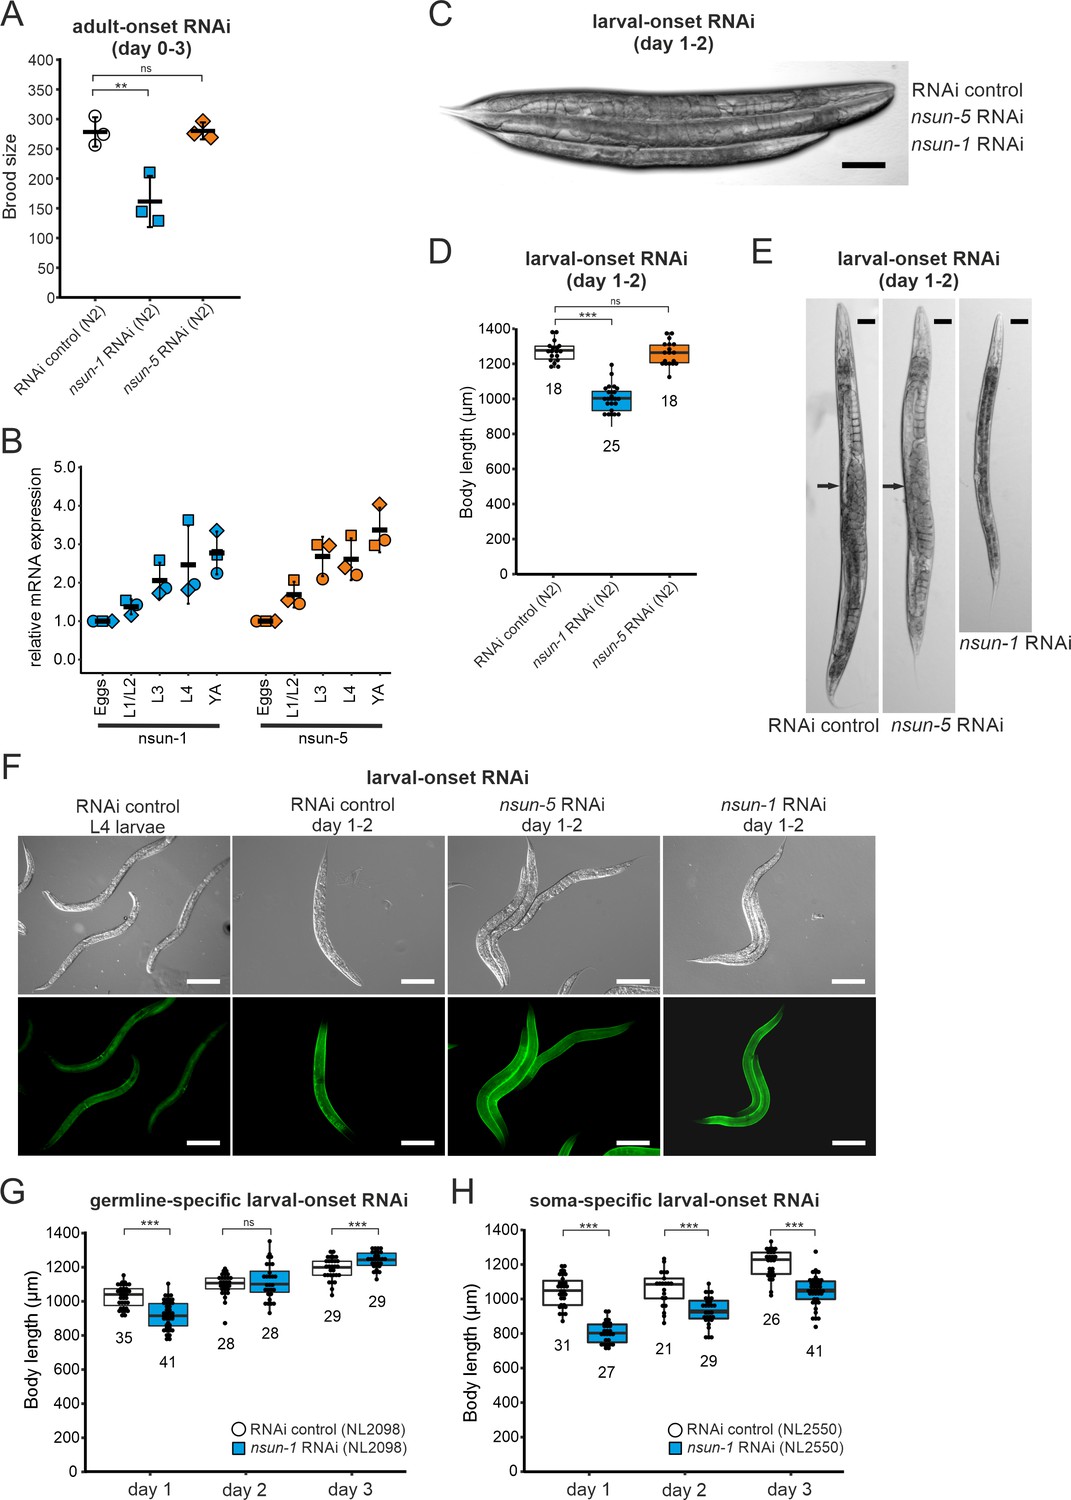
Loss of nsun-1 reduces body size and impairs fecundity.
(A) Brood size analysis of adult-onset RNAi exposed animals at day 0–3 of adulthood (=day 3–6 from egg). Eggs of individual worms were counted and the total number of eggs per worm is shown. Knockdown of nsun-1 but not nsun-5 induced a significant reduction in brood size compared to control RNAi (three independent experiments, n = 5 per condition and per experiment, one-way ANOVA with Dunnett´s post test, α = 0.05, **p<0.01). Error bars indicate standard deviation. (B) RT-qPCR analysis of wild-type animals at different stages of development (eggs, L1/L2 larvae, L3 larvae, L4 larvae, and young adults). tba-1 was used for normalization and expression is shown relative to eggs. Error bars represent standard deviation of three biological replicates, one-sample t-test against expected value of 1 with multiple comparison correction by Holm's method did not reveal significant differences. (C) Representative DIC images of larval-onset RNAi exposed nematodes at day 1–2 of adulthood show that only nsun-1 but not nsun-5 RNAi decreased the body length and altered general morphology compared to the RNAi control. Scale bar, 100 µm. (D) Quantification of mean body length of 1–2 day old larval-onset RNAi exposed adult worms. The body size of nsun-1 RNAi-treated worms was significantly reduced compared to the RNAi control and nsun-5 RNAi. The experiment was independently performed two times and one representative replicate is shown. n(RNAi control)=18, n(nsun-1 RNAi)=25, n(nsun-5 RNAi)=19, one-way ANOVA with Dunnett’s post, α = 0.05, ***p<0.001. Error bars represent standard deviation. (E) Larval-onset nsun-1 RNAi-treated adults at day 1–2 of adulthood had reduced body size and lacked embryos (arrow). Scale bar, 50 µm. (F) Loss of nsun-1 did not impair expression of the adult-specific marker COL-19::GFP. The TP12 strain was used and young adult animals (day 1–2 of adulthood) treated with either larval-onset control RNAi, nsun-1 RNAi or nsun-5 RNAi were imaged in DIC and fluorescent mode. L4 control RNAi worms, which did not express GFP specifically in the hypodermis, were used as negative control. Scale bar, 200 µm. (G–H) Soma- but not germline-specific nsun-1 larval-onset RNAi phenocopied the mean body length defect upon whole-body nsun-1 knockdown. The germline-specific NL2098 strain (G) and the soma-specific NL2550 (H) strain were used and measured on three consecutive days after reaching adulthood. n ≥ 21 for each day and condition. Two independent experiments were performed and one representative replicate is shown. Two-tailed t-test, ***p<0.001. Error bars represent standard deviation.
-
Figure 3—source data 1
Raw data of brood size, expression during development and body length experiments.
ZIP-compressed archive containing xlsx-files with raw data of the respective experiments.
- https://cdn.elifesciences.org/articles/56205/elife-56205-fig3-data1-v2.zip
Figure 3—figure supplement 1
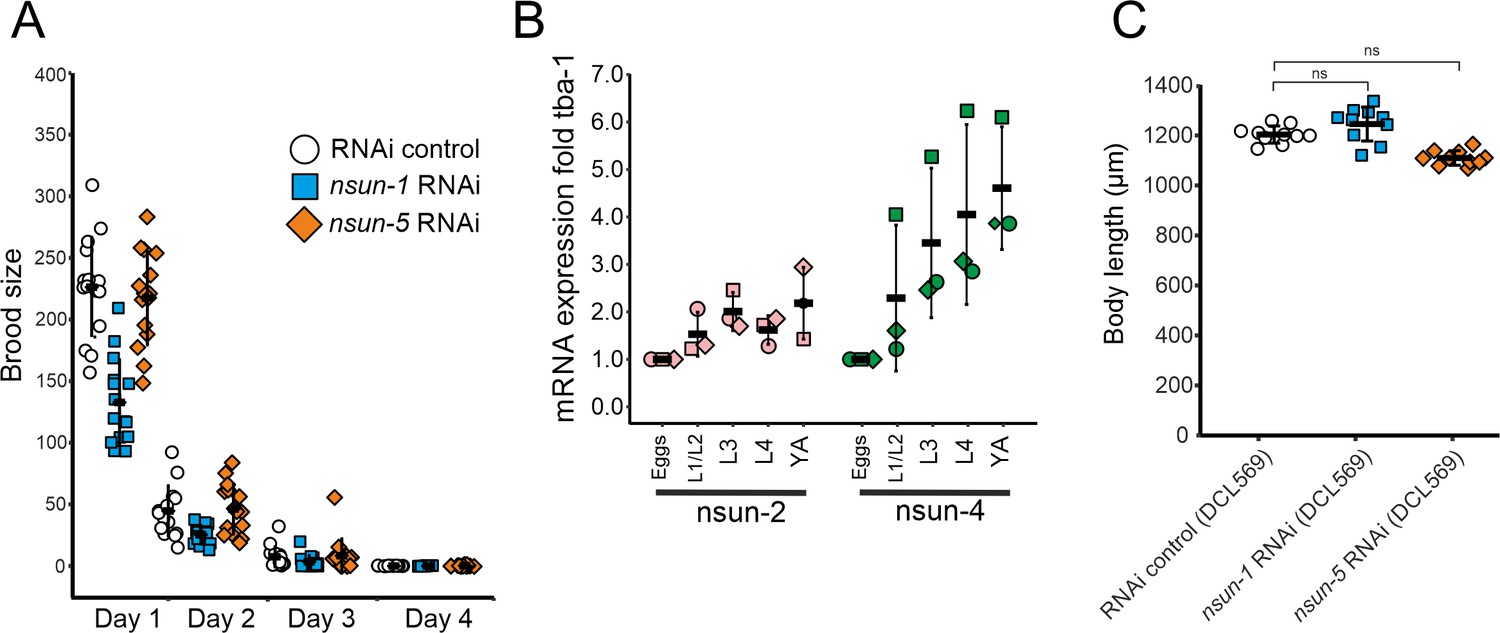
nsun-1 depleted worms display impaired fecundity.
(A) Brood size analysis of adult-onset RNAi exposed animals. Eggs of individual worms were counted every day until day 4 of adulthood. Knockdown of nsun-1, but not nsun-5, inflicted a reduced brood size compared to control RNAi. Three pooled independent experiments are shown. n = 5 per condition and per experiment. Error bars indicate standard deviation. (B) RT-qPCR analysis of developing wild-type animals (eggs, L1/L2 larvae, L3 larvae, L4 larvae and young adults) revealed enhanced mRNA expression of nsun-2 and nsun-4 during development. Three independent biological experiments are shown. tba-1 was used for normalization. Error bars represent standard deviation. (C) Body size of 1–2 day old adult worms of a germline-specific RNAi strain (DCL569) was measured. The body size of nsun-1 and nsun-5 RNAi-treated animals was not changed compared to RNAi control. n(all conditions)=10, one-way ANOVA with Dunnett’s post, α = 0.05, not significant. Error bars represent standard deviation.
Figure 4 with 2 supplements

Soma-specific depletion of nsun-1 blocks oogenesis.
(A) Schematic of one gonad arm in C. elegans. Germ cell replication starts in the distal mitotic zone. After passing through the meiotic zone, oocytes further mature and are fertilized by sperm produced in the spermatheca. In panels A–E, an asterisk indicates the gonadal region impaired in nsun-1 RNAi exposed animals. This area corresponds to the transition between the meiotic zone and oocyte maturation. (B) Microscopic image of one gonad arm of young adult worms subjected to either control or nsun-1 RNAi. Worms were imaged in DIC mode and nuclei of fixed animals were stained with DAPI. Scale bar, 40 µm. (C) Confocal imaging of the gonad-specific GFP::RHO-1 expressing SA115 strain revealed altered gonad morphology upon nsun-1 knockdown (see also Figure 4—figure supplement 1). Scale bar, 40 µm. Altered gonad morphology was observed in all analyzed animals exposed to nsun-1 RNAi (n > 50). (D–E) Soma- but not germline-specific nsun-1 RNAi phenocopied altered gonad morphology upon whole-body nsun-1 depletion. NL2550 was used for soma- (D) and NL2098 for germline-specific knockdown (E). One gonad arm of one representative 2 day old adult animal was imaged in DIC mode and nuclei were stained with DAPI following fixation. Scale bar, 40 µm.
Figure 4—figure supplement 1
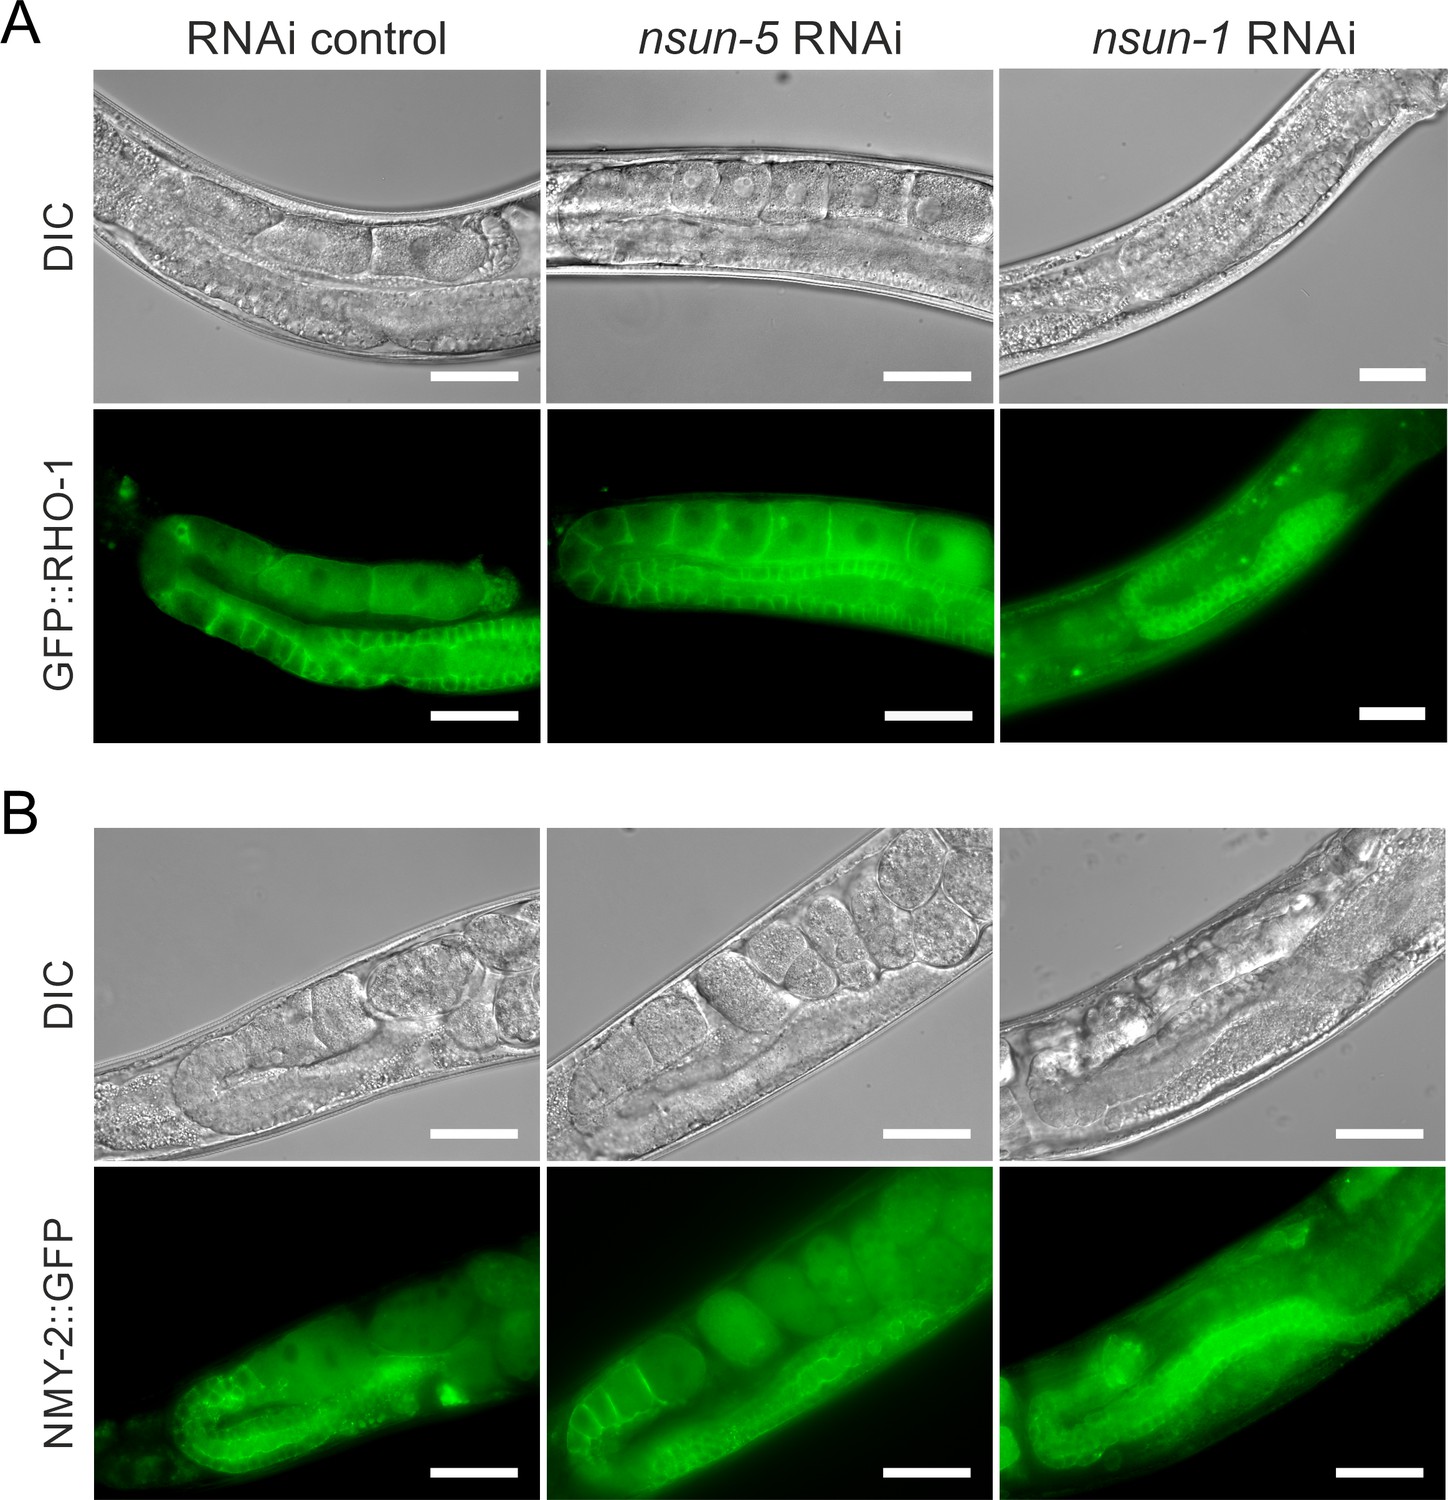
nsun-1 but not nsun-5 depletion inflicts a defect in oogenesis.
(A, B) Gonad specific expression of GFP::RHO-1 (SA115 strain) (A) and NMY-2::GFP (JJ1473 strain) (B) were used to visualize the morphology of the germline after nsun-1 and nsun-5 knockdown. Scale bar represents 40 µm. Oozyte maturation starting from the loop region was impaired in nsun-1 RNAi, but not in nsun-5 RNAi-treated animals. Altered gonad morphology was observed in all analyzed animals exposed to nsun-1 RNAi (n > 50).
Figure 4—figure supplement 2
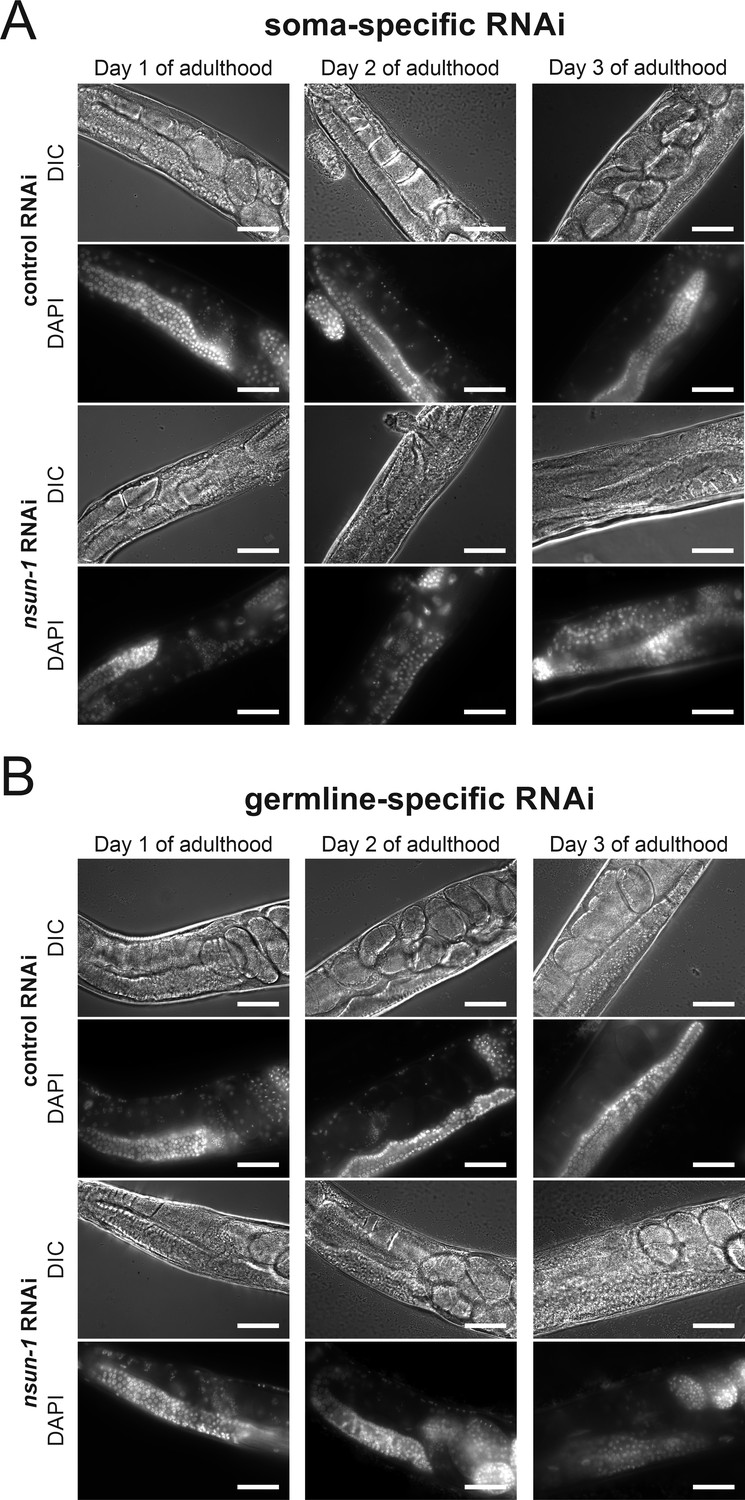
Somatic- but not germline-specific nsun-1 depletion causes defective oogenesis.
(A–B) Soma- but not germline-specific nsun-1 RNAi phenocopies altered gonad morphology of whole-body nsun-1 depletion. NL2550 was used for soma- (A) and NL2098 for germline-specific knockdown (B). The gonad of 1-, 2-, and 3-day-old animals was imaged in DIC mode and nuclei were stained with DAPI following fixation. In the soma-specific strain maturating oocytes and embryos were observed only in RNAi control but not in nsun-1 RNAi subjected worms. The germline-specific strain remained entirely unaffected. Scale bar represents 40 µm.
Figure 5 with 1 supplement
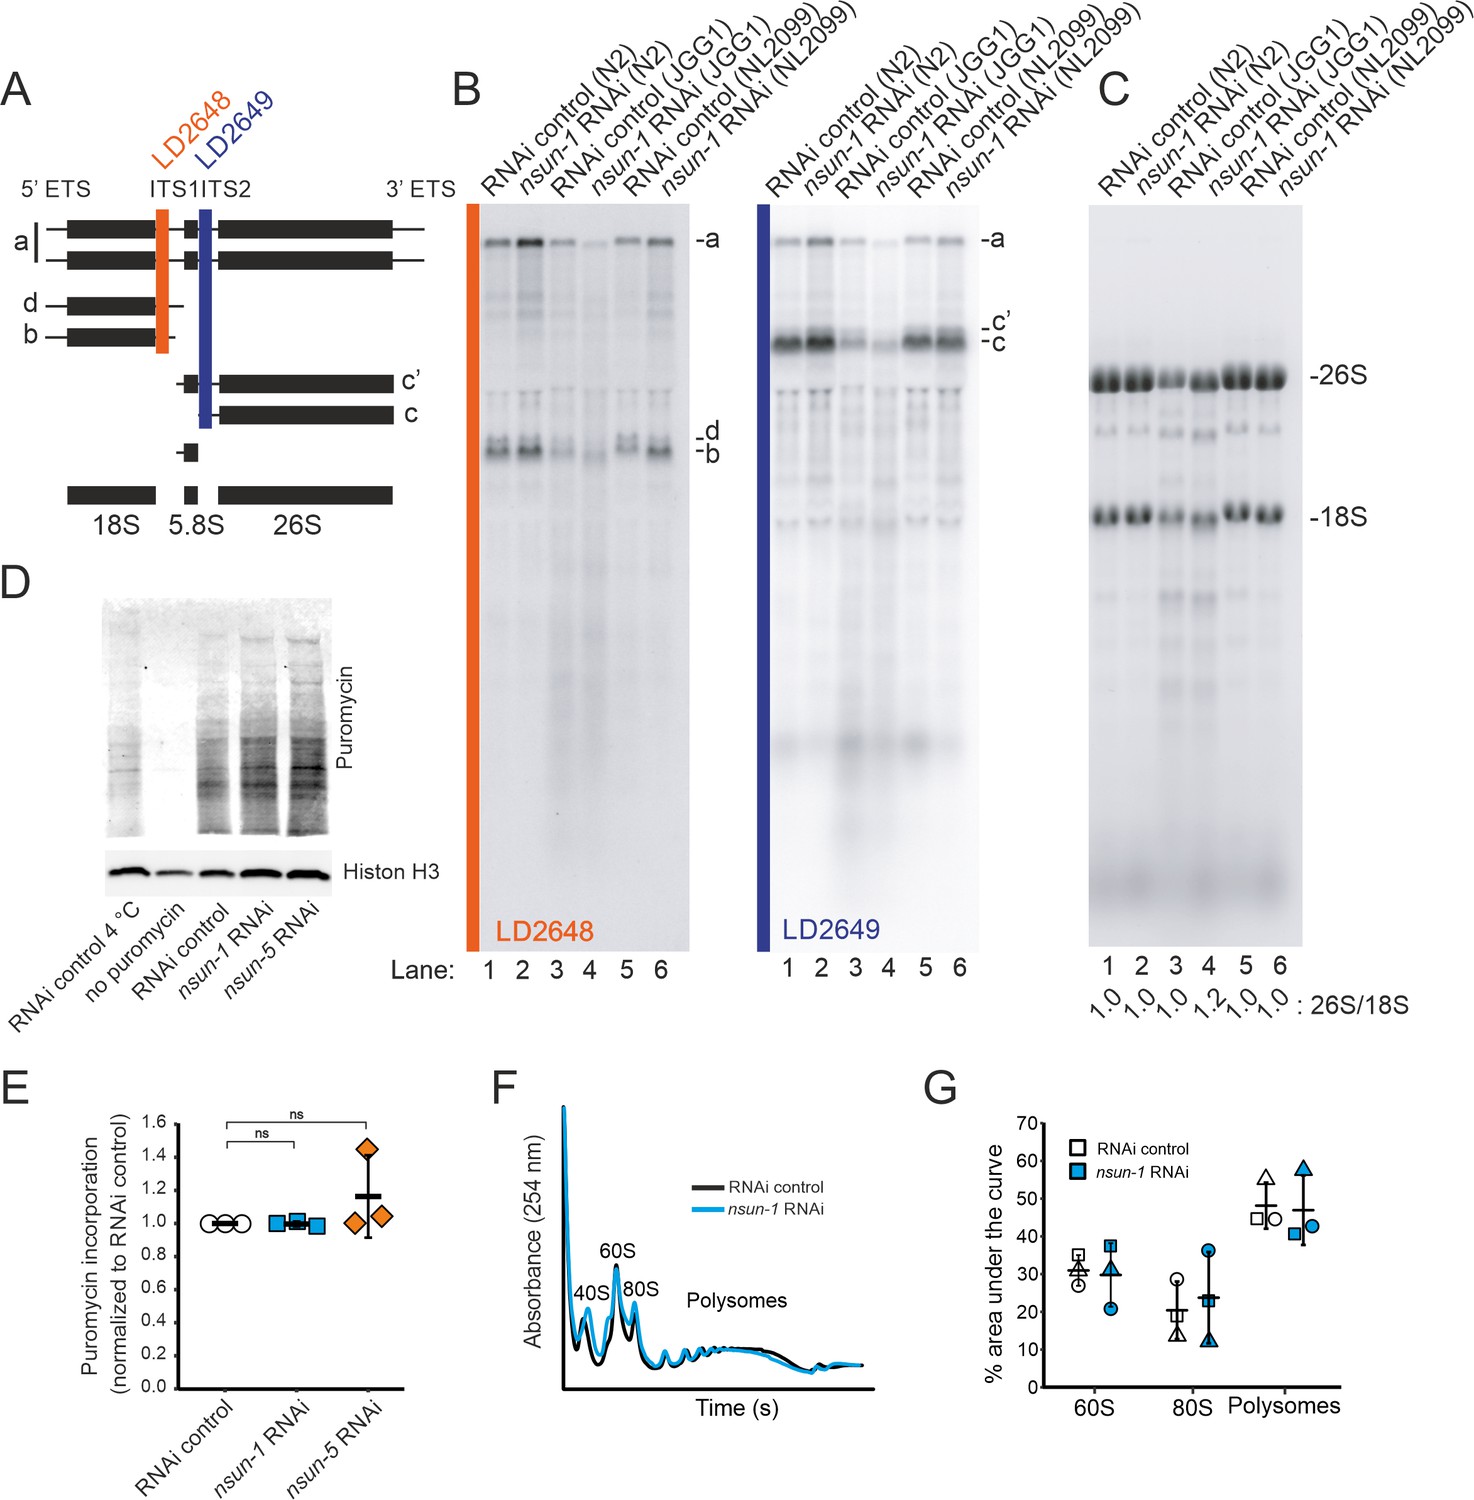
NSUN-1 and NSUN-5 are only partially required for rRNA processing and not for global translation.
(A) Schematics of pre-rRNA processing intermediates in C. elegans and probes (LD2648 and LD2649) used in pre-rRNA processing analysis (see panel B). (B) Pre-rRNA processing analysis. Total RNA extracted from the indicated strains were separated on denaturing agarose gels and processed for northern blotting. The probes (LD2648 and LD2649) used to detect the pre-rRNA intermediates a, b, c, c´, and d are indicated. (C) Steady-state levels of mature rRNAs (18S and 26S) analyzed by ethidium bromide staining and quantified by densitometry. The 26S/18S ratio is indicated. (D) Total protein synthesis of N2 animals treated with RNAi control, nsun-1 or nsun-5 RNAi. RNAi control treated worms at either 4°C or without puromycin exposure were used as negative controls. Protein synthesis was measured by puromycin exposure for 3 hr and western blot using a puromycin-specific antibody. The experiment was performed in three independent replicates. One representative replicate is shown. Histone H3 was used as loading control. (E) Quantification of western blots in D (three biological replicates, one-sample t-test against an expected value of 1, α = 0.05, not significant). (F–G) Polysome analysis indicating that global translation is not affected by nsun-1 depletion. Free small subunit (40S), large subunit (60S), monosome (80S) and polysome fractions were detected by UV254 monitoring. Representative profiles are shown. (G) Quantification of 60S, 80S, and polysome fractions of three independent experiments reveals no changes between nsun-1 knockdown and RNAi control.
-
Figure 5—source data 1
Raw data of puromycin western blot and polysome profiling quantification.
ZIP-compressed archive containing xlsx-files with raw data of the respective experiments.
- https://cdn.elifesciences.org/articles/56205/elife-56205-fig5-data1-v2.zip
Figure 5—figure supplement 1
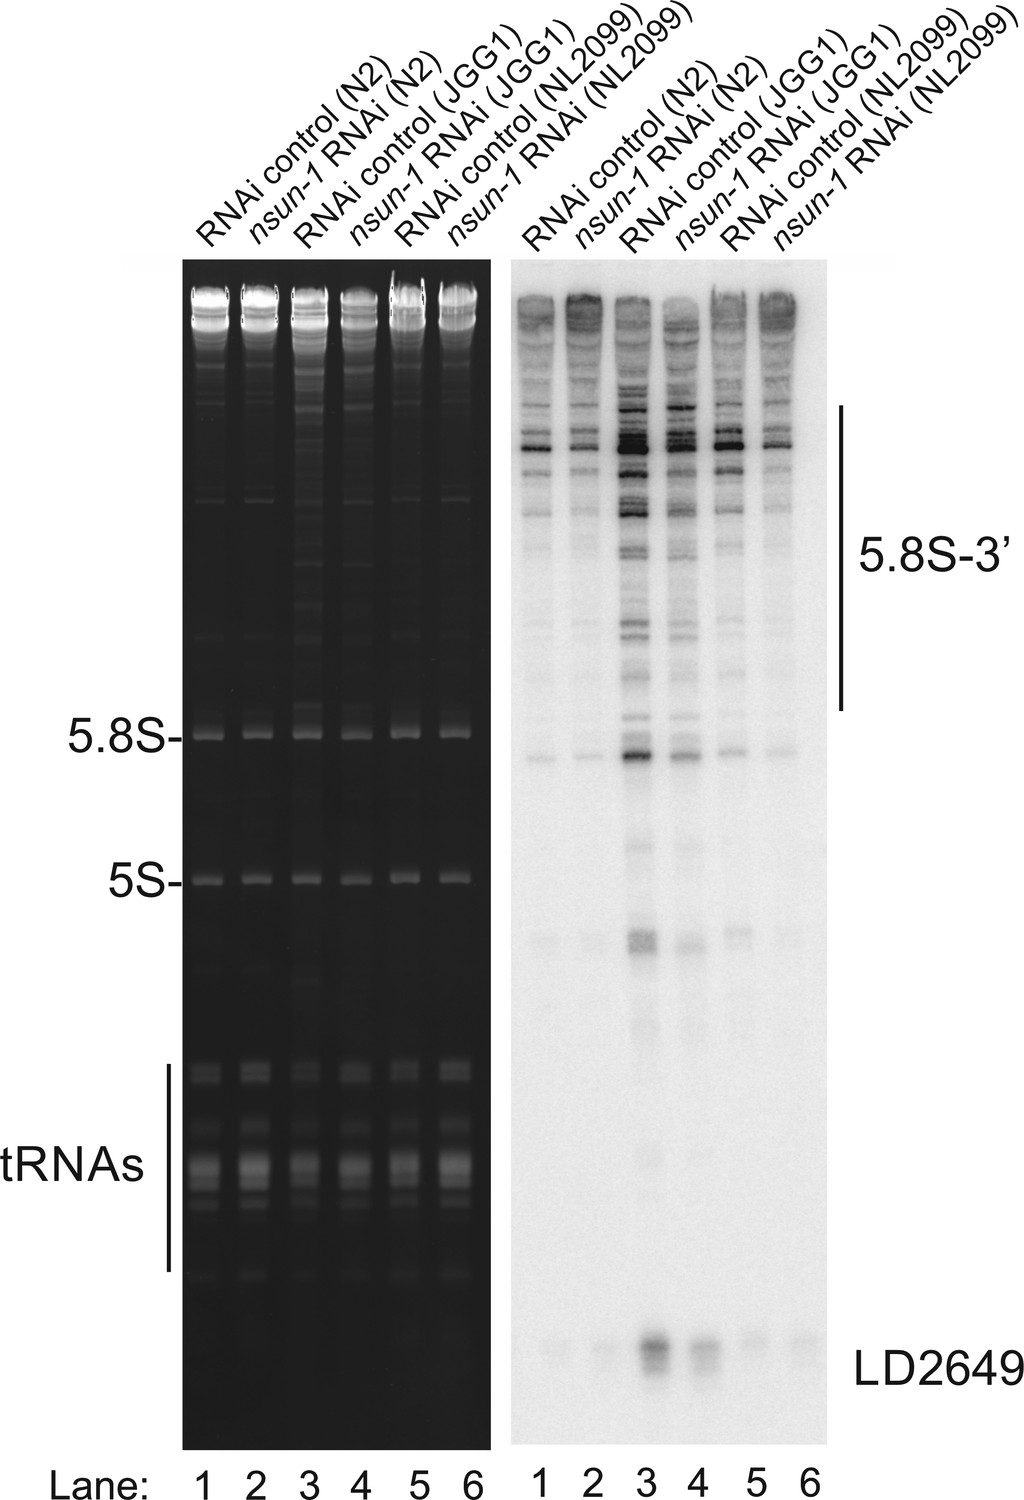
nsun-5 but not nsun-1 RNAi alters 5.8S rRNA maturation.
In the absence of nsun-5 (JGG1 strain, lane 3, and 4) the 3´-extended forms of 5.8S and short RNA degradation products accumulated. Upon co-depletion of nsun-1 (lane 4), such an accumulation is partially suppressed. When comparing the 5.8S and 5S, as well as tRNAs, no change can be observed between control and nsun-1 RNAi-treated animals in the three different worm strains (N2, JGG1, and NL2099).
Figure 6
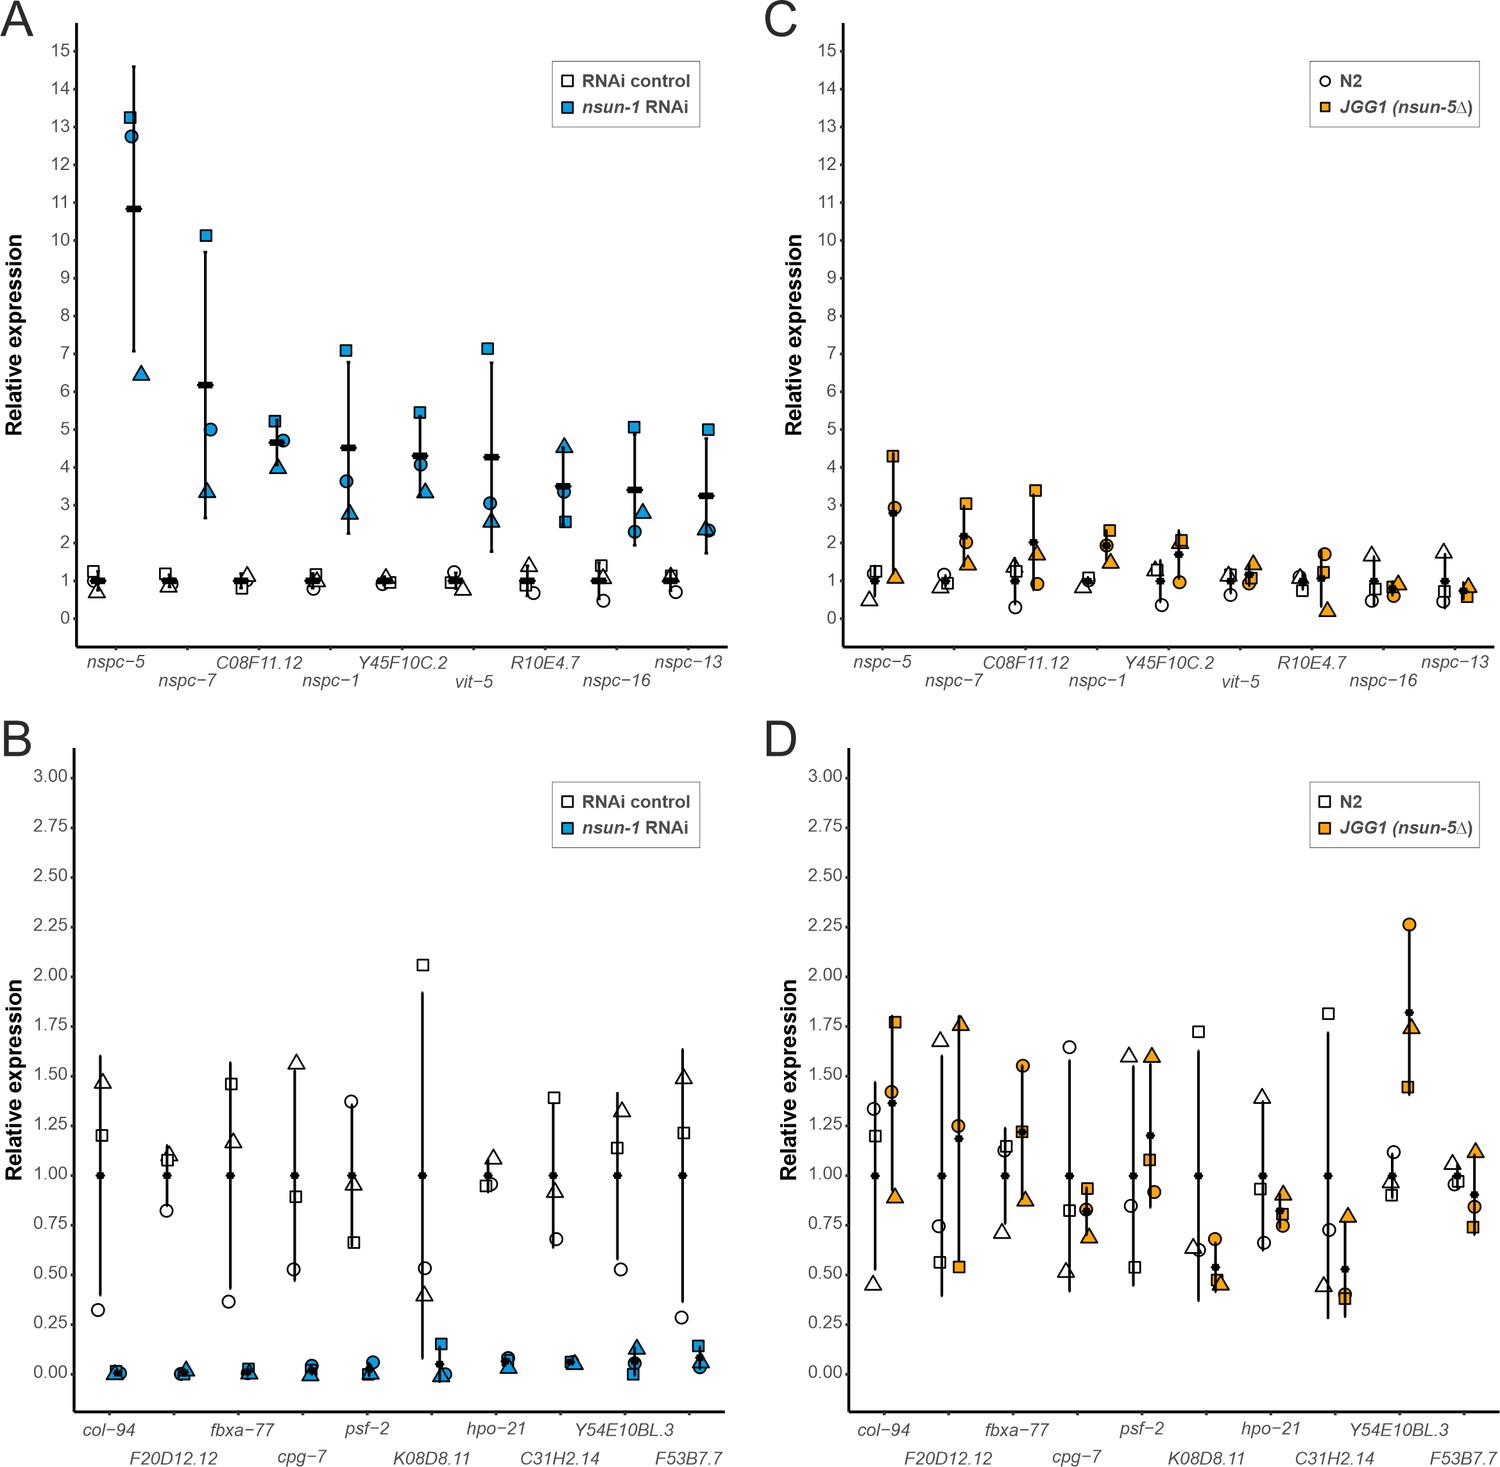
Depletion of nsun-1 modulates the translation of a distinct set of mRNAs which is not altered by nsun-5 knockout.
(A, B) mRNA abundance in polysomes of animals subjected to nsun-1 RNAi and RNAi control was analyzed by RNA-seq. The nine most up- (A) and 10 most down-regulated (B) protein-coding mRNAs were selected. All shown comparisons between control and nsun-1 RNAi were statistically significant (adjusted p-value cut-off at 0.05, FDR/Benjamini and Hochberg). (C, D) The same mRNAs were quantified in polysomes of wildtype (N2) and nsun-5 knockout (JGG-1) animals by RT-qPCR. None of the shown comparisons between N2 and JGG1 was statistically significant (adjusted p-value cut-off at 0.05, FDR/Benjamini and Hochberg). Values of each data point were normalized to the mean of the respective control (either RNAi control or N2). Three independent biological replicates were performed. Error bars represent standard deviation.
-
Figure 6—source data 1
Raw data of RNA-seq or RT-qPCR of selected polysomal mRNAs upon nsun-1 RNAi exposure or nsun-5 knockout.
xlsx-file with raw data of the respective experiments.
- https://cdn.elifesciences.org/articles/56205/elife-56205-fig6-data1-v2.xlsx
Figure 7 with 2 supplements
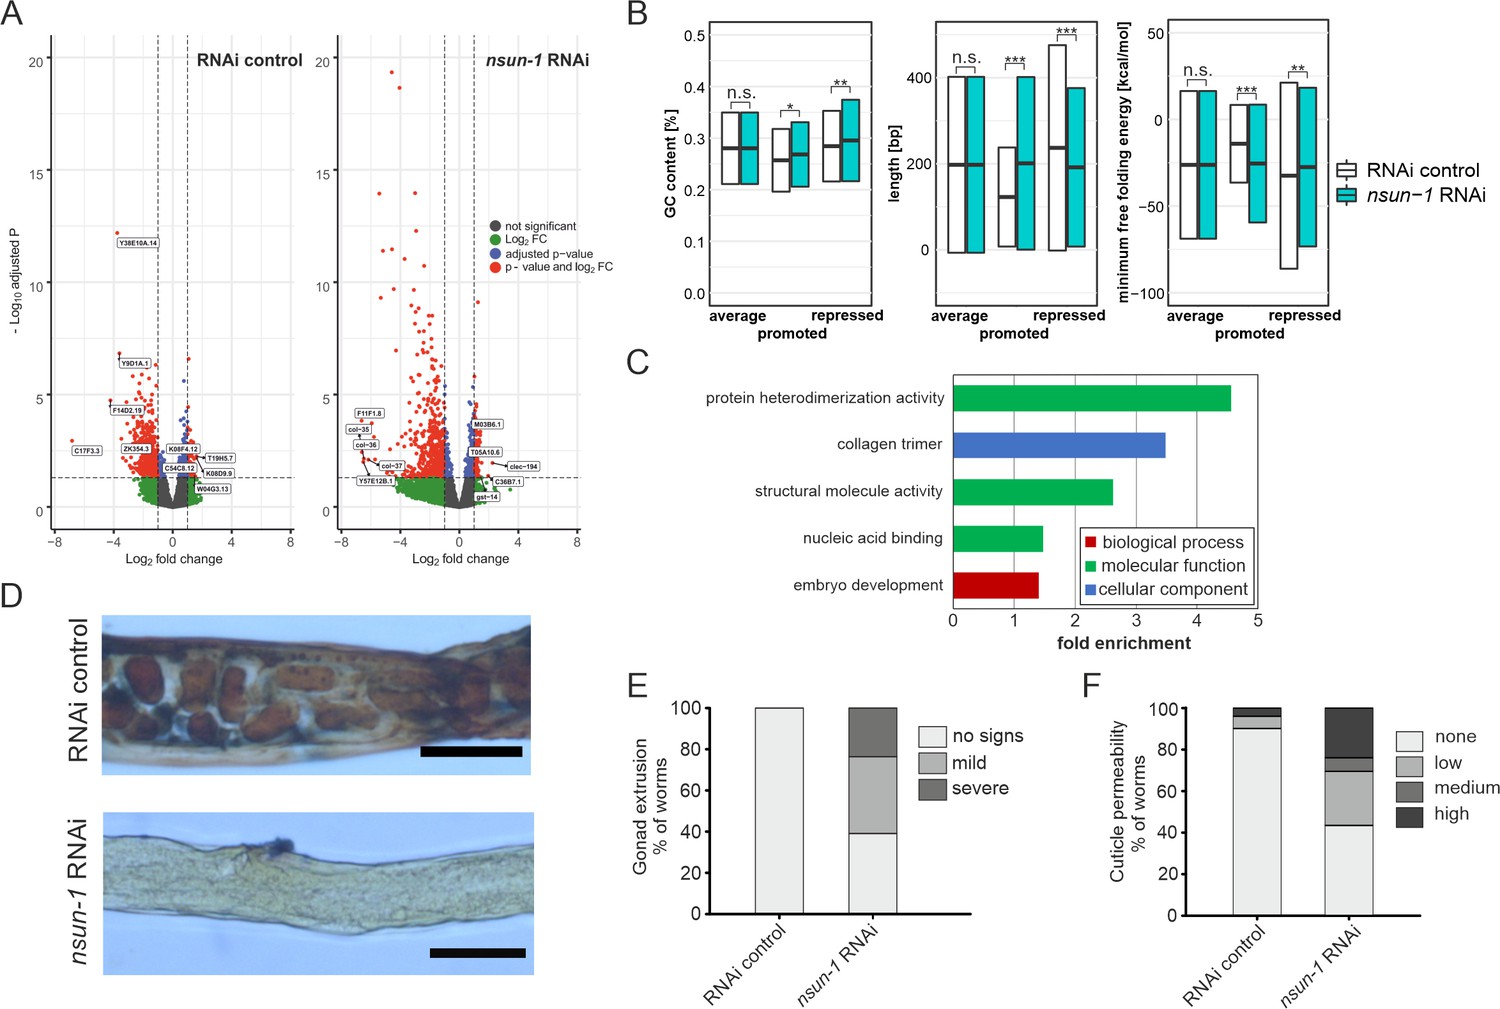
nsun-1 depletion modulates selective translation of collagens and induces gonad extrusion and loss of barrier function.
(A) Vulcano plots of selectively translated genes after RNAi control and nsun-1 RNAi exposure. Significantly regulated genes (adjusted p<0.05 and fold-change >2) between polysome fraction and total mRNAs are depicted in red, genes with a two-fold up- or down-regulation but an adjusted p-value (FDR/Benjamini and Hochberg) above 0.05 in green, genes with an adjusted p-value below 0.05 but less than two-fold-change in expression in blue, and not significantly regulated genes in grey. The top five up- or down-regulated genes based on their fold-change are indicated. (B) Characteristics of the 3’ UTRs of mRNAs with significantly promoted or repressed polysome enrichment (adjusted p<0.1, fold-change >2). GC-content (in %), length (in bp) and minimum free folding energy [kcal/mol] are shown. Boxes indicate mean ± SD (for GC-content and length) or mean ± SEM (for minimum free folding energy). Wilcoxon rank sum test, *p<0.05, **p<0.01, ***p<0.001. (C) Biological GO-terms enriched among genes with repressed translation (adjusted p<0.1, fold-change >2) upon nsun-1 depletion. Modified Fisher’s exact test, p<0.05. (D) Histological staining (Herovici) to assess collagen deposition. Worms exposed to control RNAi show presence of both young (blue) and mature (pink to brownish-red) collagen whereas animals subjected to nsun-1 RNAi display less collagen deposition. The cytoplasm is counterstained in yellow. Representative images of the region surrounding the gonad are shown. Two independent experiments with a minimum of 10 animals each were performed with similar outcome. Scale bar, 80 µm. (E) Quantification of gonad extrusion upon nsun-1 depletion compared to RNAi control. 8–9 day old adult animals were classified into three categories according to the severance of gonad extrusion (‘no signs’, ‘mild’, ‘severe’, see Figure 7—figure supplement 2A). The experiment was independently performed two times with similar outcome. One representative replicate is shown. n ≥ 50 animals per replicate. Modified Fisher’s exact test on the raw count values, p<0.001. (F) Quantification of cuticle barrier function upon nsun-1 depletion compared to RNAi control. Young adult animals were exposed to Hoechst 33342, which is membrane-permeable but cuticle-impermeable. Stained nuclei were counted exclusively in the tail region to exclude intestinal autofluorescence and classified into four categories accordingly (‘none’, ‘low’, ‘medium’, ‘high’, see Figure 7—figure supplement 2B). Three independent experiments were pooled. n(RNAi control)=51, n(nsun-1 RNAi)=46. Modified Fisher’s exact test on the raw count values, p<0.001.
-
Figure 7—source data 1
Raw data of brood size, expression during development and body length experiments.
ZIP-compressed archive containing xlsx-files with raw data of the respective experiments.
- https://cdn.elifesciences.org/articles/56205/elife-56205-fig7-data1-v2.zip
Figure 7—figure supplement 1
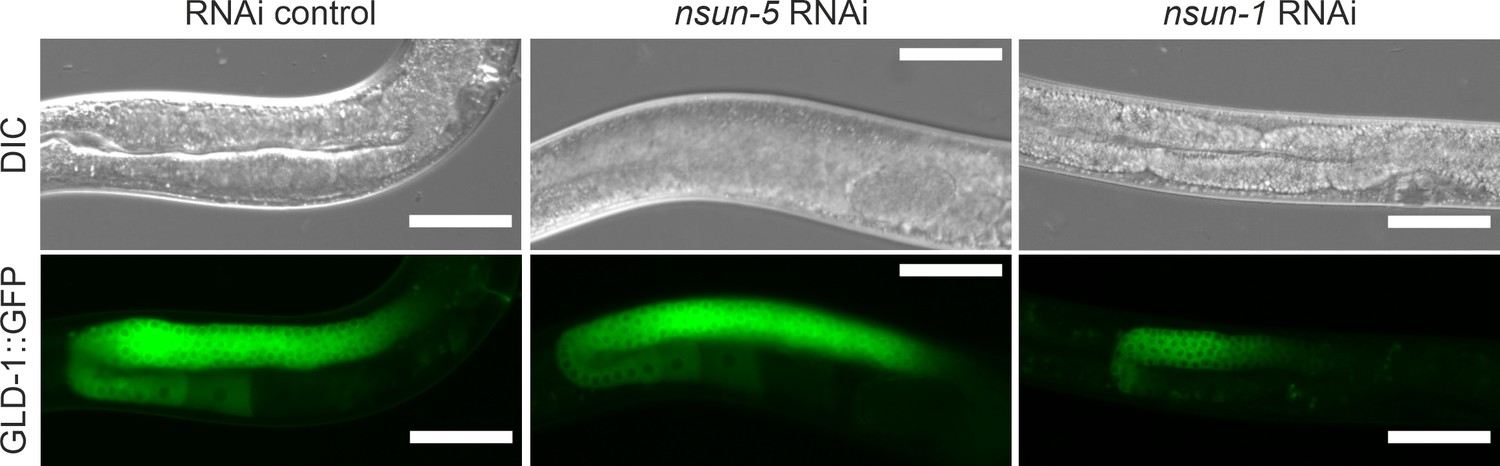
GLD-1 localization in the germline is altered by depletion of nsun-1.
Gonad specific expression of GLD-1::GFP::FLAG (JK4626 strain) was analyzed after egg-onset nsun-1 and nsun-5 knockdown. Scale bar represents 50 µm. GLD-1 expression was restricted to a small portion of the loop region in nsun-1 RNAi, but not in nsun-5 RNAi and RNAi control treated animals.
Figure 7—figure supplement 2
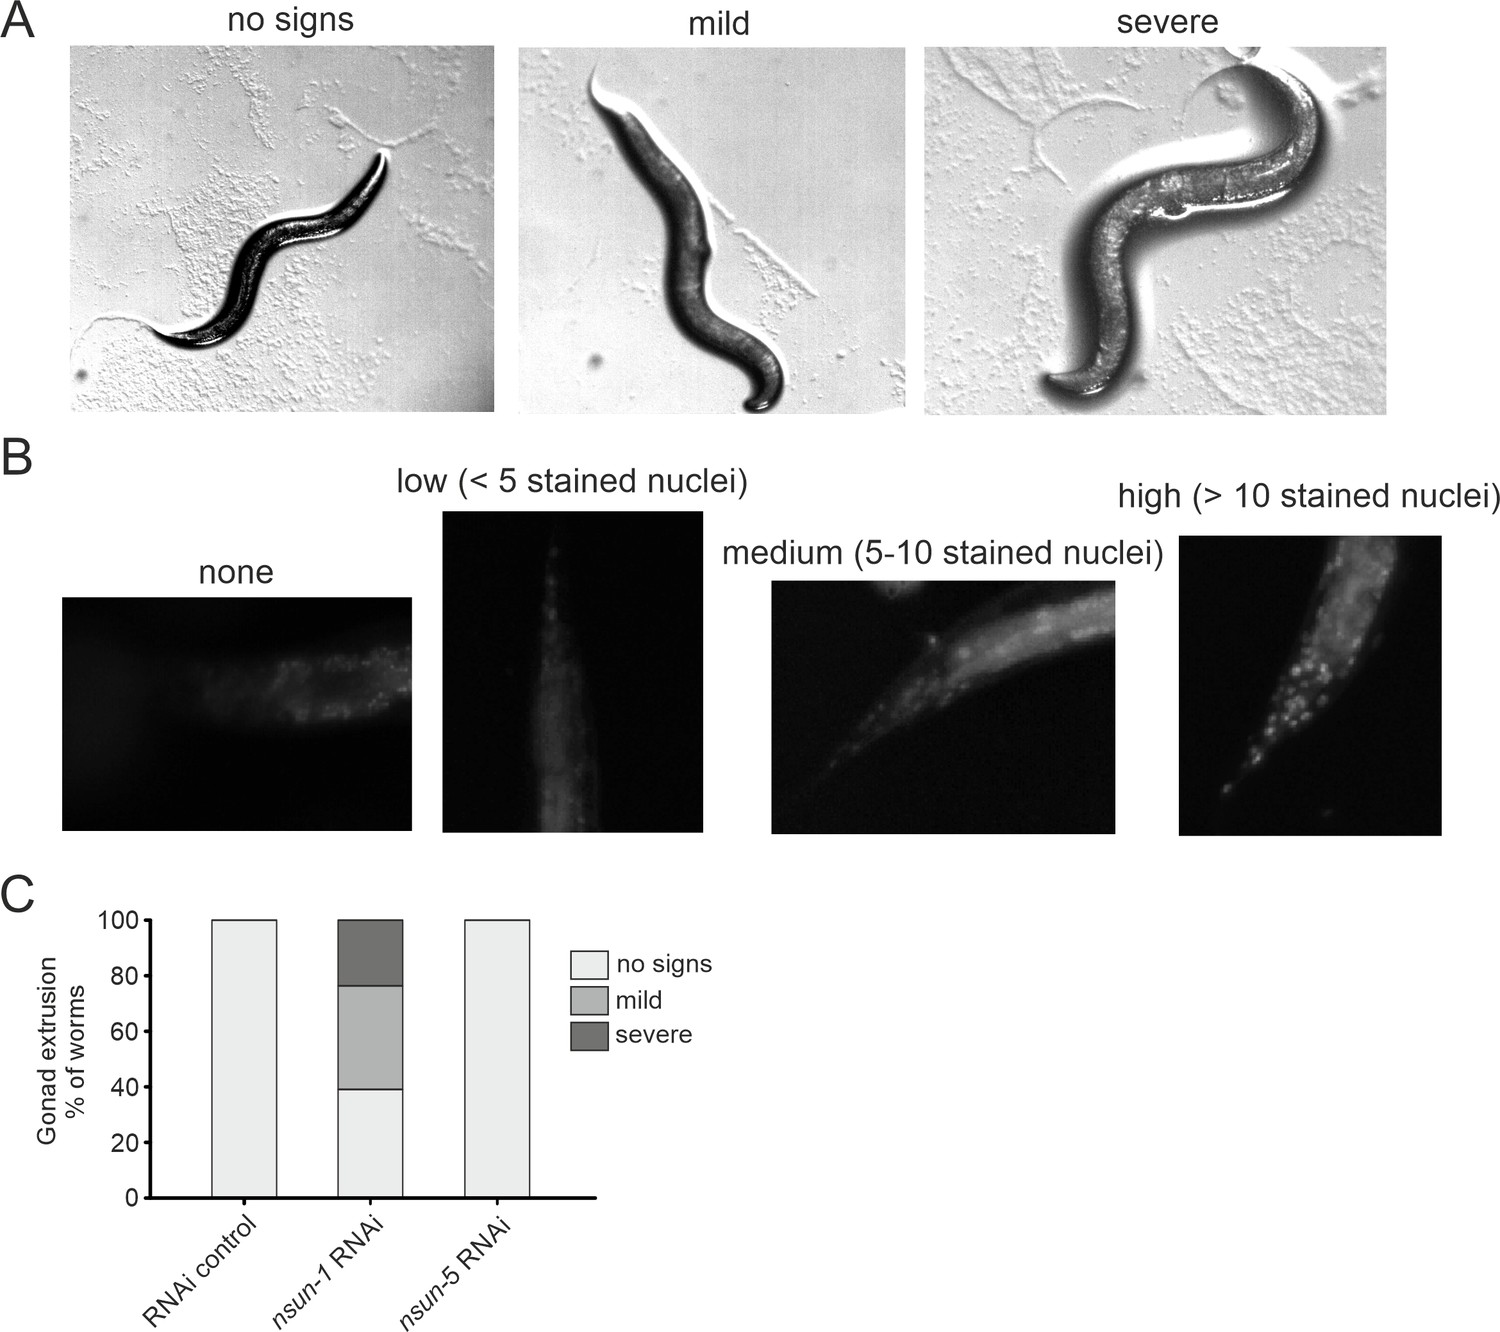
nsun-1 depletion affects gonad integrity and barrier function.
(A) Knockdown of nsun-1 increased the rate and severity of gonad extrusion. Mid-aged worms at day 8–9 of adulthood were classified into three categories according to the severance of gonad extrusion (‘no signs’, ‘mild’, ‘severe’, see arrowhead). Representative images of the categories are shown here. (B) Reduced levels of nsun-1 affected barrier function. Young adult animals were incubated in 1 µg/mL Hoechst 33342, which is membrane-permeable but cuticle-impermeable. Permeability was assessed by counting nuclear Hoechst staining in the tail region (see arrowhead). Young adult animals were classified into four categories (‘no staining’, ‘low (<5 stained nuclei)’, ‘medium (5–10 stained nuclei)’, ‘high (>10 stained nuclei)’). Representative images of the different categories are shown here. (C) Analysis of gonad extrusion including the results of nsun-5 RNAi. The experiment was independently performed two times with similar outcome. One representative replicate is shown. n ≥ 50 animals per replicate.
Tables
Table 1
Summary of individual lifespan and thermotolerance experiments.
| strain | treatment | replicate | mean survival | s.d. | dead/total | P-value |
|---|---|---|---|---|---|---|
| N2 | RNAi control | 1 | 20.8 days | ±0.9 | 47/75 | 0.579 |
| N2 | nsun-1 RNAi | 1 | 20.7 days | ±0.8 | 52/75 | |
| N2 | RNAi control | 2 | 18.9 days | ±0.6 | 75/90 | 0.694 |
| N2 | nsun-1 RNAi | 2 | 18.9 days | ±1.1 | 74/90 | |
| N2 | RNAi control | 3 | 20.7 days | ±0.3 | 87/90 | 0.474 |
| N2 | nsun-1 RNAi | 3 | 21.0 days | ±0.4 | 82/90 | |
| NL2550 | RNAi control | 1 | 16.5 days | ±0.4 | 66/90 | 0.009 |
| NL2550 | nsun-1 RNAi | 1 | 18.0 days | ±0.4 | 68/90 | |
| NL2550 | RNAi control | 2 | 18.6 days | ±0.3 | 83/90 | <0.001 |
| NL2550 | nsun-1 RNAi | 2 | 20.2 days | ±0.4 | 75/90 | |
| NL2098 | RNAi control | 1 | 16.7 days | ±0.3 | 80/90 | 0.289 |
| NL2098 | nsun-1 RNAi | 1 | 17.0 days | ±0.3 | 89/90 | |
| NL2098 | RNAi control | 2 | 19.2 days | ±0.3 | 87/90 | 0.068 |
| NL2098 | nsun-1 RNAi | 2 | 18.4 days | ±0.3 | 88/90 | |
| N2 | heat/RNAi control | pool | 8.6 hr | ±0.1 | 117/117 | control |
| N2 | heat/nsun-1 RNAi | pool | 12.5 hr | ±0.7 | 97/119 | <0.001 |
| N2 | heat/nsun-5 RNAi | pool | 9.7 hr | ±0.3 | 106/109 | <0.001 |
Table 2
Comparison of phenotypes after nsun-1 and nsun-5 depletion, n.d.: not determined.
| Phenotype | nsun-1 RNAi | nsun-5 RNAi |
|---|---|---|
| Lifespan | - Unaffected in whole adult treatment - Unaffected after germline-specific depletion - Increased by ~ 10% after soma-specific depletion | - Increased by ~ 17% in whole adult treatment (Schosserer et al., 2015) |
| Stress resistance (heat) in adults | Increased | Similarly increased |
| Locomotion at midlife | Increased | Similarly increased |
| Brood size (fecundity) | Reduced (2-fold) | Unaffected |
| Adult animal size | - Reduced by ~ 20% after soma-specific depletion and whole-body depletion - Unaffected after germline-specific depletion | Unaffected |
| Gonad morphology | - Impaired at meiotic to oocyte transition -Gonad extrusion (possibly caused by loss of cuticle integrity) - Unaffected after germline-specific depletion | Unaffected |
| Pre-rRNA processing | Unaffected | Affected |
| Collagen expression | Affected (translational remodeling) | n.d. |
| Cuticle permeability | increased | n.d. |
Key resources table
| Reagent type (species) or resource | Designation | Source or reference | Identifiers | Additional information |
|---|---|---|---|---|
| gene (Caenorhabditis elegans) | nsun-1 | WormBase | WBGene00021073 | Also known as: nol-1, nol-2 |
| gene (C. elegans) | nsun-5 | WormBase | WBGene00013151 | |
| strain, strain background (C. elegans) | N2 | CGC, University of Minnesota | RRID:WB-STRAIN:WBStrain00000001 | Genotype: wildtype |
| genetic reagent (C. elegans) | FX30263 | National Bioresource Project, Tokyo, Shohei Mitani | Genotype: nsun-1(tm6081) II/lin-42(tmls1246) II | |
| genetic reagent (C. elegans) | JGG1 | CGC, University of Minnesota | RRID:WB-STRAIN:WBStrain00022241 | Genotype: nsun-5(tm3898) II |
| genetic reagent (C. elegans) | SA115 | CGC, University of Minnesota | RRID:WB-STRAIN:WB Strain00033882 | Genotype: unc-119(ed3) III; tjIs1 [pie-1::GFP::rho-1 + unc-119(+)] |
| genetic reagent (C. elegans) | JJ1473 | CGC, University of Minnesota | RRID:WB-STRAIN:WBStrain00022491 | Genotype: unc-119(ed3) III; zuIs45 [nmy-2p::nmy-2::GFP + unc-119(+)] V |
| genetic reagent (C. elegans) | TP12 | CGC, University of Minnesota | RRID:WB-STRAIN:WBStrain00034928 | Genotype: kaIs12[col-19::GFP] |
| genetic reagent (C. elegans) | DCL569 | CGC, University of Minnesota | RRID:WB-STRAIN:WBStrain00005607 | Genotype: mkcSi13 [sun-1p::rde-1::sun-1 3'UTR + unc-119(+)] II |
| genetic reagent (C. elegans) | NL2098 | CGC, University of Minnesota | RRID:WB-STRAIN:WBStrain00028994 | Genotype: rrf-1(pk1417) I |
| genetic reagent (C. elegans) | NL2550 | CGC, University of Minnesota | RRID:WB-STRAIN:WBStrain00029002 | Genotype: ppw-1(pk2505) I |
| genetic reagent (C. elegans) | JK4626 | CGC, University of Minnesota | RRID:WB-STRAIN:WBStrain00022650 | Genotype: cku-80(ok861) unc-119(ed3) III; qIs170 [gld-1p::gld-1::GFP::FLAG + unc-119(+)] |
| antibody | Anti-puromycin antibody, mouse monoclonal | Millipore | Cat# MABE343, RRID:AB_2566826 | Western Blot: (1:10000) |
| antibody | Anti-Histone H3 antibody, rabbit polyclonal | Abcam | Cat# ab1791, RRID:AB_302613 | Western Blot: (1:4000) |
| antibody | Anti-Rabbit-IR-Dye 800, donkey polyclonal | LI-COR Biosciences | Cat# 926–32213, RRID:AB_621848 | Western Blot: (1:10000) |
| antibody | Anti-Mouse-IR-Dye 680RD, donkey polyclonal | LI-COR Biosciences | Cat# 926–68072, RRID:AB_10953628 | Western Blot: (1:10000) |
| recombinant DNA reagent | RNAi control (empty vector) | Addgene | RRID:Addgene_1654 | Vector: L4440 Host Strain: HT115 (DE3) |
| recombinant DNA reagent | RNAi clone (nsun-1) | Source Bioscience | Cat# CUUkp3301A161Q | Vector: L4440 Host Strain: HT115 (DE3) |
| recombinant DNA reagent | RNAi clone (nsun-5) | Schosserer et al., 2015 PMID:25635753 | Vector: L4440 Host Strain: HT115 (DE3) | |
| sequence-based reagent | PCR primers | This paper | See Supplementary file 1 | |
| sequence-based reagent | LD2648 (ITS1) | Bar et al., 2016 PMID:27457958 | Northern blot probe, sequence: CACTCAACTGACCGTGAAGCCAGTCG | |
| sequence-based reagent | LD2649 (ITS2) | Bar et al., 2016 PMID:27457958 | Northern blot probe, sequence: GGACAAGATCAGTATGCCGAGACGCG | |
| commercial assay or kit | Direct-zol RNA Miniprep | Zymo Research | Cat# R2051 | |
| commercial assay or kit | EZ RNA Methylation Kit | Zymo Research | Cat# R5001 | |
| commercial assay or kit | ExACT Genotyping Kit | BioCat | Cat# 2212–500-BL | |
| commercial assay or kit | High-Capacity cDNA Reverse Transcription Kit | Life Technologies | Cat# 4368814 | |
| commercial assay or kit | 5x HOT FIREPol EvaGreen qPCR Mix | Medibena | Cat# SB_08–24-GP | |
| chemical compound, drug | 5-Fluoro-2′-deoxyuridine (FUdR) | Sigma Aldrich | Cat# F0503-100MG | |
| chemical compound, drug | Puromycin | Invivogen | Cat# ant-pr-1 | |
| chemical compound, drug | TRIzol LS Reagent | Life Technologies | Cat# 10296028 | |
| software, algorithm | Image J | Image J | Fiji, RRID:SCR_002285 | Version 2.0.0-rc-65/1.51 w; Java 1.8.0_162 [64-bit] |
| software, algorithm | WormLab | MBF Bioscience | Version 4.1.1 | |
| software, algorithm | R | The R Foundation for Statistical Computing | Version 4.0.3 Script for RNA-seq analysis: Source code 1 | |
| software, algorithm | SigmaPlot | Systat Software Inc | Version 14 | |
| software, algorithm | Prism | GraphPad | Version 9.0.0 | |
| software, algorithm | Galaxy | Galaxy Project | RRID:SCR_006281 | https://usegalaxy.org/ Version numbers of individual tools are indicated in Materials and methods |
Additional files
-
Source data 1
Analysis of all total and polysomal mRNAs in RNAi control vs.nsun-1.
RNAi xlsx-file containing RNA-seq analysis results for the comparison between RNAi control and nsun-1 RNAi of total mRNAs (sheet 1) and polysomal mRNAs (sheet 2).
- https://cdn.elifesciences.org/articles/56205/elife-56205-data1-v2.xlsx
-
Source data 2
RNA-seq analysis of transcriptome vs.translatome.
xlsx-file containing RNA-seq analysis results for the comparison between total mRNAs and polysomal mRNAs for control RNAi (sheet 1) and nsun-1 RNAi (sheet 2).
- https://cdn.elifesciences.org/articles/56205/elife-56205-data2-v2.xlsx
-
Source data 3
Enrichment analysis of 3’ UTR motifs recognized by RNA-binding proteins.
xlsx-file containing the results of the enrichment analysis of 3’ UTR motifs recognized by RNA-binding proteins. Differentially enriched motifs are indicated in green.
- https://cdn.elifesciences.org/articles/56205/elife-56205-data3-v2.xlsx
-
Source data 4
Gene Ontology enrichment analysis.
xlsx-file containing the results of the Gene Ontology (GO) enrichment analysis. Individual sheets represent enriched GO-terms (BP: biological process, MF: molecular function, CC: cellular component) in up- or downregulated genes in RNAi control or nsun-1 RNAi-treated animals.
- https://cdn.elifesciences.org/articles/56205/elife-56205-data4-v2.xlsx
-
Source code 1
R-code for RNA-seq analysis.
- https://cdn.elifesciences.org/articles/56205/elife-56205-code1-v2.zip
-
Supplementary file 1
List of primers used in this study.
- https://cdn.elifesciences.org/articles/56205/elife-56205-supp1-v2.xlsx
-
Transparent reporting form
- https://cdn.elifesciences.org/articles/56205/elife-56205-transrepform-v2.docx
Download links
A two-part list of links to download the article, or parts of the article, in various formats.
Downloads (link to download the article as PDF)
Open citations (links to open the citations from this article in various online reference manager services)
Cite this article (links to download the citations from this article in formats compatible with various reference manager tools)
The ribosomal RNA m5C methyltransferase NSUN-1 modulates healthspan and oogenesis in Caenorhabditis elegans
eLife 9:e56205.
https://doi.org/10.7554/eLife.56205


