Learning-related population dynamics in the auditory thalamus
- Department of Medical Neurobiology, Institute for Medical Research Israel Canada, Faculty of Medicine, The Hebrew University, Israel
- The Edmond and Lily Safra Center for Brain Sciences, The Hebrew University of Jerusalem, Israel
- Department of Neurobiology, The Hebrew University of Jerusalem, Israel
Figures
Figure 1 with 2 supplements
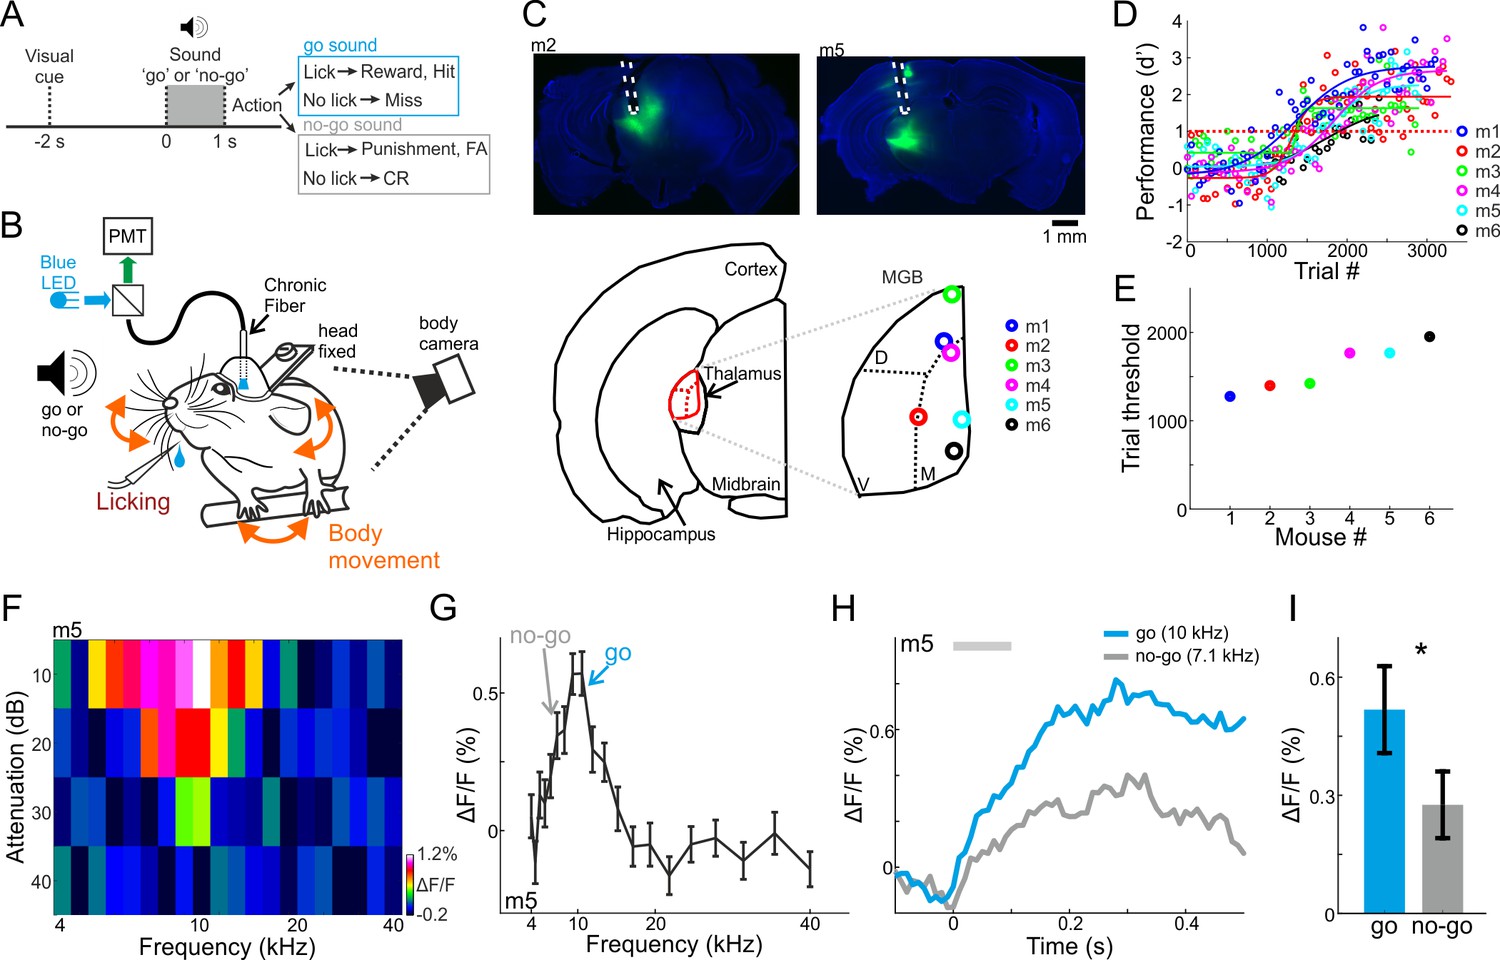
Behavioral paradigm, performance, and frequency tuning.
(A) Trial structure of a go/no-go auditory discrimination task and possible trial outcomes. (B) Behavioral setup for head fixed behaving mice along with simultaneous fiber photometry in the medial geniculate body (MGB). (C) Top: Fluorescent images of two coronal slices from two different mice, showing GCaMP6f (green) in the MGB along with the fiber track highlighted in white. DAPI staining in blue. Bottom: Localization of the fiber tip in the MGB for all six mice. (D) Behavioral learning curves for all mice (n = 6) depicting the performance (d’) as a function of trial number. Each learning curve was fitted with a sigmoid function. Dashed red line indicates the performance threshold (d’=1). (E) Learning threshold (the trial number where the learning curve crossed the performance threshold) for all mice. (F) A frequency response area plot (attenuation versus frequency) from one example recording of one example mouse. (G) Frequency tuning curve for the same example mouse. The frequencies used as go and no-go are marked by arrows. (H) Average responses to the go (blue) and no-go (gray) sounds. (I) Average evoked response (calculated from the 100 ms after stimulus onset; gray bar in ‘H’) to the go and no-go sounds from all mice. Error bars are s.e.m across mice. *p<0.05. Wilcoxon sign rank test.
Figure 1—figure supplement 1
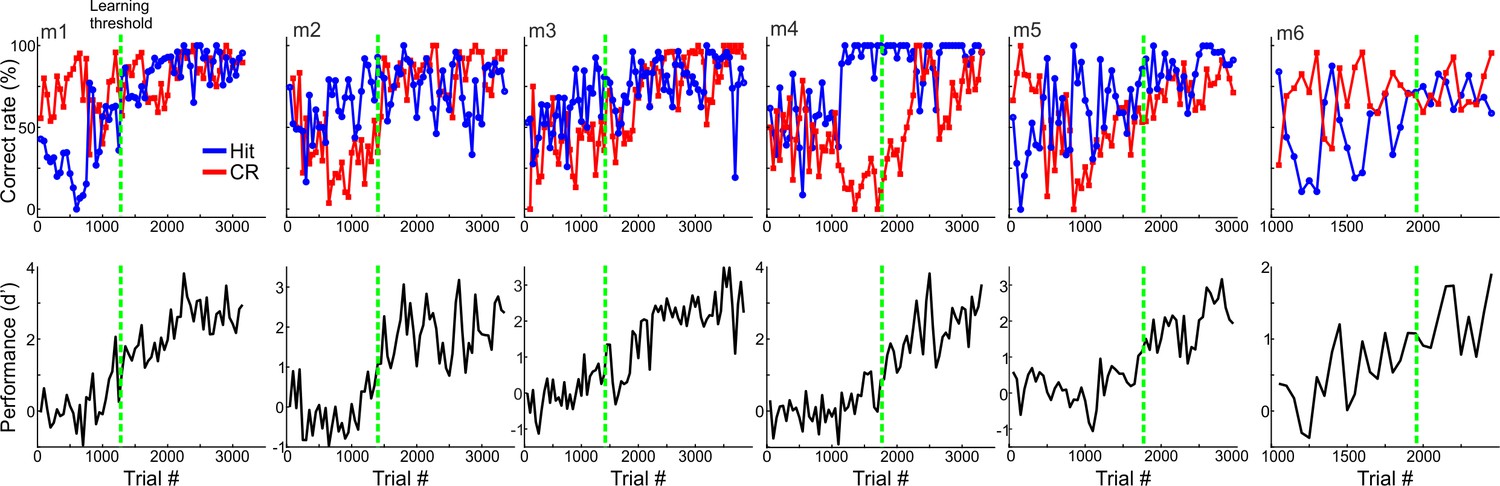
Behavioral performance and learning curves.
Behavioral performance for all six mice, plotting the time course of Hit and CR rates in percent (top) and d’ (bottom) as a function of trial number. The learning threshold when mice reached d’=1 is indicated by vertical dashed green lines.
Figure 1—figure supplement 2
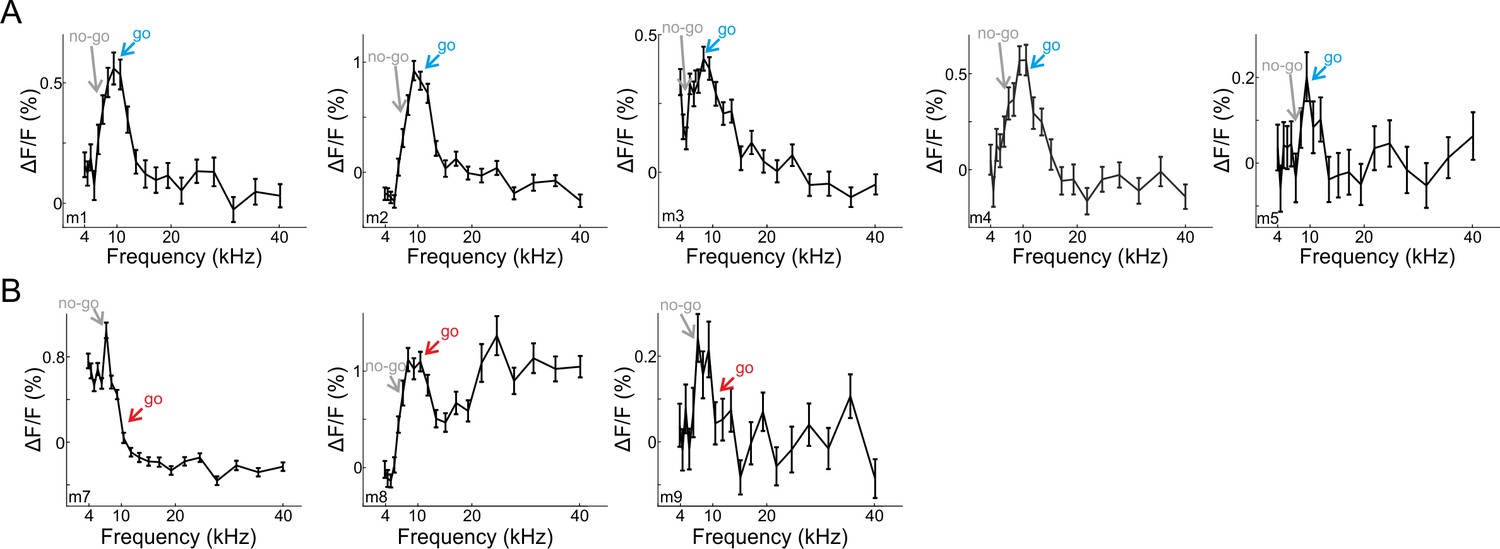
Frequency tuning for each mouse.
(A) Frequency tuning curve tuned for the go frequency. The frequencies used as go, and no-go are marked. Mouse six did not have a frequency curve. (B) Frequency tuning curves for the three mice that are tuned away from the go frequency.
Figure 2 with 1 supplement
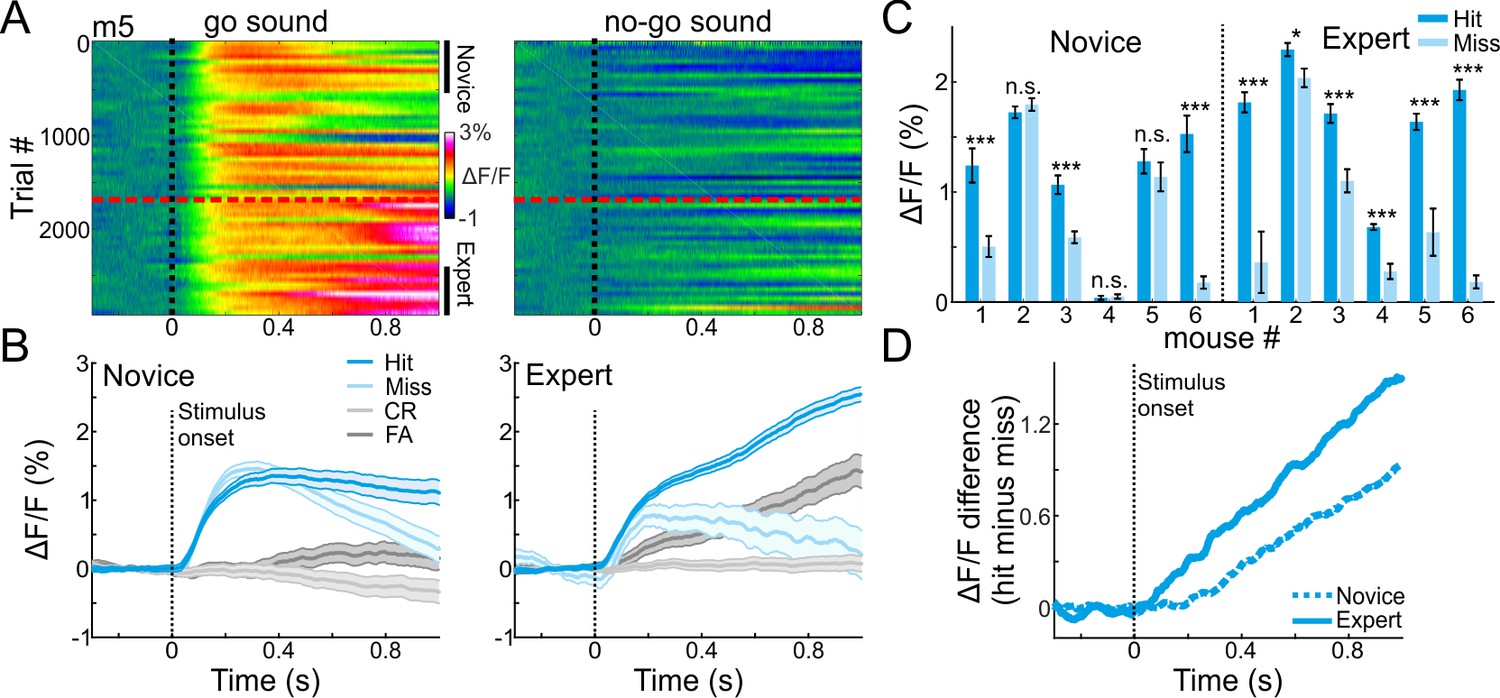
MGB encodes choice in expert mice.
(A) 2-dimensional plots of the calcium responses in MGB during the trial (x-axis) and across learning (y-axis; 50 trial bins) for one example mouse divided into go (left) and no-go (right) sounds. Dashed black line indicates stimulus onset (1 s duration) and dashed red line indicates the learning threshold. (B) Calcium responses when the mouse was novice (left) and expert (right). Traces are shown separately for different trial types (hit, miss, CR and FA trials; same data as in ‘A’). Shaded error bars are s.e.m across trials. (C) Mean calcium response during stimulus presentation per mouse in hit and miss trials when mice were novice (left) and expert (right). Error bars are s.e.m across trials. (D) Choice responses (defined as the response difference between hit and miss trials) during the trial, averaged across all mice when they were novice (dashed line) and expert (solid line). *p<0.05. ***p<0.001. n.s. – not significant. Wilcoxon rank sum test.
Figure 2—figure supplement 1
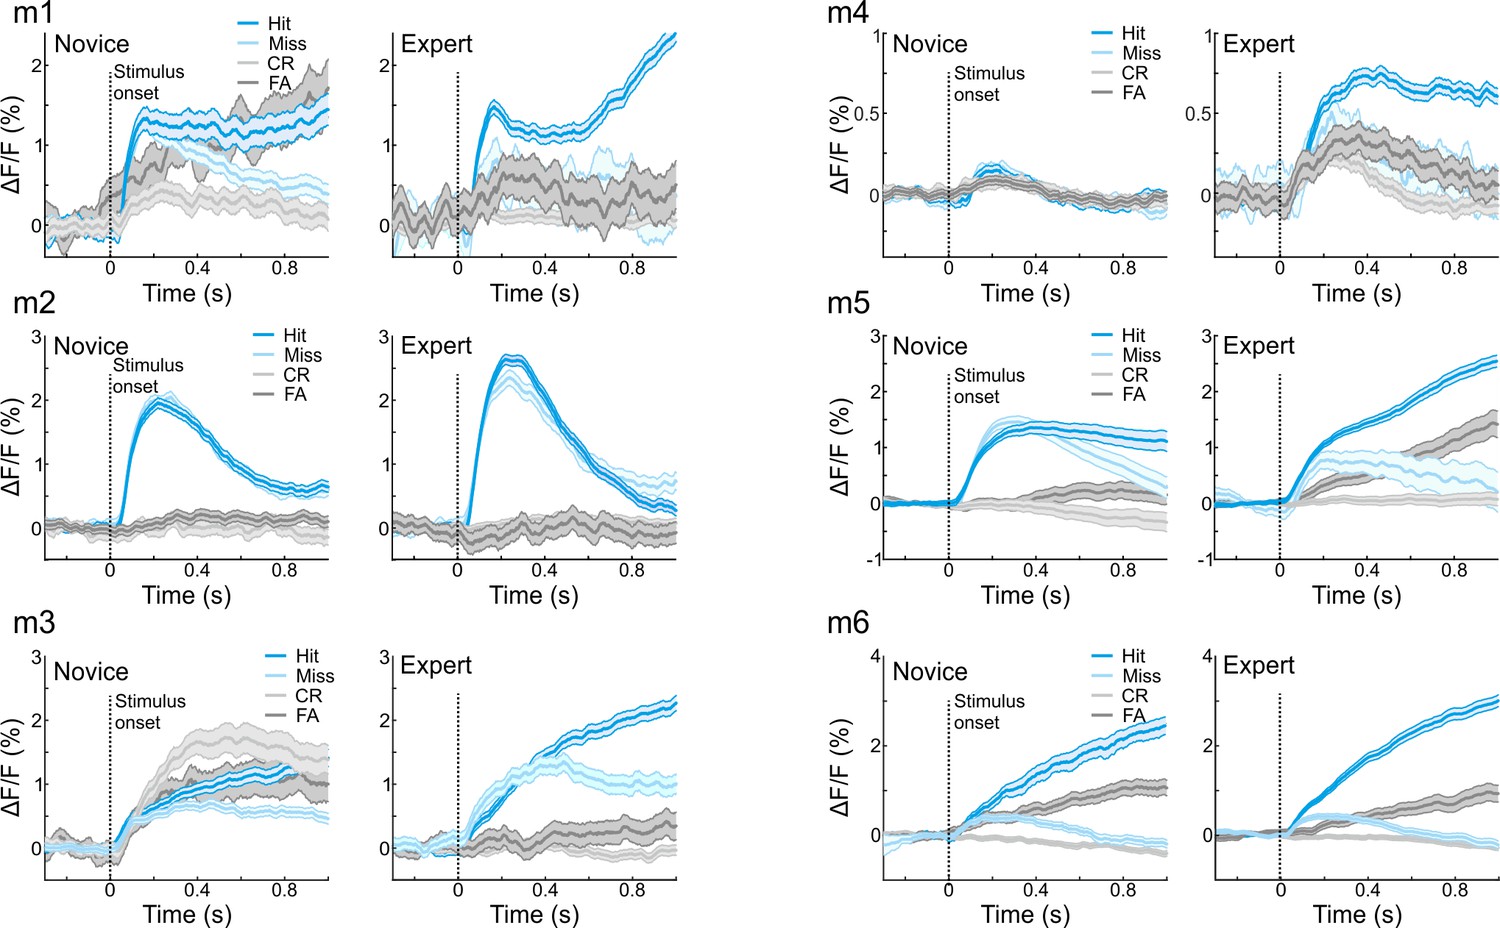
Calcium responses in different trial types for all mice.
MGB responses in each mouse for different trial types (hit, miss, CR and FA trials) when mice were novice (left) and experts (right). Shaded error bars are s.e.m across trials.
Figure 3 with 2 supplements
MGB discriminates early between stimuli and late between choices.
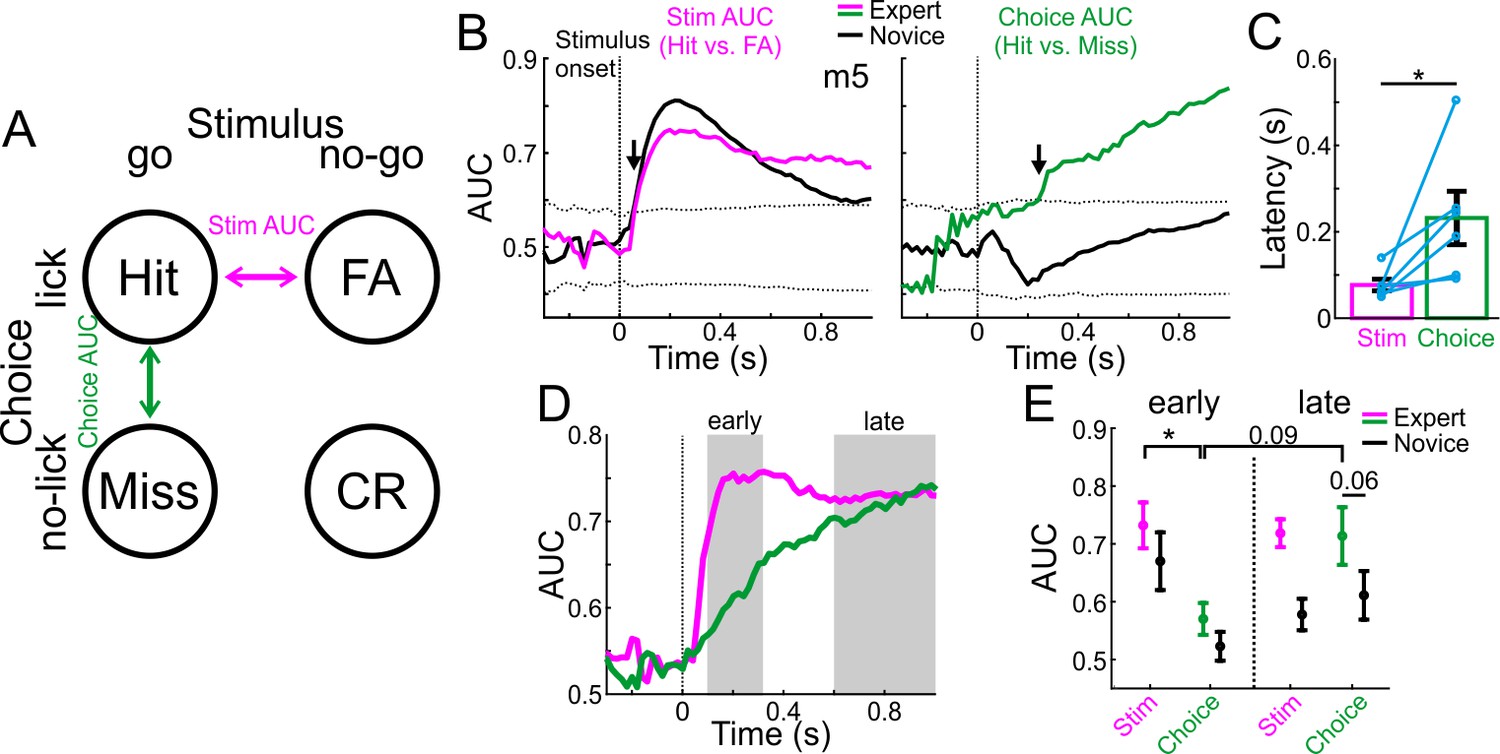
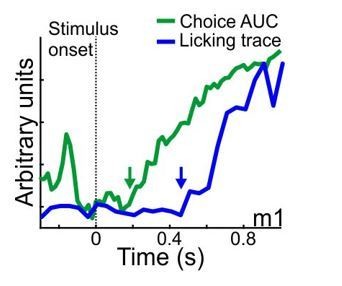
(A) Schematic of the two single trial discrimination measures: hit vs. FA (magenta; Stim AUC) or hit vs. miss (green; Choice AUC). (B) Stim and Choice AUCs during the trial for one example mouse during novice (black lines) and expert (colored lines). Dashed black lines display the mean ±3 s.t.d of AUC from trial shuffled data. Arrows indicate the latency of the AUC measure (i.e. the first time point the signal exceeded the shuffled data). (C) Latency of discrimination for the Stim and Choice AUCs for all mice (averaged and marked individually). Error bars are s.e.m across mice (n=6). (D) Stim and Choice AUCs averaged across all expert mice. Early and late times are marked in gray. (E) The two AUC measures averaged during early (left) and late (right) times when mice were novice (black lines) and expert (colored). Error bars are s.e.m across mice. *p<0.05. Wilcoxon signed-rank test.
Figure 3—figure supplement 1
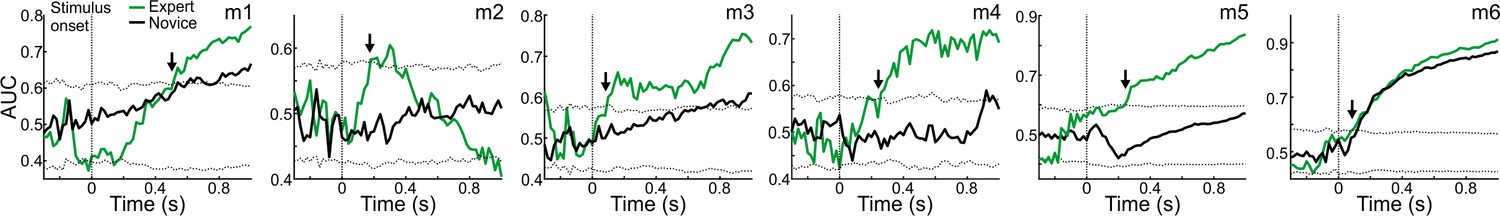
Choice-AUC responses for all mice.
Choice AUCs during the trial for all mice during novice (black lines) and expert (green lines; Similar to Figure 3B, right panel). Dashed black lines display the mean ±3 s.t.d of AUC for trial shuffled data. Arrows indicate the latency of the c (i.e. the first time frame exceeding the shuffled data).
Figure 3—figure supplement 2
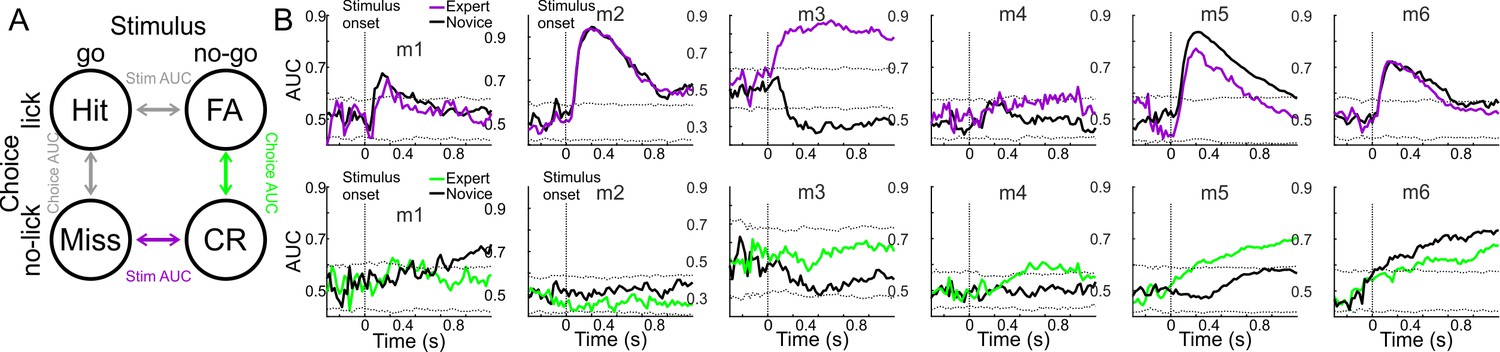
Stim-AUC and Choice-AUC based on other trial type pairs.
(A) Schematic of alternative single trial discrimination measures using different trial types: Miss vs. CR (purple; Stim AUC) or FA vs. CR (light green; Choice AUC). Stim-AUCs (top) and choice AUCs (bottom) during the trial for all mice during novice (black lines) and expert (colored lines; purple for stim-AUC; Light green for choice-AUC). Dashed black lines display the mean ±3 s.t.d of AUC for trial shuffled data.
Figure 4 with 1 supplement

MGB changes correspond with gaining expertise.
(A) MGB responses (averaged during late times, 0.6–1 s after stimulus onset; gray bars in B) as a function of learning in two example mice. Each MGB response curve was fitted with a sigmoid function (black lines). The learning thresholds are marked with a gray line. (B) Correlation coefficient as a function of time between the MGB response curve and the learning curve of the two example mice shown in ‘A’. Positive values indicate that MGB responses change in a similar way to the behavioral performance of the mouse. (C) Same as B, but averaged across all six mice. Error bars are s.e.m across mice. (D) Normalized fits of the MGB response curve for all mice. Dashed red line indicates threshold. (E) Maximal change in MBG responses (i.e. the trial number in which the MGB fit crossed 0.5, dots) superimposed on the learning thresholds (gray crosses).
Figure 4—figure supplement 1
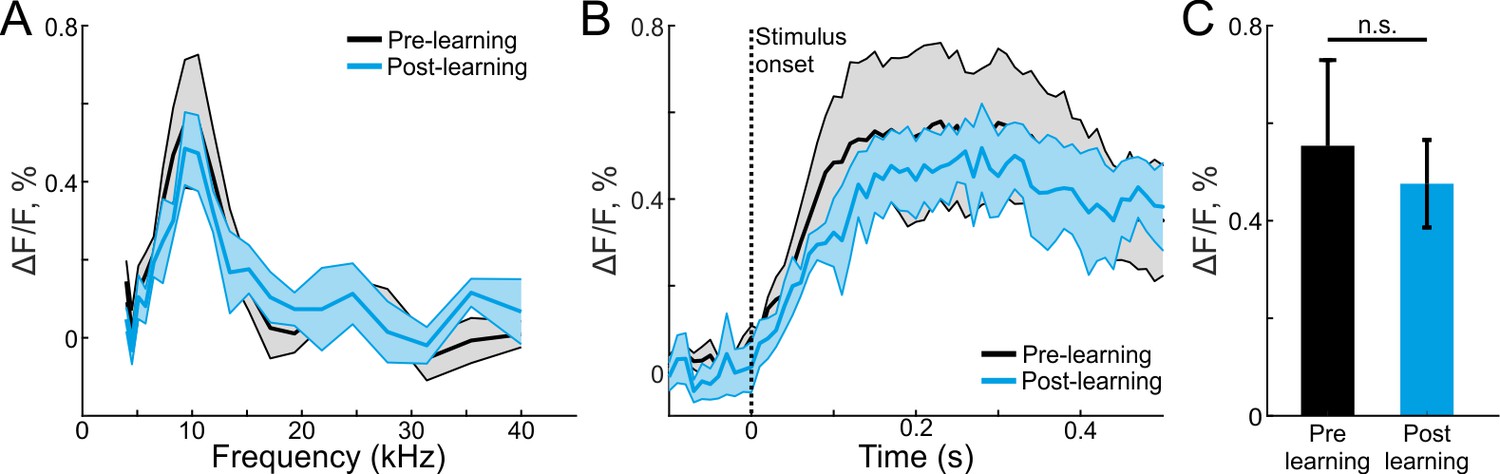
Frequency tuning is similar before and after learning.
(A) Frequency tuning curves (obtained during awake passive listening) averaged across all mice before (black trace) and after (blue trace) learning. (B) Average responses to the go frequency before (blue trace) and after (black trace) learning. (C) Average evoked response (calculated from the 100–300 ms after stimulus onset) to the go frequency before (blue trace) and after (black trace) learning. Error bars are s.e.m across mice (n = 6). n.s. – not significant. Wilcoxon sign rank test.
Figure 5 with 2 supplements
Body movements affect MGB responses.
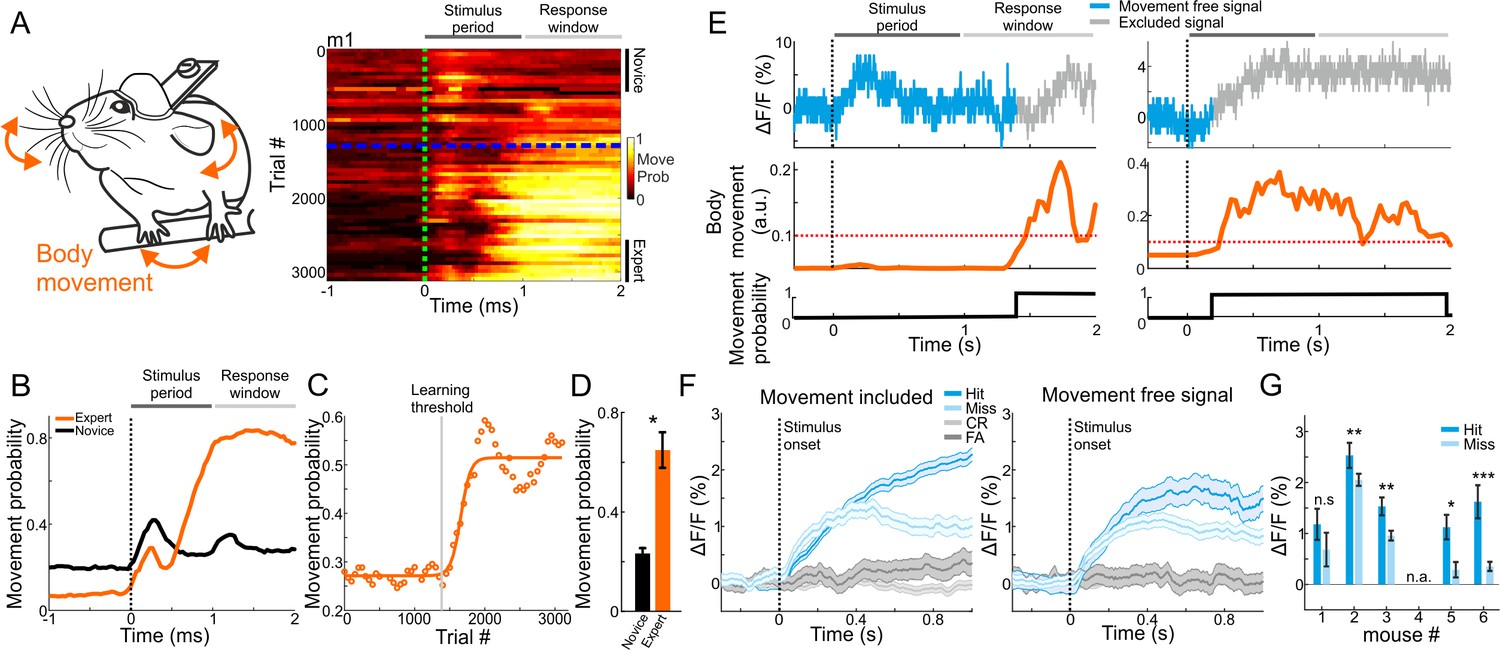
(A) Left: schematic illustration of mouse body movements during the task. Right: A 2-dimensional plot of movement probability during go trials within the trial (x-axis) and across learning (y-axis; 50 trial bins) for an example mouse. Dashed green line indicates stimulus onset (1 s duration) and dashed blue line indicates learning threshold. Color scale bar indicates min/max of movement probability. (B) Movement probability during the trial for the example mouse in A when it was novice (black) and expert (orange). (C) Movement probability (averaged during late times; 0.6–1 s after stimulus onset; go trials) across learning fitted with a sigmoid function. Same data as in ‘B’. (D) Movement probability during late times for novice and expert averaged across all six mice. Error bars are s.e.m across mice. *p<0.05. Signed-rank test. (E) Single trial traces of MGB calcium response (top), body movement (middle) and a binary movement vector (bottom; thresholding the body movement, dashed red line; Materials and methods). To exclude effects of body movements, MGB responses were truncated just before the movement onset on a trial-by-trial basis (gray traces in each trial). (F) MGB calcium responses for different trial types when including (left) and excluding (right) body movements. Data is from one example mouse (same as Figure 2B). Error bars are s.e.m across trials. (G) Mean MGB responses (averaged during stimulus presentation) for movement-free hit and miss trials per mouse. Data from expert mice. Error bars are s.e.m across trials. *p<0.05. **p<0.01. ***p<0.001. n.s. – not significant. n.a. – not available. Wilcoxon rank sum test.
Figure 5—figure supplement 1
Movement-free MGB choice responses along learning.
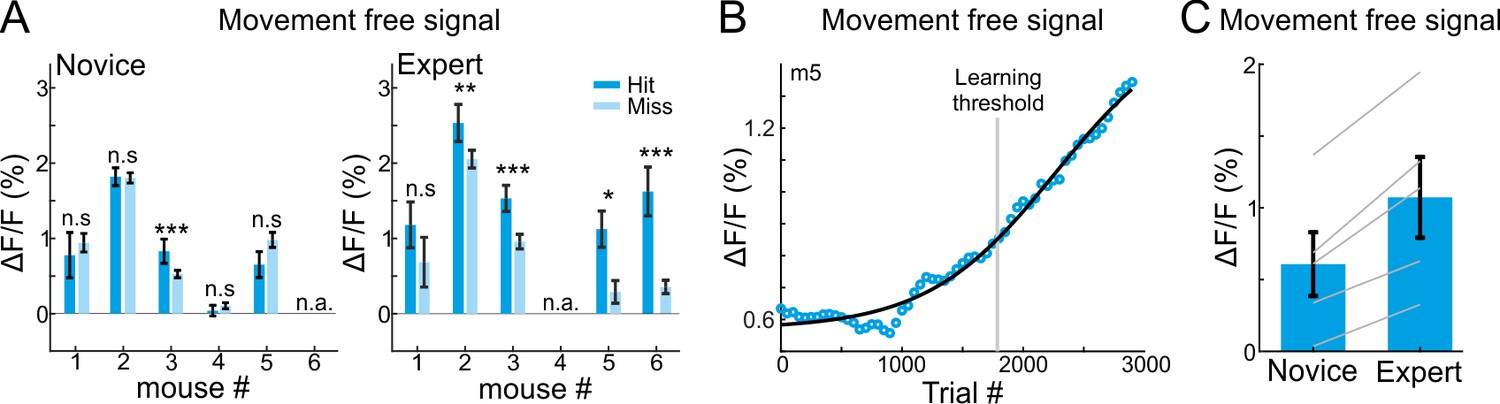
(A) Mean MGB responses (averaged during stimulus presentation) for movement-free hit and miss trials per mouse during the novice (left) and expert (right) cases (similar to Figure 2C). Error bars are s.e.m across trials. *p<0.05. **p<0.01. ***p<0.001. n.s. – not significant. Wilcoxon rank sum test. (B) MGB response curve for movement-free signals in go trials (averaged during late times, 0.6–1 s after stimulus onset; Similar to Figure 4A) as a function of learning in one example mouse. The data was fitted with a sigmoid function (black line). The learning thresholds is marked with a gray line. (C) Mean MGB responses for movement-free signals in go trials (averaged during late times, 0.2–0.7 s after stimulus onset due to a low number of movement free trails at late times) in novice and expert mice, averaged across all mice (n = 5). Error bars are s.e.m across mice. Gray lines indicate individual mice.
Figure 5—figure supplement 2
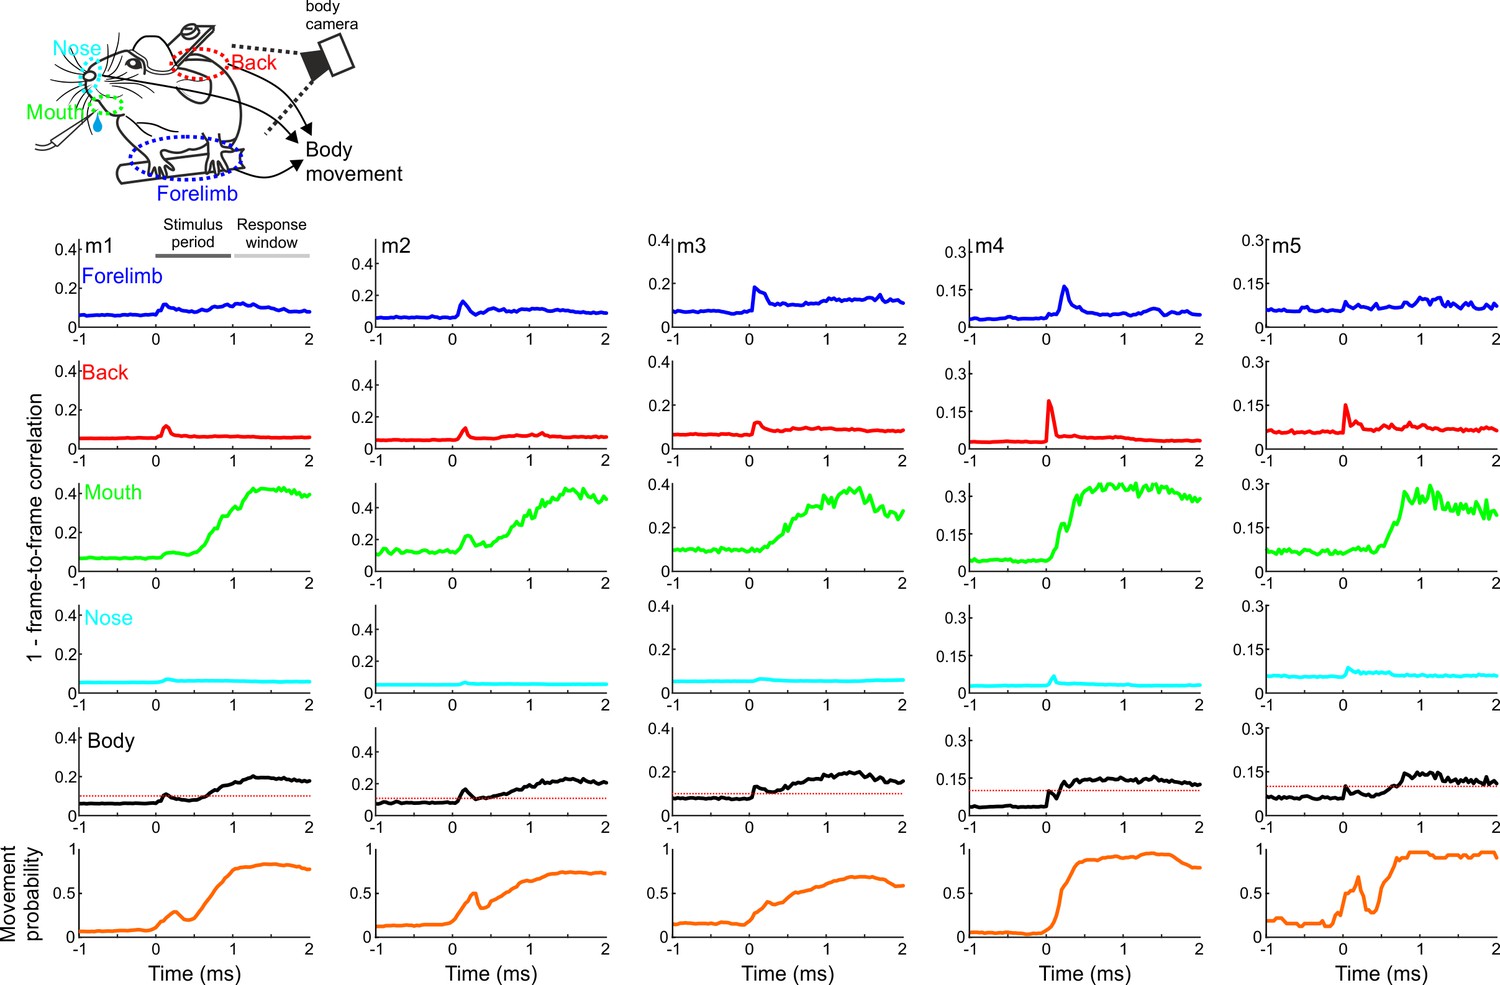
Movement of different body parts with respect to stimulus onset.
Movement of different body parts (Forelimb, Back, Mouth, Nose; Body movement was the average of forelimb, back and mouth; quantified as one minus the frame-to-frame correlation of those areas) along with the movement probability (bottom) for five expert mice. Dashed red line in the body movement panel indicates the movement threshold.
Figure 6 with 1 supplement
MGB responses tuned away from the go frequency are suppressed during learning.
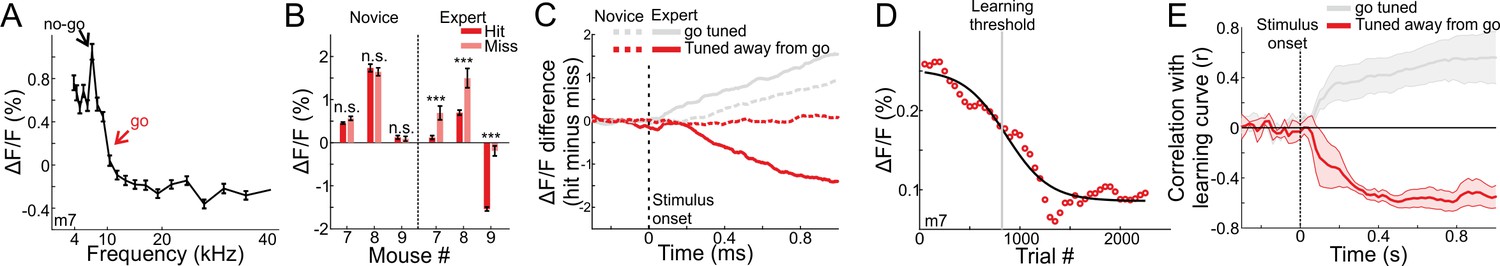
(A) Frequency tuning curve for an example mouse with peak tuning frequency away from the go sound. (B) Mean MGB calcium response during stimulus presentation per mouse in hit and miss trials. Left- novice mice, Right- expert mice. Error bars are s.e.m across trials. ***p<0.001. n.s. – not significant. Wilcoxon rank sum test. (C) Choice responses, averaged across the three mice that are tuned away from the go frequency, for the expert (solid line) and novice (dashed line) conditions. Gray traces are for the go-tuned mice, same as Figure 2D. (D) MGB response curve along learning in one mouse that is tuned away from the go frequency (compare to Figure 4A). (E) Correlation between MGB response curves and learning curves as a function of time, averaged across the three mice. Error bars are s.e.m across mice. Gray traces are for the go-tuned mice, same as Figure 4C.
Figure 6—figure supplement 1
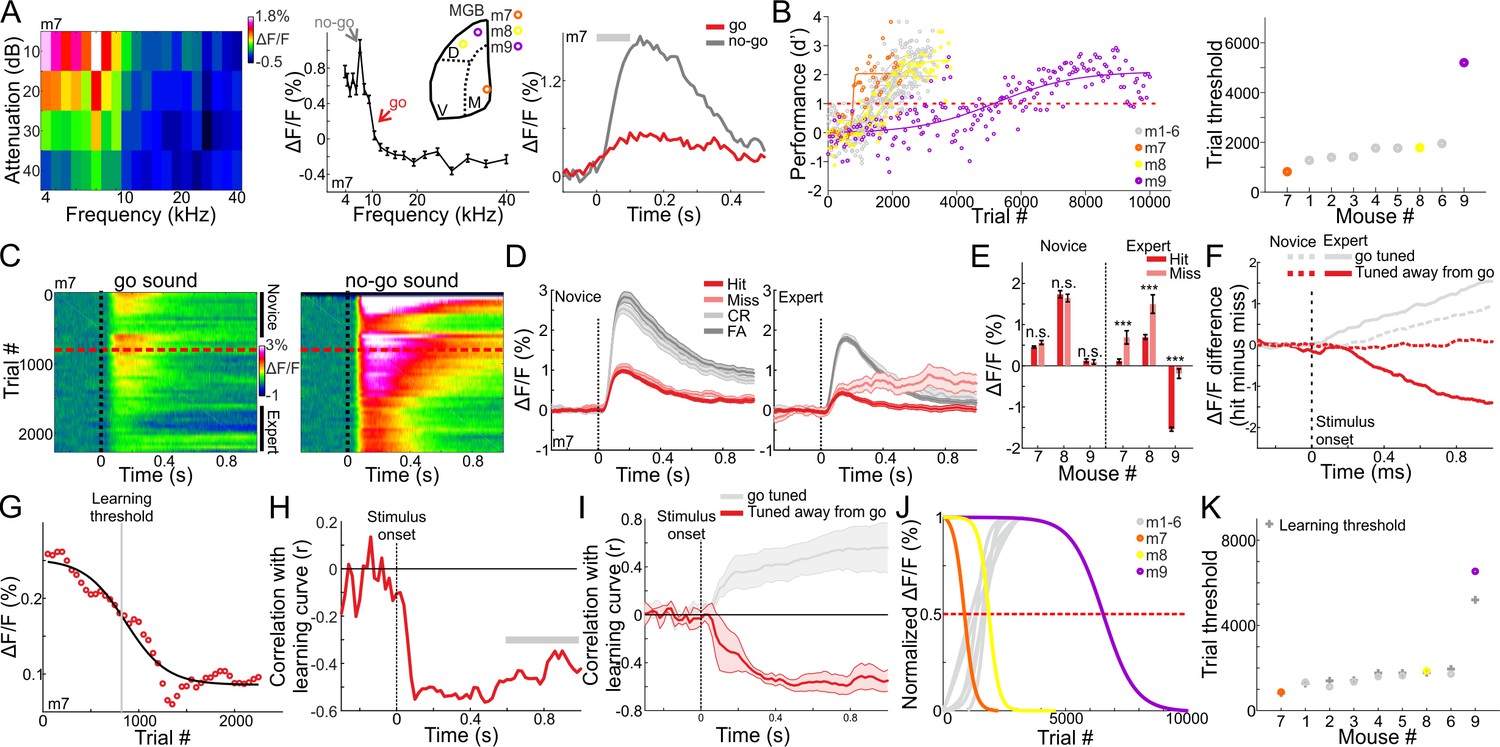
MGB responses tuned away from the go frequency are suppressed during learning.
(A) Left: A frequency response area plot (attenuation versus frequency) from one example mouse. Middle: Frequency tuning curve for the same example mouse with peak tuning frequency away from the go sound. Right: Average responses to the go (red) and no-go (gray) sounds. (B) Left: Behavioral learning curves for all mice (n = 3) tuned away from the go frequency depicting the performance (d’) as a function of trial number. Each learning curve was fitted with a sigmoid function. Dashed red line indicates the performance threshold (d’=1). In gray are the go preferring mice similar to Figure 1D. Right: Learning threshold (the trial number where the learning curve crossed the performance threshold) for all mice. In gray are the go tuned mice similar to Figure 1E. (C) 2-dimensional plots of the calcium responses in MGB during the trial (x-axis) and across learning (y-axis; 50 trial bins) for one example mouse divided into go (left) and no-go (right) sounds. Dashed black line indicates stimulus onset (1 s duration) and dashed red line indicates the learning threshold. (D) Calcium responses when the mouse was novice (left) and expert (right). Traces are shown separately for different trial types (hit, miss, FA and CR trials; same data as in ‘C’). Shaded error bars are s.e.m across trials. (E) Mean calcium response during stimulus presentation per mouse in hit and miss trials. Left- novice mice, Right- expert mice. Error bars are s.e.m across trials. ***p<0.001. n.s. – not significant. Wilcoxon rank sum test. Minimum 24 trials for hit or miss. (F) Choice responses, averaged across all three mice for the expert (solid line) and novice (dashed line) conditions. Gray traces are for go tuned mice, same as in Figure 2D. (G) MGB response curve along learning in one mouse (compare to Figure 4A). (H) Correlation between MGB response curves and learning curves as a function of time for an example mouse that is tuned away from the go frequency. (I) Same as H, but averaged across the three mice. Error bars are s.e.m across mice. Gray traces are for go tuned mice, same as Figure 4C. (J) Normalized fits for the MGB response curves of mice tuned away from the go frequency. Dashed red line indicates threshold. Gray traces are for go tuned mice, same as Figure 4D. (K) Maximal change in MBG response curves (i.e. the trial number in which the MGB fit crossed 0.5, dots) as a function of learning threshold (gray crosses). Gray circles are for go preferring mice, same as Figure 4E.
Author response image 1
Tables
Key resources table
| Reagent type (species) or resource | Designation | Source or reference | Identifiers | Additional information |
|---|---|---|---|---|
| Transfected construct (Adeno-associated virus) | pAAV.Syn.GCaMP6f.WPRE.SV40 | Addgene | RRID:Addgene_100837 | |
| Software, algorithm | Matlab, Labview | Mathworks, National Instruments |
Additional files
Download links
A two-part list of links to download the article, or parts of the article, in various formats.
Downloads (link to download the article as PDF)
Open citations (links to open the citations from this article in various online reference manager services)
Cite this article (links to download the citations from this article in formats compatible with various reference manager tools)
Learning-related population dynamics in the auditory thalamus
eLife 9:e56307.
https://doi.org/10.7554/eLife.56307


