Vanishing white matter disease expression of truncated EIF2B5 activates induced stress response
- Department of Pediatrics, University of Utah School of Medicine, United States
- Department of Bioengineering, University of Utah, United States
- Brain and Spine Center, Primary Children’s Hospital, United States
Figures
Figure 1
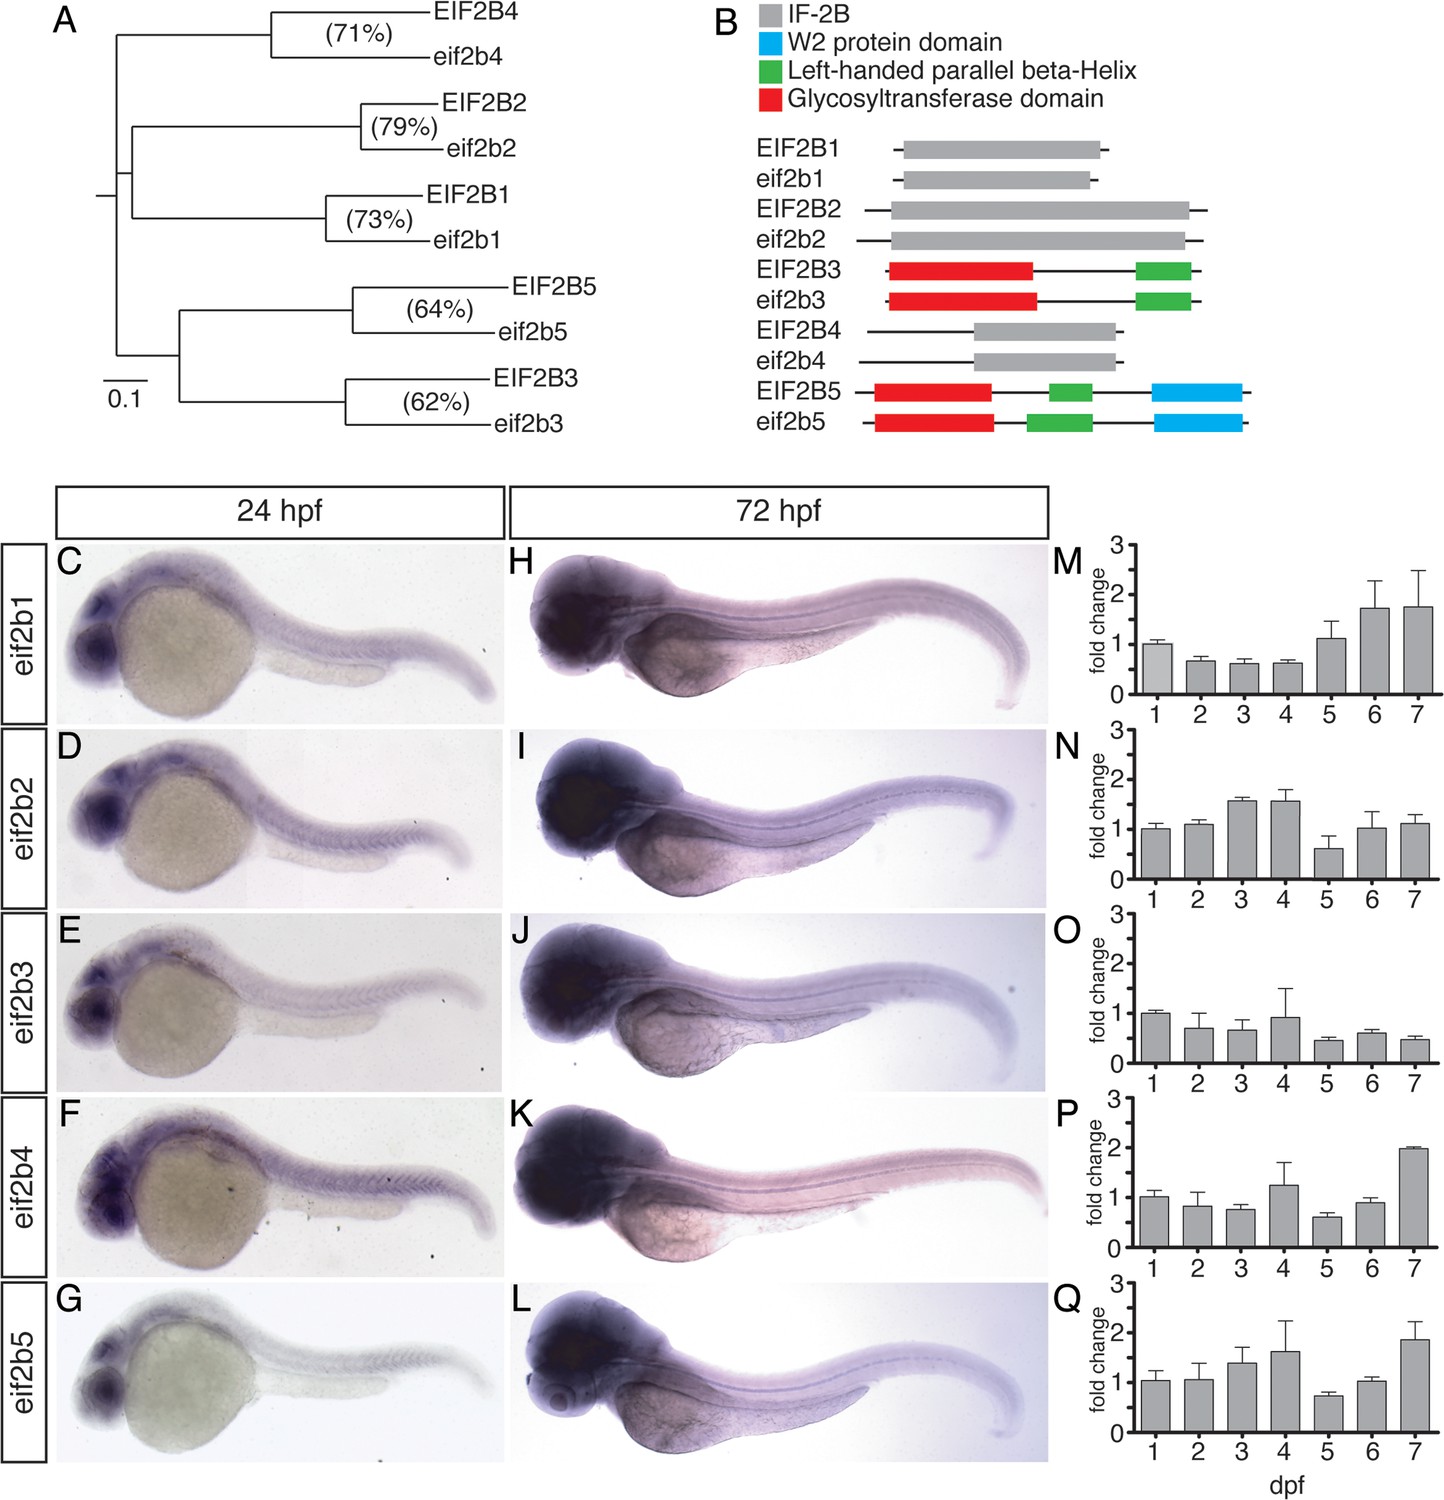
Phylogenetic and expression analysis of Eif2b orthologs in zebrafish during development.
(A) A horizontal cladogram of eif2b1-5 gene sequences shows that zebrafish have a single ortholog of each human EIF2B gene, and a relative conservation of amino acid sequence between orthologs. Scale bar equals an evolutionary distance of 0.1 amino acid changes per position in the sequence (Phylodendron). (B) Comparison of zebrafish and human EIF2B protein sequences shows conserved domain architectures. (C–L) Whole-mount in situ expression analysis in zebrafish embryos and larvae, brightfield microscopy, rostral left, dorsal top. (C–E) eif2b subunit genes at 24 hpf shows predominantly brain and eye expression, with lower levels of expression throughout the embryo. (H–L) eif2b subunit genes at 72 hpf shows higher expression throughout the animal and in the brain compared to 24 hpf. (M–Q) qRT-PCR expression of eif2b subunit genes from 24 hpf through 7 dpf, normalized to 24 hpf expression demonstrates variable expression changes across development. Error bars, standard error of the mean.
-
Figure 1—source data 1
Quantification of qRT-PCR results of eif2b subunits.
- https://cdn.elifesciences.org/articles/56319/elife-56319-fig1-data1-v2.xlsx
-
Figure 1—source data 2
Statistical analysis of changes in subunit expression.
- https://cdn.elifesciences.org/articles/56319/elife-56319-fig1-data2-v2.xlsx
Figure 2 with 1 supplement
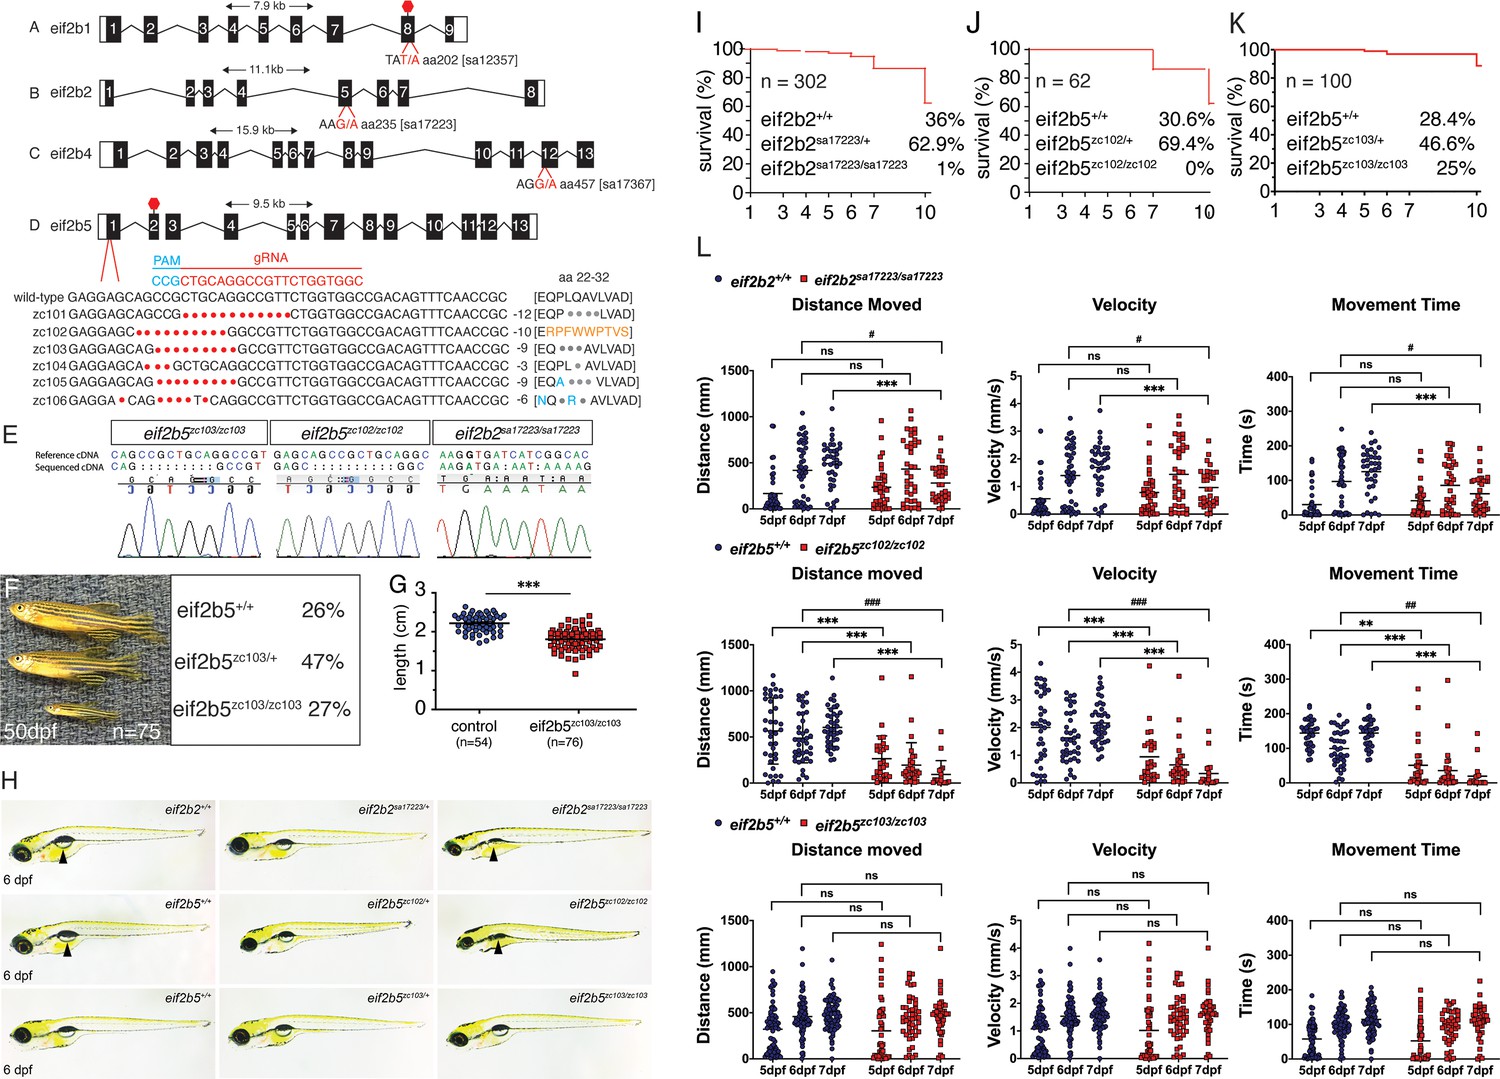
Zebrafish eif2b allele generation and characterization.
(A-D) Depiction of zebrafish eif2b subunits exon structure and the location and nucleotide change for each mutant. (A) eif2b1 harbors a T/A transversion resulting in an early stop in exon 8. (B) eif2b2 has a G/A transition in exon 5, mutating an essential splice site. (C) eif2b4 has a G/A transition in exon 12 mutating an essential splice site. (D) eif2b5 exon one was targeted for mutagenesis using a gRNA (red). Six distinct alleles were recovered (described in text). (E) Chromatograms of cDNA confirm presence of predicted mutations for eif2b5zc103/zc103, eif2b5zc102/zc102, and eif2b2sa17223/sa17223. (F) eif2b5zc103/zc103 mutants survive until adulthood in Mendelian ratios, but show grow defects compared to their heterozygous and wild-type siblings. (G) Adult eif2b5zc103/zc103 lengths are significantly shorter compared to their wild-type and heterozygous siblings. (H) Bright-field (BF) images of 6 dpf eif2b5zc103/zc103, eif2b5zc102/zc102, and eif2b2sa17223/sa17223 larva. eif2b2sa17223/sa17223 and eif2b5zc102/zc102 have no swim bladder (arrowhead) and a small head. (I) Kaplan-Meyer survival curves from an eif2b2sa17223/+ heterozygous in-cross shows 1% (n = 3) homozygote survival at 10 dpf (total n = 302); however no homozygotes live past 2 weeks of age. (J) Kaplan-Meyer survival curves from an eif2b5zc102/+ heterozygous in-cross shows that all homozygotes were dead by 10 dpf (total n = 62). (K) Kaplan-Meyer survival curves from an eif2b5zc103/+ heterozygous in-cross show no mortality of homozygotes. (L) Motor swimming analysis shows impaired swimming behavior in mutants. Distance moved, time spent moving, and velocity, for wild-type controls, and eif2b5zc103/zc103, eif2b5zc102/zc102, and eif2b2sa17223/sa17223 mutants, at 5, 6, and 7 dpf. Mean shown with 95% confidence intervals.
-
Figure 2—source data 1
Quantification of lengths.
- https://cdn.elifesciences.org/articles/56319/elife-56319-fig2-data1-v2.xlsx
-
Figure 2—source data 2
Quantification of behavior results.
- https://cdn.elifesciences.org/articles/56319/elife-56319-fig2-data2-v2.xlsx
-
Figure 2—source data 3
Quantification of behavior results of eif2b4sa17367/sa17367 allele.
- https://cdn.elifesciences.org/articles/56319/elife-56319-fig2-data3-v2.xlsx
-
Figure 2—source data 4
qRT-PCR for ISR transcripts for eif2b4sa17367/sa17367 allele.
- https://cdn.elifesciences.org/articles/56319/elife-56319-fig2-data4-v2.xlsx
-
Figure 2—source data 5
Survival quantification for eif2b4sa17367/sa17367 allele.
- https://cdn.elifesciences.org/articles/56319/elife-56319-fig2-data5-v2.xlsx
-
Figure 2—source data 6
Survival quantification for eif2b5zc103/zc103allele.
- https://cdn.elifesciences.org/articles/56319/elife-56319-fig2-data6-v2.xlsx
Figure 2—figure supplement 1
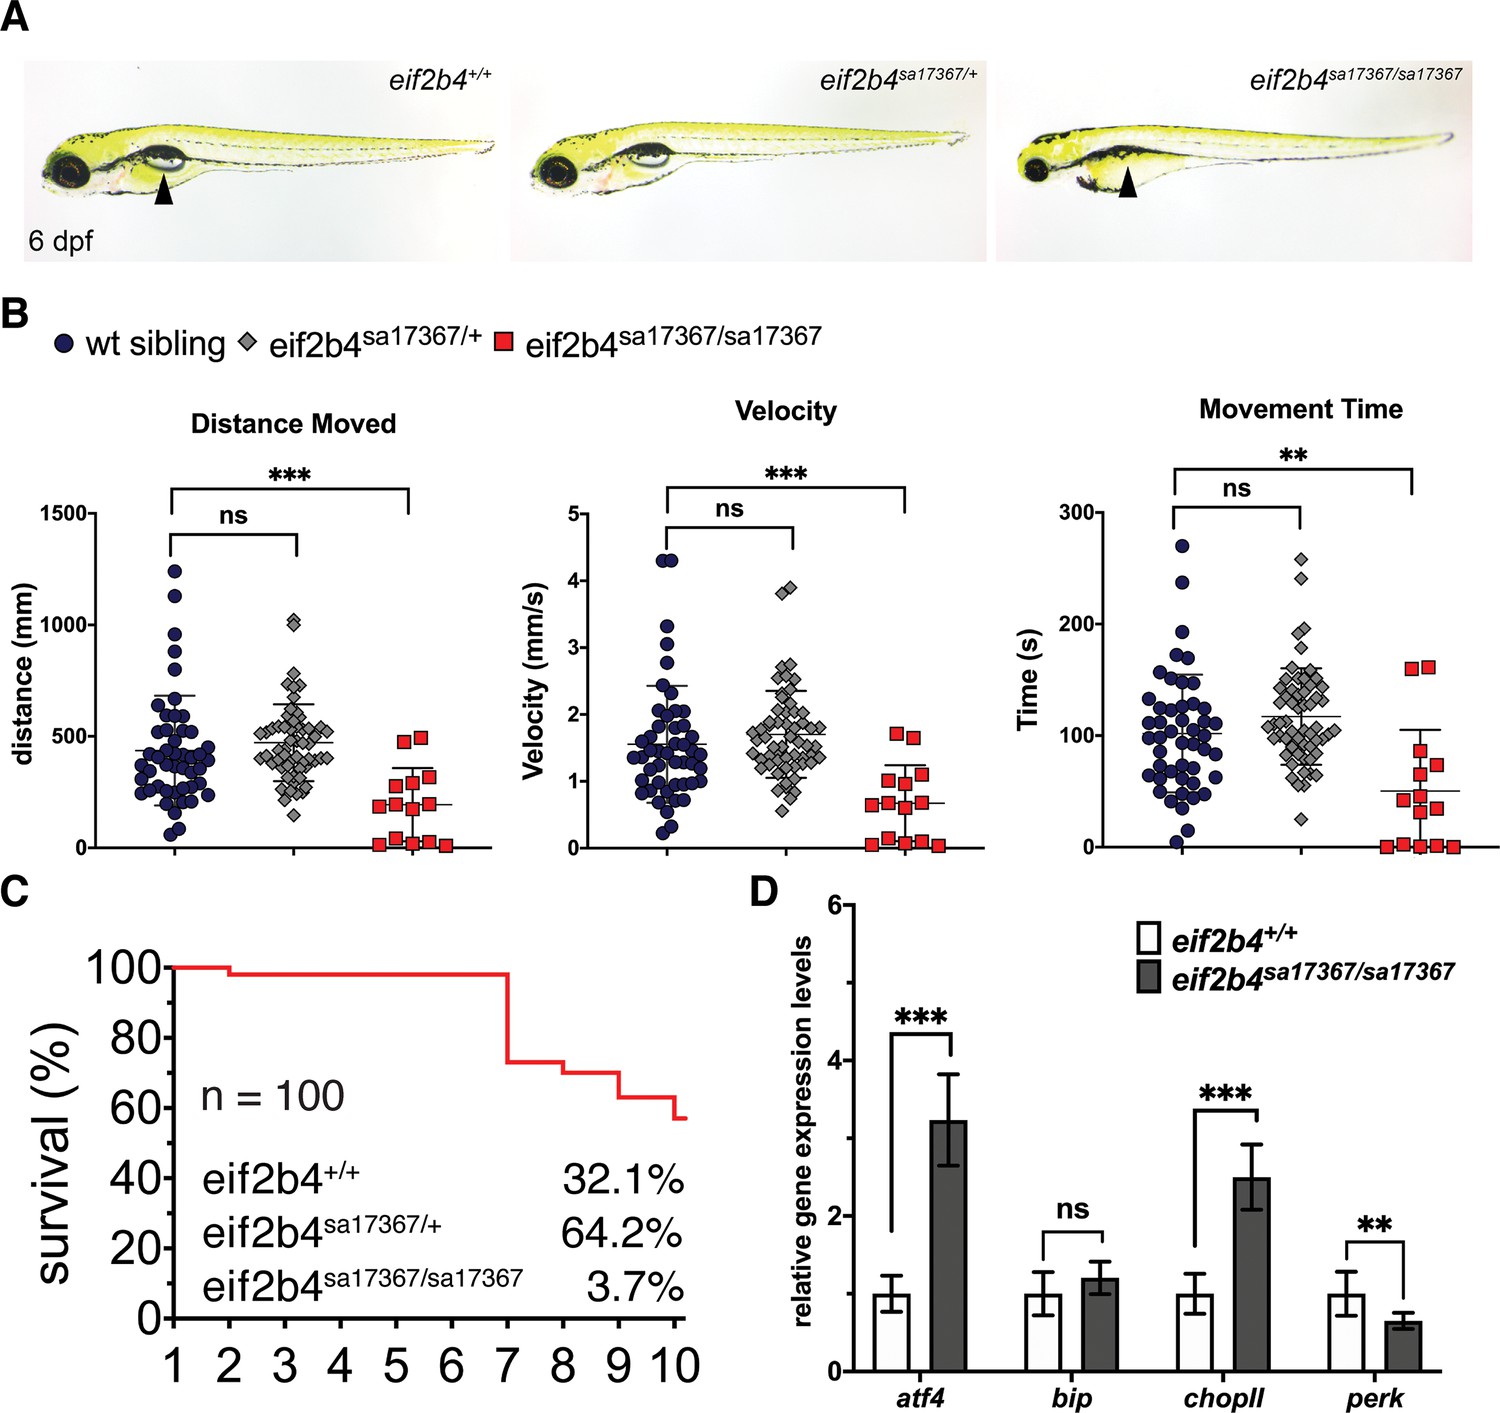
Zebrafish eif2b4sa17367/sa17367 allele characterization.
(A) BF image of 6 dpf eif2b4sa17367/sa17367 shows a lack of swim bladder (arrowhead) and a small head. (B) Motor swimming analysis shows impaired swimming behavior in homozygous mutants. Distance moved, time spent moving, and velocity, for wild-type controls, and eif2b5zc103 heterozygous and homozygous mutants, at 5 dpf. Mean shown with 95% confidence intervals. (C) eif2b4sa17367/sa17367 mutants have impaired survival, with <5% surviving past 10 dpf (total n = 100). (D) eif2b4sa17367/sa17367 mutants have activation of ISR transcripts (qRT-PCR).
Figure 3
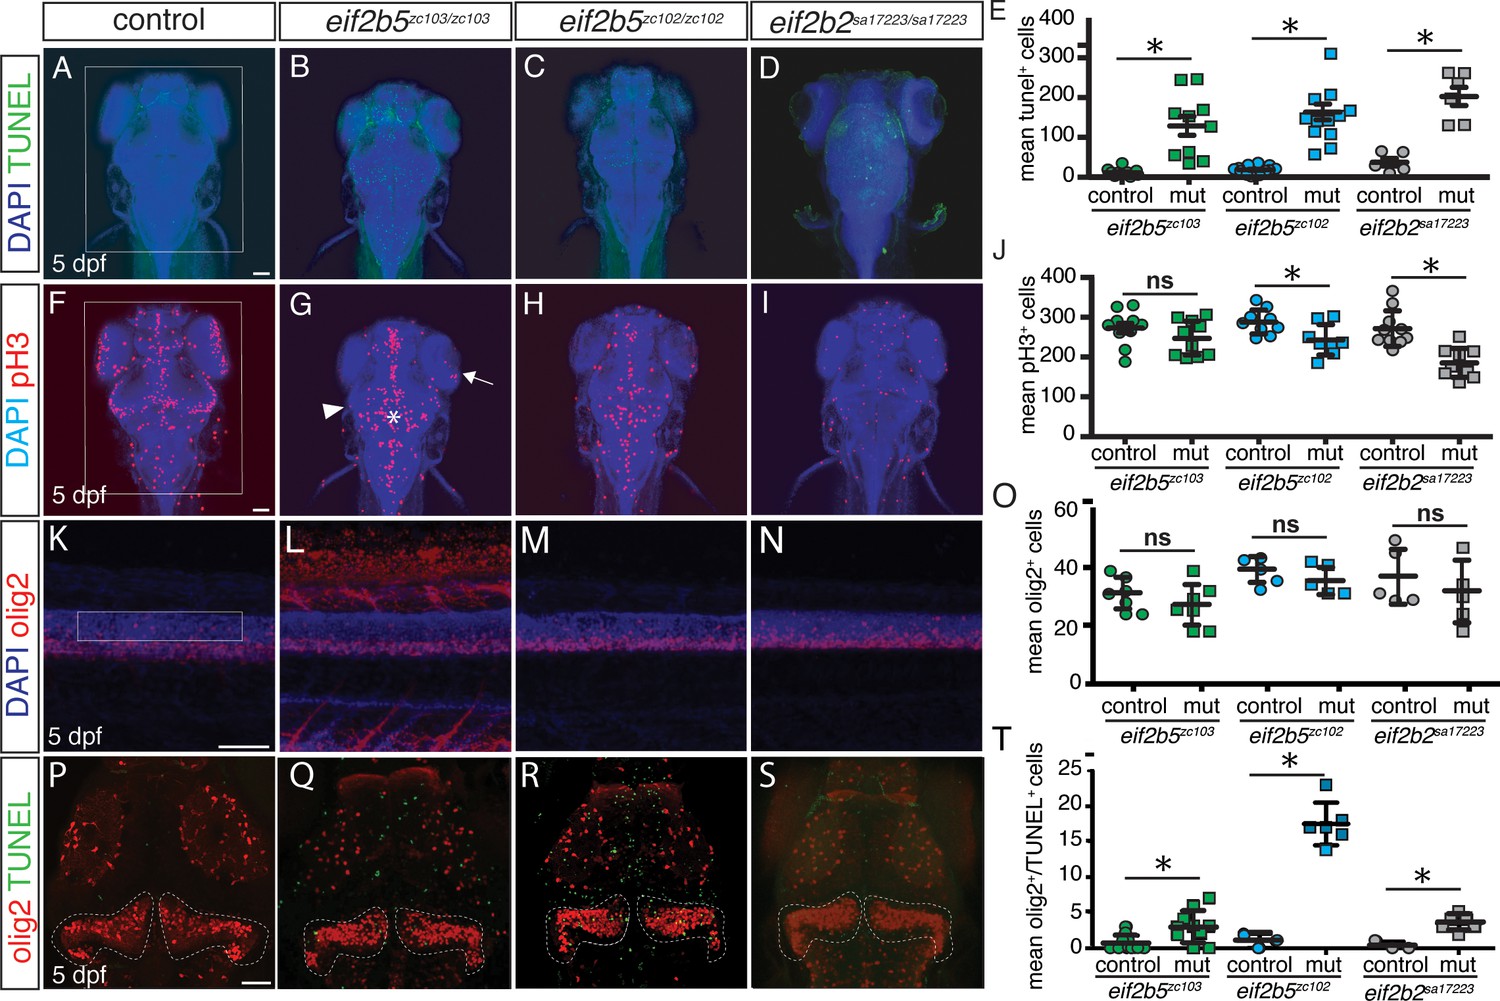
eif2b mutants demonstrate abnormal CNS development.
Confocal images, z-stack maximal projections. (A–I), dorsal views of the brain, rostral to the top, scale bar 50 μm; (K–N), lateral views of spinal cord, dorsal to the top, scale bar 50 um. (P–S), dorsal views of brain, rostral to top, scale bar 50 μm. *p<0.05. (A–D) TUNEL and DAPI staining shows increased apoptosis in homozygous mutant alleles compared to controls (wild-type and heterozygous siblings) in eif2b5zc103/zc103 eif2b5zc102/zc102 and eif2b2sa17223/sa17223 mutants. (E) Quantification of mean TUNEL+ cell counts in eif2b5zc103/zc103 eif2b5zc102/zc102 and eif2b2sa17223/sa17223 mutants compared to sibling controls. (F–I) Phospho-histone 3 and DAPI staining shows decreased cell proliferation in 5 dpf eif2b2sa17223/sa17223 mutants compared to controls, while eif2b5zc103/zc103 eif2b5zc102/zc102 mutants show a change in proliferation pattern, specifically in the optic tectum. (J) Quantification of mean number pH3+ cells counts in eif2b5zc103/zc103 eif2b5zc102/zc102 and eif2b2sa17223/sa17223 mutants compared to sibling controls. (K–N) Olig2dsRed and DAPI staining shows no change in OPC counts in the spinal cords of 5 dpf eif2b5zc103/zc103 eif2b5zc102/zc102 and eif2b2sa17223/sa17223 mutants compared to controls. (O) Quantification of mean number Olig2dsRed+ counts in eif2b5zc103/zc103 eif2b5zc102/zc102 or eif2b2sa17223/sa17223 mutants compared to sibling controls. (P–S) Co-labeled Olig2dsRed+/TUNEL+ cell counts staining shows increase in Olig2dsRed+ cells undergoing apoptosis in brains of 5 dpf eif2b5zc103/zc103, eif2b5zc102/zc102, or eif2b2sa17223/sa17223 mutants compared to sibling controls. (O) Quantification of mean number of co-labeled Olig2dsRed+/TUNEL+ cell counts in eif2b5zc103/zc103, eif2b5zc102/zc102, or eif2b2sa17223/sa17223 mutants compared to sibling controls.
-
Figure 3—source data 1
Quantification of TUNEL, pH3, olig2, and olig2/TUNEL results.
- https://cdn.elifesciences.org/articles/56319/elife-56319-fig3-data1-v2.xlsx
-
Figure 3—source data 2
Quantification of TUNEL, pH3, olig2, and olig2/TUNEL results.
- https://cdn.elifesciences.org/articles/56319/elife-56319-fig3-data2-v2.xlsx
-
Figure 3—source data 3
Quantification of TUNEL, pH3, olig2, and olig2/TUNEL results.
- https://cdn.elifesciences.org/articles/56319/elife-56319-fig3-data3-v2.xlsx
-
Figure 3—source data 4
Quantification of TUNEL, pH3, olig2, and olig2/TUNEL results.
- https://cdn.elifesciences.org/articles/56319/elife-56319-fig3-data4-v2.xlsx
Figure 4 with 1 supplement

Top row (and quantification in lower left): increased apoptotic OPCs in the brain and spinal cord.
Confocal images of brain, z-stack, rostral to the top, double-labeling for TUNEL and olig1 (in situ probe), in WT, eif2b5zc103/zc103, eif2b5zc102/zc102 or eif2b2sa17223/sa172233 larvae. Region used for quantification shown by box. Inset in each panel shows example of double-labeled cell (TUNEL, olig1) for each genotype (except WT), single confocal slice image. Middle panels: no change in apoptosis of differentiated oligodendrocytes, co-labeled with myelin associated glycoprotein (mag) (in situ probe) and TUNEL. Confocal z-stack images of spinal cord, rostral to the left; quantified in lower right panel.
-
Figure 4—source data 1
Quantification of olig1, TUNEL and mag results.
- https://cdn.elifesciences.org/articles/56319/elife-56319-fig4-data1-v2.xlsx
Figure 4—figure supplement 1
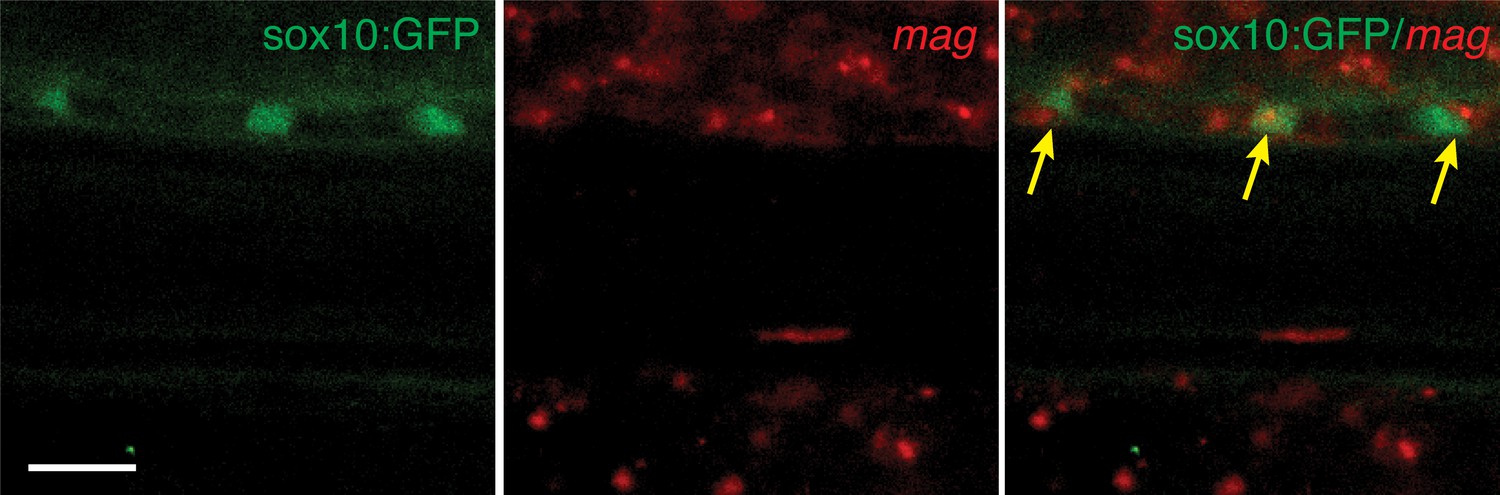
Localization of mag in situ probe in oligodendrocytes; double-labeling for mag and GFP, in Tg(sox10:GFP) line.
Dorsal to top, rostral to left, in spinal cord. Arrows point to co-localized GFP and mag. Confocal image, single slice, step size 2.5 μm, scale bar, 10 μm.
Figure 5
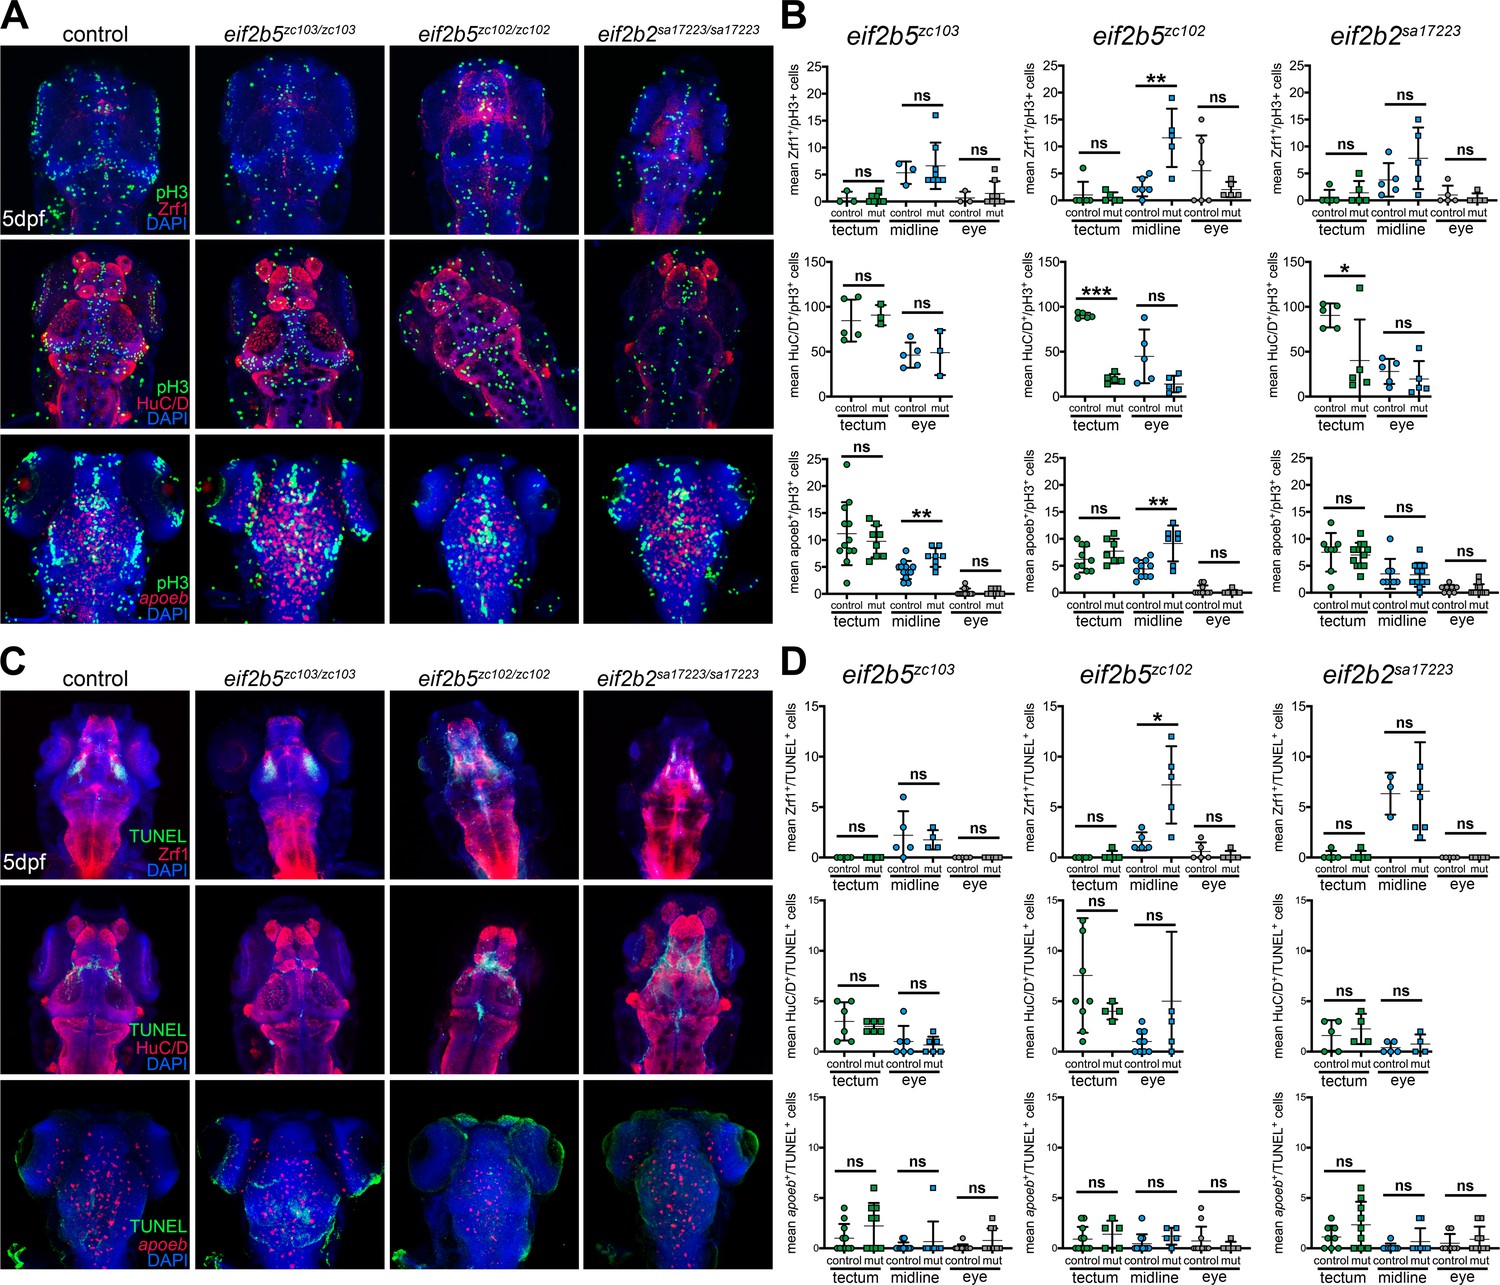
Determination of cell types affected in mutants by changes in proliferation or in apoptosis.
(A) Confocal images of brain, z-stack, rostral to the top, in WT, eif2b5zc103/zc103, eif2b5zc102/zc102 or eif2b2sa17223/sa172233 larvae. Confocal images of brain, z-stack, rostral to the top. Top row, labeling for Zrf1, DAPI, and pH3. Middle row, labeling for HuC/D, DAPI, and pH3. Bottom row, labeling for apoeb, DAPI, and pH3. (B) Quantification of cell counts in (A). (C) Confocal images of brain, z-stack, rostral to the top, in WT, eif2b5zc103/zc103, eif2b5zc102/zc102 or eif2b2sa17223/sa172233 larvae. Confocal images of brain, z-stack, rostral to the top. Top row, labeling for Zrf1, DAPI, and TUNEL. Middle row, labeling for HuC/D, DAPI, and TUNEL. Bottom row, labeling for apoeb, DAPI, and TUNEL. (D) Quantification of cell counts in (C).
-
Figure 5—source data 1
Quantification of Zrf1, HuC/D, and apoeb, double-labeling with pH3, results in tectum, midline, and eyes in eif2b5zc103/zc103, eif2b2zc102/zc102, and eif2b2sa17223/sa172233.
- https://cdn.elifesciences.org/articles/56319/elife-56319-fig5-data1-v2.xlsx
-
Figure 5—source data 2
Quantification of Zrf1, HuC/D, and apoeb, double-labeling with TUNEL, results in tectum, midline, and eyes in eif2b5zc103/zc103, eif2b2zc102/zc102, and eif2b2sa17223/sa172233.
- https://cdn.elifesciences.org/articles/56319/elife-56319-fig5-data2-v2.xlsx
Figure 6 with 1 supplement
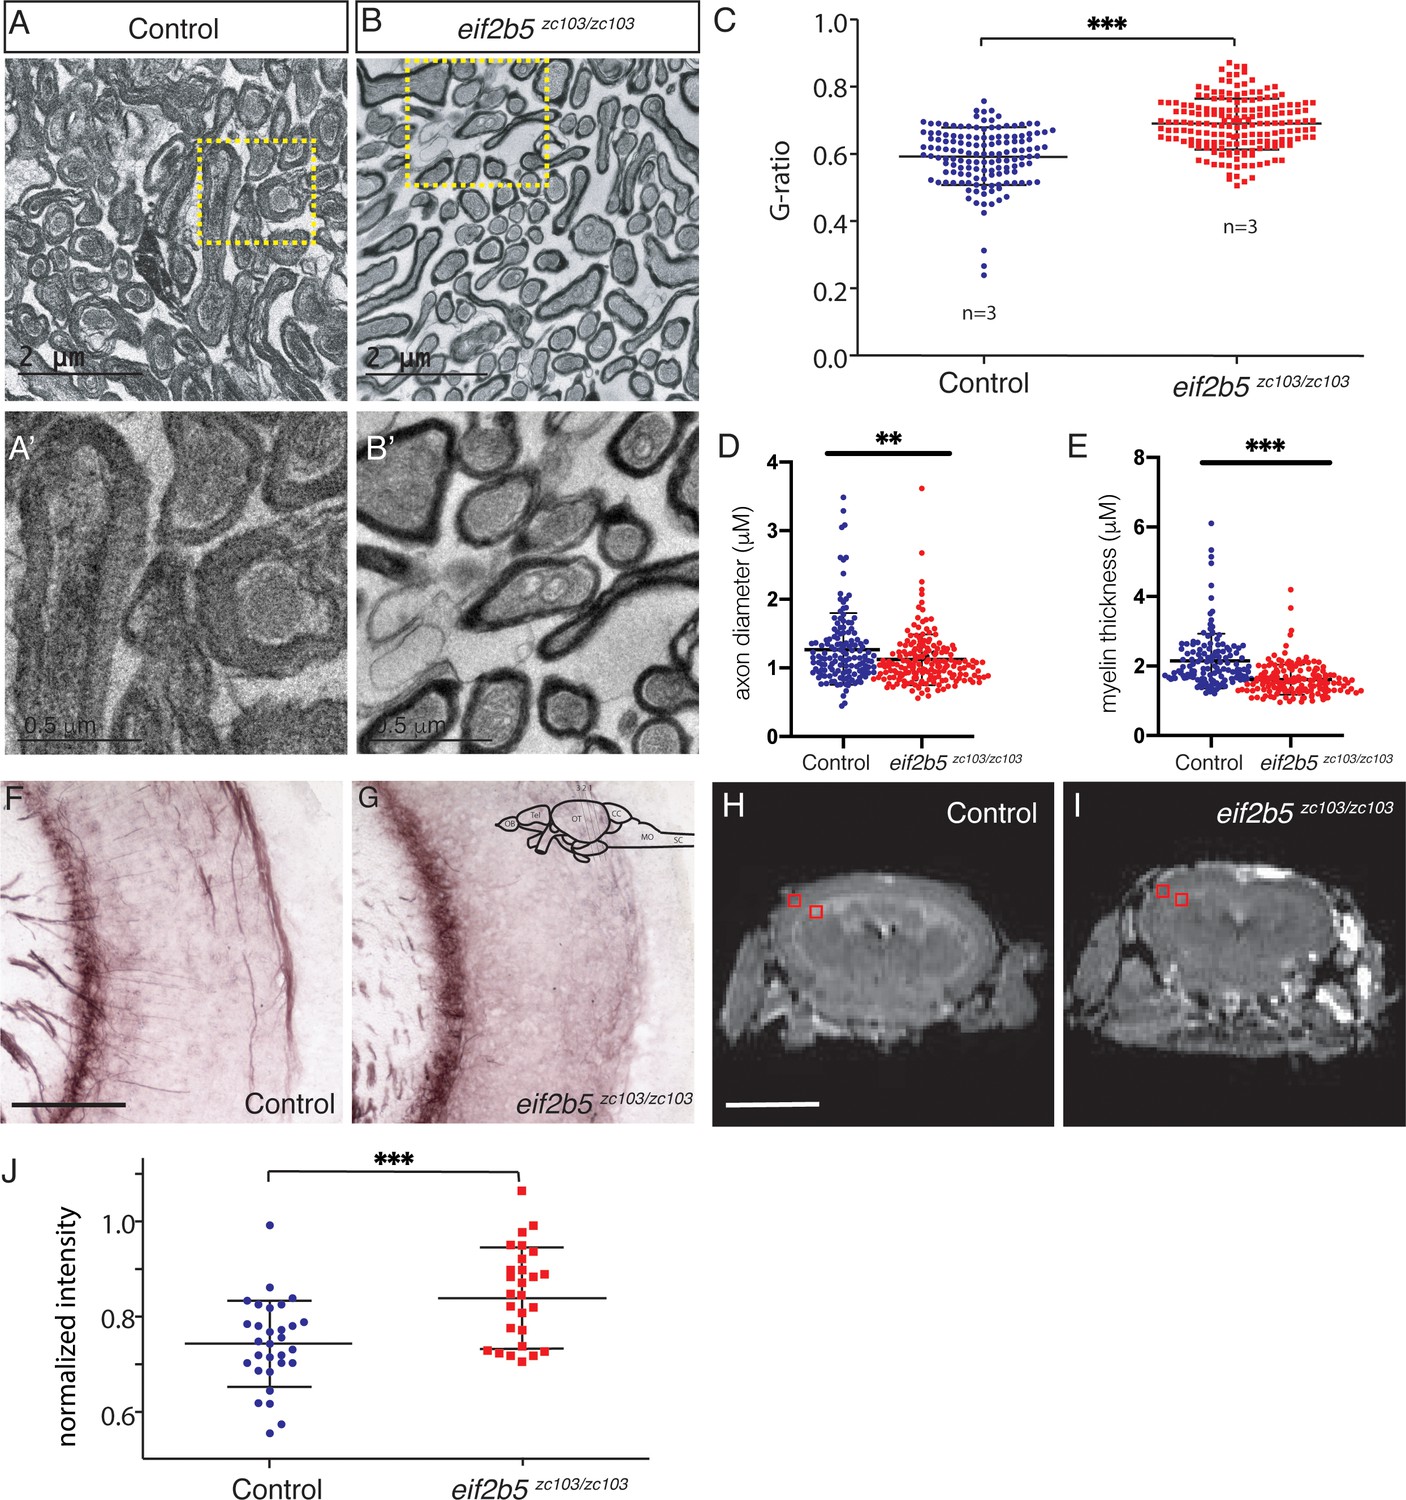
Adult eif2b5 zc103/zc103 mutants show myelin defects.
(A–C) Transmission electron microscopy (TEM) of adult eif2b5zc103/zc103 optic nerve compared to eif2b5+/+ adults. Scale bar 2 μm. (A) eif2b5+/+ adult TEM image. (B) eif2b5zc103/zc103 adult TEM image. (A’, B’) Higher magnification views of insets represented in (A) and (B), scale bar 0.5 μm. (C–E). Comparison of ratio between axon perimeter and myelin sheath perimeter, G-ratio, between eif2b5zc103/zc103 and eif2b5+/+; axon diameter and myelin thickness quantification shown. (F–G) Black Gold stain of adult eif2b5zc103/zc103 optic tectum compared to eif2b5+/+ adults. Scale bar 5 μm. (F) eif2b5+/+ adult Black Gold stained image. (G) eif2b5zc103/zc103 adult Black Gold stained image. (H–J) Magnetic Resonance Image (MRI) of adult eif2b5zc103/zc103 compared to eif2b5+/+. Scale bar 2 mm. Slice scheme of MRI images from the rhombencephalic ventricle (RV) at the end of the midbrain moving rostrally. (H) eif2b5+/+ adult T2 MRI image slice 1. (I) eif2b5zc103/zc103 adult T2 MRI of slice 1. (J) T2 intensity analysis. The normalized change in intensity from the from grey matter region of the optic tectum to the white matter region of the periventricular grey zone of the optic tectum, indicated by red boxes.
-
Figure 6—source data 1
Quantification of TEM results.
- https://cdn.elifesciences.org/articles/56319/elife-56319-fig6-data1-v2.xlsx
Figure 6—figure supplement 1

MRI images of adult wild-type control siblings and eif2b5zc103/zc103 fish, showing decreased head and body size.
(A) Demonstration of orientation used for length, width, and height measurements of head. (B) MRI images, and quantification, of control compared to mutant, demonstrating decreased sizes.
Figure 7
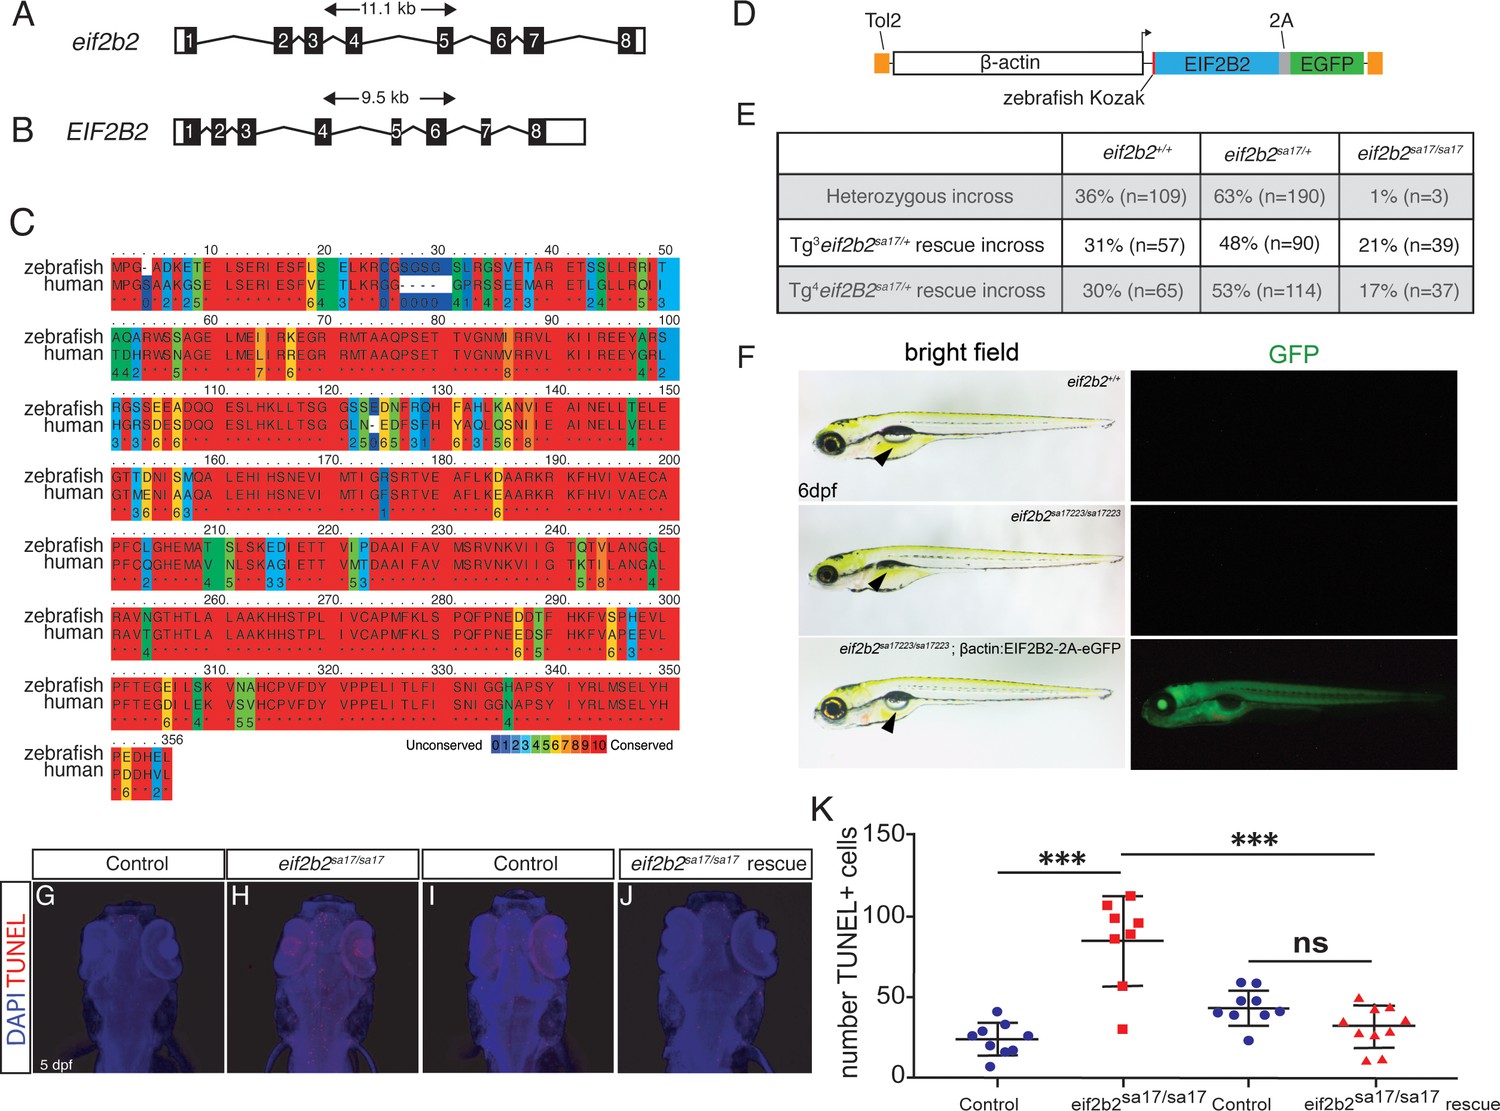
Human EIF2B2 gene rescues zebrafish eif2b2sa17223/sa17223 mutants.
(A) 11.1 kb zebrafish eif2b2 gene structure. (B) 9.5 kb human EIF2B2 gene structure. (C) Conservation of amino acid sequence between zebrafish eif2b2 and human EIF2B2. (D) Schematic of rescue construct containing Tol2, β-actin, human EIF2B2, and eGFP. (E) Genotype results (at adult age), of an eif2b2sa17223/+ heterozygous incross, and an eif2b2sa17223/+ heterozygous zebrafish crossed with two different transgenic alleles (#3 and #4): eif2b2sa17223/+;Tg3(β-actin:EIF2B2:2A:eGFP) or eif2b2sa17223/+;Tg4(β-actin:EIF2B2:2A:eGFP) heterozygous zebrafish. (F) Bright-field and immunofluorescent images of eif2b2sa17223/sa17223;β-actin:EIF2B2:2A:eGFP mutant fish: showing a swim bladder and regular-sized head; or showing GFP expression in eif2b2sa17223/sa17223;β-actin:EIF2B2:2A:eGFP mutant fish. (G–J) TUNEL and DAPI antibody staining of wild-type control; eif2b2sa17223/sa17223 mutant; eif2b2+/+;β-actin:EIF2B2:2A:eGFP wild-type control; and eif2b2sa17223/sa17223;β-actin:EIF2B2:2A:eGFP mutant. (K) Quantification of TUNEL+ cells.
-
Figure 7—source data 1
Quantification of TUNEL results.
- https://cdn.elifesciences.org/articles/56319/elife-56319-fig7-data1-v2.xlsx
-
Figure 7—source data 2
Quantification of behavior results.
- https://cdn.elifesciences.org/articles/56319/elife-56319-fig7-data2-v2.xlsx
Figure 8
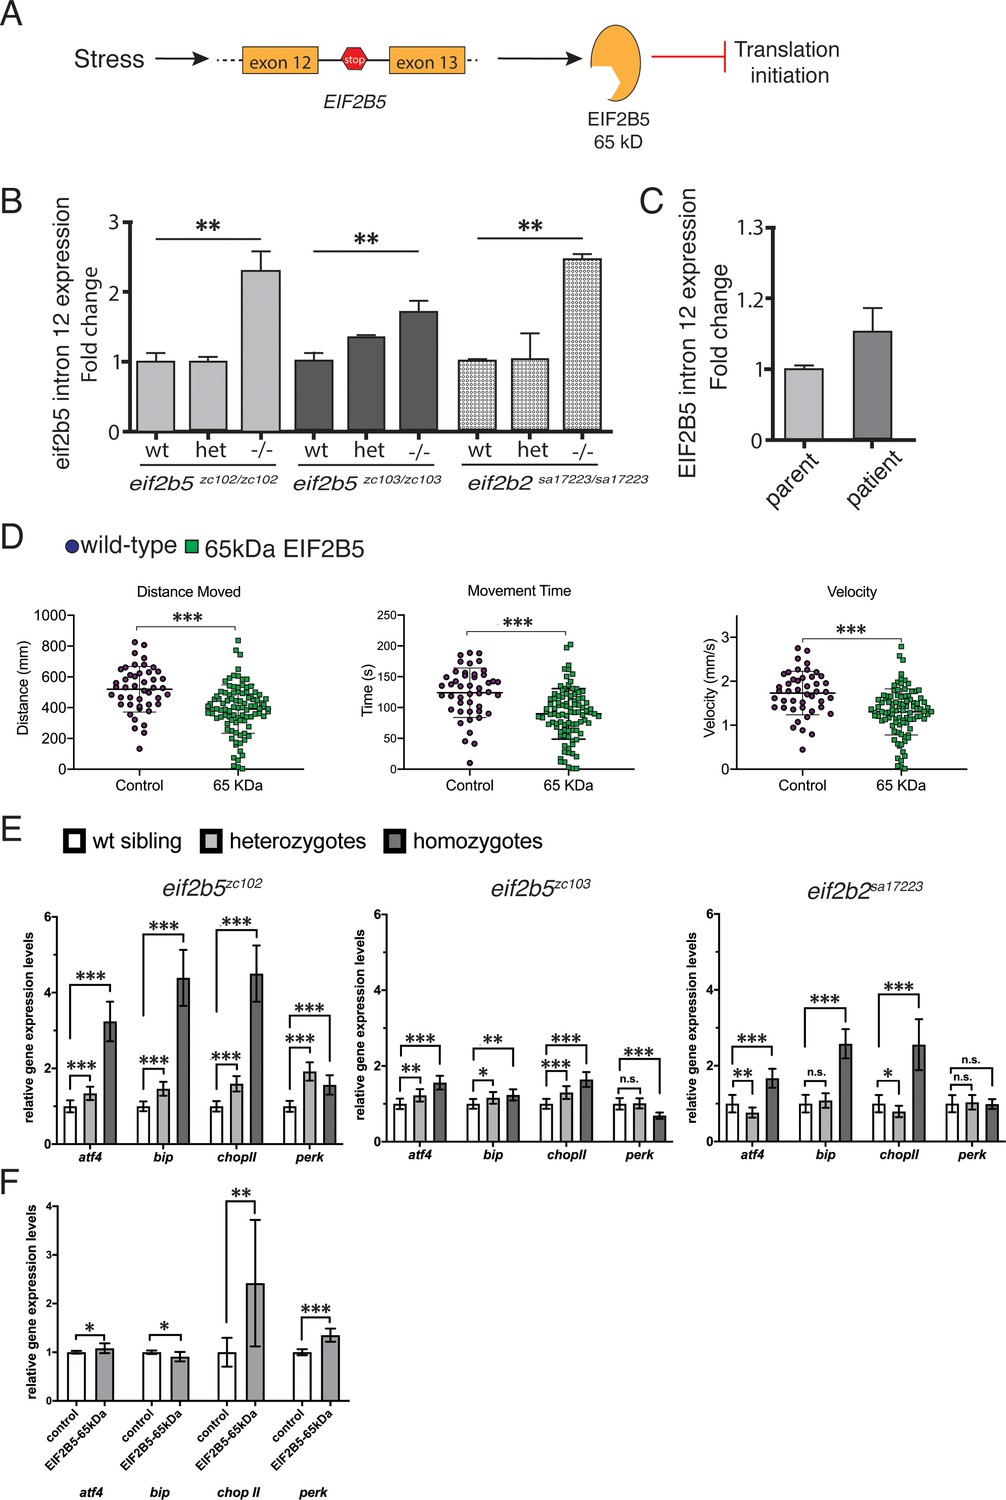
Zebrafish eif2b5 mutant alleles show intron retention, activated ISR, and role of truncated Eif2b5 in worsening phenotype.
(A) Schematic showing integrated stress response activated intron 12 retention of eif2b5 resulting in premature stop codon and truncated form of EIF2B5. (B) Fold change of eif2b5 intron 12 expression with qRT-PCR in eif2b5zc103/zc103, eif2b5zc102/zc102, and eif2b2sa17223/sa17223 mutants relative to controls. (C) qRT-PCR for intron 12 expression in a VWM patient and their control unaffected father. (D) Control-injected larvae, compared to those injected with truncated eif2b5 construct, shows impaired swimming behavior; distance moved, time spent moving, and velocity, at 5 dpf. (E) qRT-PCR for atf4, bip, chopII, and perk ISR transcripts shows increased expression in eif2b5zc103/zc103, eif2b5zc102/zc102, and eif2b2sa17223/sa17223 mutants. (F) qRT-PCR for ISR transcripts (atf 4, bip, chop II, and perk) shows increased expression following injection of truncated eif2b5 construct.
-
Figure 8—source data 1
qRT-PCR for intron 12 expression changes (eif2b5, zebrafish).
- https://cdn.elifesciences.org/articles/56319/elife-56319-fig8-data1-v2.xlsx
-
Figure 8—source data 2
qRT-PCR for intron 12 expression changes (eif2b2, zebrafish).
- https://cdn.elifesciences.org/articles/56319/elife-56319-fig8-data2-v2.xlsx
-
Figure 8—source data 3
qRT-PCR for intron 12 expression changes (human).
- https://cdn.elifesciences.org/articles/56319/elife-56319-fig8-data3-v2.xlsx
-
Figure 8—source data 4
Behavior data for truncated eif2b5 effects.
- https://cdn.elifesciences.org/articles/56319/elife-56319-fig8-data4-v2.xlsx
-
Figure 8—source data 5
qRT-PCR for ISR transcript expression.
- https://cdn.elifesciences.org/articles/56319/elife-56319-fig8-data5-v2.xlsx
-
Figure 8—source data 6
qRT-PCR for ISR transcript expression changes following injection with truncated eif2b5.
- https://cdn.elifesciences.org/articles/56319/elife-56319-fig8-data6-v2.xlsx
Figure 9
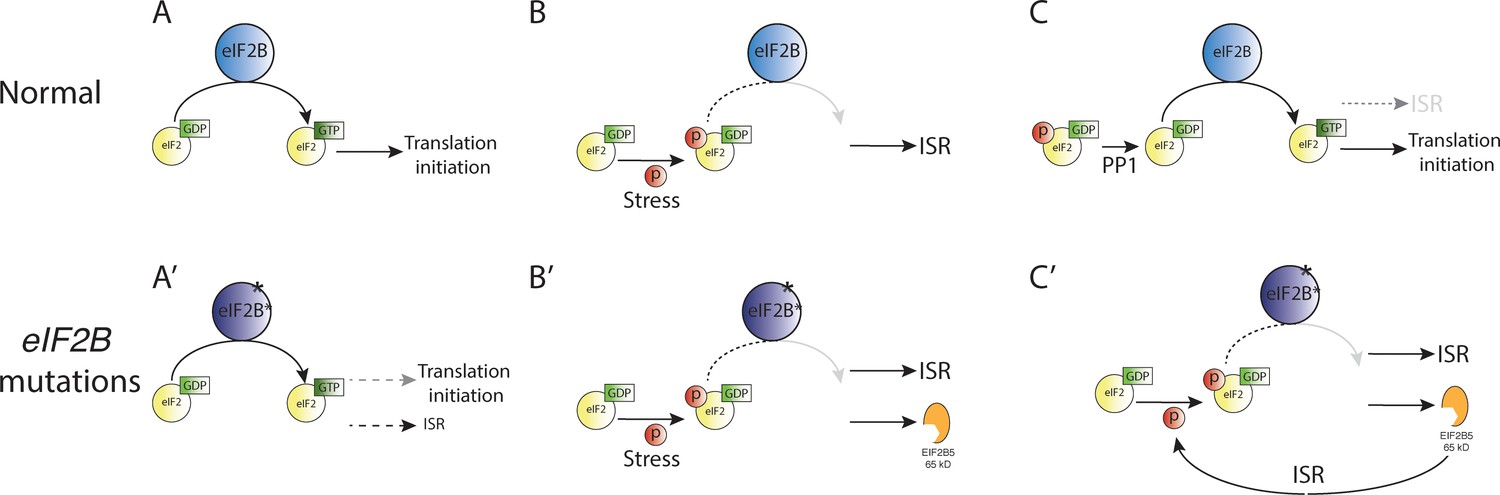
Feed-forward effect of truncated EIF2B5.
(A–C) Under normal conditions, stress leads to activation of the ISR, which is terminated by dephosphorylation of eIF2a by PP1 (protein phosphatase one complex) and resumption of normal cap-dependent translation. (A’–C’) In the presence of eif2b subunit mutations in VWM, normal translation is impaired, and there is activation of the ISR above baseline (A’). In response to stress, there is ISR activation and expression of truncated EIF2B5, which leads to chronic activation of the ISR and an inability to terminate the ISR.
Tables
Key resources table
| Reagent type (species) or resource | Designation | Source or reference | Identifiers | Additional information |
|---|---|---|---|---|
| Gene (Danio rerio) | eif2b1 | D. rerio genome resource | GRCz11: ENSDARG00000091402 | |
| Gene (D. rerio) | eif2b2 | D. rerio genome resource | GRCz11: ENSDARG00000041397 | |
| Gene (D. rerio) | eif2b3 | D. rerio genome resource | GRCz11: ENSDARG00000018106 | |
| Gene (D. rerio) | eif2b4 | D. rerio genome resource | GRCz11: ENSDARG00000014004 | |
| Gene (D. rerio) | eif2b5 | D. rerio genome resource | GRCz11: ENSDARG00000074995 | |
| Gene (D. rerio) | apoeb | D. rerio genome resource | GRCz11: ENSDARG00000040295 | |
| Gene (Homo sapiens) | EIF2B2 | H. sapiens genome resource | GRCh38.p13: ENSG00000119718 | |
| Gene (H. sapiens) | EIF2B5 | H. sapiens genome resource | GRCh38.p13: ENSG00000145191 | |
| Genetic reagent (D. rerio) | eif2b1sa12357 | Zebrafish International Resource Center (ZIRC) | ZIRC Catalog ID: ZL8971.02; RRID:ZIRC_ZL8971.02 | |
| Genetic reagent (D. rerio) | eif2b2sa17223 | Zebrafish International Resource Center (ZIRC) | ZIRC Catalog ID: ZL10609.15; RRID:ZIRC_ZL10609.15 | |
| Genetic reagent (D. rerio) | eif2b4sa17367 | Zebrafish International Resource Center (ZIRC) | ZIRC Catalog ID: ZL10621.10; RRID:ZIRC_ZL10621.10 | |
| Genetic reagent (D. rerio) | eif2b5zc102 | This paper- generated and described in Materials and methods. | ||
| Genetic reagent (D. rerio) | eif2b5zc103 | This paper- generated and described in Materials and methods. | ||
| Genetic reagent (D. rerio) | Tg (ß-actin:EIF2B2-2A-eGFP) | This paper- generated and described in Materials and methods. | ||
| Genetic reagent (D. rerio) | Tg(olig2:dsRed)vu19 | It is available from EZRC and China ZRC | ZFIN ID:ZDB-ALT-080321–2 | |
| Antibody | anti-acetylated tubulin (mouse monoclonal) | Sigma | Sigma: T6793; RRID:AB_477585 | (1:250) |
| Antibody | Anti-GFP (mouse monoclonal) | Millipore | Millipore: MAB3580; RRID:AB_94936 | (1:250) |
| Antibody | Anti-GFP (mouse polyclonal) | Aves Labs | Aves Labs : GFP-1020; RRID:AB_10000240 | (1:1000) |
| Antibody | Anti-HuC/D (mouse monoclonal) | Thermo Fisher Scientific | Thermo Fisher Scientific: A-21271; RRID:AB_221448 | (1:400) |
| Antibody | Anti-dsRed | Takara | Clontech: 632496; RRID:AB_10013483 | (1:250) |
| Antibody | Cy-3 anti-rabbit (goat polyclonal) | Millipore | Millipore: AP132C; RRID:AB_92489 | (1:400) |
| Antibody | Alexa 488 donkey anti-mouse (donkey polyclonal) | Thermo Fisher Scientific | Molecular Probes: A-21202; RRID:AB_141607 | (1:400) |
| Antibody | Alexa 633 donkey anti-rabbit (donkey polyclonal) | Thermo Fisher Scientific | Molecular Probes: A-21070; RRID:AB_2535731 | (1:400) |
| Antibody | Alexa 488 goat anti-chicken (goat polyclonal) | Thermo Fisher Scientific | Molecular Probes: A-11039; RRID:AB_2534096 | (1:400) |
| Antibody | Alexa 555 rabbit anti-goat (rabbit polyclonal) | Thermo Fisher Scientific | Molecular Probes: A-21431; RRID:AB_2535852 | (1:400) |
| Peptide, recombinant protein | Gateway BP Clonase II enzyme mix | Thermo Fisher Scientific | Thermo Fisher Scientific: 11789020 | |
| Peptide, recombinant protein | Gateway LR Clonase II enzyme mix | Thermo Fisher Scientific | Thermo Fisher Scientific: 11701020 | |
| Strain, strain background (Escherichia coli) | 10-beta | New England BioLabs | NEB: C3019H | |
| Strain, strain background (Human cancer cell line) | SH-SY5Y | Gift from the Pulst lab | RRID:CVCL_0019 | |
| Recombinant DNA reagent | pCR4.0-TOPO | Thermo Fisher Scientific | Thermo Fisher Scientific: 450030, cat # | |
| Recombinant DNA reagent | pDONR P4-P1R | Tol2 kit | Tol2kit.genetics.utah.edu | |
| Recombinant DNA reagent | pDONR 221 | Tol2 kit | Tol2kit.genetics.utah.edu | |
| Recombinant DNA reagent | pDONR P2R-P3 | Tol2 kit | Tol2kit.genetics.utah.edu | |
| Recombinant DNA reagent | Tg (ß-actin:EIF2B2-2A-eGFP) | This paper- generated and described in Materials and methods. | ||
| Recombinant DNA reagent | Tg (ß-actin:EIF2B5-2A-eGFP) | This paper- generated and described in Materials and methods. | ||
| Recombinant DNA reagent | pCS2+-Transposase | This paper- generated and described in Materials and methods. | ||
| Transfected construct (Human) | Tg (ß-actin:EIF2B2-2A-eGFP) | This paper- generated and described in Materials and methods. | ||
| Biological sample (Human) | Human patient sample (serum) | This paper- generated and described in Materials and methods. | ||
| Commercial assay or kit | DIG RNA Labeling Kit (SP6/T7) | Roche | Roche: 11175025910 | |
| Commercial assay or kit | ApopTag-fluorescein | Millipore | Millipore: S7111 | |
| Commercial assay or kit | ApopTag-Red | Millipore | Millipore: S7165 | |
| Commercial assay or kit | ImmPACT (TM) VECTOR (R) RED AP Substrate | Vector Laboratories | Vector Laboratories: SK-5105 | |
| Commercial assay or kit | Black Gold II kit | Millipore | Millipore: AG105 | |
| Chemical compound, drug | Applied Biosystems PowerUp SYBR Green Master Mix | Thermo Fisher Scientific | Thermo Fisher Scientific: A25776 | |
| Software, algorithm | MATLAB | Mathworks | Version R2017b | |
| Software, algorithm | EthoVision-XT software | Noldus (https://www.noldus.com/ethovision-xt) | RRID:SCR_000441 | |
| Software, algorithm | GraphPad Prism software | GraphPad Prism (https://graphpad.com) | RRID:SCR_015807 | Version 8.4.3 |
| Software, algorithm | ImageJ software | ImageJ (http://imagej.nih.gov/ij/) | RRID:SCR_003070 | |
| Other | DAPI stain | Sigma | D9542 | (1 µg/mL) |
| Other | ZEG and ZEG chips | wFluidx, Inc | http://www.wfluidx.com |
Additional files
Download links
A two-part list of links to download the article, or parts of the article, in various formats.
Downloads (link to download the article as PDF)
Open citations (links to open the citations from this article in various online reference manager services)
Cite this article (links to download the citations from this article in formats compatible with various reference manager tools)
Vanishing white matter disease expression of truncated EIF2B5 activates induced stress response
eLife 9:e56319.
https://doi.org/10.7554/eLife.56319


