Therapeutic effects of anodal transcranial direct current stimulation in a rat model of ADHD
- Department of Korean Medical Science, School of Korean Medicine, Pusan National University, Republic of Korea
- Graduate Training Program of Korean Medicine for Healthy Aging, Pusan National University, Republic of Korea
- Korean Medical Science Research Center for Healthy Aging, Pusan National University, Republic of Korea
- Department of Radiological Science, Health Science Division, Dongseo University, Republic of Korea
- Department of Korean Pediatrics, School of Korean Medicine, Pusan National University, Republic of Korea
- Department of Rehabilitation Medicine, School of Medicine, Pusan National University, Republic of Korea
Figures
Figure 1 with 2 supplements
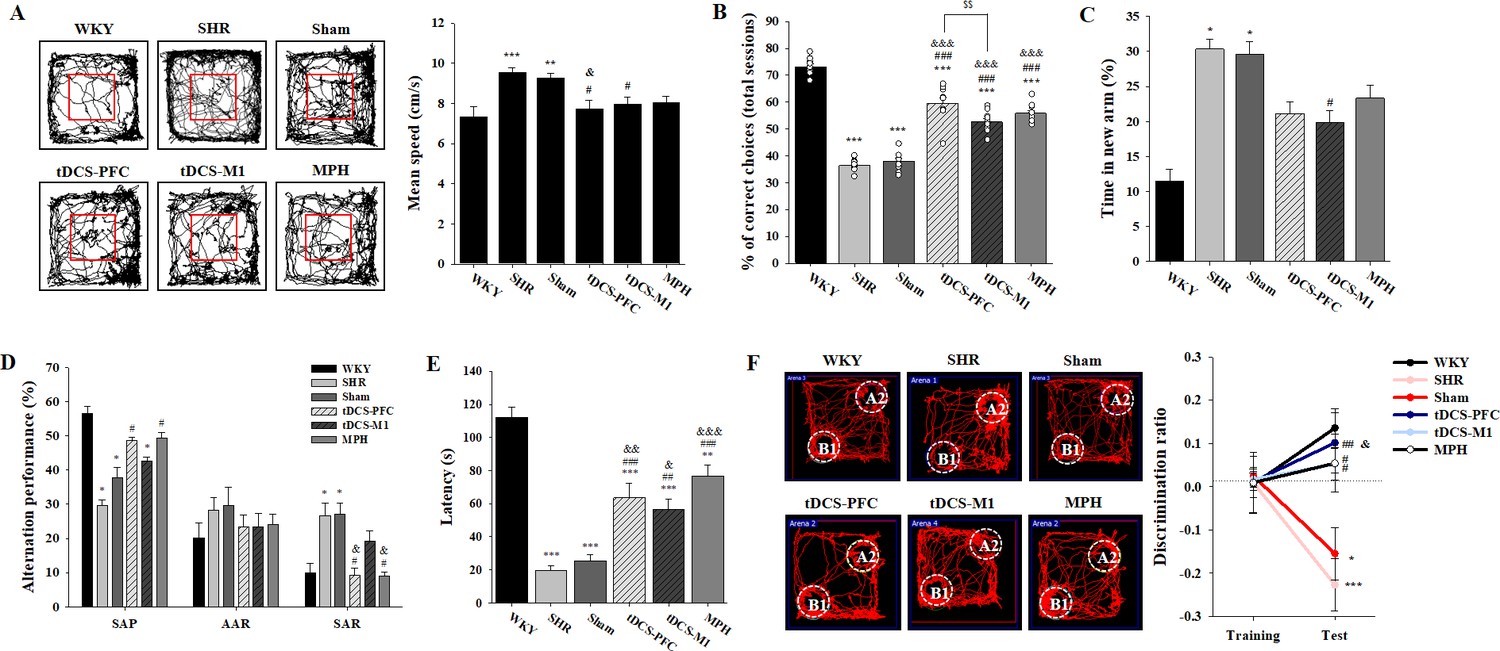
Effects of HD-tDCS application on cognitive behaviors in a rat model of ADHD.
(A) Performance and mean speed on the open-field test. Hyperactivity in the open-field test was significantly reduced in the tDCS-PFC group compared with the sham group (n = 8). (B) A DNMTP of the T-maze results, total % of correct choices for 10 sessions. The % correct choices were significantly higher in all HD-tDCS and MPH-treated groups compared to the sham group (n = 7). (C) Modified Y-maze results, % of time in new arm. The time in the new arm was significantly decreased in the tDCS-M1 group compared with the SHR group (n = 8). (D) Y-maze spontaneous alternation task, % alternation performance of SAP, AAR, and SAR. SAR was significantly lower in the tDCS-PFC and MPH groups compared with the sham group (n = 7). (E) Passive avoidance test, latency. HD-tDCS and MPH-treated groups showed significantly higher latency compared to the sham group (n = 6). (F) Object-place recognition test, representative examples of movement path and discrimination ratio. The tDCS-PFC group showed a marked increase in time spent exploring the novel placed object compared to the sham group (n = 8). SAP; spontaneous alternation performance, AAR; alternate arm return. Data are presented as mean ± SEM. *p<0.05, **p<0.01, and ***p<0.001 vs. WKY; #p<0.05, ##p<0.01, and ###p<0.001 vs. SHR; &p<0.05, &&p<0.01, and &&&p<0.001 vs. sham; $$p<0.01 vs. tDCS-PFC.
-
Figure 1—source data 1
Source files for behavior tests.
This zip archive contains all source data on the cognitive behaviors shown in Figure 1.
- https://cdn.elifesciences.org/articles/56359/elife-56359-fig1-data1-v2.zip
Figure 1—figure supplement 1
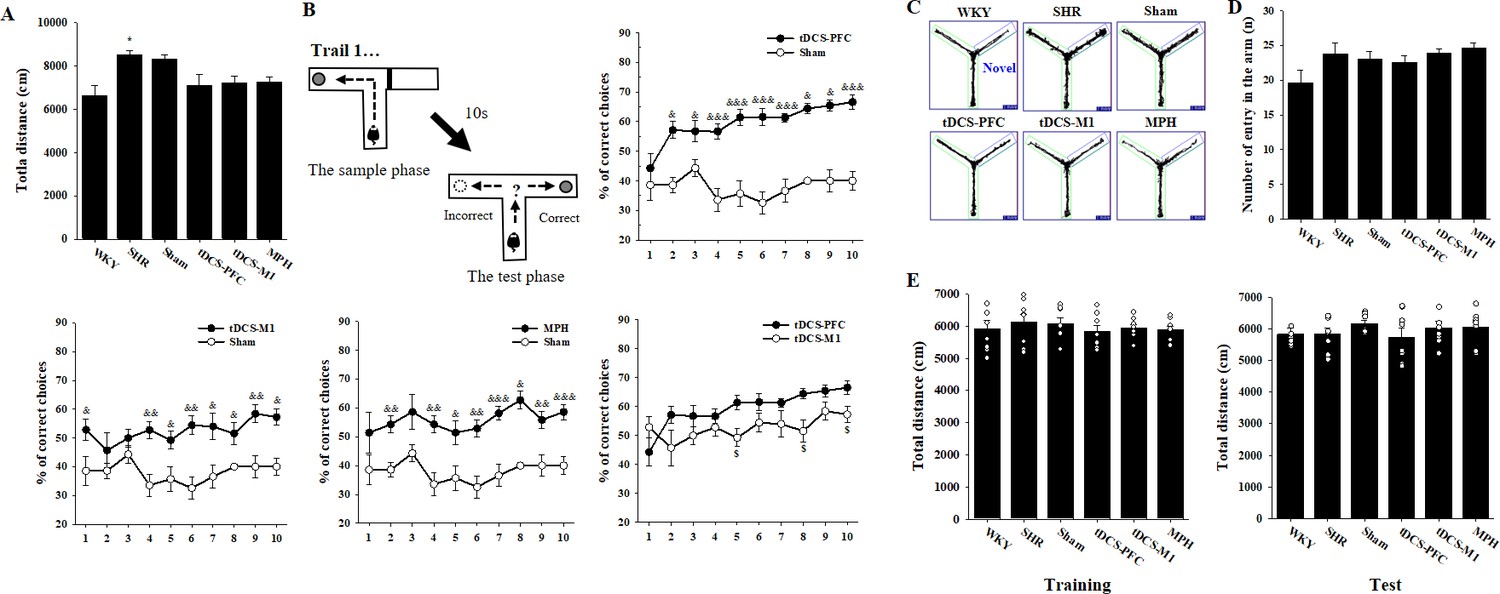
Additional data on cognitive behavior following HD-tDCS application in our rat model of ADHD.
(A) Open-field test, total distance traveled (n = 8). (B) DNMTP T-maze, comparisons of total % correct choices (n = 7). (C) Modified Y-maze, example of performance image for a 10-min trial (n = 8). (D) Y-maze spontaneous alternation task, number of total arm entries during the 10 min trial (n = 7). (E) Object-place recognition test, mobility as measured by total distance traveled for 10 min during training and test trials (n = 8). Data are presented as mean ± SEM. *p<0.05 vs. WKY; &p<0.05, &&p<0.01 and &&&p<0.001 vs. sham; $p<0.05 vs. tDCS-PFC.
Figure 1—figure supplement 2
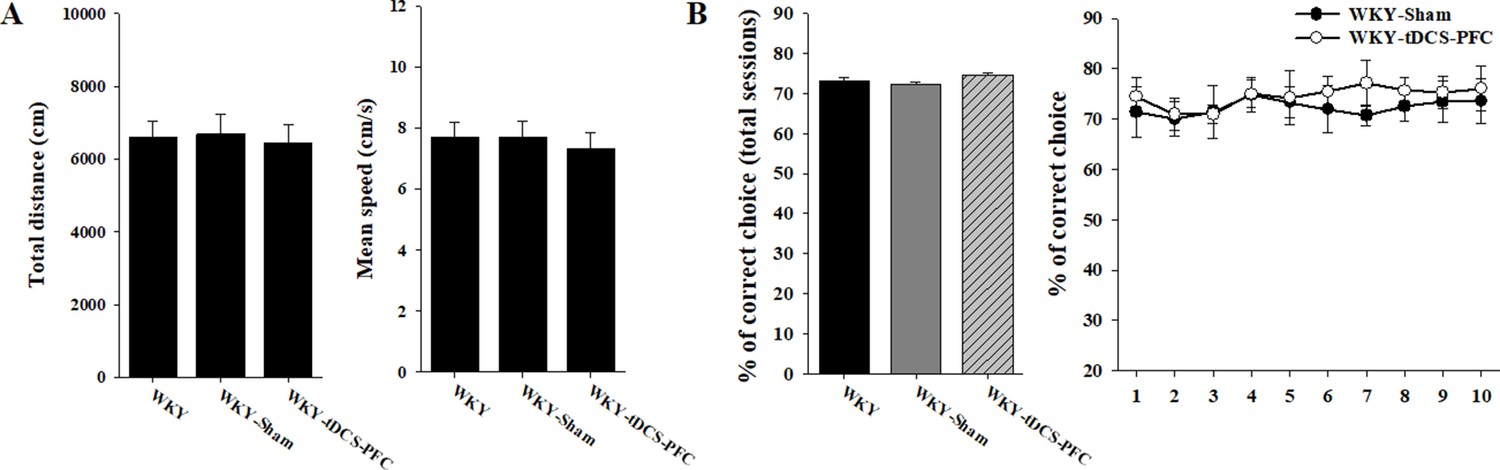
Effects of HD-tDCS application on cognitive behaviors in WKY rats, the genetic control model of ADHD.
(A) Open-field test, total distance, and mean speed traveled (n = 5). (B) DNMTP T-maze, total % of correct choices for 10 sessions, and comparisons of % correct choices to the WKY-sham and the WKY-tDCS-PFC groups (n = 5). Data are presented as mean ± SEM.
Figure 2 with 2 supplements
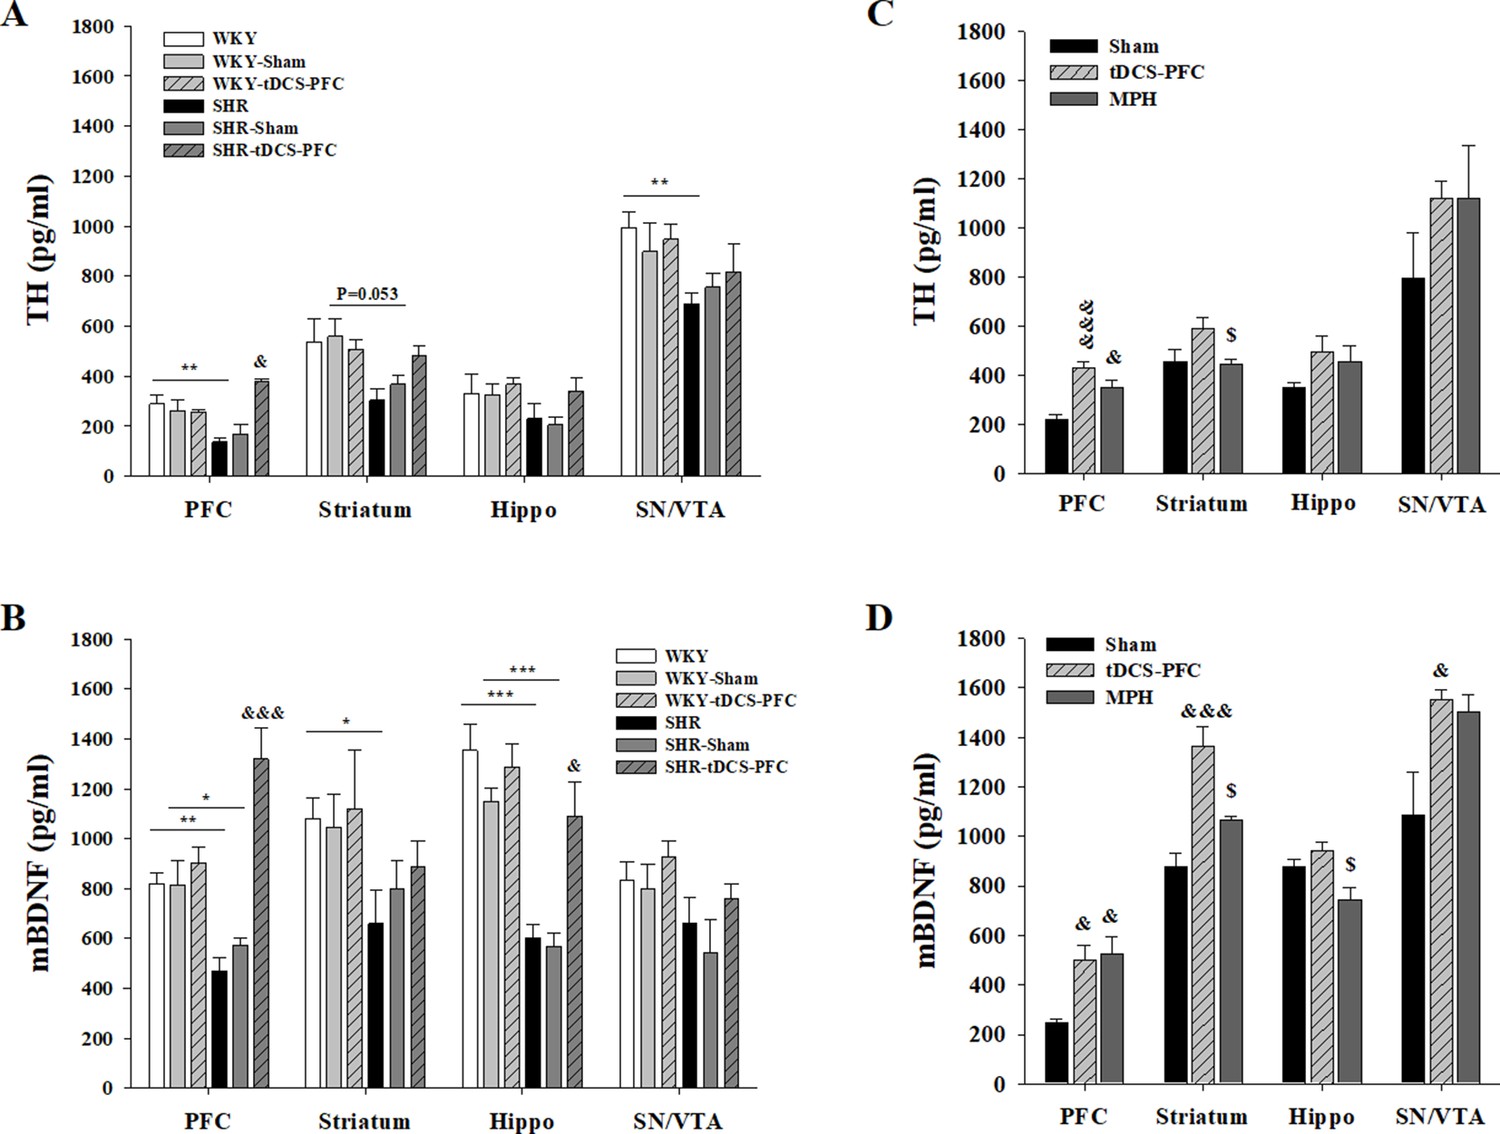
Effect of HD-tDCS application over the prefrontal cortex on free TH and mBDNF levels.
(A, B) Free TH and mBDNF levels measured by ELISA at 2 days after the last HD-tDCS application in our ADHD rat model and its WKY control strain (n = 4). In the ADHD rat model, TH and mBDNF levels were significantly increased in the prefrontal cortex in the SHR-tDCS-PFC group compared to the sham group. mBDNF levels were also significantly increased in the hippocampus in the SHR-tDCS-PFC group. (C, D) Free TH and mBDNF levels measured by ELISA at 8 days after the last HD-tDCS application in our rat model of ADHD (n = 4). Levels of TH were significantly increased in the prefrontal cortex in the tDCS-PFC and MPH-treated groups compared to the sham group. mBDNF levels were markedly increased in the prefrontal cortex, striatum, and SN/VTA in the tDCS-PFC group compared to the sham group. Data are presented as the mean ± SEM. &p<0.05 and &&&p<0.001 vs. sham, $p<0.05 vs. tDCS-PFC.
-
Figure 2—source data 1
Source files for quantification of ELISA analysis.
This zip archive contains all source data for ELISA analysis shown in Figure 2.
- https://cdn.elifesciences.org/articles/56359/elife-56359-fig2-data1-v2.zip
Figure 2—figure supplement 1
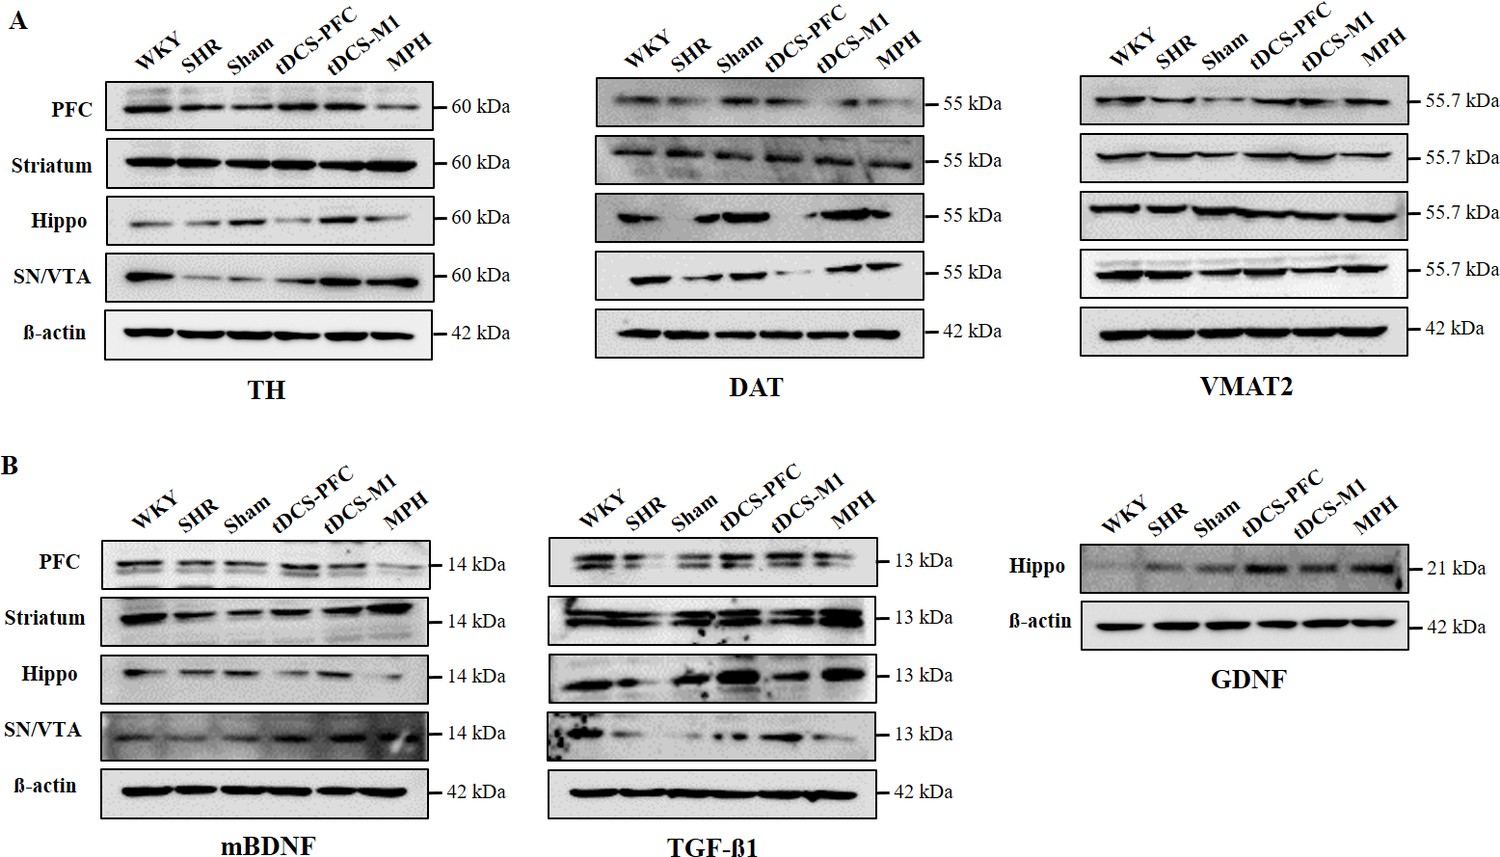
Effect of HD-tDCS on protein expression of dopaminergic neurotransmission factors and NTFs in a rat model of ADHD.
Representative western blots for dopaminergic neurotransmission factors and NTFs (A) TH, DAT, and VMAT2, (B) mBDNF, TGF-ß1, and GDNF in the core regions of dopaminergic projections. β-Actin was used as the loading control.
Figure 2—figure supplement 2
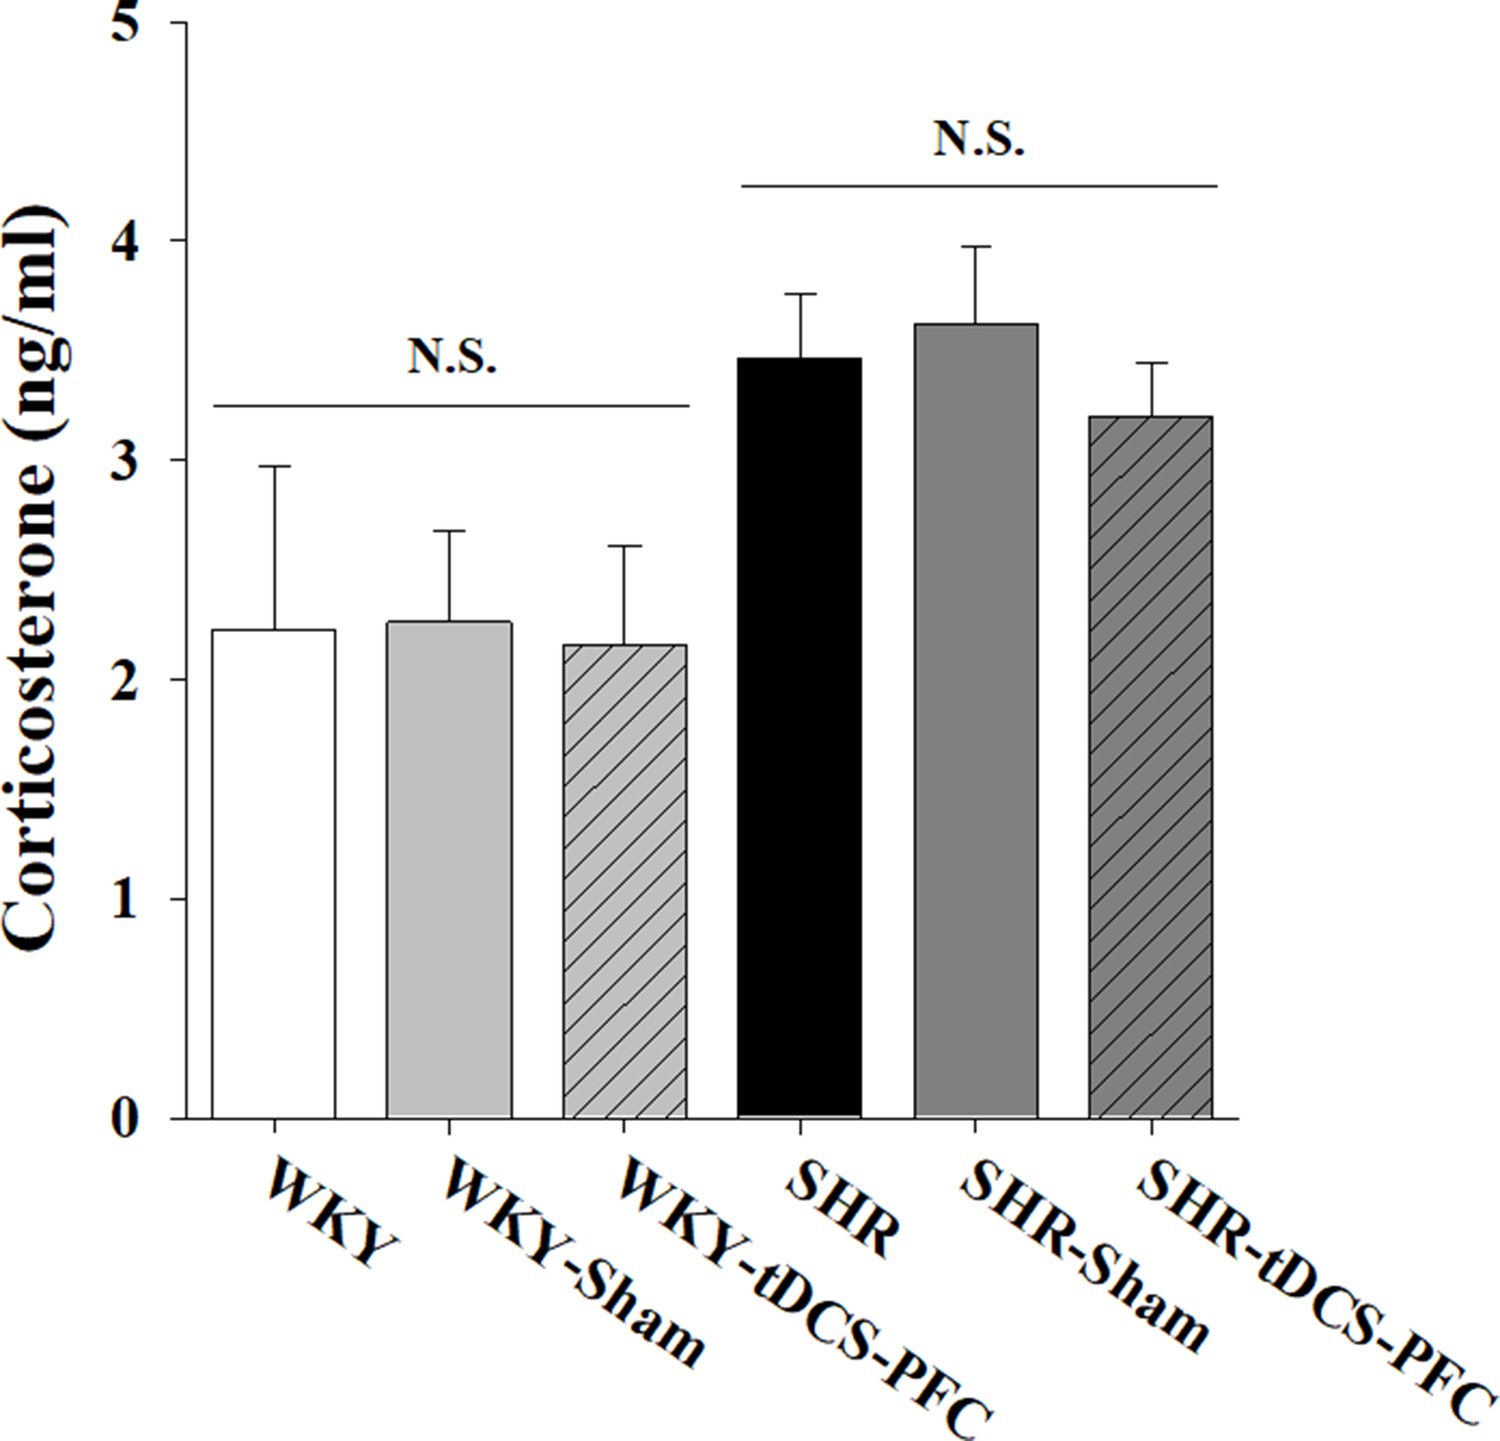
Effect of HD-tDCS application over the prefrontal cortex on corticosterone levels in the plasma of our ADHD rat model and its control strain at 2 days after the last HD-tDCS application.
Free corticosterone levels were measured by ELISA (n = 5). HD-tDCS application did not induce any changes in corticosterone levels in the plasma. Data are presented as the mean ± SEM.
Figure 3 with 2 supplements
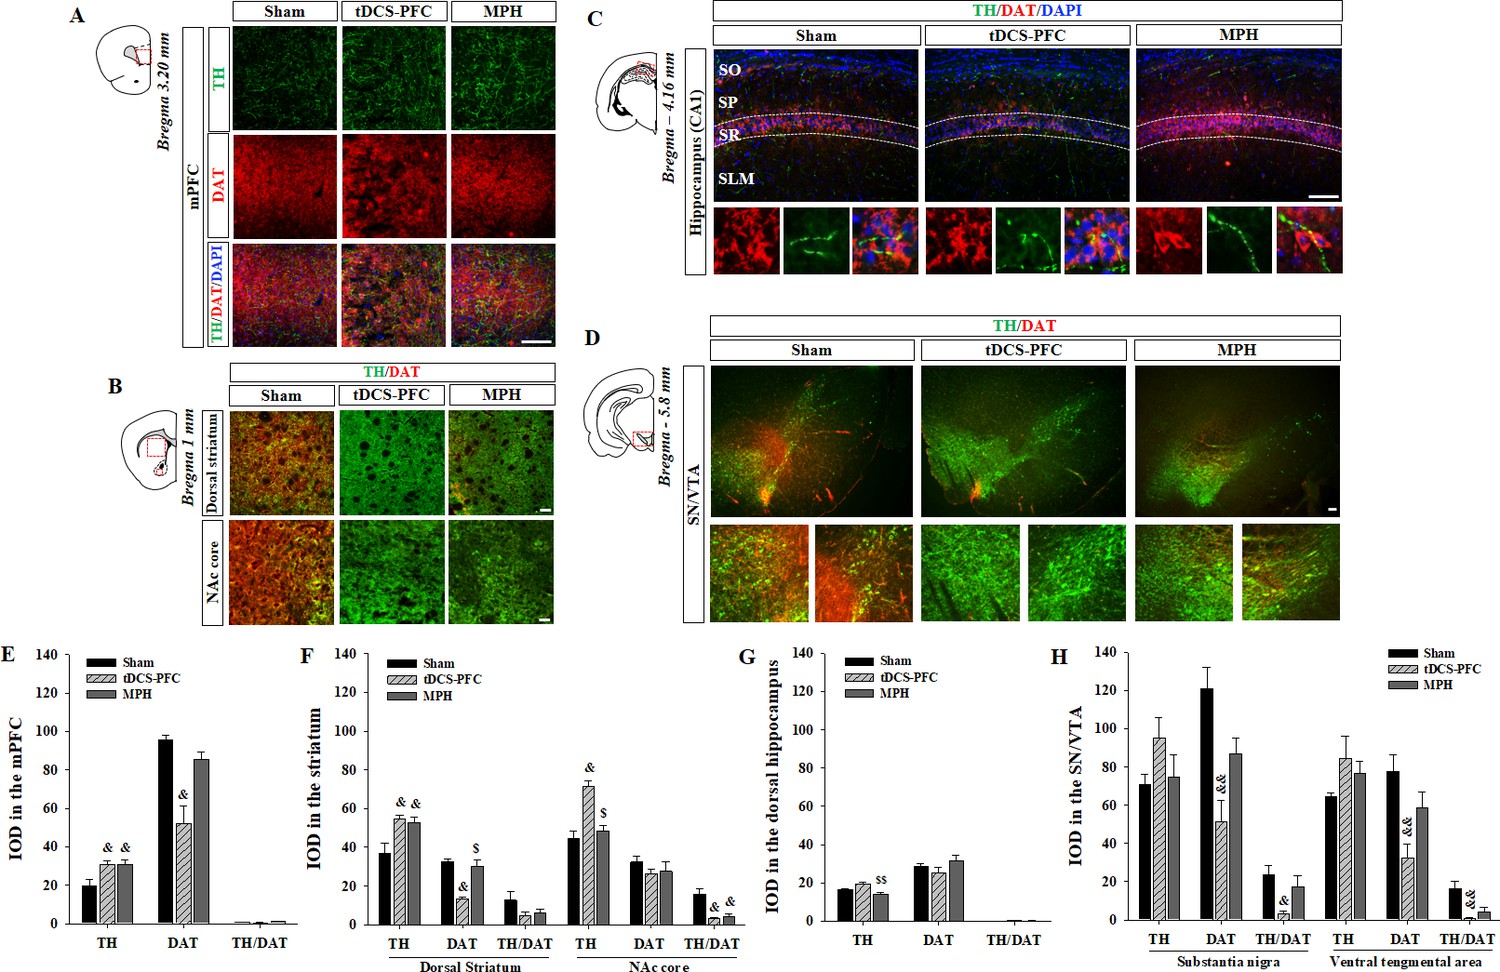
Effect of HD-tDCS application over the prefrontal cortex on TH- and DAT-positive cells in a rat model of ADHD.
(A, E) Photomicrograph and histogram showing the mean IOD of TH- and DAT-positive cells in the medial prefrontal cortex, (B, F) in the striatum, (C, G) in the dorsal hippocampus, and (D, H) in the SN/VTA. The IOD of TH-positive cells was significantly increased in the medial prefrontal cortex and striatum of tDCS-PFC group compared to the sham results. The IOD of DAT-positive cells was significantly decreased in the medial prefrontal cortex, dorsal striatum, and SN/VTA in the tDCS-PFC group compared to the sham results. Data are presented as the mean ± SEM. mPFC, medial prefrontal cortex. &p<0.05 and &&p<0.01 vs. sham, $p<0.05 and $$p<0.01 vs. tDCS-PFC. Scale bar = 100 µm.
-
Figure 3—source data 1
Source file for quantification of Iba1-, TH-, and DAT-positive cells.
This zip archive contains all source data for Iba1-, TH-, and DAT-positive cells analysis shown in Figure 3, and Figure 3—figure supplements 1 and 2.
- https://cdn.elifesciences.org/articles/56359/elife-56359-fig3-data1-v2.zip
Figure 3—figure supplement 1

Neuroinflammatory analysis for chronic HD-tDCS application in our rat model of ADHD.
(A) Photomicrograph and (B) histogram showing the mean number of Iba-1-positive cells in the prefrontal cortex (PFC) and the primary motor cortex (M1). Numbers in the PFC were significantly reduced in the SHR-tDCS group compared to those observed in the SHR group. Data are presented as the mean ± SEM. Scale bar = 100 µm.
Figure 3—figure supplement 2
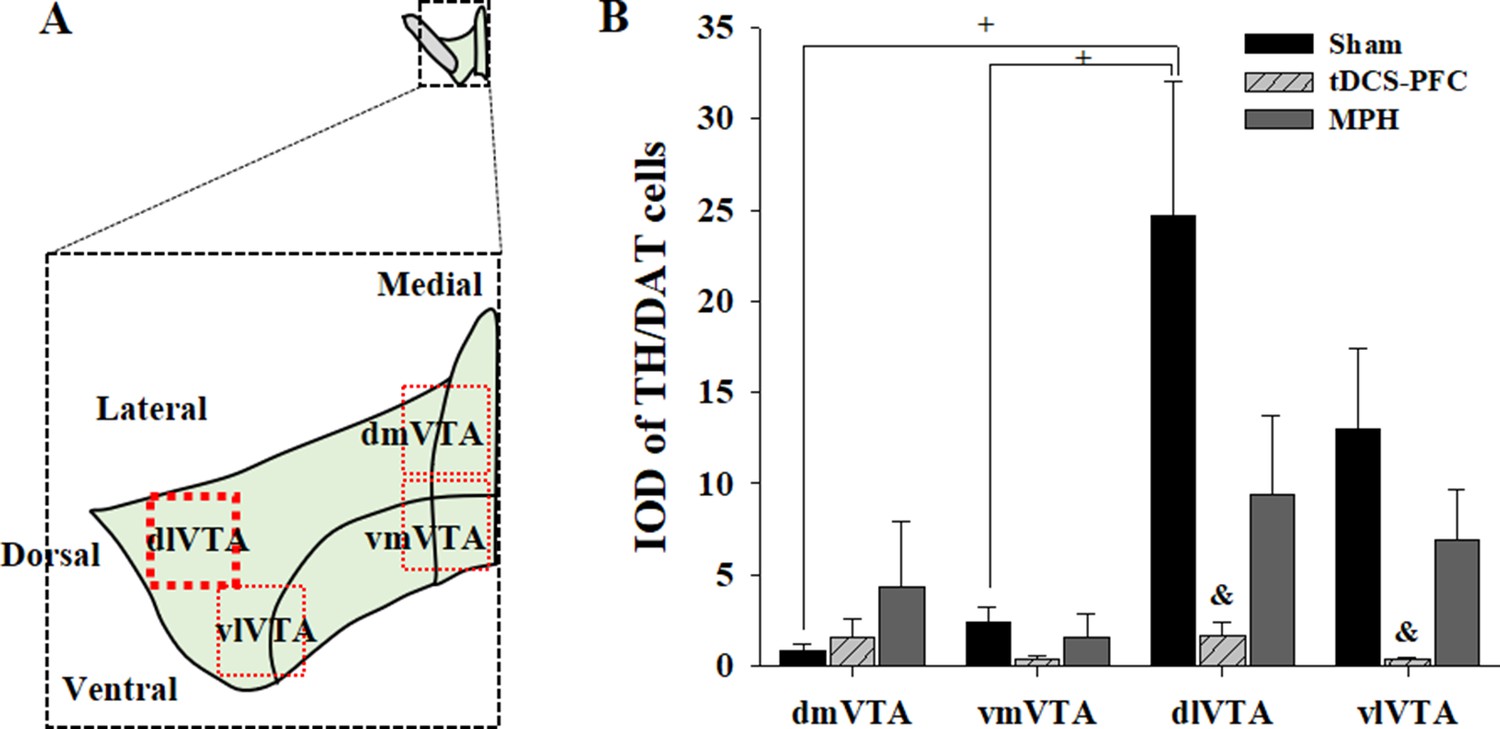
Effect of HD-tDCS application over the prefrontal cortex on the expression of TH/DAT double-positive cells in the VTA in a rat model of ADHD.
(A) Illustration depicting the distribution of TH/DAT-positive cells and (B) histogram showing the mean IOD of TH/DAT-positive cells. Data are presented as the mean ± SEM. TH/DAT double-positive cells in the sham group showed higher distributions in the lateral VTA than in the medial VTA, and cell numbers in the lateral region were significantly decreased following HD-tDCS application, compared to the sham results. dmVTA, dorsomedial VTA; vmVTA, ventromedial VTA; dlVTA, dorsolateral VTA; vlVTA, ventrolateral VTA. &p<0.05 vs. sham; +p<0.05 vs. dlVTA.
Figure 4
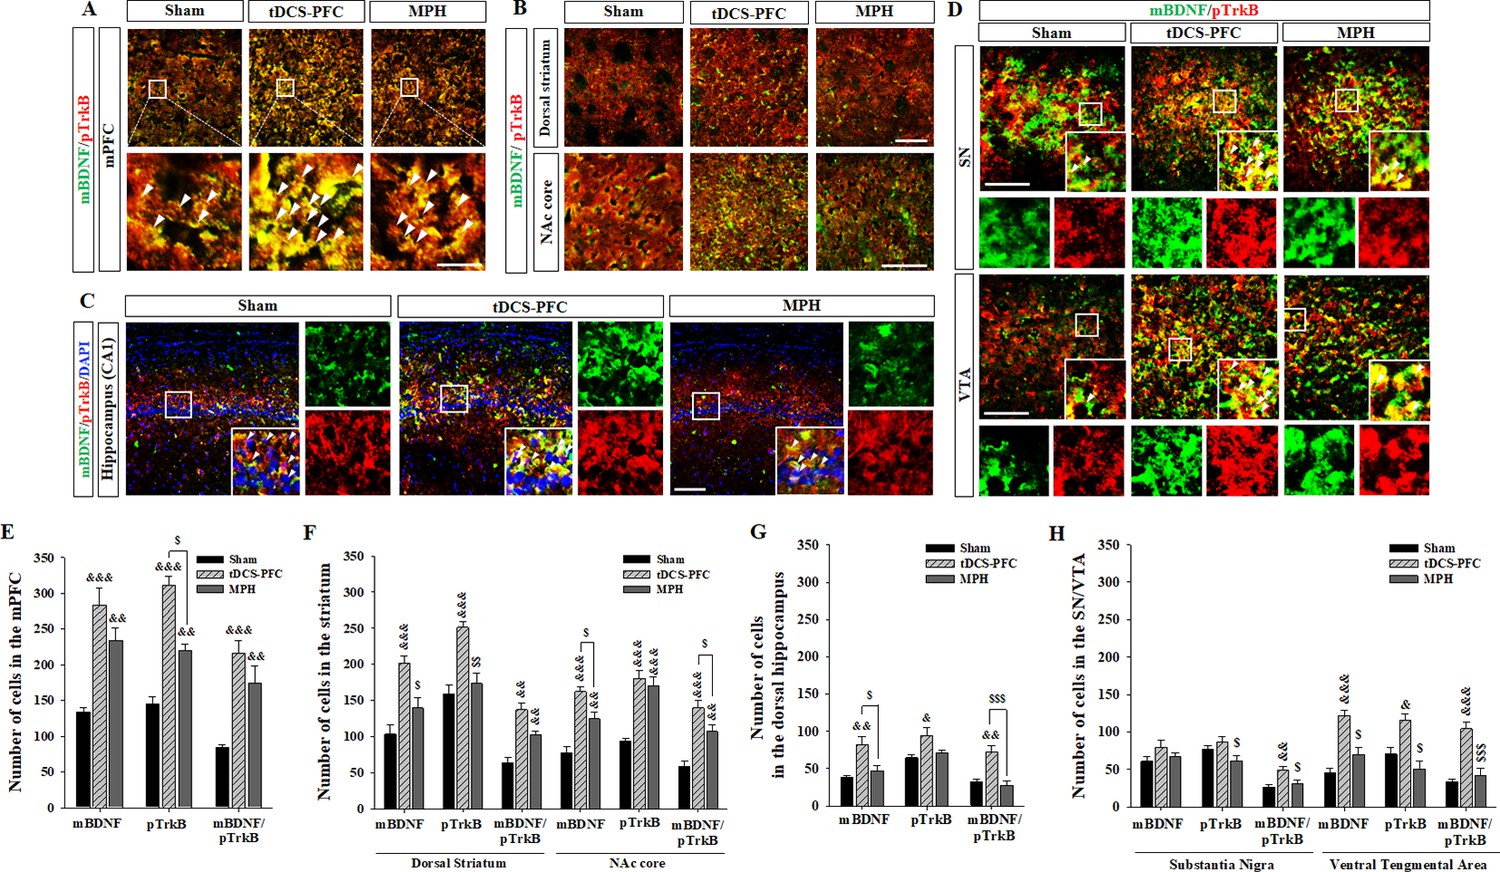
Effects of HD-tDCS application over the prefrontal cortex on mBDNF- and pTrkB-positive cells in our rat model of ADHD.
(A, E) Photomicrograph and histogram showing the mean number of mBDNF- and pTrkB-positive cells in the medial prefrontal cortex, (B, F) in the striatum, (C, G) in the dorsal hippocampus, and (D, H) in the SN/VTA. The mBDNF- and pTrkB-positive cells were significantly increased in the tDCS-PFC group compared to the sham animals at all sites except the SN. Significantly more mBDNF/pTrkB double-positive cells were also detected in the SN. Data are presented as the mean ± SEM. &p<0.05, &&p<0.01 and &&&p<0.001 vs. sham; $p<0.05, $$p<0.01 and $$$p<0.001 vs. tDCS-PFC. Scale bar = 100 µm.
-
Figure 4—source data 1
Source files for quantification of BDNF and its activated receptor.
This file contains all source data for BDNF and its activated receptor shown in Figure 4.
- https://cdn.elifesciences.org/articles/56359/elife-56359-fig4-data1-v2.xlsx
Figure 5
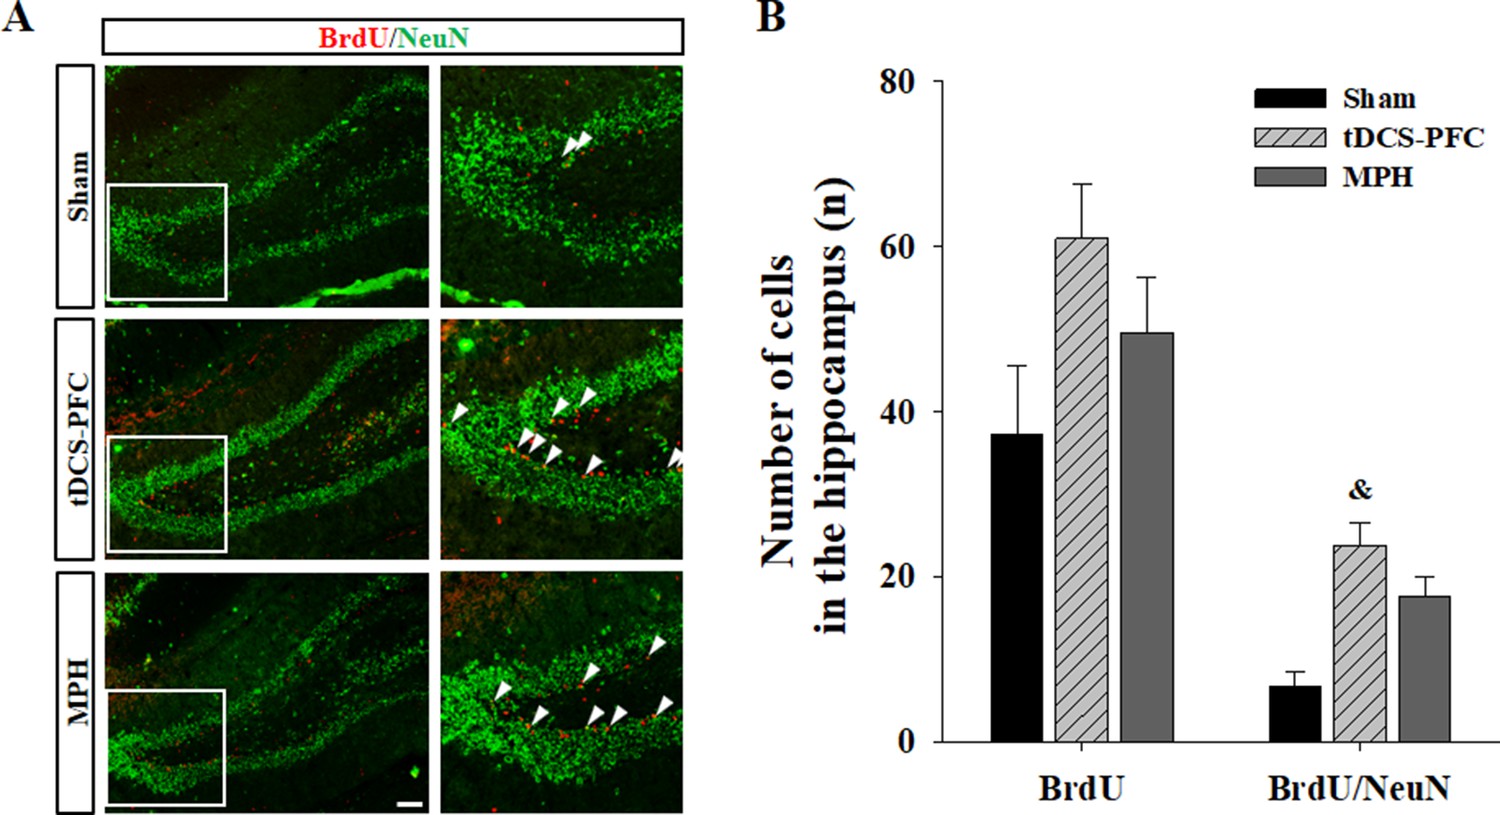
Effect of HD-tDCS application over the prefrontal cortex on hippocampal neurogenesis in our rat model of ADHD.
(A, B) Photomicrograph and histogram showing the mean number of BrdU - and NeuN-positive cells in the dentate gyrus of the hippocampus. The number of BrdU/NeuN double-positive cells was significantly higher in the tDCS-PFC group compared to the sham animals. Data are presented as the mean ± SEM. &p<0.05 vs. sham. Scale bar = 100 µm.
-
Figure 5—source data 1
Source files for quantification of BrdU- and BrdU/NeuN-double-positive cells.
This file contains all source data for BrdU- and BrdU/NeuN-double-positive cells analysis shown in Figure 5.
- https://cdn.elifesciences.org/articles/56359/elife-56359-fig5-data1-v2.xlsx
Figure 6 with 1 supplement
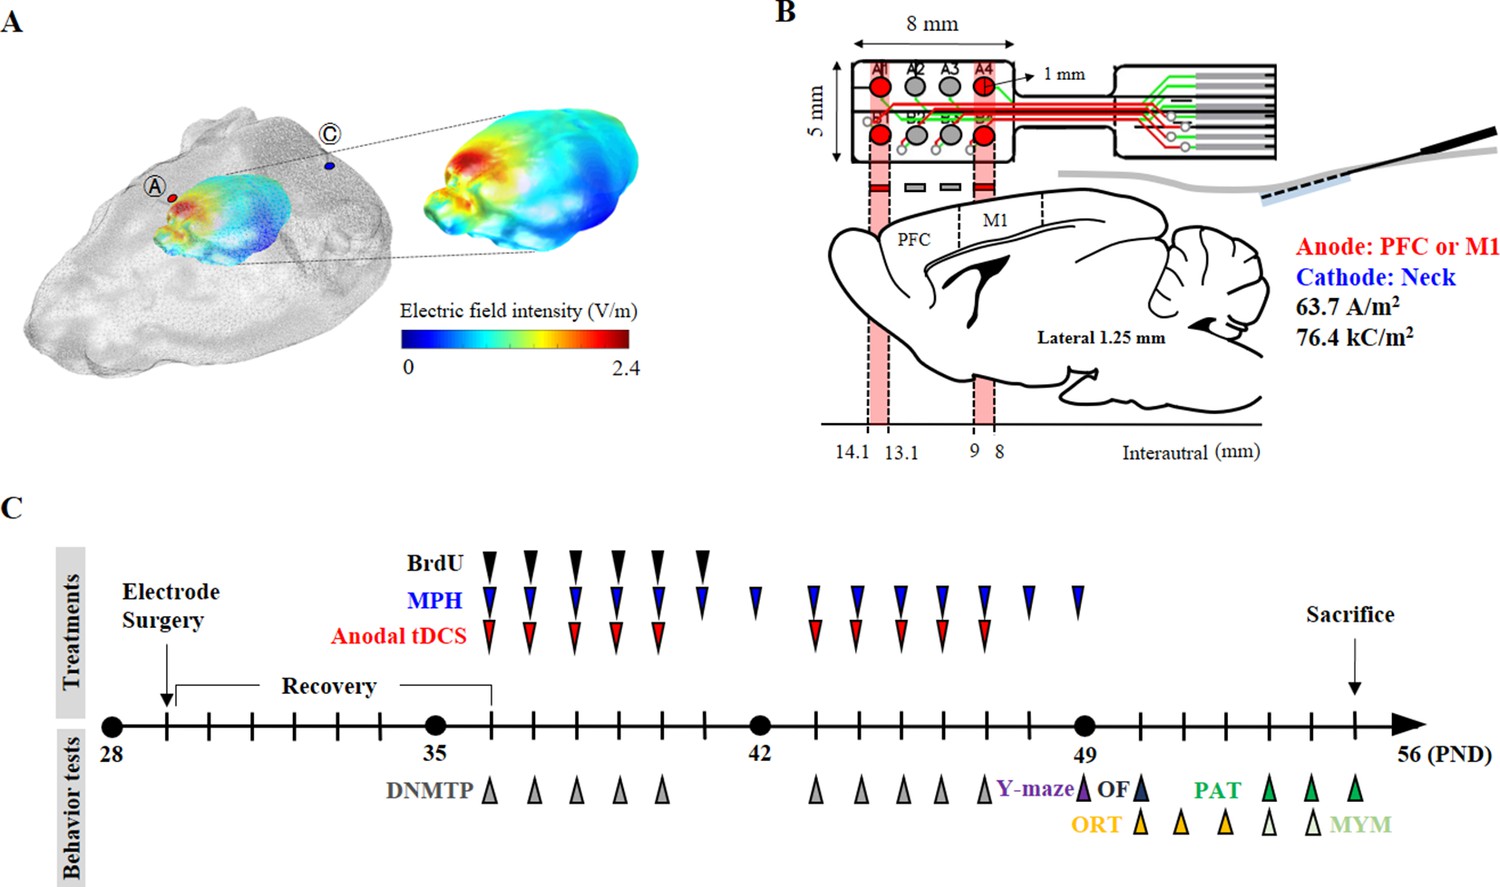
Experimental schematic diagram.
(A) Three-dimensional tDCS simulation over the prefrontal cortex. The highest electric field intensity values are represented in red, and the lowest electric field intensity values are represented in blue. False color: electric field intensity (V/m). Ⓐ, anode electrode; Ⓒ, reference electrode. Anodal stimulation was delivered at an intensity of 63.7 A/m2 over the prefrontal cortex. The predicted peak electric field intensity was 2.4 V/m in the frontal cortex. (B) Schematic diagram showing each electrode position and corresponding cerebral cortical region. The anodal stimulation was pointed over the frontal cortex and the primary motor cortex via the electrode, and the cathode was positioned on the skin of the neck. (C) The time schedule of HD-tDCS or MPH treatment and behavior tests. OF, open-field test; PAT, passive avoidance test; MYM, modified version of the Y-maze test.
Figure 6—figure supplement 1
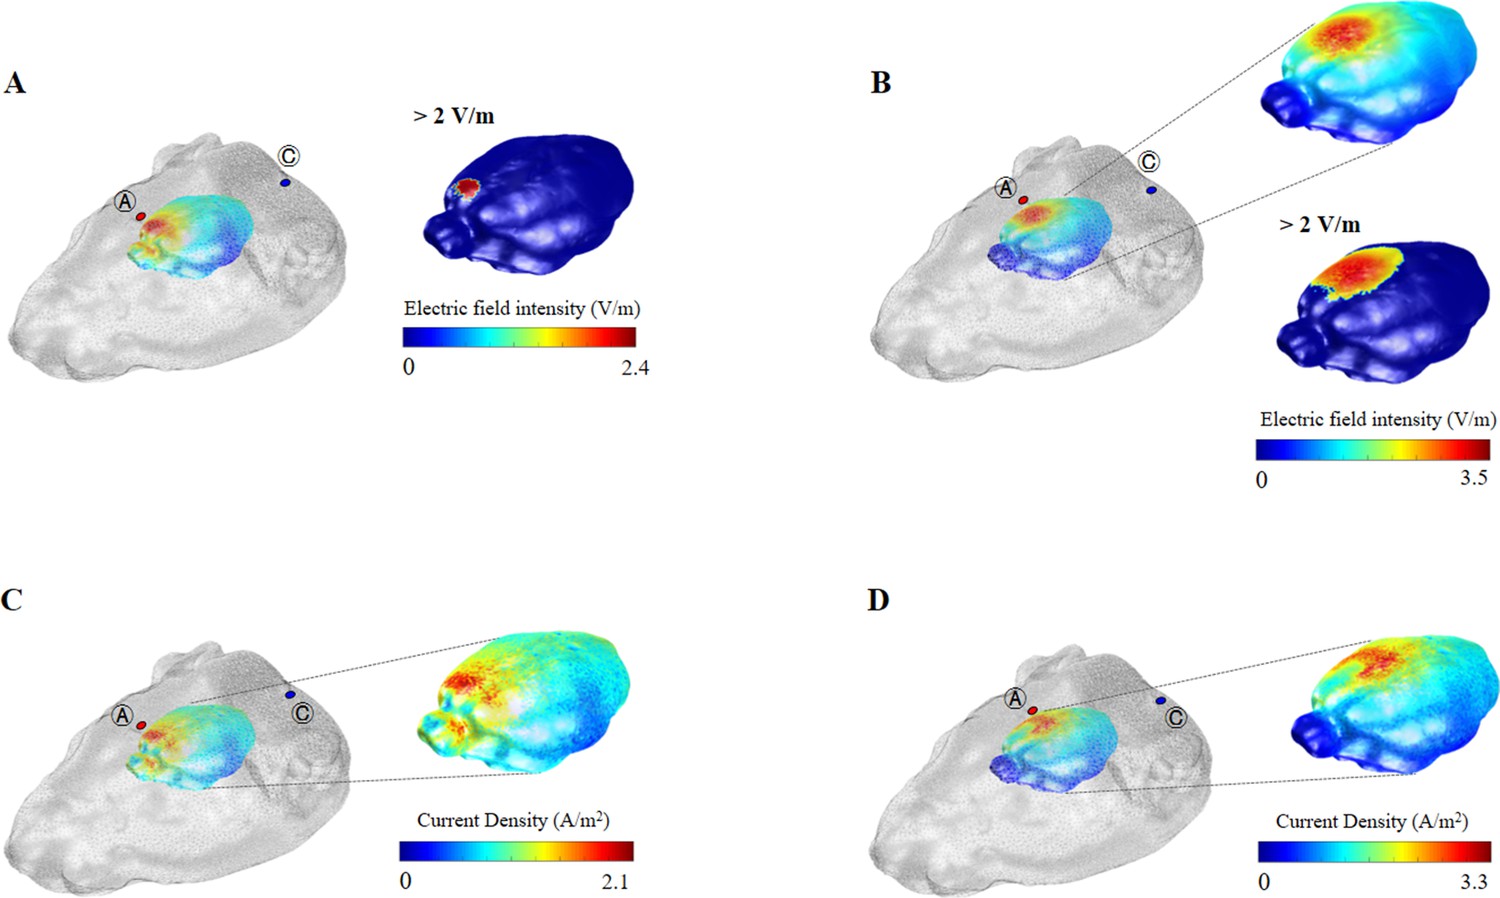
Three-dimensional tDCS simulation over the prefrontal and primary motor cortex.
(A, C) Three-dimensional tDCS simulation over the prefrontal cortex. (B, D) Three-dimensional tDCS simulation over the primary motor cortex. The highest electric field intensity and current density values are represented in red, and the lowest electric field intensity and current density values are represented in blue. False color: electric field intensity (V/m) and current density (A/m2). Ⓐ, anode electrode; Ⓒ, reference electrode. The predicted peak current density was 2.1 A/m2 in the prefrontal cortex. The predicted peak electric field intensity and current density over the primary motor cortex were 3.5 V/m and 3.3 A/m2, respectively. The label ‘>2 V/m’ shows the areas where the electric field is thresholded above 2 V/m, which are localized to the prefrontal and primary motor cortex.
Tables
Table 1
Effect of HD-tDCS on gene expressions of dopaminergic neurotransmission factors in the prefrontal cortex, striatum, hippocampus, and SN/VTA (n = 4).
| Fold change (of WKY) | SHR | Sham | tDCS-PFC | tDCS-M1 | MPH | Sham vs. tDCS-PFC | Sham vs. tDCS-M1 | Sham vs. MPH | PFC vs. M1 |
|---|---|---|---|---|---|---|---|---|---|
| Prefrontal cortex | |||||||||
| TH | 0.29 ± 0.05 | 0.31 ± 0.05 | 0.34 ± 0.04 | 0.26 ± 0.17 | 0.24 ± 0.05 | p=0.493 | p=0.686 | p=0.078 | p=0.486 |
| DAT | 0.34 ± 0.24 | 0.51 ± 0.39 | 0.76 ± 0.69 | 0.50 ± 0.45 | 0.59 ± 0.38 | p=0.552 | p=0.963 | p=0.783 | p=0.544 |
| F(1,6)=0.397 | F(1,6)=0.00237 | F(1,6)=0.0828 | F(1,6)=0.413 | ||||||
| VMAT2 | 0.19 ± 0.03 | 0.13 ± 0.08 | 0.31 ± 0.11 | 0.23 ± 0.18 | 0.20 ± 0.02 | p=0.040 | p=0.355 | p=0.343 | p=0.475 |
| F(1,6)=6.800 | F(1,6)=1.002 | F(1,6)=0.579 | |||||||
| Striatum | |||||||||
| TH | 0.50 ± 0.16 | 0.67 ± 0.21 | 0.63 ± 0.10 | 1.14 ± 0.33 | 1.37 ± 0.24 | p=0.778 | p=0.054 | p=0.005 | p=0.027 |
| F(1,6)=0.0868 | F(1,6)=5.724 | F(1,6)=19.243 | F(1,6)=8.493 | ||||||
| DAT | 1.38 ± 0.58 | 1.32 ± 0.23 | 0.41 ± 0.17 | 1.01 ± 0.34 | 0.77 ± 0.14 | p=<0.001 | p=0.176 | p=0.006 | p=0.029 |
| F(1,6)=41.344 | F(1,6)=2.349 | F(1,6)=17.006 | |||||||
| VMAT2 | 0.33 ± 0.25 | 0.63 ± 0.27 | 0.36 ± 0.17 | 1.00 ± 0.80 | 0.67 ± 0.41 | p=0.140 | p=0.886 | p=0.870 | p=0.343 |
| F(1,6)=2.891 | F(1,6)=0.0292 | ||||||||
| Hippocampus | |||||||||
| TH | 0.47 ± 0.15 | 0.45 ± 0.21 | 0.80 ± 0.28 | 0.62 ± 0.17 | 0.44 ± 0.06 | p=0.091 | p=0.242 | p=1.000 | p=0.320 |
| F(1,6)=4.061 | F(1,6)=1.683 | F(1,6)=1.173 | |||||||
| DAT | 1.42 ± 0.44 | 1.48 ± 0.38 | 0.60 ± 0.16 | 0.92 ± 0.17 | 1.16 ± 0.60 | p=0.005 | p=0.037 | p=0.397 | p=0.031 |
| F(1,6)=18.468 | F(1,6)=7.101 | F(1,6)=0.831 | F(1,6)=7.884 | ||||||
| VMAT2 | 0.51 ± 0.18 | 0.56 ± 0.27 | 0.92 ± 0.34 | 0.79 ± 0.25 | 0.48 ± 0.08 | p=0.147 | p=0.246 | p=0.597 | p=0.574 |
| F(1,6)=2.776 | F(1,6)=1.650 | F(1,6)=0.311 | F(1,6)=0.353 | ||||||
| SN/VTA | |||||||||
| TH | 0.32 ± 0.04 | 0.30 ± 0.18 | 1.09 ± 0.57 | 0.46 ± 0.28 | 0.65 ± 0.41 | p=0.039 | p=0.343 | p=0.343 | p=0.094 |
| F(1,6)=6.880 | F(1,6)=3.947 | ||||||||
| DAT | 1.20 ± 0.20 | 1.62 ± 0.55 | 0.58 ± 0.18 | 0.85 ± 0.13 | 1.02 ± 0.47 | p=0.011 | p=0.034 | p=0.146 | p=0.056 |
| F(1,6)=12.964 | F(1,6)=7.526 | F(1,6)=2.781 | F(1,6)=5.618 | ||||||
| VMAT2 | 0.22 ± 0.08 | 0.49 ± 0.27 | 0.92 ± 0.53 | 1.00 ± 0.47 | 0.89 ± 0.46 | p=0.343 | p=0.111 | p=0.175 | p=0.843 |
| F(1,6)=3.499 | F(1,6)=2.362 | F(1,6)=0.0428 | |||||||
-
Expression of the TH, DAT, and VMAT2 genes, expressed as fold changes of WKY. Data represent the mean ± SEM. Data were analyzed using ANOVA for repeated measures, followed by Tukey's tests for multiple comparisons. p<0.05 was considered statistically significant; significant results are highlighted in bold.
Table 2
Effect of HD-tDCS on gene expressions of NTFs in the prefrontal cortex, striatum, hippocampus, and SN/VTA (n = 4–5).
| Fold change (of WKY) | SHR | Sham | tDCS-PFC | tDCS-M1 | MPH | Sham vs. tDCS-PFC | Sham vs. tDCS-M1 | Sham vs. MPH | PFC vs. M1 | |
|---|---|---|---|---|---|---|---|---|---|---|
| Prefrontal cortex | ||||||||||
| BDNF | 1.15 ± 0.31 | 0.87 ± 0.11 | 1.23 ± 0.48 | 1.65 ± 0.39 | 0.89 ± 0.38 | p=0.146 | p=0.003 | p=0.929 | p=0.162 | |
| F(1,8)=2.595 | F(1,8)=18.279 | F(1,8)=0.00857 | F(1,8)=2.373 | |||||||
| TFG-ß1 | 1.37 ± 0.35 | 1.07 ± 0.12 | 1.82 ± 0.75 | 0.88 ± 0.33 | 1.16 ± 0.27 | p=0.056 | p=0.260 | p=0.507 | p=0.033 | |
| F(1,8)=1.467 | F(1,8)=0.483 | F(1,8)=6.576 | ||||||||
| GDNF | 1.13 ± 0.37 | 1.05 ± 0.23 | 0.68 ± 0.17 | 0.86 ± 0.25 | 0.80 ± 0.18 | p=0.022 | p=0.262 | p=0.095 | p=0.022 | |
| F(1,8)=8.090 | F(1,8)=1.456 | F(1,8)=3.586 | F(1,8)=8.090 | |||||||
| NGF | 1.22 ± 0.31 | 1.51 ± 0.12 | 1.49 ± 0.30 | 1.19 ± 0.37 | 1.44 ± 0.43 | p=0.904 | p=0.104 | p=0.722 | p=0.197 | |
| F(1,8)=0.0154 | F(1,8)=3.360 | F(1,8)=0.136 | F(1,8)=1.980 | |||||||
| NT3 | 0.69 ± 0.24 | 0.64 ± 0.12 | 0.40 ± 0.08 | 0.59 ± 0.12 | 0.51 ± 0.11 | p=0.006 | p=0.586 | p=0.119 | p=0.017 | |
| F(1,8)=13.944 | F(1,8)=0.321 | F(1,8)=3.042 | F(1,8)=8.977 | |||||||
| Striatum | ||||||||||
| BDNF | 1.65 ± 0.67 | 1.65 ± 0.57 | 2.69 ± 1.07 | 1.75 ± 1.02 | 0.76 ± 0.58 | p=0.090 | p=0.852 | p=0.041 | p=0.192 | |
| F(1,8)=3.707 | F(1,8)=0.0372 | F(1,8)=5.884 | F(1,8)=2.035 | |||||||
| TFG-ß1 | 0.69 ± 0.42 | 0.95 ± 0.33 | 2.61 ± 0.72 | 0.94 ± 0.04 | 1.02 ± 0.21 | p=0.002 | p=1.000 | p=0.710 | p=0.008 | |
| F(1,8)=21.618 | F(1,8)=0.148 | |||||||||
| GDNF | 0.87 ± 0.17 | 1.19 ± 0.34 | 1.66 ± 0.58 | 1.17 ± 0.31 | 1.64 ± 0.25 | p=1.2368 | p=0.927 | p=0.046 | p=0.132 | |
| F(1,8)=2.475 | F(1,8)=0.00895 | F(1,8)=5.585 | F(1,8)=2.805 | |||||||
| NGF | 1.27 ± 0.68 | 1.41 ± 0.45 | 1.67 ± 0.82 | 1.19 ± 0.35 | 1.35 ± 0.34 | p=0.550 | p=0.430 | p=0.835 | p=0.270 | |
| F(1,8)=0.390 | F(1,8)=0.691 | F(1,8)=0.0464 | F(1,8)=1.404 | |||||||
| NT3 | 0.85 ± 0.35 | 0.60 ± 0.09 | 0.25 ± 0.12 | 0.97 ± 0.32 | 0.61 ± 0.29 | p=<0.001 | p=0.035 | p=0.943 | p=0.001 | |
| F(1,8)=27.650 | F(1,8)=6.386 | F(1,8)=0.00554 | F(1,8)=22.822 | |||||||
| Hippocampus | ||||||||||
| BDNF | 1.96 ± 0.26 | 1.89 ± 0.58 | 4.27 ± 1.67 | 3.27 ± 0.70 | 2.31 ± 0.27 | p=0.008 | p=0.032 | p=0.183 | p=0.151 | |
| F(1,8)=2.122 | ||||||||||
| TFG-ß1 | 0.98 ± 0.31 | 0.74 ± 0.27 | 1.14 ± 0.31 | 1.44 ± 0.33 | 0.87 ± 0.07 | p=0.062 | p=0.006 | p=0.690 | p=0.095 | |
| F(1,8)=4.704 | F(1,8)=13.400 | |||||||||
| GDNF | 1.03 ± 0.23 | 0.72 ± 0.11 | 1.67 ± 0.59 | 0.82 ± 0.17 | 0.84 ± 0.10 | p=0.029 | p=0.384 | p=0.173 | p=0.029 | |
| F(1,6)=0.882 | F(1,6)=2.387 | |||||||||
| NGF | 1.16 ± 0.30 | 0.91 ± 0.31 | 2.85 ± 0.92 | 2.46 ± 0.23 | 1.59 ± 0.20 | p=0.007 | P=<0.001 | p=0.011 | p=0.448 | |
| F(1,6)=15.973 | F(1,6)=63.722 | F(1,6)=13.366 | F(1,6)=0.660 | |||||||
| NT3 | 1.17 ± 0.15 | 1.09 ± 0.27 | 1.77 ± 0.75 | 1.74 ± 0.27 | 1.42 ± 0.15 | p=0.093 | p=0.005 | p=0.041 | p=0.935 | |
| F(1,8)=3.637 | F(1,8)=14.400 | F(1,8)=5.931 | F(1,8)=0.00709 | |||||||
| SN/VTA | ||||||||||
| BDNF | 1.02 ± 0.18 | 1.28 ± 0.13 | 1.74 ± 0.42 | 1.69 ± 0.33 | 1.42 ± 0.54 | p=0.114 | p=0.062 | p=0.641 | p=0.846 | |
| F(1,6)=5.217 | F(1,6)=0.241 | F(1,6)=0.0412 | ||||||||
| TFG-ß1 | 0.49 ± 0.14 | 0.56 ± 0.09 | 0.86 ± 0.12 | 0.63 ± 0.12 | 0.75 ± 0.19 | p=0.008 | p=0.373 | p=0.119 | p=0.042 | |
| F(1,6)=14.868 | F(1,6)=0.928 | F(1,6)=3.303 | F(1,6)=6.629 | |||||||
| GDNF | 0.52 ± 0.04 | 0.57 ± 0.04 | 1.00 ± 0.26 | 0.51 ± 0.05 | 0.96 ± 0.16 | p=0.156 | p=0.428 | p=0.061 | p=0.118 | |
| F(1,6)=2.635 | F(1,6)=0.723 | F(1,6)=5.299 | F(1,6)=3.331 | |||||||
| NGF | 1.24 ± 0.14 | 0.93 ± 0.07 | 0.62 ± 0.41 | 0.98 ± 0.35 | 1.24 ± 0.98 | p=0.188 | p=0.764 | p=0.486 | p=0.200 | |
| F(1,6)=2.209 | F(1,6)=0.0991 | |||||||||
| NT3 | 1.13 ± 0.35 | 1.21 ± 0.07 | 0.79 ± 0.48 | 1.55 ± 0.96 | 1.45 ± 0.60 | p=0.343 | p=0.486 | p=1.000 | p=0.486 | |
-
Expression of the BDNF, TGF- β1, GDNF, NGF, and NT3 genes, expressed as fold changes of WKY. Data represent the mean ± SEM. Data were analyzed using ANOVA for repeated measures, followed by Tukey's tests for multiple comparisons. p<0.05 was considered statistically significant; significant results are highlighted in bold.
Table 3
Effect of HD-tDCS on protein expression of dopaminergic neurotransmission factors in the prefrontal cortex, striatum, hippocampus, and SN/VTA (n = 5).
| % of WKY | SHR | Sham | tDCS-PFC | tDCS-M1 | MPH | Sham vs. tDCS-PFC | Sham vs. tDCS-M1 | Sham vs. MPH | PFC vs. M1 | |
|---|---|---|---|---|---|---|---|---|---|---|
| Prefrontal cortex | ||||||||||
| TH | 53.52 ± 31.75 | 82.28 ± 43.03 | 100.94 ± 26.54 | 98.30 ± 43.88 | 65.79 ± 18.48 | p=0.43 | p=0.58 | p=0.45 | p=0.91 | |
| F(1,8)=0.68 | F(1,8)=0.34 | F(1,8)=0.62 | F(1,8)=0.01 | |||||||
| DAT | 89.41 ± 52.58 | 108.69 ± 31.93 | 89.63 ± 39.41 | 83.32 ± 32.20 | 86.40 ± 27.72 | p=0.43 | p=0.25 | p=0.27 | p=0.79 | |
| F(1,8)=0.70 | F(1,8)=1.56 | F(1,8)=1.39 | F(1,8)=0.08 | |||||||
| VMAT2 | 71.61 ± 48.26 | 57.09 ± 24.08 | 76.33 ± 20.62 | 71.56 ± 40.23 | 70.45 ± 29.33 | p=0.21 | p=0.51 | p=0.45 | p=0.82 | |
| F(1,8)=1.84 | F(1,8)=0.48 | F(1,8)=0.62 | F(1,8)=0.06 | |||||||
| Striatum | ||||||||||
| TH | 103.70 ± 15.14 | 95.96 ± 11.46 | 101.56 ± 22.61 | 91.96 ± 11.52 | 103.76 ± 21.11 | p=0.63 | p=0.55 | p=0.49 | p=0.42 | |
| F(1,8)=0.24 | F(1,8)=0.53 | F(1,8)=0.72 | ||||||||
| DAT | 117.76 ± 37.47 | 101.44 ± 34.52 | 120.34 ± 71.05 | 101.35 ± 47.65 | 107.57 ± 34.41 | p=0.61 | p=1.0 | p=0.79 | p=0.63 | |
| F(1,8)=0.29 | F(1,8)=0.08 | F(1,8)=0.25 | ||||||||
| VMAT2 | 90.46 ± 57.19 | 66.67 ± 38.56 | 71.25 ± 35.22 | 85.87 ± 56.83 | 73.78 ± 25.00 | p=0.85 | p=0.55 | p=0.74 | p=0.64 | |
| F(1,8)=0.04 | F(1,8)=0.39 | F(1,8)=0.12 | F(1,8)=0.24 | |||||||
| Hippocampus | ||||||||||
| TH | 79.55 ± 40.22 | 111.39 ± 31.31 | 78.36 ± 45.70 | 96.29 ± 52.81 | 78.48 ± 46.69 | p=0.22 | p=0.60 | p=0.23 | p=0.58 | |
| F(1,8)=1.78 | F(1,8)=0.30 | F(1,8)=1.71 | F(1,8)=0.33 | |||||||
| DAT | 64.33 ± 35.74 | 159.83 ± 87.35 | 87.51 ± 56.22 | 152.10 ± 68.80 | 77.47 ± 28.67 | p=0.16 | p=0.88 | p=0.08 | p=0.14 | |
| F(1,8)=2.42 | F(1,8)=0.024 | F(1,8)=4.01 | F(1,8)=2.64 | |||||||
| VMAT2 | 81.40 ± 30.60 | 88.84 ± 26.80 | 113.49 ± 33.17 | 91.26 ± 17.67 | 117.83 ± 22.95 | p=0.23 | p=0.87 | p=0.10 | p=0.22 | |
| F(1,8)=1.67 | F(1,8)=0.028 | F(1,8)=3.38 | F(1,8)=1.75 | |||||||
| SN/VTA | ||||||||||
| TH | 84.35 ± 48.89 | 68.41 ± 30.38 | 94.69 ± 34.28 | 120.88 ± 31.89 | 142.75 ± 58.04 | p=0.24 | p=0.03 | p=0.04 | p=0.25 | |
| F(1,8)=1.65 | F(1,8)=7.10 | F(1,8)=6.44 | F(1,8)=1.56 | |||||||
| DAT | 56.52 ± 27.67 | 96.48 ± 21.33 | 40.37 ± 29.72 | 56.96 ± 27.14 | 72.24 ± 47.04 | p=0.01 | p=0.03 | p=0.33 | p=0.38 | |
| F(1,8)=11.76 | F(1,8)=6.56 | F(1,8)=1.10 | F(1,8)=0.85 | |||||||
| VMAT2 | 56.87 ± 33.03 | 74.15 ± 31.39 | 79.95 ± 25.70 | 53.48 ± 17.09 | 57.24 ± 28.47 | p=0.76 | p=0.23 | p=0.40 | p=0.09 | |
| F(1,8)=0.10 | F(1,8)=1.67 | F(1,8)=0.80 | F(1,8)=3.68 | |||||||
-
Expression of the TH, DAT, and VMAT2 proteins, expressed as percentages of WKY. Data are presented as the mean ± SEM. Data were analyzed using ANOVA for repeated measures, followed by Tukey's tests for multiple comparisons. p<0.05 was considered statistically significant; significant results are highlighted in bold.
Table 4
Effect of HD-tDCS on the ratio between VMAT2 and DAT protein in the prefrontal cortex, striatum, hippocampus, and SN/VTA (n = 4).
| VMAT2/DAT ratio | WKY | SHR | Sham | tDCS-PFC | tDCS-M1 | MPH | Sham vs. tDCS-PFC | Sham vs. tDCS-M1 | Sham vs. MPH | PFC vs. M1 |
|---|---|---|---|---|---|---|---|---|---|---|
| Prefrontal cortex | 2.80 ± 0.98 | 2.05 ± 1.24 | 1.35 ± 0.22 | 2.61 ± 0.06 | 2.61 ± 0.41 | 1.66 ± 0.23 | p=0.029 | p=0.939 | p=0.108 | p<0.001 |
| F(1,6)=3.55 | F(1,6)=35.56 | |||||||||
| Striatum | 2.71 ± 0.81 | 1.32 ± 1.13 | 1.16 ± 0.71 | 2.96 ± 1.27 | 1.94 ± 0.96 | 1.53 ± 0.15 | p=0.048 | p=0.240 | p=0.358 | p=0.200 |
| F(1,6)=6.11 | F(1,6)=1.70 | F(1,6)=0.99 | ||||||||
| Hippocampus | 2.44 ± 1.25 | 1.31 ± 0.32 | 0.60 ± 0.10 | 1.68 ± 0.68 | 1.14 ± 0.33 | 1.86 ± 0.58 | p=0.029 | p=0.029 | p=0.029 | p=0.207 |
| F(1,6)=2.00 | ||||||||||
| SN/VTA | 0.91 ± 0.16 | 0.19 ± 0.06 | 0.42 ± 0.09 | 1.12 ± 0.69 | 1.14 ± 0.58 | 0.60 ± 0.31 | p=0.114 | p=0.049 | p=0.303 | p=0.114 |
| F(1,6)=6.03 | F(1,6)=1.27 |
-
Data are presented as the mean ± SEM. Data were analyzed using ANOVA for repeated measures, followed by Tukey's tests for multiple comparisons. p<0.05 was considered statistically significant; significant results are highlighted in bold.
Table 5
Effect of HD-tDCS on protein expression of NTFs in the prefrontal cortex, striatum, hippocampus, and SN/VTA (n = 5).
| % of WKY | SHR | Sham | tDCS-PFC | tDCS-M1 | MPH | Sham vs. tDCS-PFC | Sham vs. tDCS-M1 | Sham vs. MPH | PFC vs. M1 |
|---|---|---|---|---|---|---|---|---|---|
| Prefrontal cortex | |||||||||
| mBDNF | 46.16 ± 13.97 | 48.99 ± 26.00 | 82.54 ± 20.37 | 72.62 ± 19.36 | 51.81 ± 14.08 | p=0.053 | p=0.14 | p=0.84 | p=0.45 |
| F(1,8)=5.16 | F(1,8)=2.66 | F(1,8)=0.05 | F(1,8)=0.62 | ||||||
| TFG-ß1 | 36.61 ± 15.36 | 68.19 ± 34.34 | 76.41 ± 31.12 | 63.55 ± 19.22 | 56.20 ± 31.88 | p=0.70 | p=0.80 | p=0.58 | p=0.45 |
| F(1,8)=0.16 | F(1,8)=0.07 | F(1,8)=0.33 | F(1,8)=0.62 | ||||||
| Striatum | |||||||||
| mBDNF | 70.62 ± 13.01 | 58.01 ± 20.04 | 75.05 ± 15.97 | 81.41 ± 18.36 | 94.96 ± 38.41 | p=0.18 | p=0.09 | p=0.09 | p=0.58 |
| F(1,8)=2.21 | F(1,8)=3.71 | F(1,8)=3.64 | F(1,8)=0.34 | ||||||
| TFG-ß1 | 75.83 ± 31.20 | 61.40 ± 18.32 | 96.49 ± 16.73 | 81.31 ± 36.90 | 95.82 ± 19.27 | p=0.01 | p=0.31 | p=0.02 | p=0.43 |
| F(1,8)=10.00 | F(1,8)=1.17 | F(1,8)=8.38 | F(1,8)=0.70 | ||||||
| Hippocampus | |||||||||
| mBDNF | 48.39 ± 20.57 | 78.16 ± 18.68 | 76.51 ± 19.73 | 82.80 ± 9.07 | 72.31 ± 24.47 | p=0.90 | p=0.63 | p=0.68 | p=0.54 |
| F(1,8)=0.02 | F(1,8)=0.25 | F(1,8)=0.18 | F(1,8)=0.42 | ||||||
| TFG-ß1 | 42.67 ± 18.24 | 70.02 ± 27.53 | 104.94 ± 67.08 | 53.83 ± 31.95 | 94.76 ± 64.33 | p=0.31 | p=0.42 | p=0.45 | p=0.16 |
| F(1,8)=1.16 | F(1,8)=0.74 | F(1,8)=0.63 | F(1,8)=2.37 | ||||||
| GDNF | 129.07 ± 53.16 | 181.27 ± 22.52 | 322.41 ± 109.41 | 182.26 ± 43.25 | 235.44 ± 42.26 | p=0.02 | p=0.97 | p=0.04 | p=0.03 |
| F(1,8)=7.98 | F(1,8)=6.40 | F(1,8)=7.10 | |||||||
| SN/VTA | |||||||||
| mBDNF | 68.10 ± 17.65 | 76.63 ± 8.76 | 102.87 ± 15.04 | 103.20 ± 8.12 | 100.30 ± 30.01 | p=0.01 | p=0.001 | p=0.13 | p=0.97 |
| F(1,8)=11.36 | F(1,8)=24.74 | F(1,8)=2.87 | |||||||
| TFG-ß1 | 72.73 ± 26.35 | 77.68 ± 36.44 | 100.19 ± 45.32 | 111.19 ± 16.46 | 77.67 ± 49.81 | p=0.41 | p=0.10 | p=1.00 | p=0.624 |
| F(1,8)=0.75 | F(1,8)=3.51 | F(1,8)=0.26 | |||||||
-
Expression of the mBDNF, TFG-ß1, and GDNF proteins, expressed as percentages of WKY. Data are presented as the mean ± SEM. Data were analyzed using ANOVA for repeated measures, followed by Tukey's tests for multiple comparisons. p<0.05 was considered statistically significant; significant results are highlighted in bold.
Key resources table
| Reagent type (species) or resource | Designation | Source or reference | Identifiers | Additional information |
|---|---|---|---|---|
| Strain, strain background (Male. Rattus) | Wistar kyoto rats | Izm | ||
| Strain, strain background (Male. Rattus) | Spontaneously hypertensive rats | Izm | ||
| Chemical compound, drug | MPH | The United States Pharmacopeial Convention | 1433008 | 2 mg/kg |
| Chemical compound, drug | BrdU | Merck | B5002-5G | 50 mg/kg |
| Commercial assay or kit | TOPscriptTM cDNA Synthesis Kit | Enzynomics | EZ005S | Used following manufacturer’s recommendations |
| Commercial assay or kit | Quantikine free BDNF ELISA kit | R and D Systems | DBD00 | Used following manufacturer’s recommendations |
| Commercial assay or kit | TH ELISA kit | Cusabio | CSB-E13102r | Used following manufacturer’s recommendations |
| Commercial assay or kit | Corticosterone ELISA kit | Enzo Life Sciences Inc | ADI-900–097 | Used following manufacturer’s recommendations |
| Sequence-based reagent | TH forward | This paper | PCR primers | TTATGGTGCAGGGCTGCTGTCTT |
| Sequence-based reagent | TH reverse | This paper | PCR primers | ACAGGCTGGTAGGTTTGATCTTGG |
| Sequence-based reagent | DAT forward | This paper | PCR primers | CAGCCTATGGAAGGGAGTAAAG |
| Sequence-based reagent | DAT reverse | This paper | PCR primers | CACACTGAGGTATGCTCTGATG |
| Sequence-based reagent | VMAT2 forward | This paper | PCR primers | GCTCCTCACTAACCCATTCATA |
| Sequence-based reagent | VMAT2 reverse | This paper | PCR primers | GCTGGAGAAGGCAAACATAAC |
| Sequence-based reagent | BDNF forward | This paper | PCR primers | CCTGTGGAGGCTAAGTGGAG |
| Sequence-based reagent | BDNF reverse | This paper | PCR primers | CCTGCTCTGAAGGGTGCTT |
| Sequence-based reagent | TGF- β1 forward | This paper | PCR primers | CTGTGGAGCAACACGTAGAA |
| Sequence-based reagent | TGF- β1 reverse | This paper | PCR primers | GTATTCCGTCTCCTTGGTTCAG |
| Sequence-based reagent | GDNF forward | This paper | PCR primers | CCAGAGAATTCCAGAGGGAAAG |
| Sequence-based reagent | GDNF reverse | This paper | PCR primers | CTTCACAGGAACCGCTACAA |
| Sequence-based reagent | NGF forward | This paper | PCR primers | CCTCTTCGGACAATATGG |
| Sequence-based reagent | NGF reverse | This paper | PCR primers | CGTGGCTGTGGTCTTATC |
| Sequence-based reagent | NT3 forward | This paper | PCR primers | AGGTCACAATTCCAGCCGAT |
| Sequence-based reagent | NT3 reverse | This paper | PCR primers | GTTTCCTCCGTGGTGATGTT |
| Sequence-based reagent | GAPDH forward | This paper | PCR primers | TGAACGGGAAGCTCACTG |
| Sequence-based reagent | GAPDH reverse | This paper | PCR primers | GCTTCACCACCTTCTTGATG |
| Antibody | Anti- mBDNF (Rabbit polyclonal) | Novus | Cat#: NB100-98682 RRID:AB_1290643 | WB (1:1000) |
| Antibody | Anti-TGF-ß1(Rabbit polyclonal) | Abcam | Cat#: ab92486 RRID:AB_10562492 | WB (1:500) |
| Antibody | Anti-GDNF(Mouse monoclonal) | Santa Cruz | Cat#: sc13147 RRID:AB_627672 | WB (1:500) |
| Antibody | Anti-NGF(Rabbit polyclonal) | Abcam | Cat#:ab6199 RRID:AB_2152414 | WB (1:500) |
| Antibody | Anti-NT3(Rabbit polyclonal) | Alomne Labs | Cat#:ANT003 RRID:AB_2040013 | WB (1:200) |
| Antibody | Anti-TH(Rabbit polyclonal) | Abcam | Cat#:ab112 RRID:AB_297840 | WB (1:200) |
| Antibody | Anti-DAT(Rabbit polyclonal) | Millipore | Cat#:AB1591P RRID:AB_90808 | WB (1:100) |
| Antibody | Anti-VMAT2(Rabbit polyclonal) | Novus | Cat#:NB110-68123 RRID:AB_1111327 | WB (1:500) |
| Antibody | Anti-mBDNF(Sheep polyclonal) | Abcam | Cat#:ab75040 RRID:AB_1280756 | IF (1:500) |
| Antibody | Anti-pTrkB(Rabbit polyclonal) | Abcam | Cat#:ab131483 RRID:AB_11156897 | IF (1:500) |
| Antibody | Anti-TH(Mouse monoclonal) | Santa Cruz | Cat#:sc25269 RRID:AB_628422 | IF (1:1000) |
| Antibody | Anti-DAT(Rat monoclonal) | Santa Cruz | Cat#:sc32259 RRID:AB_627402 | IF (1:50) |
| Antibody | Anti-BrdU(Rabbit monoclonal) | Bio-Rad | Cat#:MCA2483 RRID:AB_808349 | IF (1:500) |
| Antibody | Anti-NeuN(Rabbit polyclonal) | Millipore | Cat#:ABN78 RRID:AB_10807945 | IF (1:1000) |
| Antibody | Anti-Iba1(Rabbit polyclonal) | Wako | Cat#:019–19741 RRID:AB_839504 | IF (1:500) |
| Software, algorithm | G*Power | G*Power 3.1 software | RRID:SCR_013726 | Germany; http://www.gpower.hhu.de/ |
| Software, algorithm | SigmaPlot | SigmaPlot 11.2 | RRID:SCR_010285 | |
| Software, algorithm | ITK-SNAP | ITK-SNAP v3.8.0 | RRID:SCR_002010 | www.itksnap.org |
| Software, algorithm | MVGC Multivariate Granger Causality Matlab Toolbox | Matlab 9.8 | RRID:SCR_015755 | |
| Software, algorithm | BioMesh3D | version 1.5 | RRID:SCR_009534 | www.wias-berlin.de |
| Software, algorithm | CoMet | CoMet | RRID:SCR_011925 | |
| Software, algorithm | SMART Video-tracking | SMART v3.0 video tracking system | RRID:SCR_002852 | |
| Software, algorithm | IMT i-Solution | IMT i-Solution Inc 10.1 |
Additional files
Download links
A two-part list of links to download the article, or parts of the article, in various formats.
Downloads (link to download the article as PDF)
Open citations (links to open the citations from this article in various online reference manager services)
Cite this article (links to download the citations from this article in formats compatible with various reference manager tools)
Therapeutic effects of anodal transcranial direct current stimulation in a rat model of ADHD
eLife 9:e56359.
https://doi.org/10.7554/eLife.56359


