Presynaptic APP levels and synaptic homeostasis are regulated by Akt phosphorylation of huntingtin
- Univ. Grenoble Alpes, Inserm, U1216, CHU Grenoble Alpes, CEA, Grenoble Institut Neurosciences, France
- Institut du Cerveau et de la Moelle épinière, ICM, Inserm U1127, CNRS UMR 7225, Sorbonne Université, France
Figures
Figure 1 with 1 supplement

Reconstituted corticocortical mature neuronal circuit.
(A) Image and schematic representation of the 3-compartment microfluidic chamber that allows the reconstitution of a corticocortical mature network compatible with live-cell imaging of axons and dendrites. (B) Presynaptic neurons were transduced with GFP (green) to visualize axons into microgrooves and MAP2 (red) immunostaining was applied on the entire microchambre at DIV13. Magnification shows axons into distal part of long microchannel but not MAP2-positive dendrites (C) Functional synapses were detected using FM4-64 dye (purple) that labels active presynaptic boutons on GFP dendrites (green) upon 50 mM KCl stimulation. Images represent a projection of 5 µm Z stacks. The highest number of functional corticocortical synapses is visualized between DIV10 and DIV15 in this microfluidic device. Scale bar = 20 µm.
Figure 1—figure supplement 1
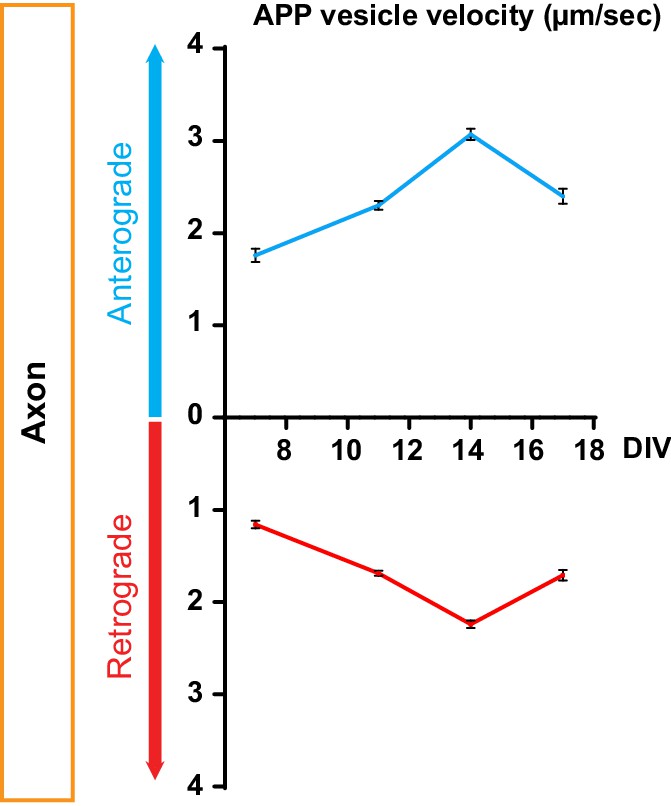
Time course of kinetics of anterograde and retrograde APP-mCherry axonal velocity after plating neurons into microchambers.
DIV = day in vitro. Data are represented by means +/- SEM of three independent experiments minimum and 314 vesicles per condition.
Figure 2
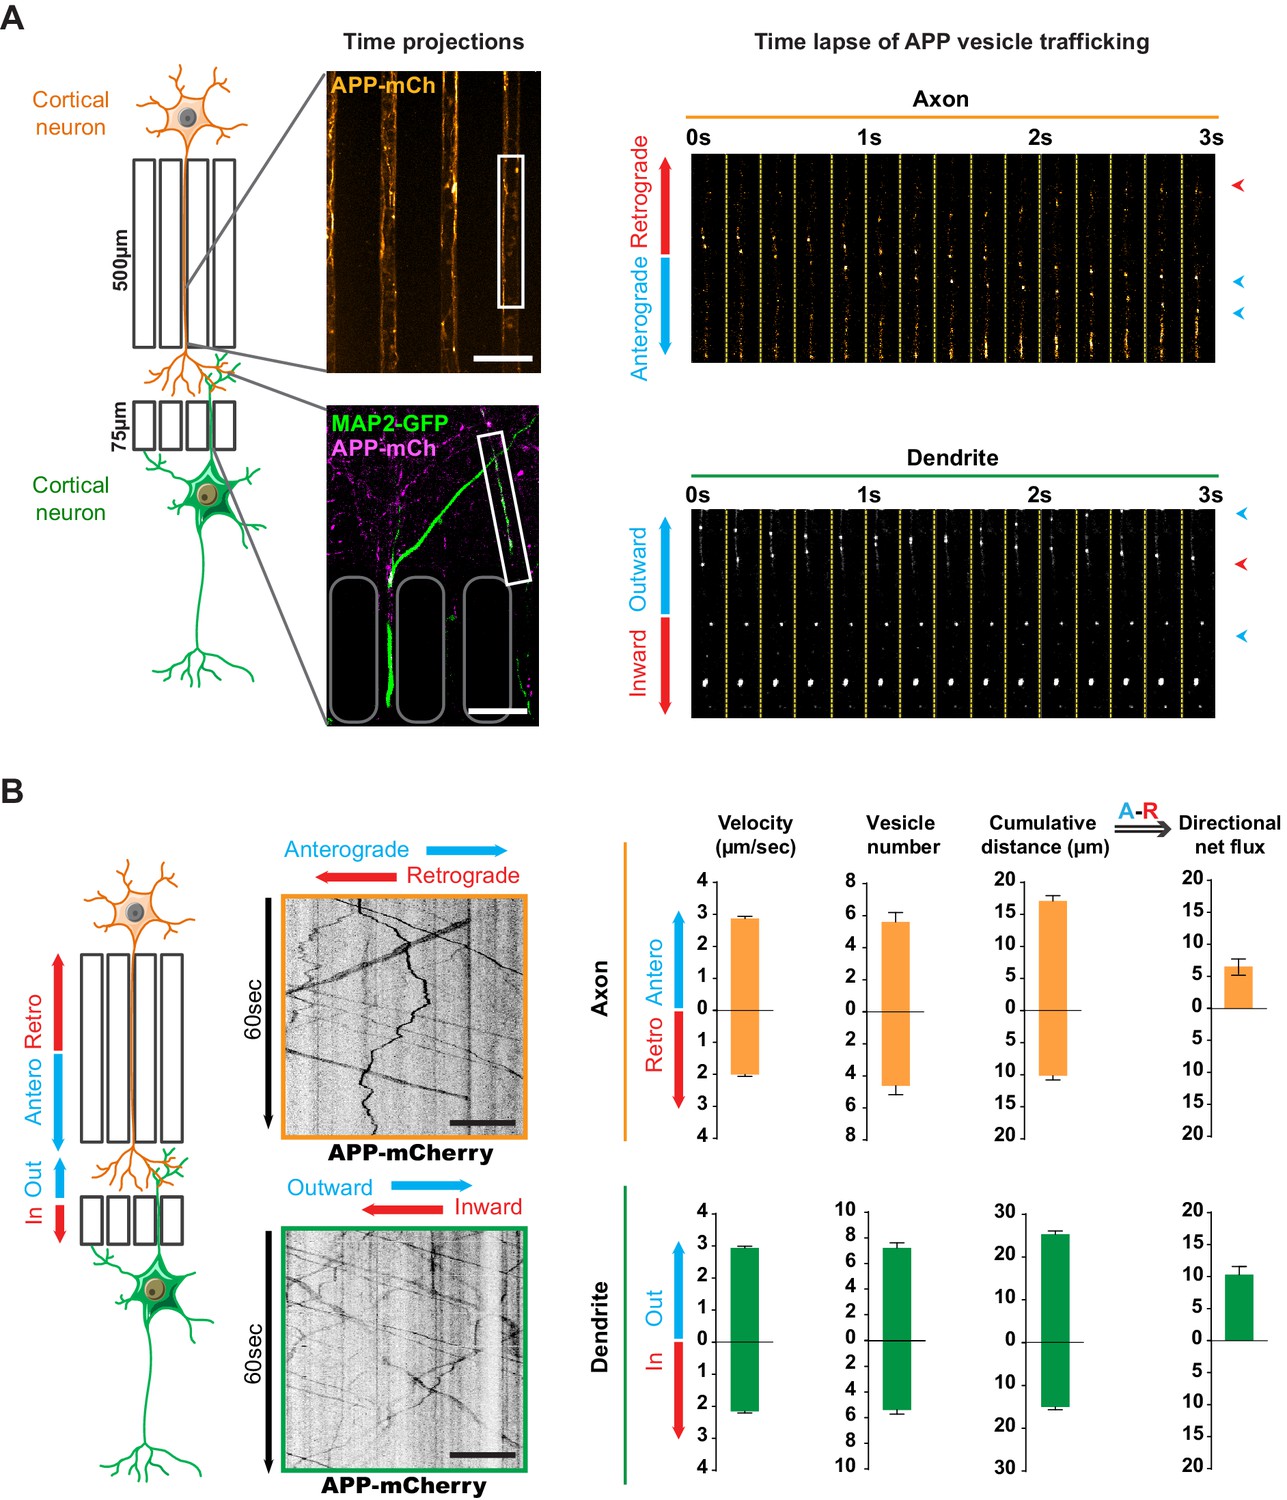
Transport of APP in axons and dendrites in reconstituted corticocortical mature neuronal circuit.
(A) APP-mCherry was transduced into the presynaptic compartment for axonal transport analysis or into the postsynaptic compartment for dendritic trafficking. Postsynaptic neurons were transfected with MAP-2-GFP (green) to visualize dendrites that cross the short microchannels. APP-mCherry transport along the axons or the dendrites are represented in time projections of maximum signal intensities for 60 s (middle panels) and real time-lapse analysis of anterograde/retrograde or inward/outward vesicles in axons and dendrites respectively (right panel). Scale bars = 20 µm. (B) Kymograph analyses of APP-mCherry axonal or dendritic transport at DIV13 from time-lapse images acquired every 200 ms during 60 s. Transport characteristics such as the anterograde/retrograde or inward/outward vesicle velocities, moving vesicle number per 100 µm of neurite length, the cumulative distances travelled by vesicles and thus the directional net flux of APP-mCherry trafficking into axons (upper panel) or dendrites (lower panel) are represented by means +/- SEM of 3 independent experiments, 40 axonal and 120 dendritic axons and 674 axonal and 1160 dendritic vesicles. Scale bars = 20 µm. (see also Videos 1 and 2).
Figure 3 with 1 supplement
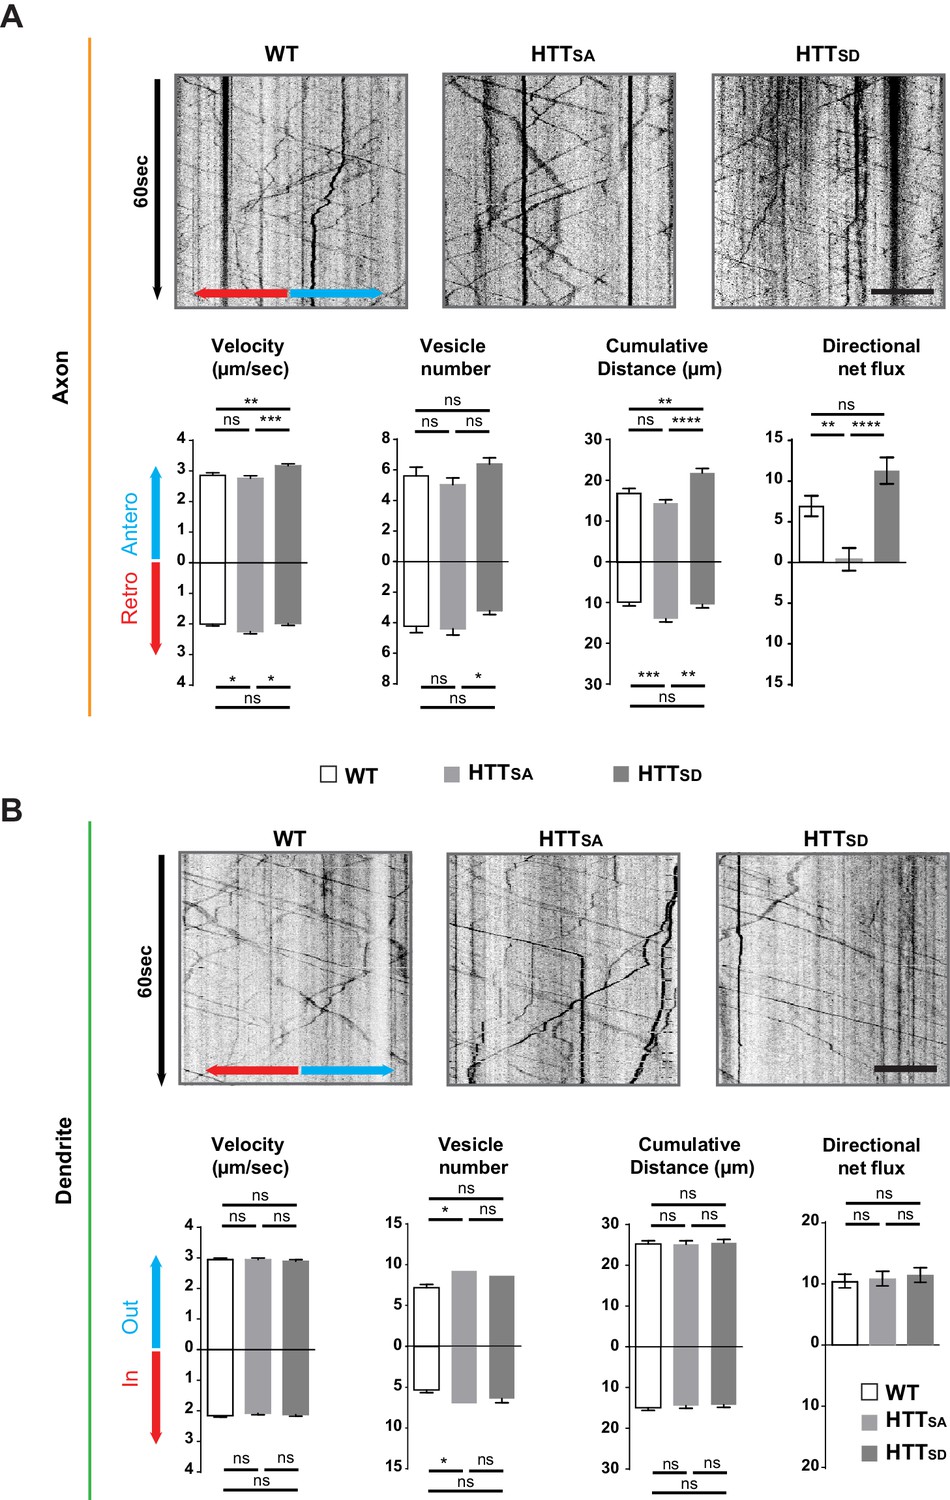
Axonal but not dendritic transport of APP depends on HTT phosphorylation.
(A) Kymographs and quantifications of APP-mCherry into WT, HTTSA and HTTSD axons. Velocity, vesicle number per 100 µm of neurite length, cumulative distance and directional net flux were measured. Histograms represent means +/- SEM of 3 independent experiments, 41 WT, 52 HTTSA and 63 HTTSD axons and 674 WT, 602 HTTSA and 493 HTTSD vesicles. Significance was determined using an unpaired t-test; *p<0.05, **p<0.01, ***p<0.001, ****p<0.0001, ns = not significant. Scale bar = 20 µm. (B) Kymographs and quantifications of APP-mCherry into WT, HTTSA and HTTSD dendrites. Dendritic inward and outward velocity, vesicle number per 100 µm of neurite length, cumulative distance and directional net flux were measured. Histograms represent means +/- SEM of 4 independent experiments, 122 WT, 99 HTTSA and 109 HTTSD dendrites, 1171 WT, 1119 HTTSA and 1074 HTTSD vesicles. Significance was determined using an unpaired t-test; *p<0.05; ns = not significant. Scale bar = 20 µm. (see also Video 3).
-
Figure 3—source data 1
Statistical analysis of APP axonal transport.
- https://cdn.elifesciences.org/articles/56371/elife-56371-fig3-data1-v2.xlsx
-
Figure 3—source data 2
Statistical analysis of APP dendritic transport.
- https://cdn.elifesciences.org/articles/56371/elife-56371-fig3-data2-v2.xlsx
Figure 3—figure supplement 1
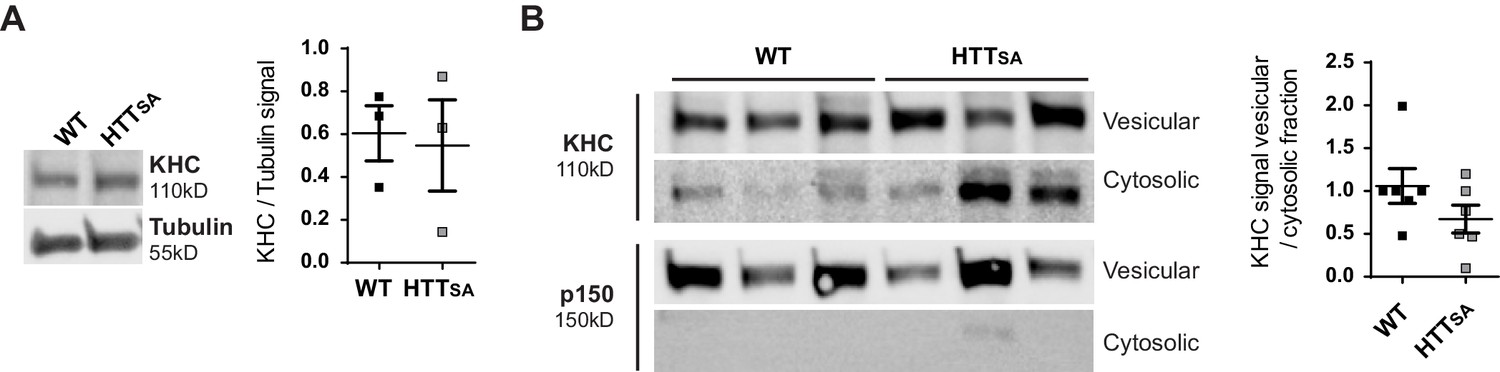
Cellular distribution of kinesin and dynactin in WT and HTTSA mouse brains.
Total, vesicular and cytosolic fractionations were analyzed by western blot using KHC, p150 (fractionation control) and tubulin (loading control) antibodies. (A) KHC signal was quantified in total fraction as the ratio of KHC signal on tubulin signal. (B) Vesicular KHC signal was normalized on cytosolic signal. Graphs represent three brains per genotype analyzed with two independent experiments. Significance was determined using Mann-Whitney test. p=0,09.
-
Figure 3—figure supplement 1—source data 1
Statistical analysis of total KHC levels.
- https://cdn.elifesciences.org/articles/56371/elife-56371-fig3-figsupp1-data1-v2.xlsx
-
Figure 3—figure supplement 1—source data 2
Statistical analysis of vesicular and cytosolic KHC levels.
- https://cdn.elifesciences.org/articles/56371/elife-56371-fig3-figsupp1-data2-v2.xlsx
Figure 4
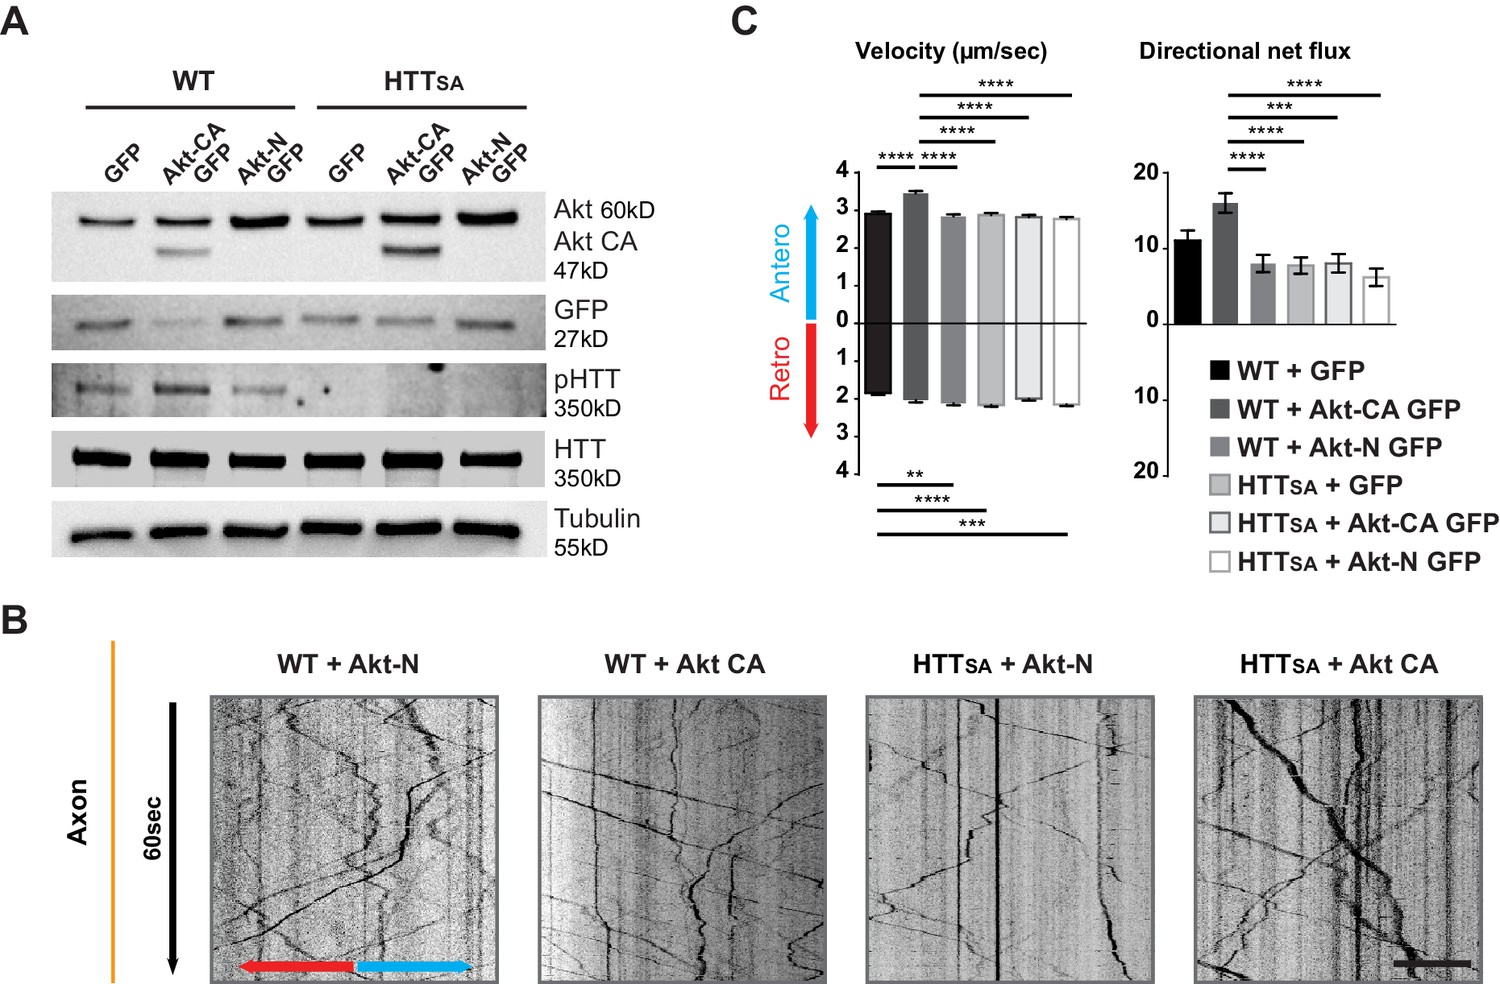
Akt regulates APP transport in a HTT phospho-dependent manner.
(A) WT and HTTSA neurons transduced with constitutively active Akt (Akt-CA GFP) or an inactive form of Akt (Akt-N GFP) in IRES GFP constructs or with empty GFP vector (GFP) were analyzed by western blotting with Akt, GFP, phosphorylated HTT, total HTT and tubulin antibodies. (B) Kymographs of APP-mCherry from WT and HTTSA neurons seeded in microchambers and transduced with APP-mCherry and GFP, Akt-CA GFP or Akt-N GFP. Scale bar 20 µm. (see also Video 4). (C) Velocity and directional net flux of APP-mCherry vesicles were quantified. Histograms represent means +/- SEM of 3 independent experiments, 936 WT GFP, 988 WT AKT CA, 1261WT AKT N, 1357 HTTSA GFP, 1048 HTTSA AKT CA and 1177 HTTSA AKT N vesicles. Significance was determined using one-way ANOVA followed by Tukey’s post-hoc analysis for multiple comparisons; *p<0.05, **p<0.01, ***p<0.001, ****p<0.0001.
-
Figure 4—source data 1
Statistical analysis of APP axonal transport according to Akt activity.
- https://cdn.elifesciences.org/articles/56371/elife-56371-fig4-data1-v2.xlsx
Figure 5
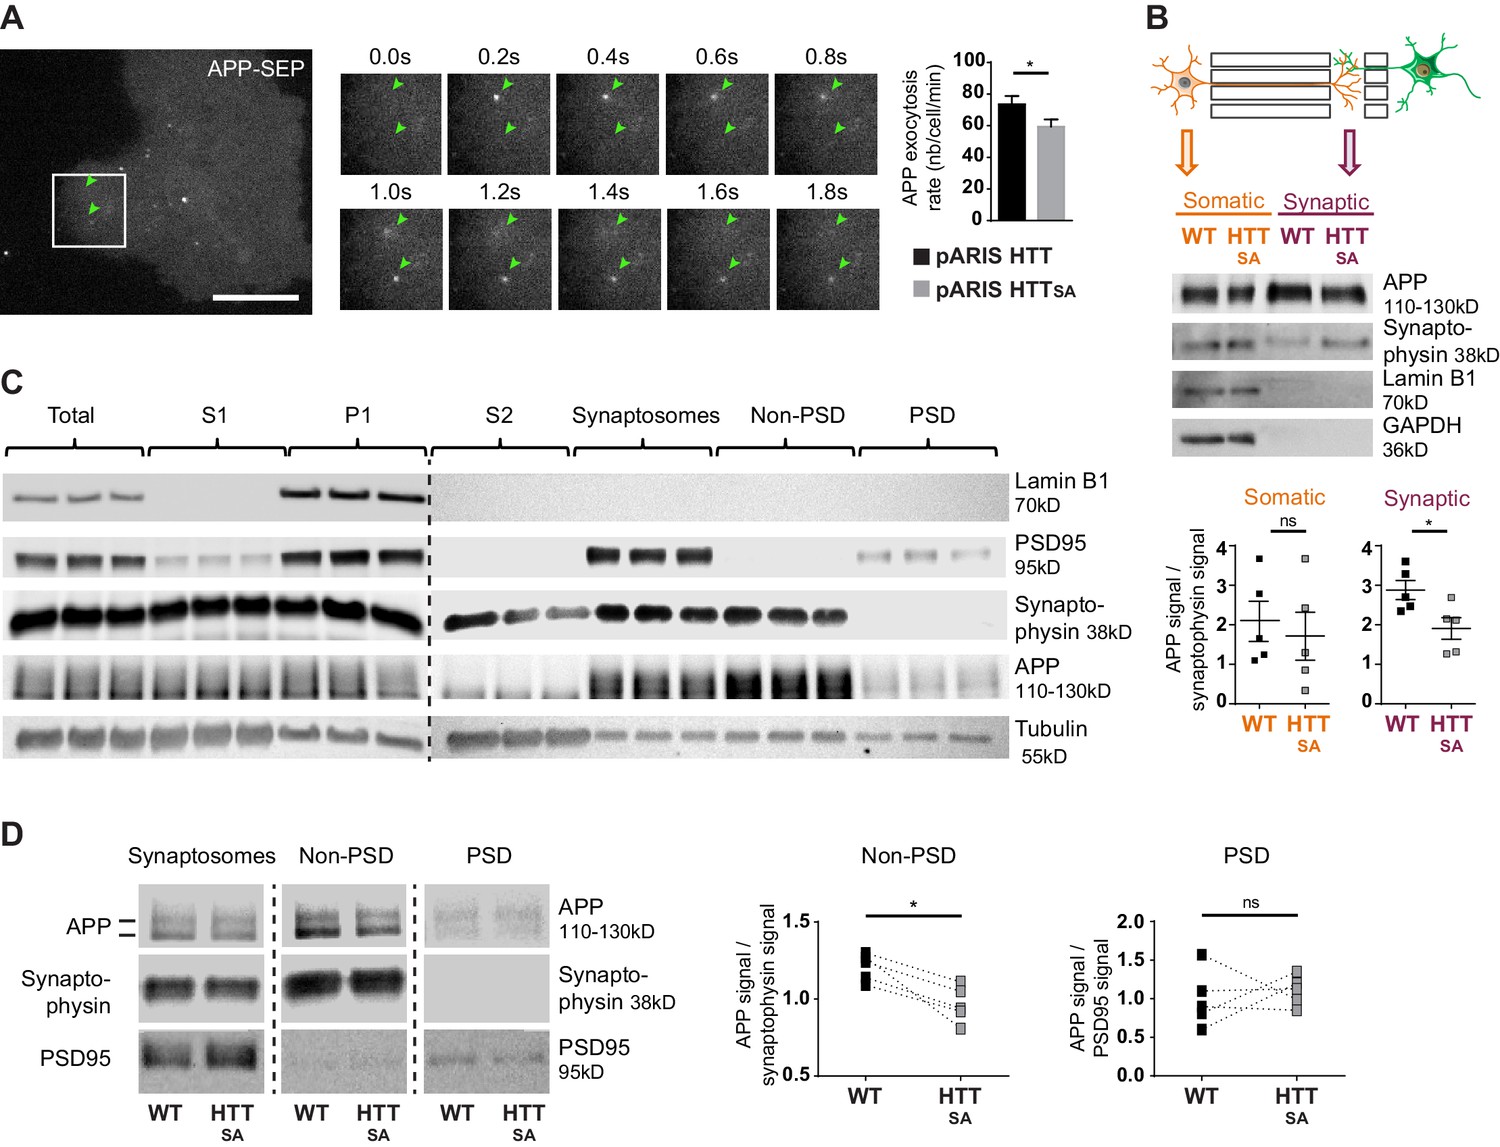
HTT S421 phosphorylation affects presynaptic APP targeting.
(A) Effect of HTT S421 phosphorylation on exocytosis rate of APP was analyzed in COS cells co-transfected with APP-SEP (Super Ecliptic pHluorin) and with pARIS HTT or pARIS HTTSA visualized by TIRF microscopy. Magnification represents a time lapse of events showing 2 events of APP vesicle exocytosis (green arrows). Histograms represent means +/- SEM of exocytosis event number per minute in 39 HTT and 40 HTTSA cells from four independent experiments. Significance was determined using an unpaired t-test; *p<0.05. Scale bar = 20 µm. (see also Video 5). (B) Effect of HTT S421 phosphorylation on APP targeting at the synapse was assessed by anti-APP western blotting (22C11) analysis of extracts from synaptic chambers of a WT or HTTSA corticocortical network. SNAP25 was used as a control for protein content in the synaptic compartment and nuclear marker Lamin B1 for the somatic compartment. Histograms represent means +/- SEM of APP signal per synaptophysin signal on five independent experiments. Significance was determined using a Mann-Whitney test; *p<0.05, ns = not significant. (C) Western blotting analysis of pre- and postsynaptic fractions obtained from synaptosome preparations. Fractionation gives the first pellet, P1, the first supernatant, S1, and the second supernatant, S2. Lamin B1, a nuclear marker is enriched in P1 fraction. The pre- (non-PSD) and the post-synaptic (PSD) fractions are respectively enriched in synaptophysin and PSD95. (D) APP from WT or HTTSA cortices fractions was quantified by western blotting analyses. APP signal was quantified as the ratio of synaptophysin signal for non-PSD fraction and as the ratio of PSD95 signal for PSD fraction. One line represents one experiment. Significance was determined using Mann-Whitney test; *p<0.05, ns = not significant.
-
Figure 5—source data 1
Statistical analysis of APP exocytosis rate.
- https://cdn.elifesciences.org/articles/56371/elife-56371-fig5-data1-v2.xlsx
-
Figure 5—source data 2
Statistical analysis of APP levels in microfluidics device.
- https://cdn.elifesciences.org/articles/56371/elife-56371-fig5-data2-v2.xlsx
-
Figure 5—source data 3
Statistical analysis of APP levels in synaptosome from brains.
- https://cdn.elifesciences.org/articles/56371/elife-56371-fig5-data3-v2.xlsx
Figure 6 with 1 supplement

HTT dephosphorylation induces changes in brain morphology and synapse number.
(A) Representative 3D reconstructions of WT brain areas built from high spatial resolution ex vivo MRI-T1w data. Each brain structure is represented with a specific color: cortex (purple), hippocampal formation (pink), striatum (green), and other structures (light grey). (B) Quantification of the volumes of the different cerebral regions represented in (A). The graphics show volumes for these regions (in mm3) of 2 and 3-month-old WT and HTTSA mice. Black bars represent the mean of 4 WT and 4 HTTSA mice, Mann and Whitney two tails, *P < 0.05; **P < 0.01; ***P < 0.001). (C) Synapse number and size in CA1 region of 19-month-old WT or HTTSA mice were quantified by electron microscopy. Axon terminals (AxT) and spines (Sp) are colored with green and purple respectively. Histograms represent means +/- SEM of 3 brains with 134 (WT) and 203(HTTSA) fields analyzed and 225 (WT) and 218 (HTTSA) synapses. Significance was determined using an unpaired t-test; **p<0.01, ns = not significant. Scale bar = 1 µm.
-
Figure 6—source data 1
Statistical analysis of brain structure volumes of HTTSA mice.
- https://cdn.elifesciences.org/articles/56371/elife-56371-fig6-data1-v2.xlsx
-
Figure 6—source data 2
Statistical analysis of synapse number and spine size in HTTSA brains.
- https://cdn.elifesciences.org/articles/56371/elife-56371-fig6-data2-v2.xlsx
Figure 6—figure supplement 1

Behavioral analyses of the locomotion, force and anxiety in WT and HTTSA mice.
Behavioral analyses of the locomotion, force and anxiety in WT and HTTSA mice (A) Locomotor activity and the anxiety-related behavior of 19-month-old HTTSA mice (n = 12) and WT littermate controls (n = 11) were quantified as the total distance travelled in the open field arena (left) and by the ratio of time spent in the periphery over the center of the arena in the open field (right). All values are means ± SEM. Significance between groups was determined with an unpaired t-test; ns = not significant. (B) Grip strength of HTTSA mice and WT littermate controls was evaluated by the grip force test. All values are means ± SEM. Significance between groups was determined with an unpaired t-test; ns = not significant. (C) Anxiety-like behavior of HTTSA mice (n = 12) and WT littermate controls (n = 9) was assessed by the elevated plus maze test. All values are means ± SEM. Significance between groups was determined with an unpaired t-test; ns = not significant.
-
Figure 6—figure supplement 1—source data 1
Statistical analysis of the distance moved in an open field by HTTSA mice.
- https://cdn.elifesciences.org/articles/56371/elife-56371-fig6-figsupp1-data1-v2.xlsx
-
Figure 6—figure supplement 1—source data 2
Statistical analysis of the time spent in the periphery of an open field by HTTSA mice.
- https://cdn.elifesciences.org/articles/56371/elife-56371-fig6-figsupp1-data2-v2.xlsx
-
Figure 6—figure supplement 1—source data 3
Statistical analysis of grip force test by HTTSA mice.
- https://cdn.elifesciences.org/articles/56371/elife-56371-fig6-figsupp1-data3-v2.xlsx
-
Figure 6—figure supplement 1—source data 4
Statistical analysis of EPM test by HTTSA mice.
- https://cdn.elifesciences.org/articles/56371/elife-56371-fig6-figsupp1-data4-v2.xlsx
Figure 7
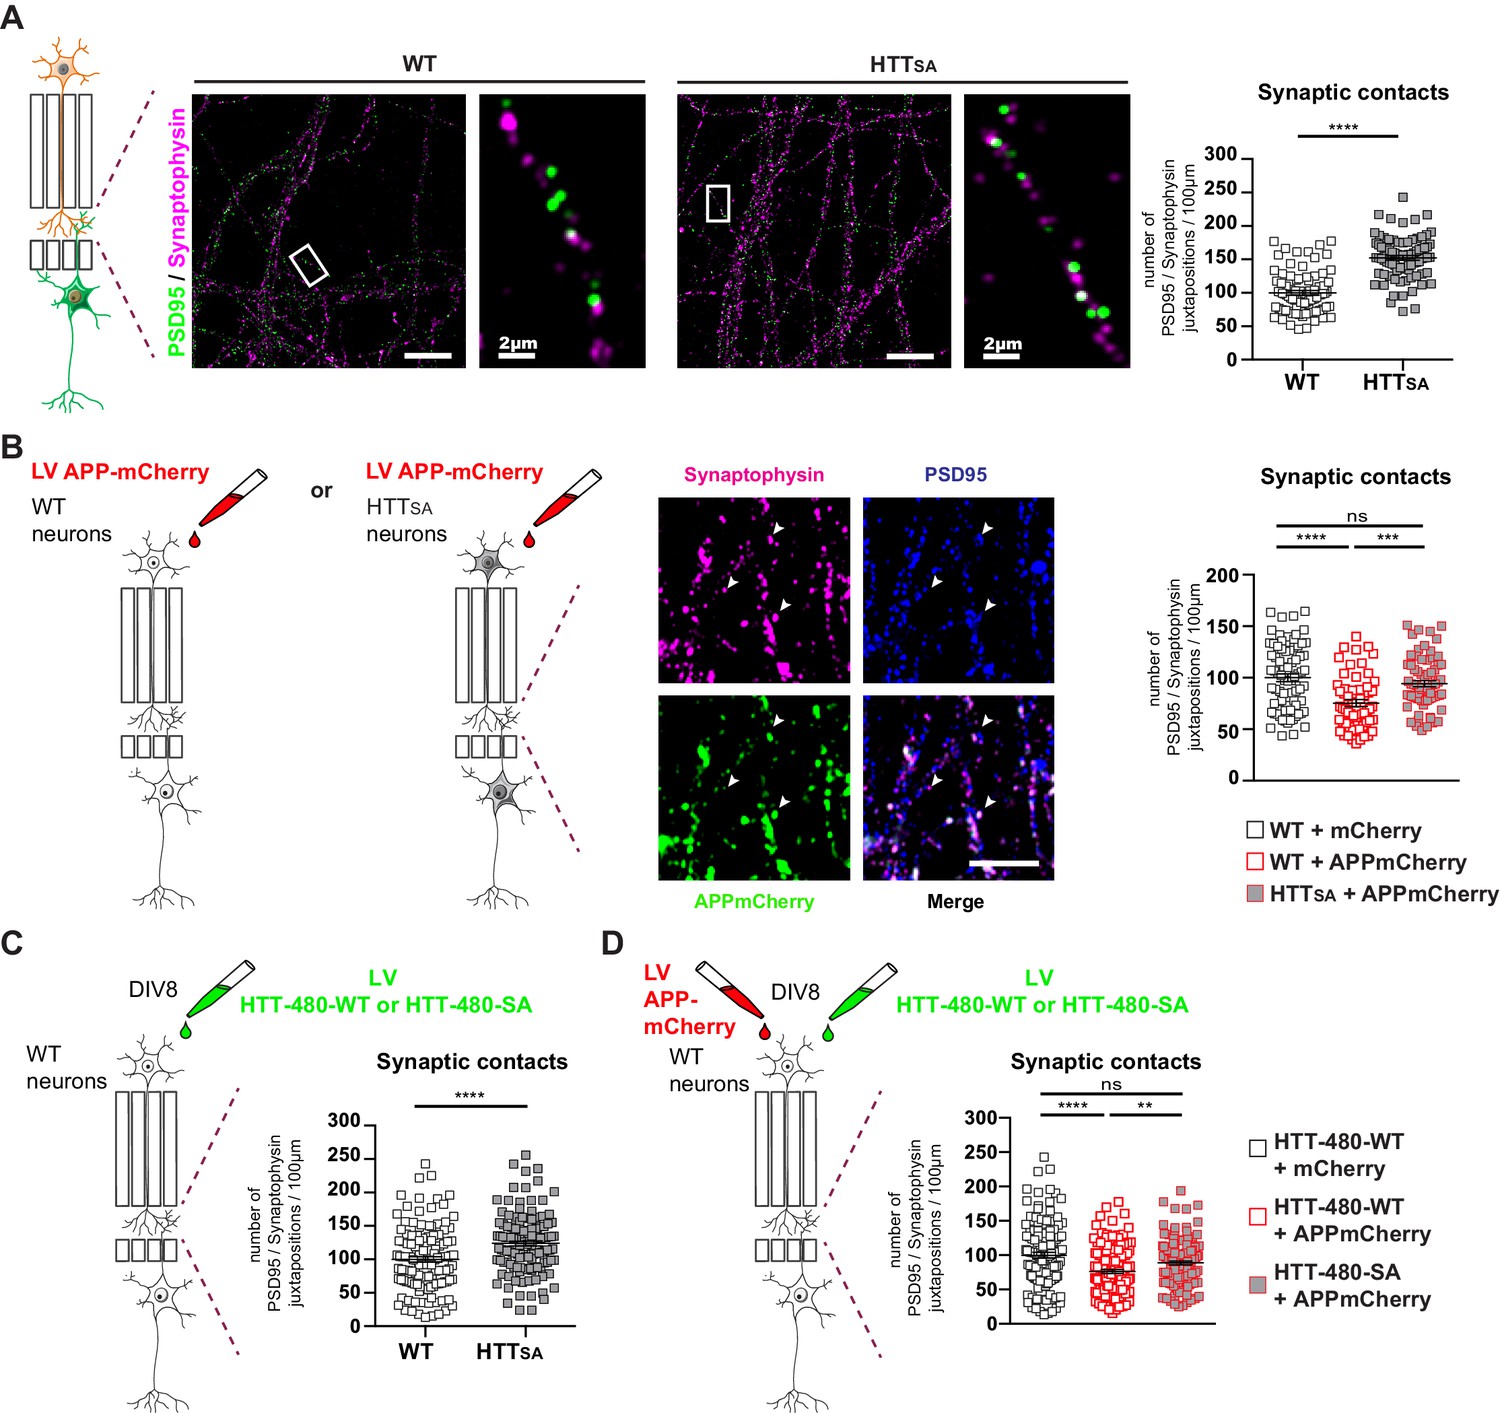
HTT phosphorylation regulates synaptic contacts by reducing presynaptic APP levels.
(A) Number of PSD95/Synaptophysin contacts in the synaptic chamber of WT and HTTSA network. Right microphotographs for each genotype show magnification of representative neurites. Scale bars = 20 µm (low magnification) or 2 µm (high magnification). Histograms represent means +/- SEM of 3 independent experiments and 85 WT and 91 HTTSA neurites. Significance was determined using an unpaired t-test; ****p<0.0001. (B) Representative image of APP-mCherry transduced presynaptic neurons. APP-mCherry is present in axon terminals positive for synaptophysin (white arrows). Scale bar = 2 µm. Number of PSD95/Synaptophysin contacts in the synaptic chamber of WT and HTTSA network transduced at presynaptic site with APP-mCherry or mCherry as a control. Histograms represent means +/- SEM of 3 independent experiments and 75 WT + mCherry; 59 WT + APP-mCherry and 71 HTTSA APP-mCherry neurites. (C) Number of PSD95/Synaptophysin contacts in the synaptic chamber of WT mature network transduced at presynaptic site with a lentivirus encoding an HTT construct containing the first 480 amino acids without (HTT-480-WT) or with the S421A mutation (HTT-480-SA). Histograms represent means +/- SEM of at least three independent experiments and 132 HTT-480-WT and 130 HTT-480-SA neurites. Significance was determined using Mann and Whitney test; ****p<0.0001. (D) Number of PSD95/Synaptophysin contacts in the synaptic chamber of WT mature network transduced at presynaptic site with APP-mCherry or mCherry as a control and with a lentivirus encoding a HTT-480-WT or HTT-480-SA. Histograms represent means +/- SEM of 3 independent experiments and 132 HTT-480-WT + mCherry, 134 HTT-480-WT + APP mCherry and 136 HTT-480-SA + APP mCherry neurites. Significance was determined using one-way Kruskal-Wallis test followed by Dunn’s post-hoc analysis for multiple comparisons; **p<0.01, ***p<0.001, ****p<0.0001, ns = not significant.
-
Figure 7—source data 1
Statistical analysis of the number of synaptic contacts in HTTSA neurons.
- https://cdn.elifesciences.org/articles/56371/elife-56371-fig7-data1-v2.xlsx
-
Figure 7—source data 2
Statistical analysis of the number of synaptic contacts in APP transduced neurons.
- https://cdn.elifesciences.org/articles/56371/elife-56371-fig7-data2-v2.xlsx
-
Figure 7—source data 3
Statistical analysis of the number of synaptic contacts in HTT transduced neurons.
- https://cdn.elifesciences.org/articles/56371/elife-56371-fig7-data3-v2.xlsx
-
Figure 7—source data 4
Statistical analysis of the number of synaptic contacts in APP and HTT transduced neurons.
- https://cdn.elifesciences.org/articles/56371/elife-56371-fig7-data4-v2.xlsx
Figure 8 with 1 supplement
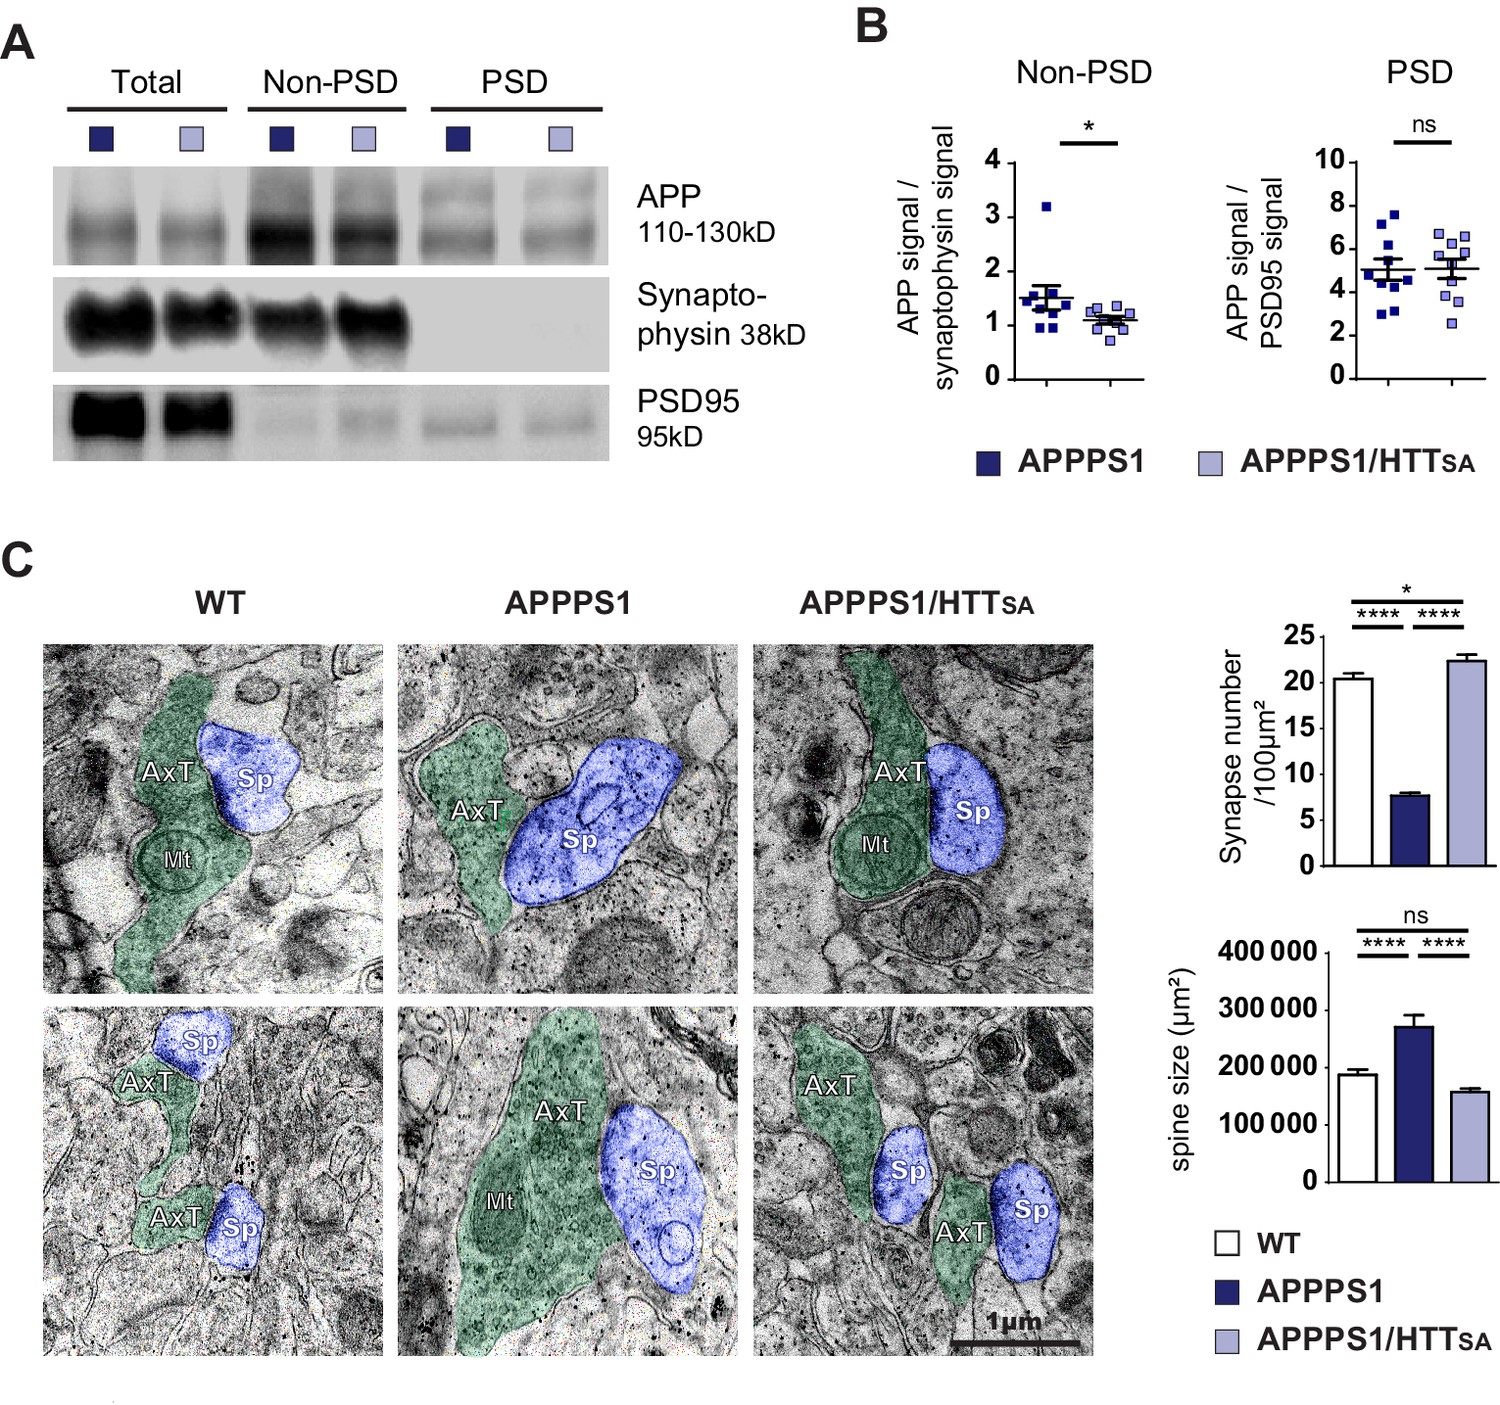
HTT S421 dephosphorylation rescues synapse number in APPPS1 mice.
(A) APP levels from APPPS1 and APPPS1/HTTSA cortical fractions were quantified by western blotting analyses after synaptosomes fractionation. (B) APP signal was quantified as the ratio of synaptophysin signal for non-PSD fraction and as the ratio of PSD95 signal for PSD fraction. Histograms represent means +/- SEM of 9 experiments. Significance was determined using Wilcoxon test; *p<0.05, ns = not significant. (C) Synaptic number and postsynaptic density (PSD) length of CA1 region of hippocampi from 19-month-old APPPS1 and APPPS1/HTTSA mice were quantified by electron microscopy. Axon terminals (AxT) and spines (Sp) are colored with green and purple, respectively. Scale bar = 1 µm. (D) Histograms represent means +/- SEM of 3 brains; 153 APPPS1 and 152 APPPS1/HTTSA fields and 182 APPPS1 and 350 APPPS1/HTTSA synapses were analyzed. Significance was determined using one-way ANOVA followed by Tukey's multiple comparisons test; *p<0.05, ****p<0.0001; ns = not significant.
-
Figure 8—source data 1
Statistical analysis of APP levels in synaptosomes from APPPS1/HTTSA brains.
- https://cdn.elifesciences.org/articles/56371/elife-56371-fig8-data1-v2.xlsx
-
Figure 8—source data 2
Statistical analysis of synapse number and spine size of APPPS1/HTTSA brains.
- https://cdn.elifesciences.org/articles/56371/elife-56371-fig8-data2-v2.xlsx
Figure 8—figure supplement 1
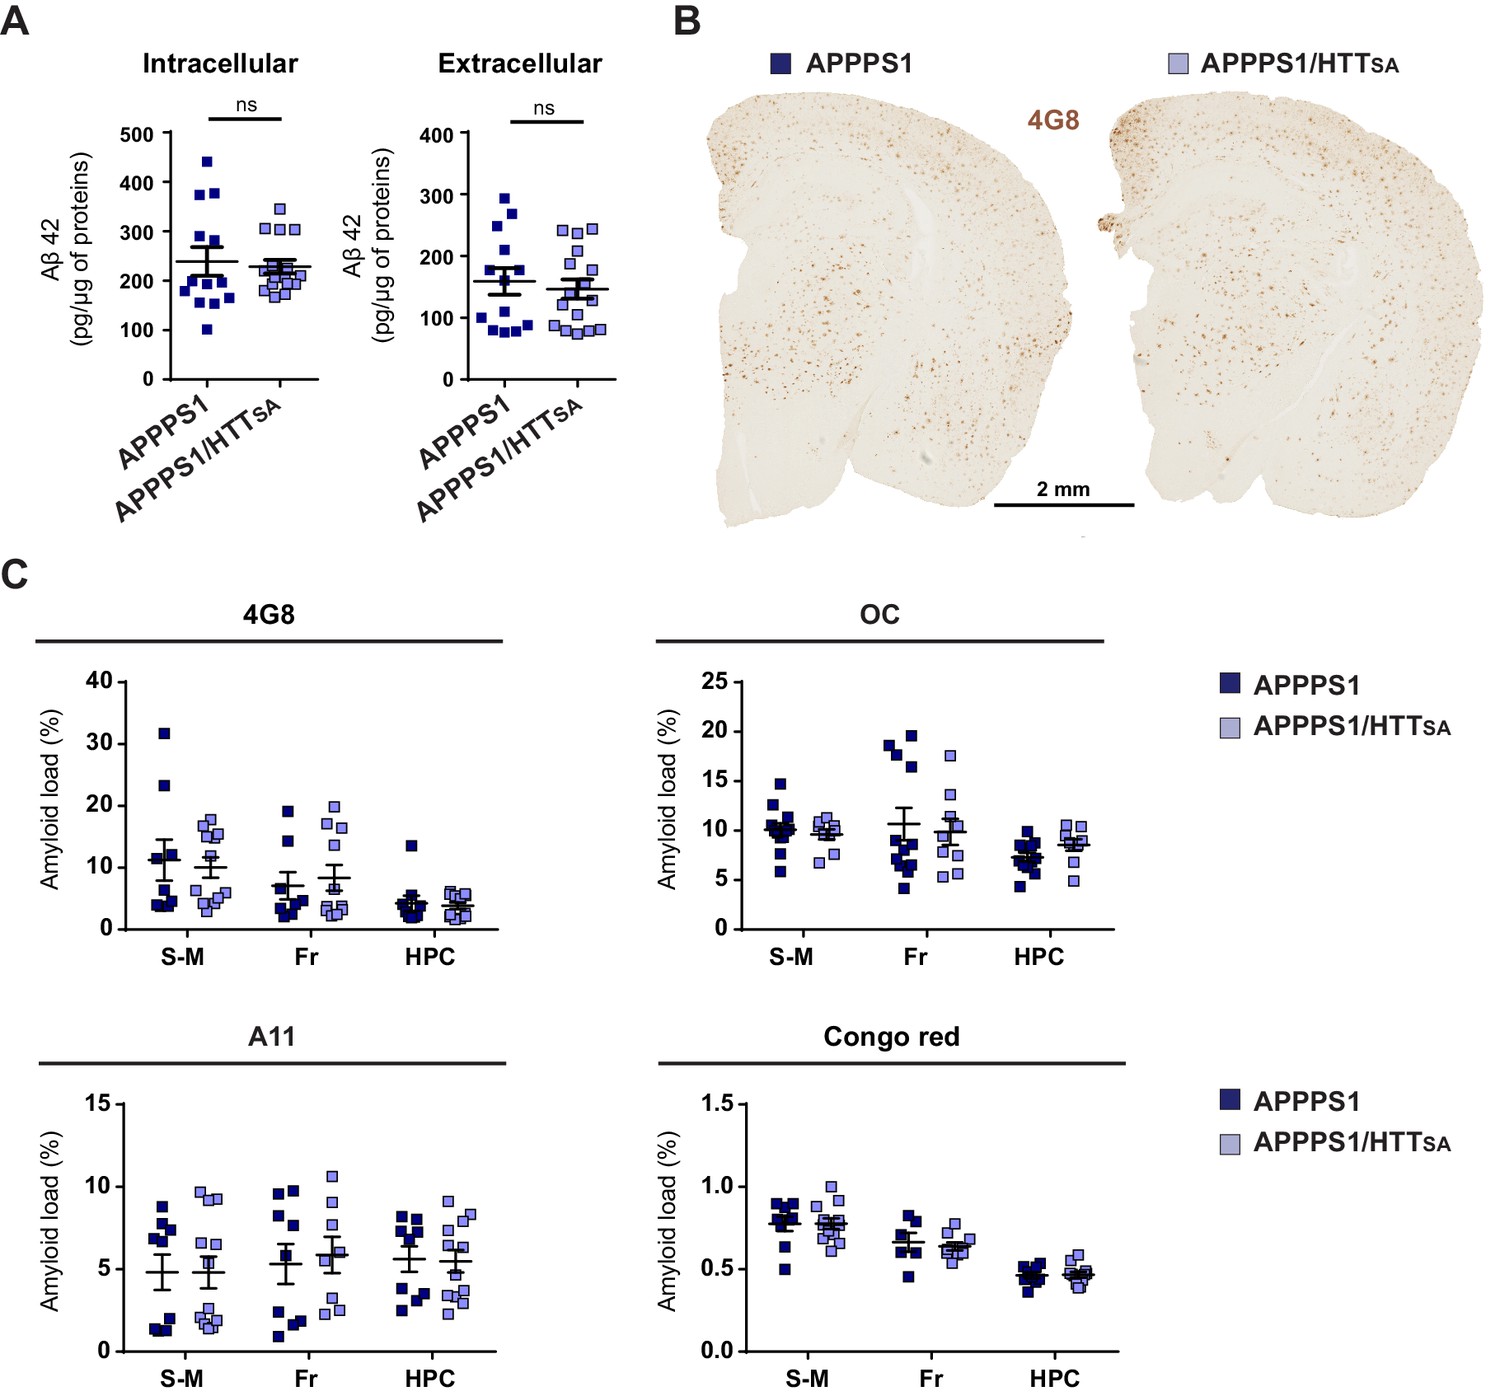
Analysis of soluble Aβ42 levels, amyloid plaques and amyloid load in APPPS1 and APPPS1/HTTSA mice.
(A) Soluble Aβ42 levels were measured in APPPS1 and APPPS1/HTTSA mouse brains 19-month-old. The data are represented as means ± SEM. Significance was determined using Mann-Whitney test; ns = not significant. (B) APPPS1 and APPPS1/HTTSA coronal brain sections from 19-month-old mice were immunostained with the 4G8 antibody to visualize amyloid plaques. Scale bar = 2 mm. (C) Amyloid loads in in APPPS1 mice (n = 9) and APPPS1/HTTSA mice (n = 12) were measured in coronal brain sections from the sensori-motor cortex (S–M), frontal cortex (Fr), and hippocampus (HPC) using Congo red histochemistry, 4G8 antibody, anti-Aβ fibrillary Aβ oligomers (OC), and anti-prefibrillar Aβ oligomers (A11). Data were analyzed using a Two-way ANOVA and are represented as mean ± SEM; ns = not significant.
-
Figure 8—figure supplement 1—source data 1
Statistical analysis of soluble of Aβ42 levels in APPPS1/HTTSA brains.
- https://cdn.elifesciences.org/articles/56371/elife-56371-fig8-figsupp1-data1-v2.xlsx
-
Figure 8—figure supplement 1—source data 2
Statistical analysis of amyloïd load in APPPS1/HTTSA brains.
- https://cdn.elifesciences.org/articles/56371/elife-56371-fig8-figsupp1-data2-v2.xlsx
Figure 9 with 1 supplement
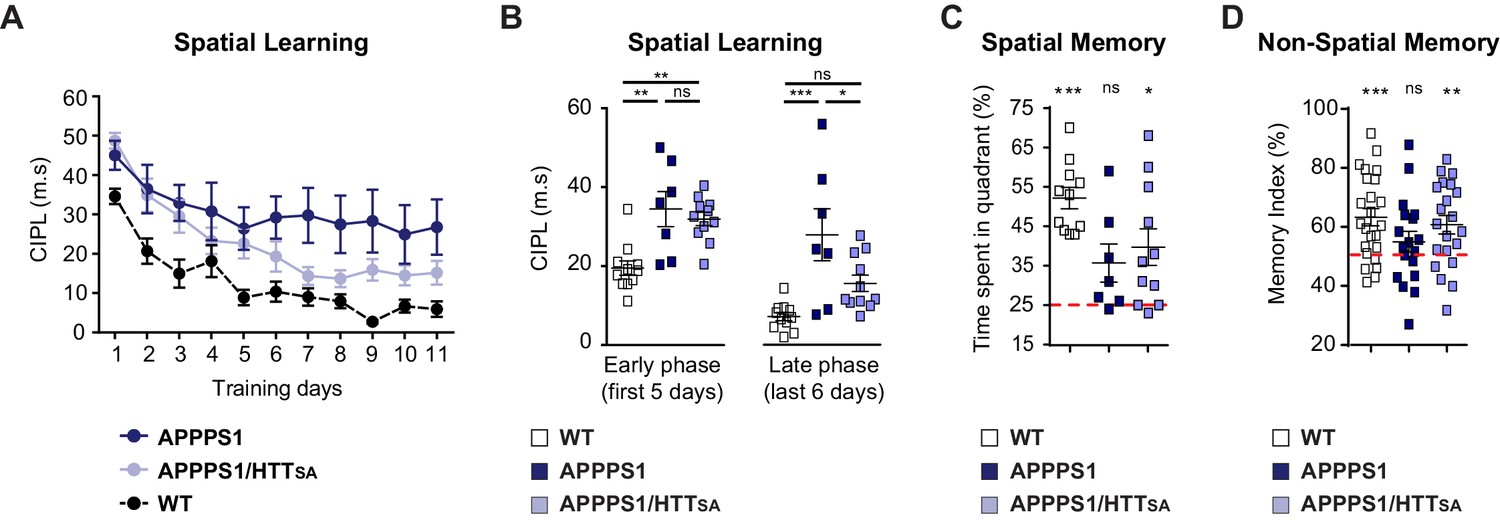
HTT S421 dephosphorylation enhances learning and memory in APPPS1 mice.
(A) Spatial learning of 7 APPPS1 mice (dark blue), 11 APPPS1/HTTSA mice (light blue), and 11 WT mice (black dotted line) was assessed by measuring CIPL (Corrected Integrated Path Length), an unbiased measure of learning in the Morris water maze test over 11 days of training. Data are represented as mean ± SEM. (B) Cumulative CIPL during the early phase (first 5 days) and the late phase (last 6 days) of training is depicted for WT, APPPS1 and APPPS1/HTTSA mice. All values are means ± SEM. Significance was determined using one-way ANOVA test followed by Tukey’s post-hoc analysis for multiple comparisons; *p<0.05, **p<0.01, ***p<0.001; ns = not significant. (C) Spatial memory of 11 WT, 7 APPPS1 and 11 APPPS1/HTTSA mice was assessed on a probe trial performed 72 hr after the last training day and during which the percentage of time spent in the target quadrant was quantified. All values are means ± SEM. Significance above the 25% chance level was determined using a one-sample t-test for each group. *p<0.05, ***p<0.001; ns = not significant. (D) Non-spatial memory of 24 WT, 18 APPPS1 and 21 APPPS1/HTTSA mice was assessed by the novel object recognition memory test. Memory index is calculated as the percentage of time spent exploring a novel object versus the time spent exploring both familiar and novel objects after a retention interval of 3 hr. All values are means ± SEM. A score of 50% indicates no preference (i.e., no memory). Performance significantly above the 50% chance level was determined using a one-sample t-test for each group. **p<0.01, ***p<0.001; ns = not significant.
-
Figure 9—source data 1
Statistical analysis of spatial learning of APPPS1/HTTSA mice.
- https://cdn.elifesciences.org/articles/56371/elife-56371-fig9-data1-v2.xlsx
-
Figure 9—source data 2
Statistical analysis of cumulative CIPL.
- https://cdn.elifesciences.org/articles/56371/elife-56371-fig9-data2-v2.xlsx
-
Figure 9—source data 3
Statistical analysis of spatial memory of APPPS1/HTTSA mice.
- https://cdn.elifesciences.org/articles/56371/elife-56371-fig9-data3-v2.xlsx
-
Figure 9—source data 4
Statistical analysis of non spatial memory of APPPS1/HTTSA mice.
- https://cdn.elifesciences.org/articles/56371/elife-56371-fig9-data4-v2.xlsx
Figure 9—figure supplement 1
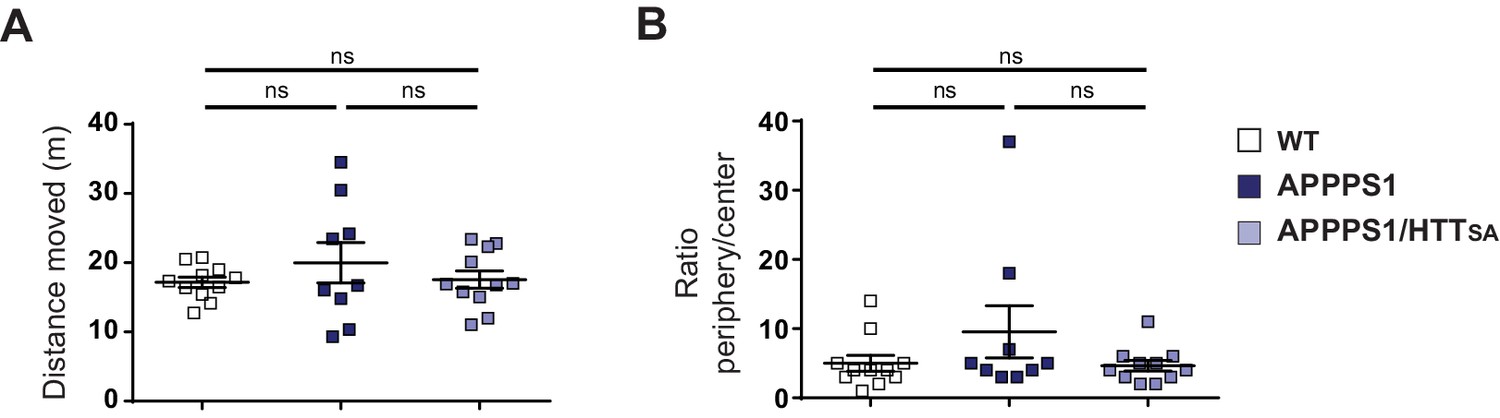
Behavioral analyses of the locomotion and anxiety-related behavior in WT, APPPS1 and APPPS1/HTTSA mice.
(A) Locomotor activity of 19-month-old WT (n = 23), APPPS1 (n = 18) and APPPS1/HTTSA (n = 23) mice was assessed by the total distance travelled in the open field arena. The data are represented as mean ± SEM. Significance was determined using a one-way ANOVA; ns = not significant. (B) Anxiety-related behavior of WT (n = 23), APPPS1 (n = 18) and APPPS1/HTTSA (n = 23) mice was evaluated by the time spent in the periphery versus center of the open field arena. All values are means ± SEM. Significance was determined using a one-way ANOVA; ns = not significant.
-
Figure 9—figure supplement 1—source data 1
Statistical analysis of the distance moved in an open field by APPPS1/HTTSA mice.
- https://cdn.elifesciences.org/articles/56371/elife-56371-fig9-figsupp1-data1-v2.xlsx
-
Figure 9—figure supplement 1—source data 2
Statistical analysis of the time spent in the periphery of an open field by APPPS1/HTTSA mice.
- https://cdn.elifesciences.org/articles/56371/elife-56371-fig9-figsupp1-data2-v2.xlsx
Author response image 1
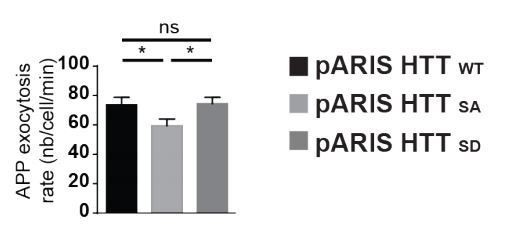
Extended version of Figure 5A showing the comparison in APP exocytosis in cells expressing WT full length HTT (pARIS HTT WT), or version with S421A (pARIS HTT SA) or S421D (pARIS HTT SD) mutations.
Videos
Video 1
Axonal Transport of APP-mCherry in presynaptic cortical neurons at DIV13.
Vesicles were recorded for 60 s at 5 Hz. Axons are oriented from soma (top of the channel) to neurite terminals (bottom) with anterograde vesicles going down. Scale bar, 20 µm.
Video 2
Transport of APP-mCherry (right panel) in MAP2-GFP positive postsynaptic cortical dendrites (left panel) at DIV13.
Vesicles were recorded for 60 s at 5 Hz. Dendrites are oriented from soma (top of the channel) to neurite terminals (bottom) with outward vesicles going down. Scale bar, 20 µm.
Video 3
APP-mCherry transport in WT (left panel) or HTTSA (right panel) axons at DIV13.
Vesicles were recorded for 60 s at 5 Hz. Axons are oriented from soma (top of the channel) to neurite terminals (bottom) with anterograde vesicles going down. Scale bar, 20 µm.
Video 4
Effect of Akt on the axonal transport of APP-mCherry in presynaptic cortical neurons from WT or HTTSA mice at DIV13.
Vesicles were recorded for 60 s at 5 Hz. Axons are oriented from soma (top of the channel) to neurite terminals (bottom) with anterograde vesicles going down. Scale bar, 20 µm.
Video 5
APP-SEP co-transfected in COS cells with pARIS WT HTT (left panel) or pARIS HTTSA (right panel) visualized by TIRF microscopy.
Vesicle exocytosis of APP was recorded at 5 Hz. Scale bar, 20 µm.
Additional files
-
Supplementary file 1
The modified SHIRPA primary screen in WT and HTTSA mice.
Results are presented in percentages unless otherwise indicated. No significant differences between genotypes were observed.
- https://cdn.elifesciences.org/articles/56371/elife-56371-supp1-v2.docx
-
Transparent reporting form
- https://cdn.elifesciences.org/articles/56371/elife-56371-transrepform-v2.docx
Download links
A two-part list of links to download the article, or parts of the article, in various formats.
Downloads (link to download the article as PDF)
Open citations (links to open the citations from this article in various online reference manager services)
Cite this article (links to download the citations from this article in formats compatible with various reference manager tools)
Presynaptic APP levels and synaptic homeostasis are regulated by Akt phosphorylation of huntingtin
eLife 9:e56371.
https://doi.org/10.7554/eLife.56371


