A mechanism for the extension and unfolding of parallel telomeric G-quadruplexes by human telomerase at single-molecule resolution
- Molecular Horizons and School of Chemistry and Molecular Bioscience, University of Wollongong, Australia
- Illawara Health and Medical Research Institute, Australia
- Children’s Medical Research Institute, University of Sydney, Australia
- Department of Chemistry, McGill University, Canada
- School of Science, College of Science, Engineering and Health, RMIT University, Australia
- Department of Chemistry and Center of Excellence for Innovation in Chemistry, Faculty of Science, Srinakharinwirot University, Thailand
- Department of Biobased Materials Science, Kyoto Institute of Technology, Matsugasaki, Sakyo-ku, Japan
- Institut Curie, PSL Research University, France
- Université Paris Sud, Université Paris-Saclay, France
- Instituto de Química Física ‘Rocasolano’, CSIC, Spain
Figures
Figure 1
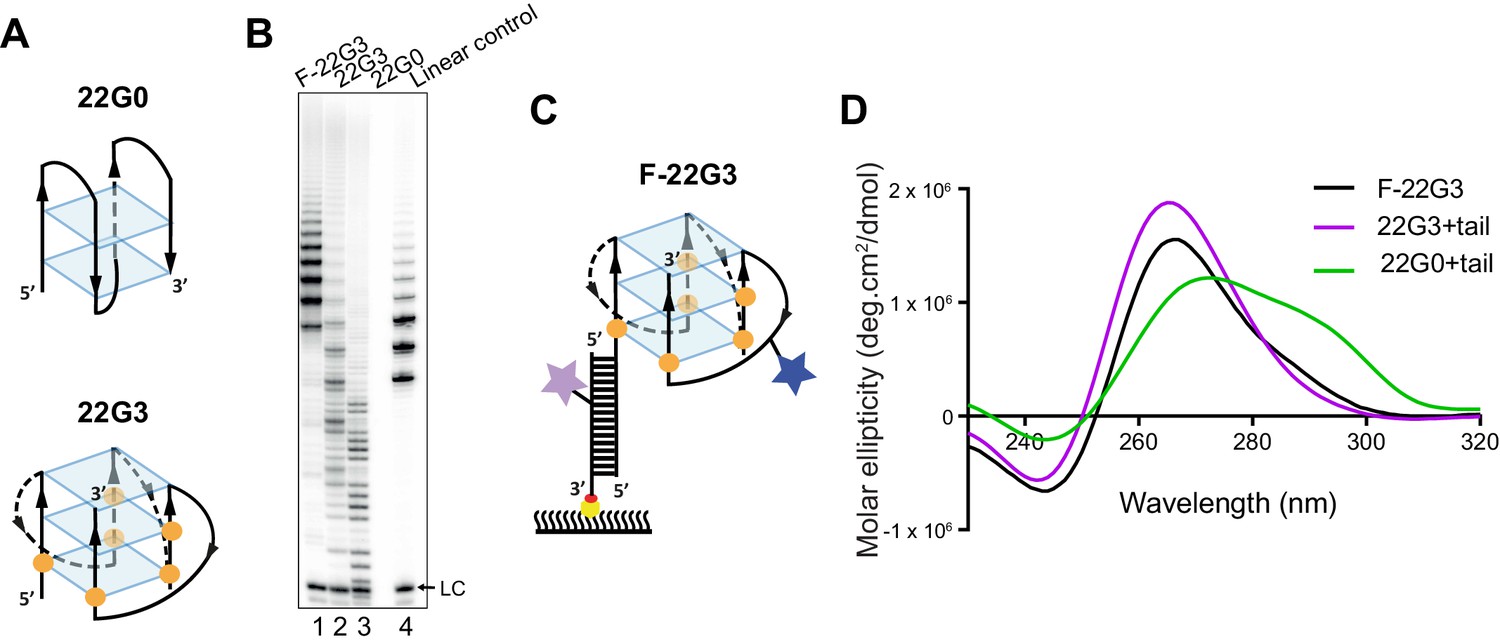
Telomerase extends a parallel intramolecular G-quadruplex.
(A) Schematic of the likely topology of (top) an antiparallel G-quadruplex formed from unmodified telomeric 22-mer 22G0 and (bottom) a parallel unimolecular G-quadruplex formed from a telomeric 22-mer with 2'F-araG in the indicated positions (orange circles). (B) Telomerase extension assays in the presence of radiolabeled dGTP (α32P-dGTP). The extension products of 2 µM each of fluorescently-labeled 22G3 (F-22G3), unlabeled 22G3, unmodified 22G0 and linear control oligonucleotide Bio-L-18GGG (see Supplementary file 1) were analyzed using denaturing polyacrylamide gel electrophoresis. LC: 5'-32P-labeled synthetic 12 nt DNA used as a recovery/loading control. (C) The F-22G3 FRET construct, showing the positions of the FRET dye pair and biotin for immobilization onto the functionalized coverslip. Blue star: AlexaFluor 555 (donor dye); purple star: AlexaFluor 647 (acceptor dye); orange circles: 2'F-araG; red circle: biotin; yellow circle: Neutravidin. (D) CD spectra of G4 (20 µM) formed from 2'F-araG-modified 5’-extended 22G3 labeled with a FRET dye (22G3+tail), and the same G4 after hybridization to a second oligonucleotide bearing a second FRET dye (F-22G3). A peak at 265 nm is characteristic of parallel G4; the slight shoulder at ~290 nm in the F-22G3 spectrum is attributable to duplex DNA since it is absent from the spectrum of 22G3+tail. 22G0+tail is a control oligonucleotide of equal length and base composition to 22G3+tail, but with no 2’F-ara G substitutions or conjugated dye.
Figure 2 with 4 supplements
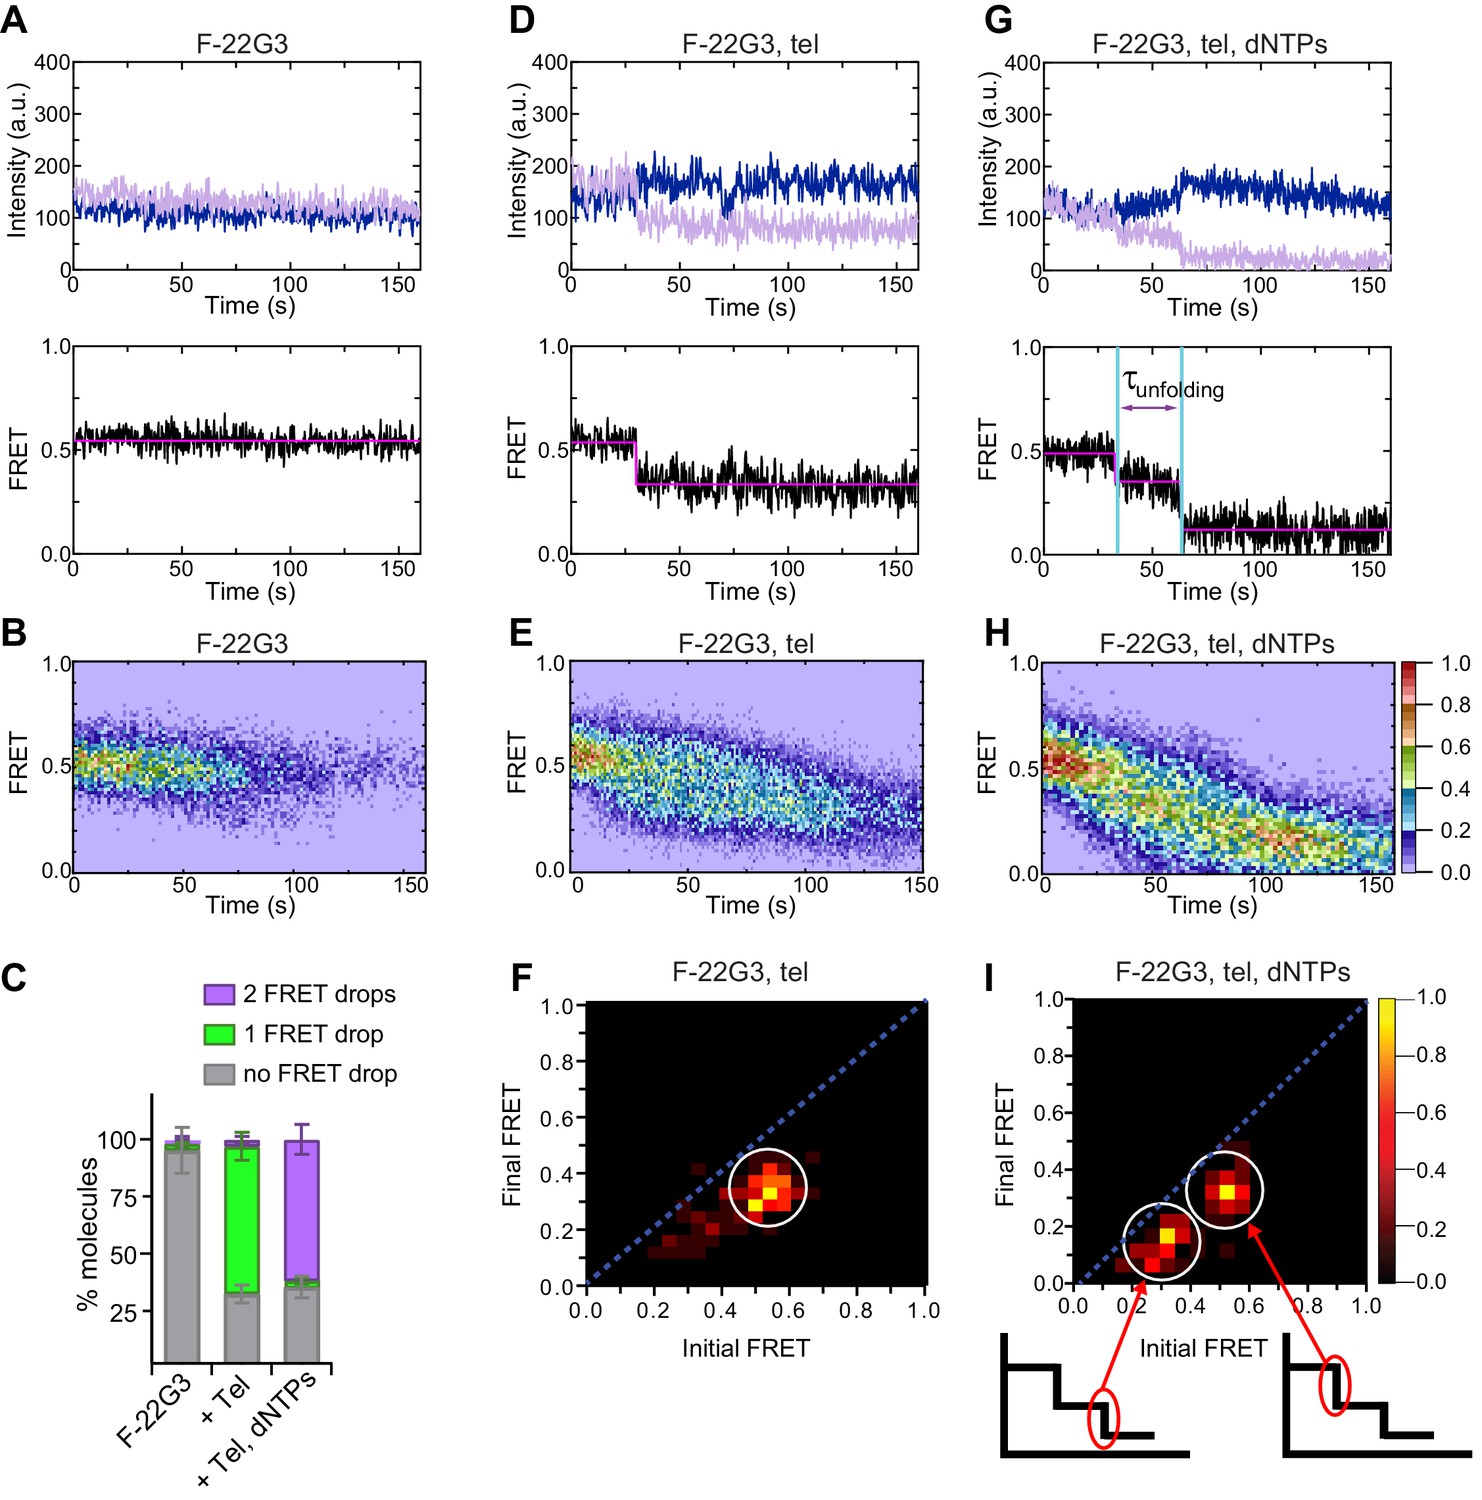
Telomerase unfolds a parallel intramolecular G-quadruplex.
(A), (D), (G) Representative single-molecule acceptor (purple) and donor (blue) intensities of F-22G3 molecules over time (top panels), and the FRET traces (bottom panels) representing the ratio of acceptor intensity to the sum of acceptor and donor intensities, of either F-22G3 alone (A), in the presence of telomerase (D), or in the presence of telomerase and dNTPs (G). (B), (E), (H) Heat maps of the distribution of FRET intensities over 0–150 s of F-22G3, either alone (n = 99) (B), in the presence of telomerase (n = 125) (E), or in the presence of telomerase and dNTPs (n = 90) (H). All plots include molecules collected in 4–6 independent experiments. For color key, see panel (H). (F), (I) Transition density plots (TDPs) showing the change in FRET value of molecules from experiments in (E) and (H) (n = 90 and 75, respectively). Schematics in (I) show assignment of each TDP peak to one of the two steps of FRET reduction observed in single molecule traces. (C) Plot of the percentage of molecules showing no change in FRET, a single FRET drop, or a two-step FRET drop, in the experiments shown in (A) to (I); error bars represent sample size/√total population.
-
Figure 2—source data 1
source data for the graph shown in Figure 2C.
- https://cdn.elifesciences.org/articles/56428/elife-56428-fig2-data1-v2.xlsx
Figure 2—figure supplement 1
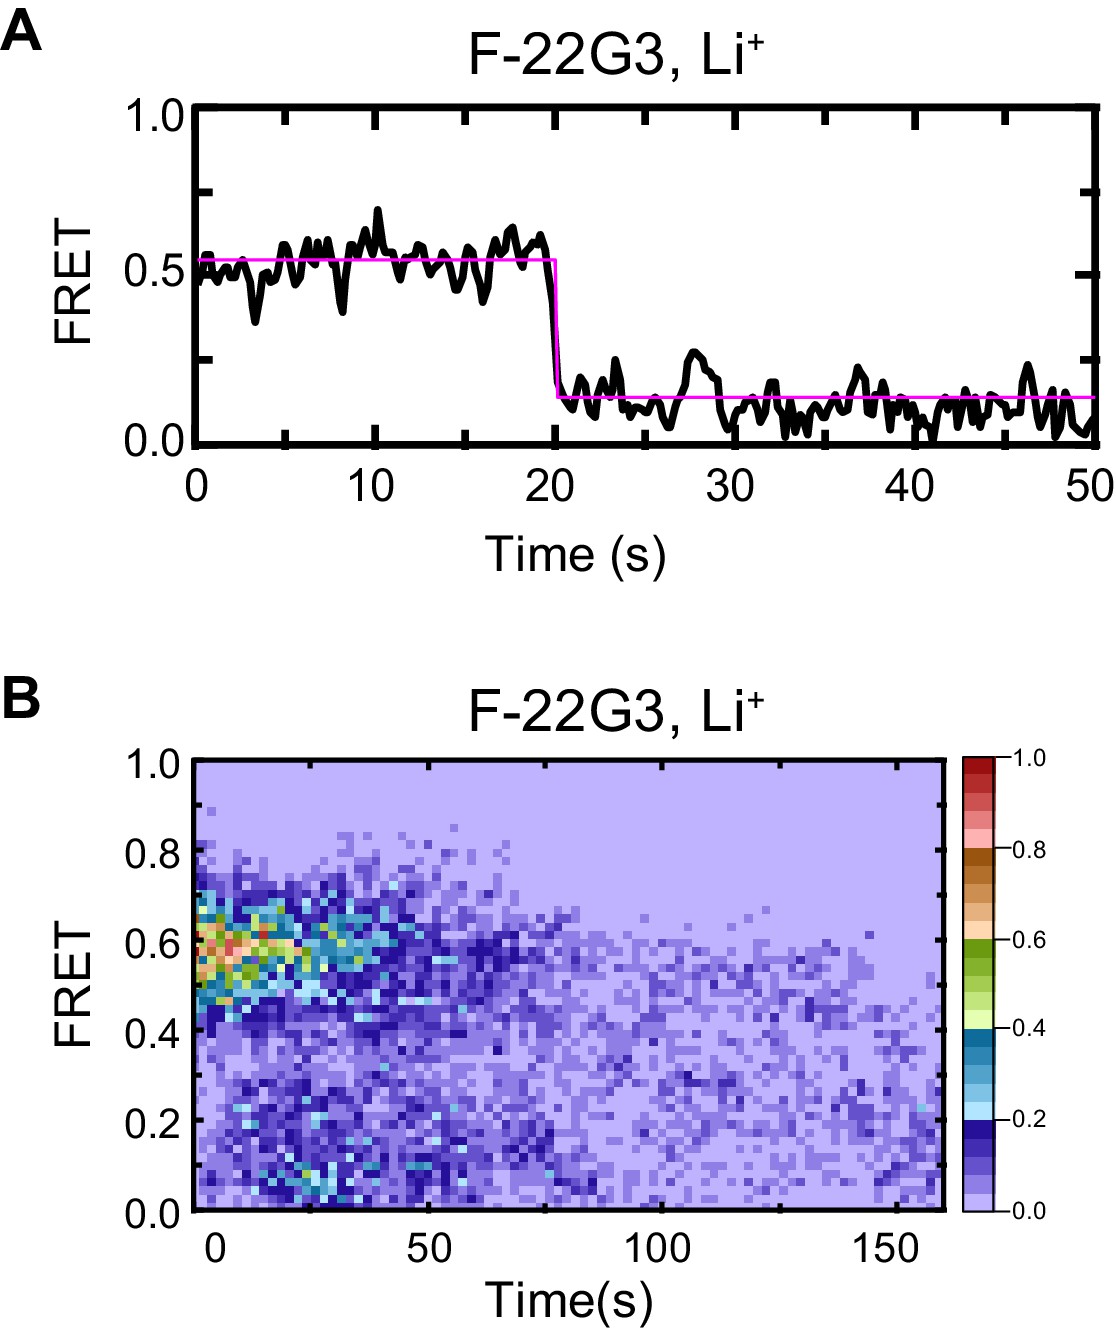
Control demonstrating G4 origin of ~0.5 FRET value of F-22G3.
Representative FRET trace (A) and heat map of the distribution of FRET intensities (B, n = 50) of F-22G3, surface immobilized in KCl-containing buffer, which was replaced with LiCl-containing buffer after 5 s.
Figure 2—figure supplement 2
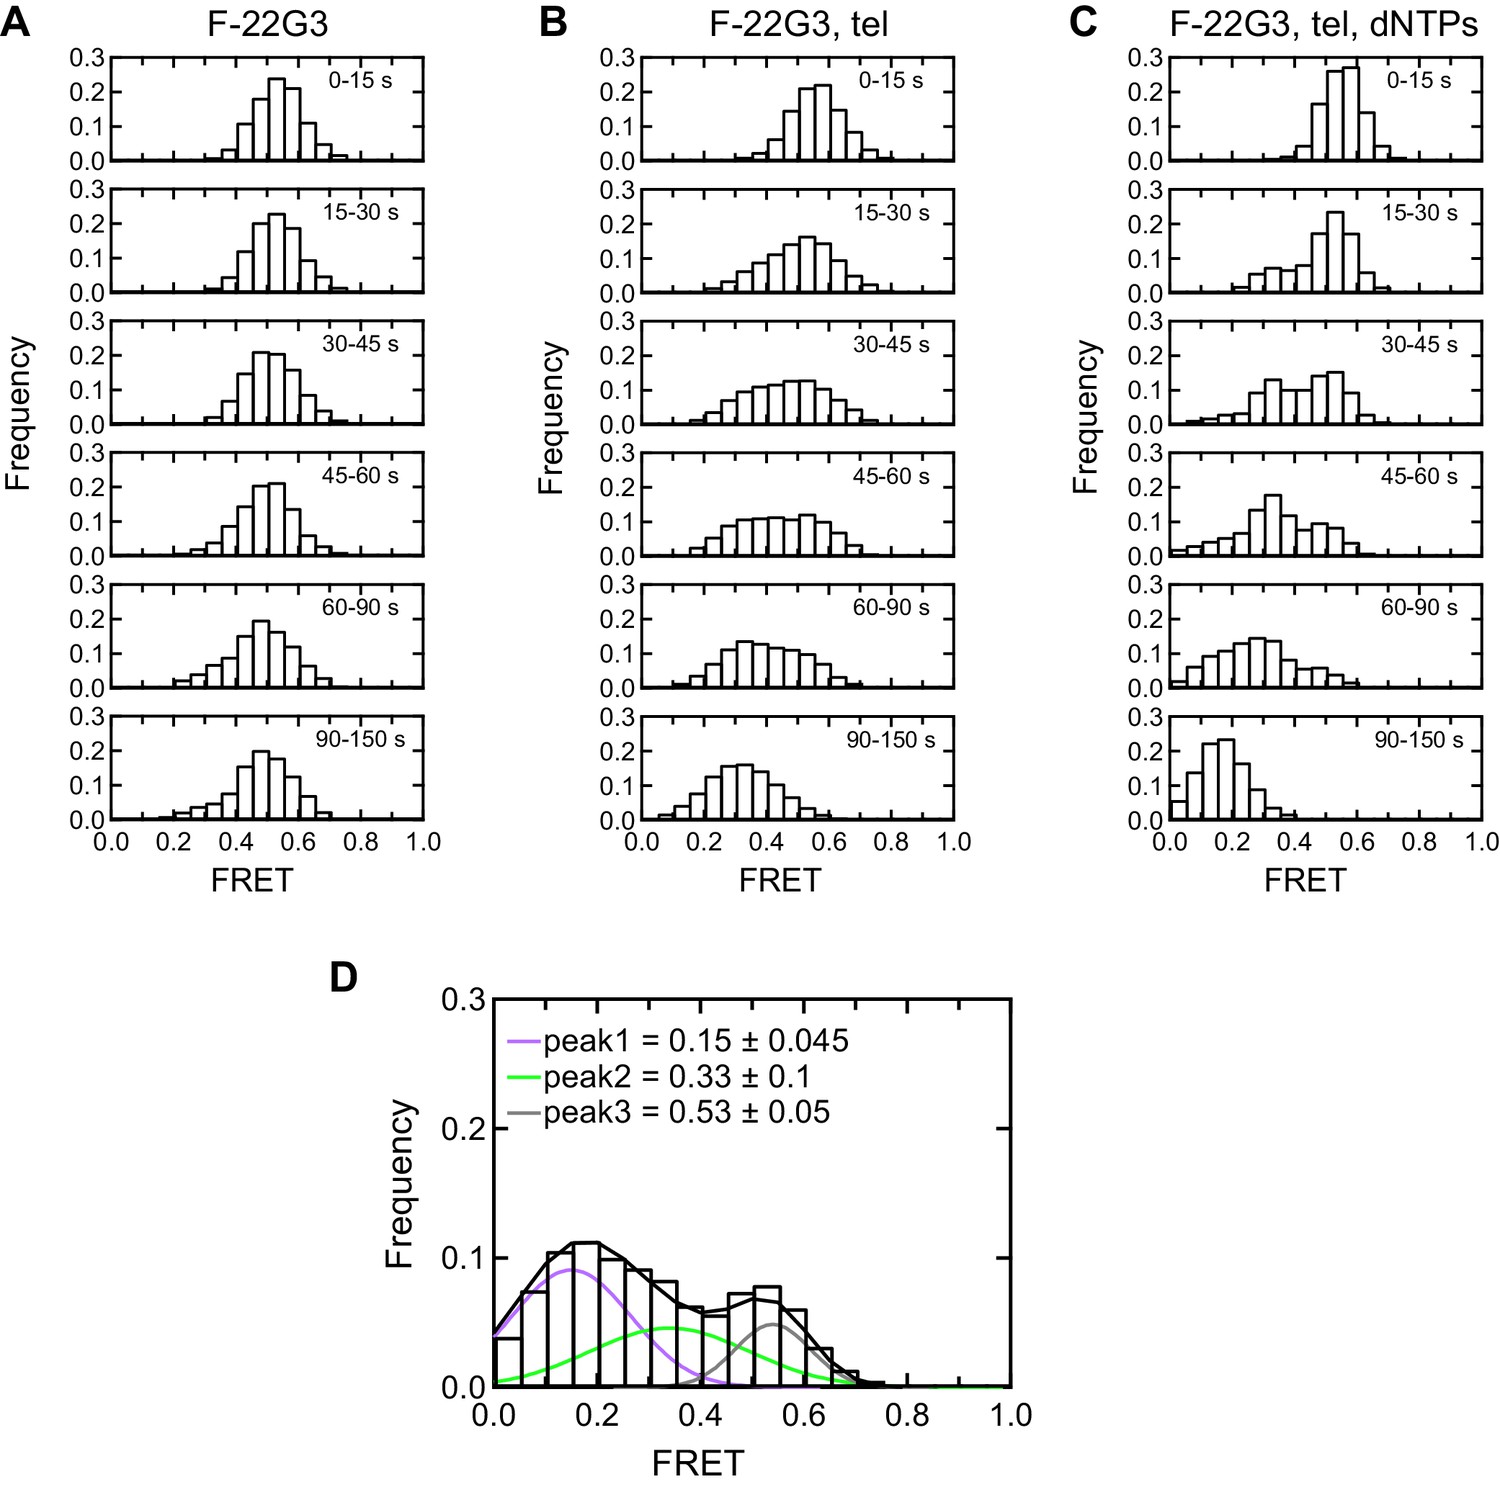
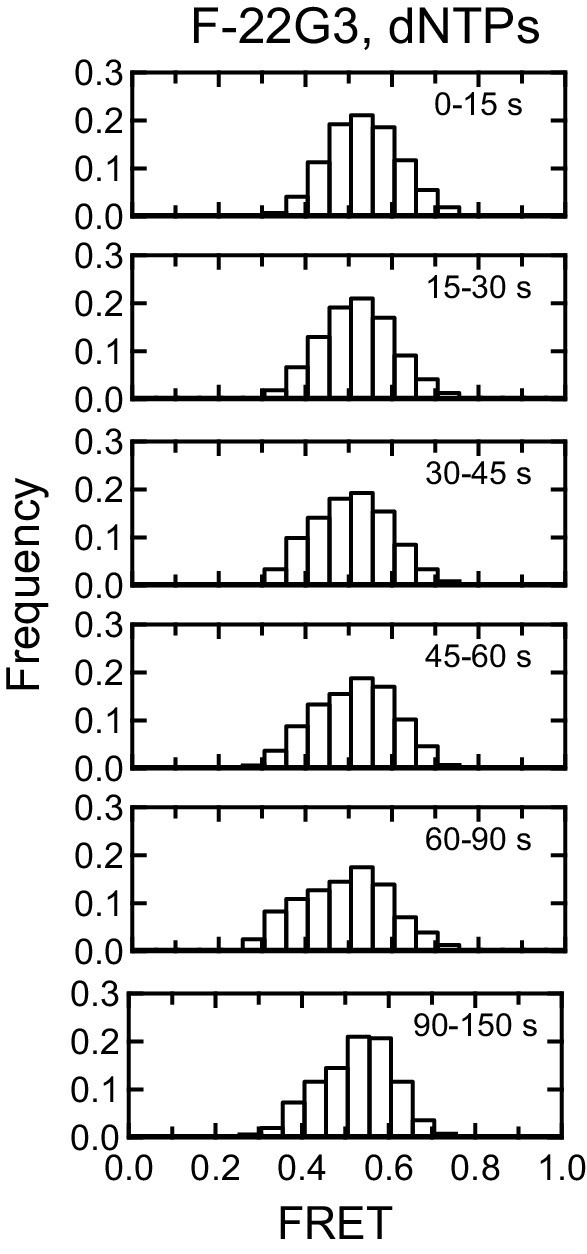
Histogram representations of F-22G3 FRET data.
(A–C) Histograms showing changes in FRET values of a population of F-22G3 molecules under different experimental conditions over 150 s, binned into 15–60 s time intervals. (D) Histogram showing three different FRET populations in the presence of telomerase and dNTPs; a multiple Gaussian fit was applied to obtain the mean FRET peaks of these populations, with errors representing the curve fitting errorstandard deviation of the data. n = 99 (A), 125 (B) and 90 (C), (D) molecules, collected in 2–4 independent experiments.
Figure 2—figure supplement 3
Control for effect of dNTPs on F-22G3 FRET.
Histograms showing changes in FRET values of a population of F-22G3 molecules in the presence of dNTPs but absence of telomerase over 150 s, binned into 15–60 s time intervals. n = 44 molecules.
Figure 2—figure supplement 4
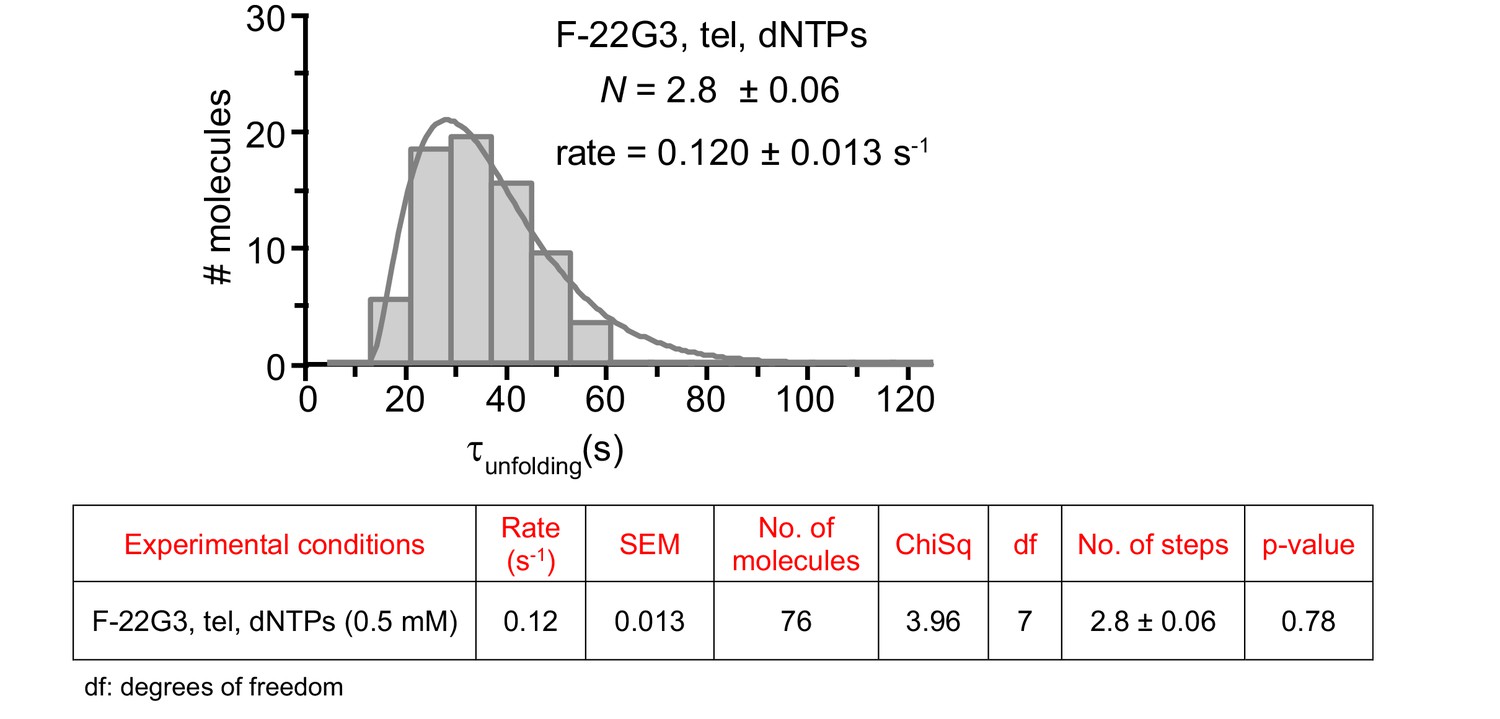
The unfolding rate of F-22G3, calculated by fitting the dwell time distributions of the intermediate FRET state (see Figure 2G) to a gamma distribution (n = 76 molecules).
N represents the number of kinetic steps in the best-fitting equation; fitting parameters (Chi-square and associated p-value) are shown in the table.
Figure 3 with 1 supplement
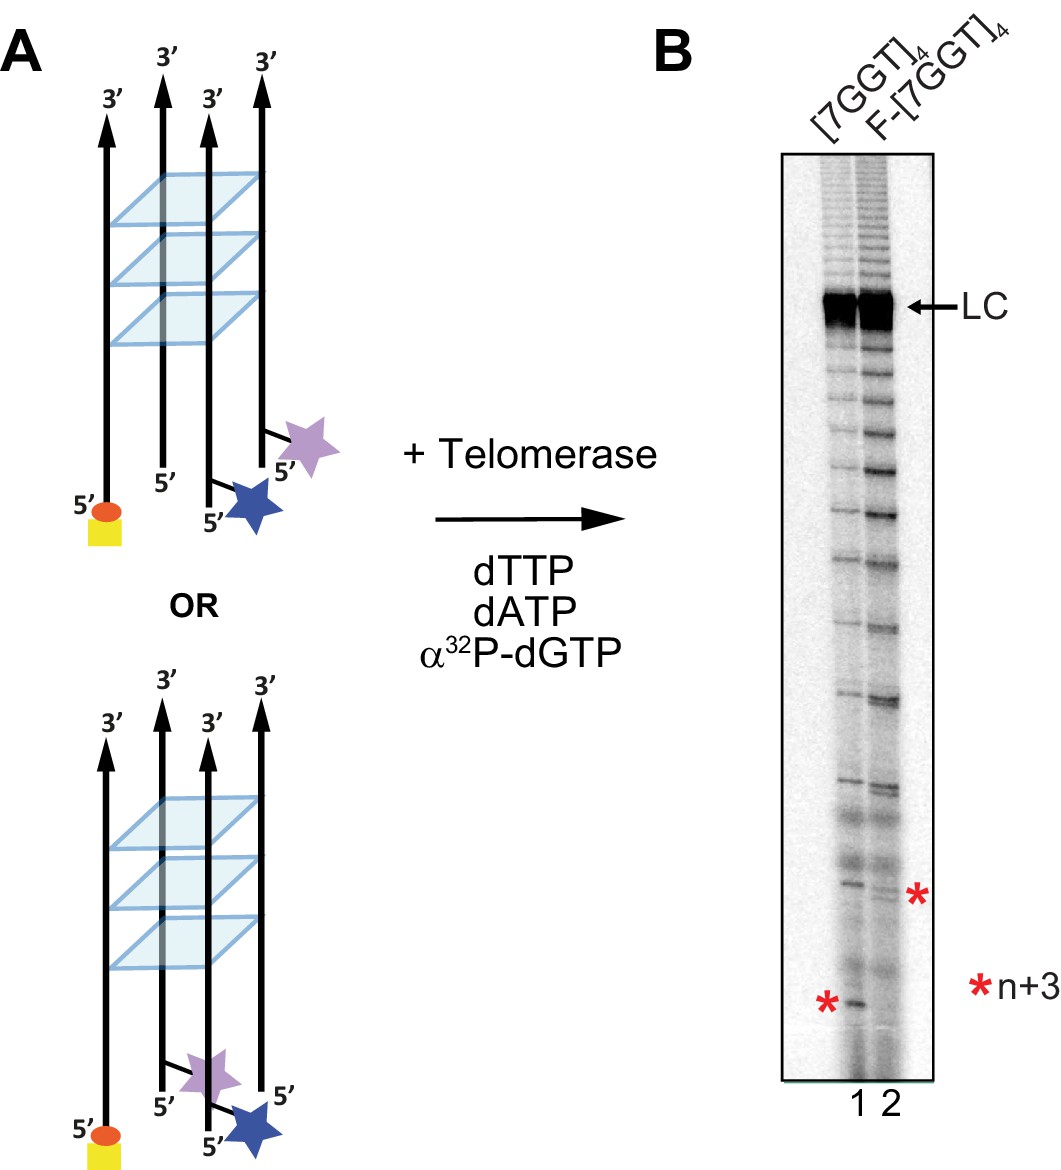
Telomerase extends a tetrameric parallel G-quadruplex.
(A) Schematic representation of F-[7GGT]4 used in smFRET studies. Blue star: AlexaFluor 555 (donor dye); purple star: AlexaFluor 647 (acceptor dye); red circle: biotin; yellow square: Neutravidin. (B) Telomerase extension assays using either 1 µM of unmodified [7GGT]4 or the version containing the FRET pair dyes (F-[7GGT]4); radiolabeled extension products were electrophoresed on a denaturing polyacrylamide gel (* indicates the position of n+3 products in the gel). LC: 5´-32P-labeled synthetic 100 nt DNA used as a recovery/loading control.
Figure 3—figure supplement 1

Properties of tetrameric G4 with added FRET dyes.
(A) Circular dichroism (CD) spectra of 10 µM fluorophore-modified F-[7GGT]4 and unmodified [7GGT]4. (B) Thermal stability of modified and unmodified [7GGT]4, measured using CD at 260 nm. Since intermolecular G-quadruplexes reform very slowly and are therefore not at equilibrium during the measurement, we refer to this value as T½ rather than Tm, which is the true thermodynamic parameter at equilibrium. Mean ± SD of 3 independent experiments.
Figure 4 with 4 supplements
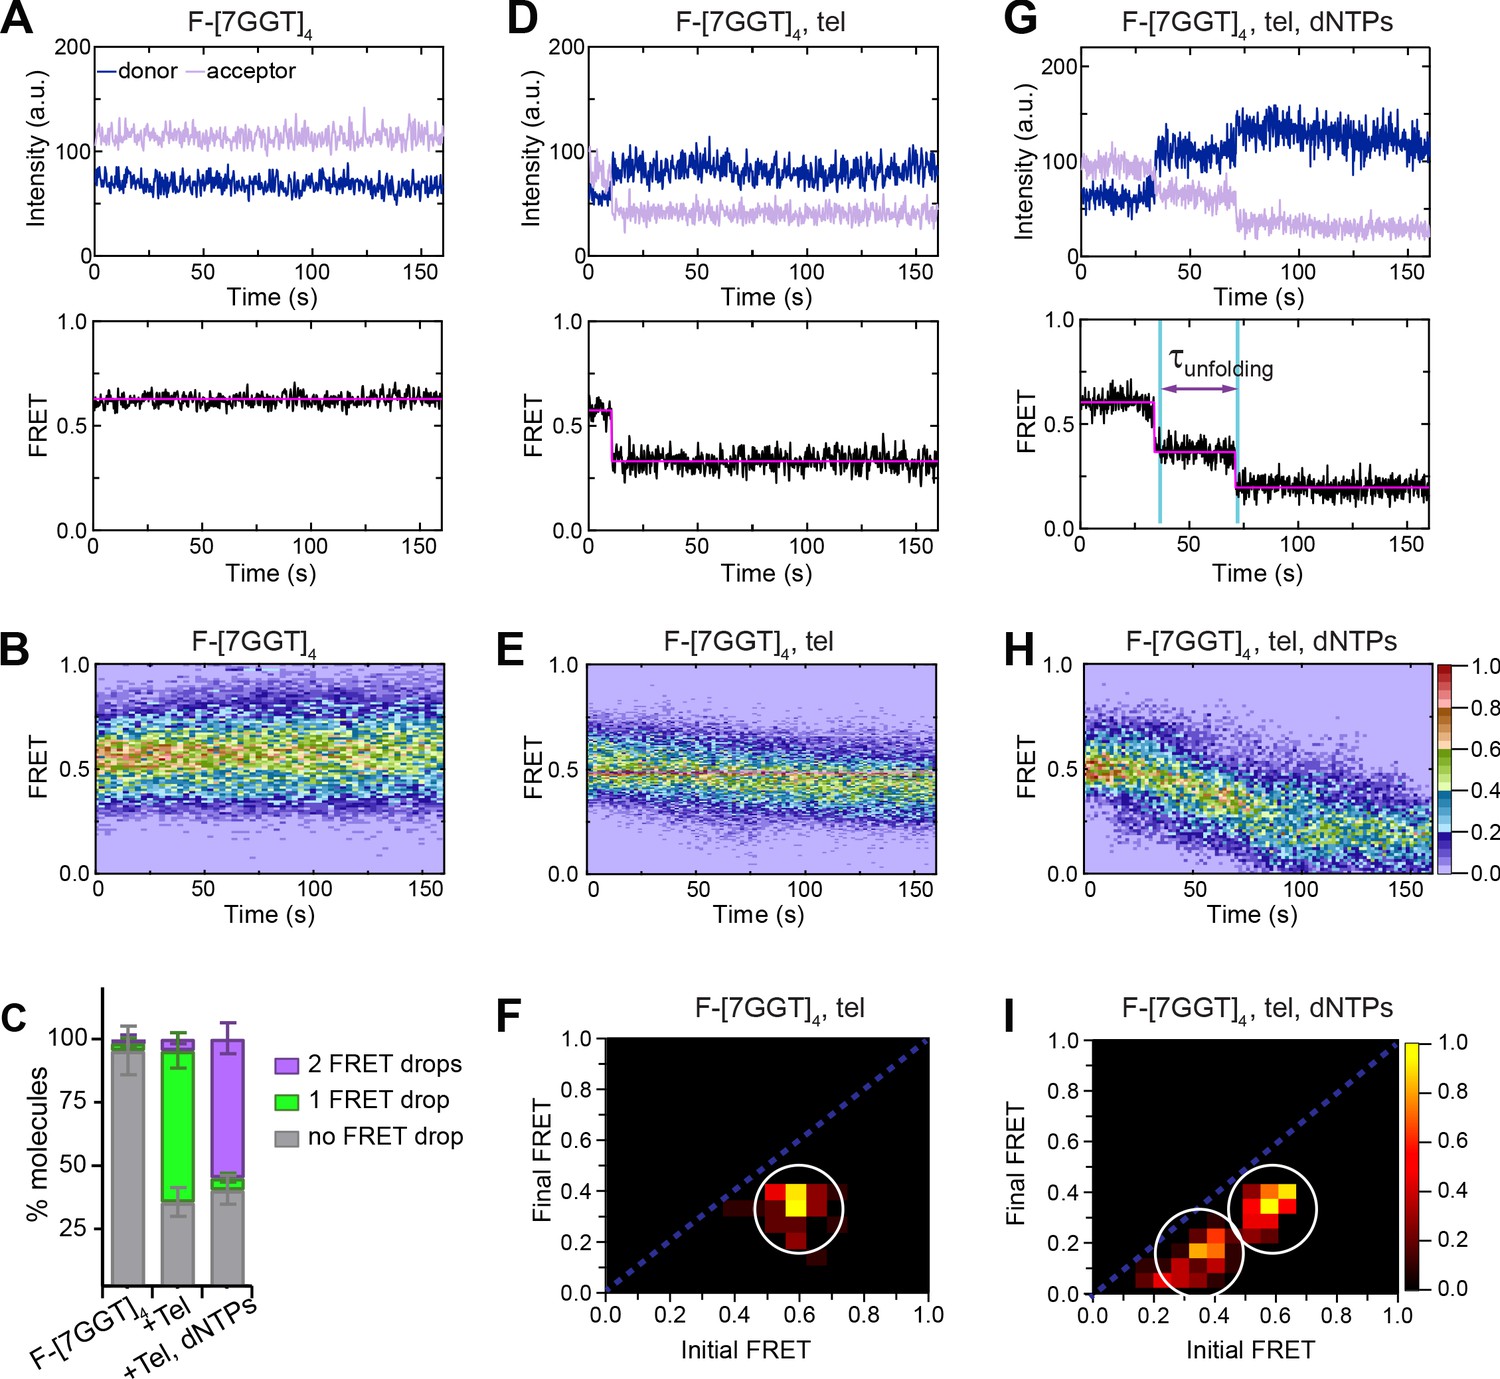
Telomerase unfolds a tetrameric parallel G-quadruplex.
(A), (D), (G) Representative single-molecule acceptor (purple) and donor (blue) intensities of F-[7GGT]4 molecules over time (top panels), and the corresponding FRET traces (bottom panels). (B), (E), (H) Heat maps of the distribution of FRET intensities over 0–150 s. For color key, see panel (H). Panels (A) and (B) represent F-[7GGT]4 alone (n = 105 molecules), (D) and (E) show F-[7GGT]4 in the presence of telomerase (n = 87), and (G and H) Show F-[7GGT]4 in the presence of telomerase and dNTPs (n = 81). All plots include molecules collected in 4–6 independent experiments. (C) Plot of the percentage of molecules showing no change in FRET, a single FRET drop, or a two-step FRET drop, in the experiments shown above; error bars represent sample size/√total population. (F), (I) TDPs depicting initial and final FRET states of all molecules that showed a change in FRET value, in the presence of telomerase (n = 65) (F) or telomerase and dNTPs (n = 75) (I). For color key, see panel (I).
-
Figure 4—source data 1
source data for the graph shown in Figure 4C.
- https://cdn.elifesciences.org/articles/56428/elife-56428-fig4-data1-v2.xlsx
Figure 4—figure supplement 1
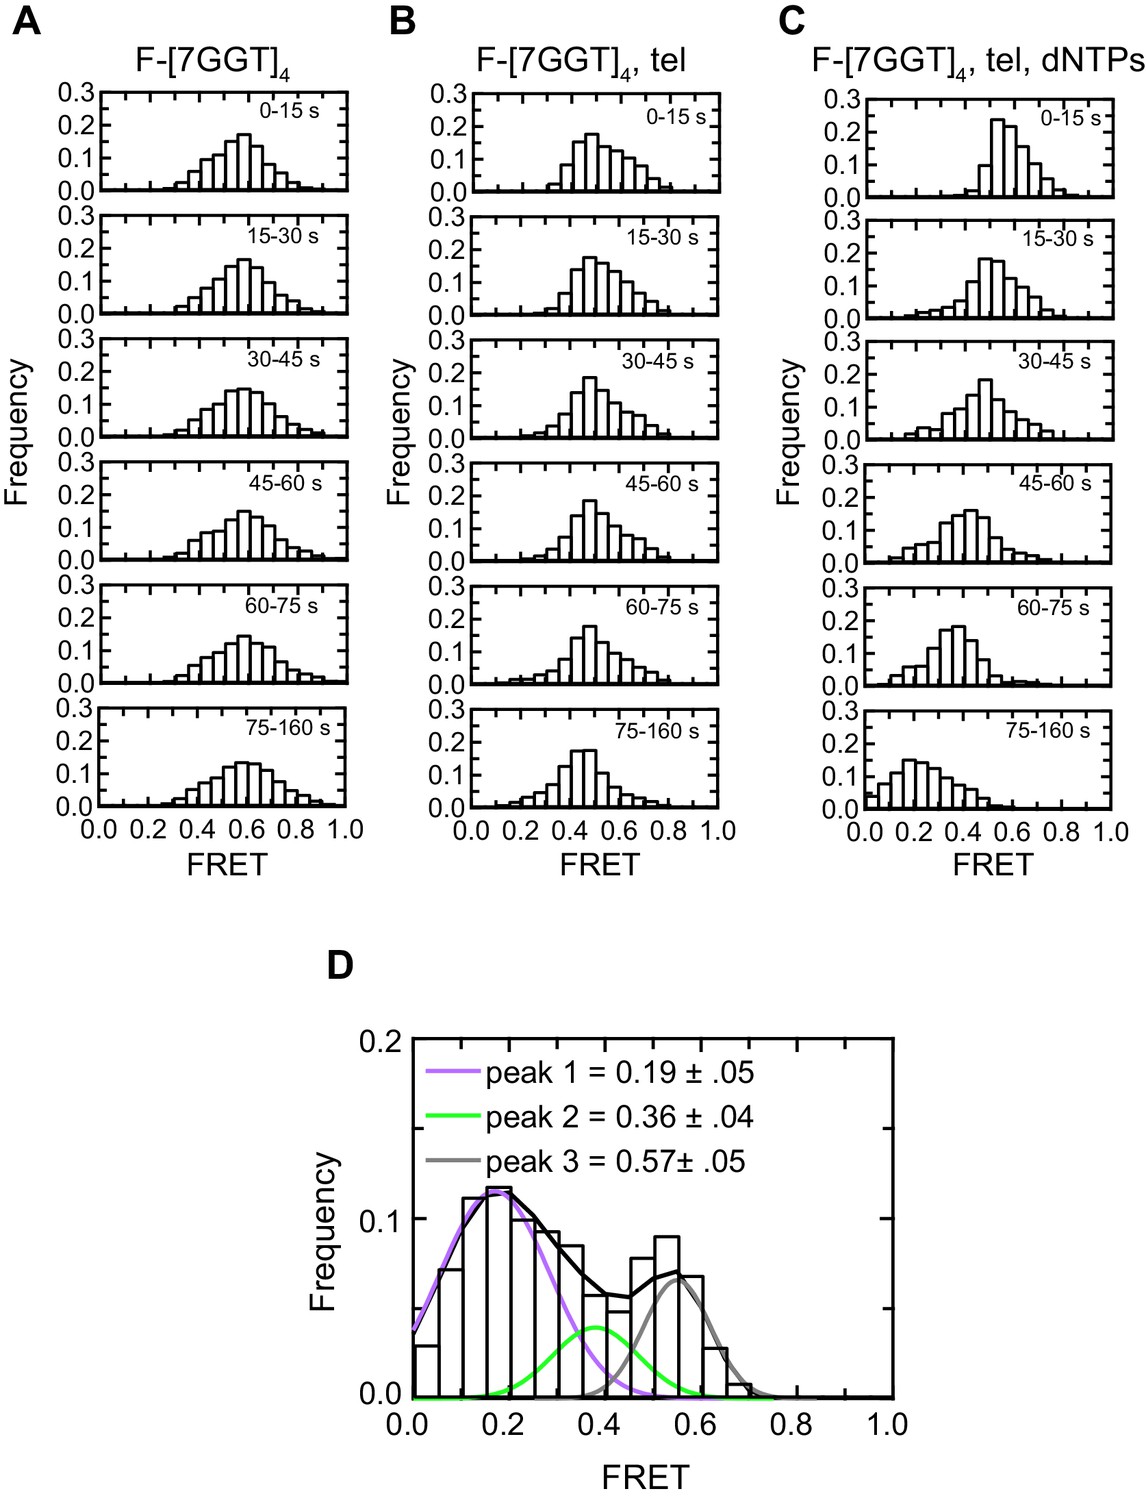
Histogram representations of F-[7GGT]4 data.
(A–C) Histograms showing changes in FRET values of a population of molecules under different experimental conditions over 160 s, binned into 15–85 s time intervals. (D) Histogram showing three different FRET populations in the presence of telomerase and dNTPs; a multiple Gaussian fit was applied to obtain the mean FRET peaks of these populations, with errors representing the curve fitting errorstandard deviation of the data. n = 105 (A), 87 (B) and 81 (C), (D) molecules, collected in 4–6 independent experiments.
Figure 4—figure supplement 2
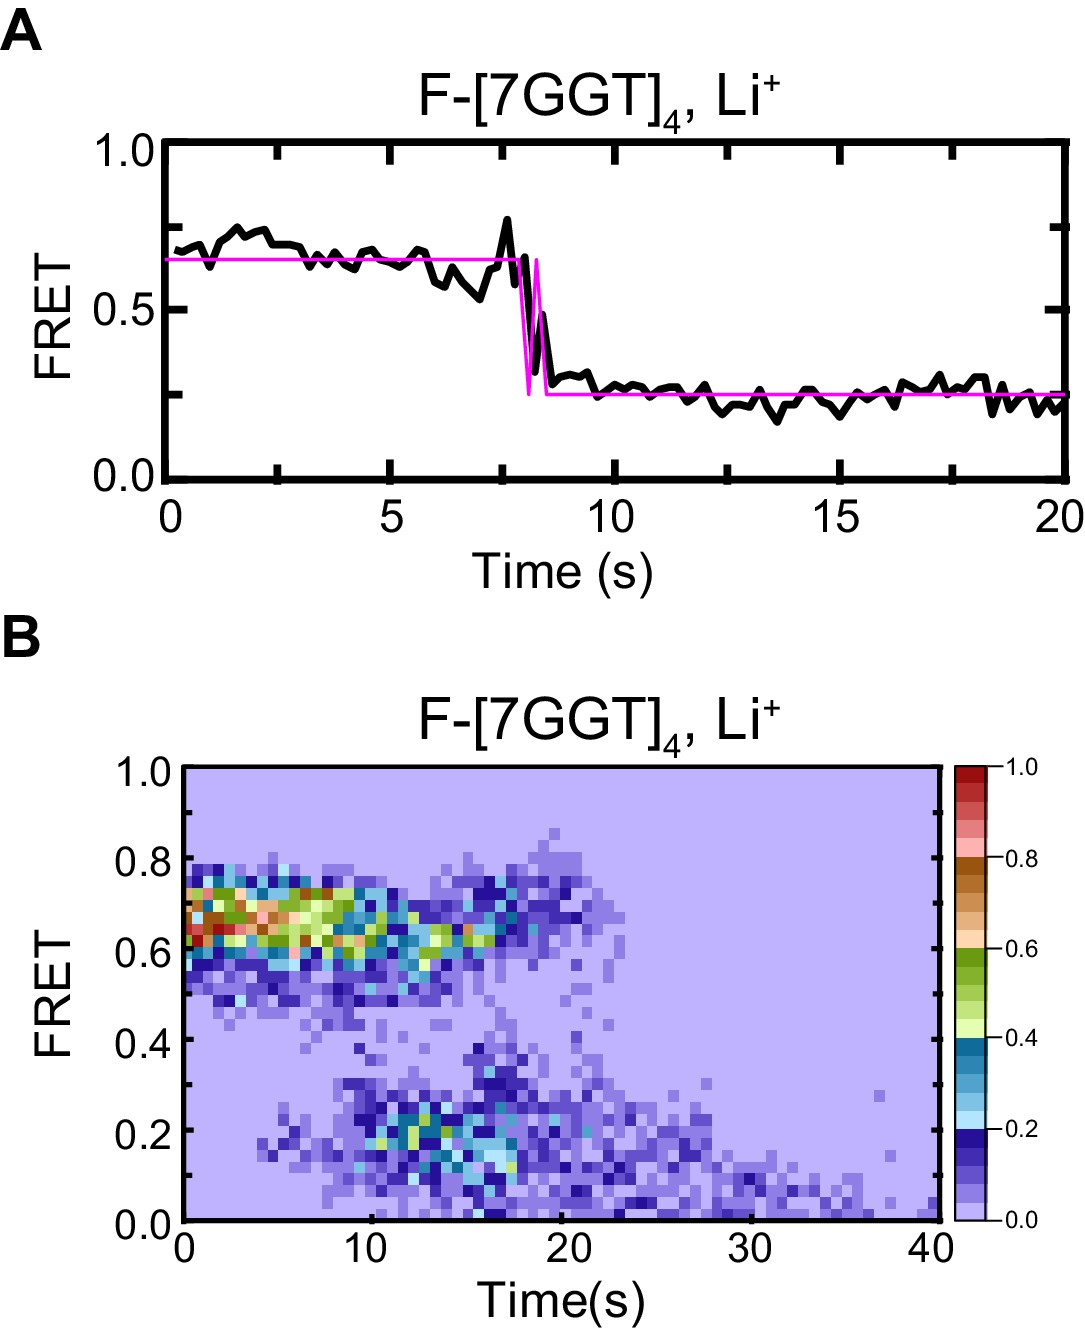
Control demonstrating G4 origin of ~0.5 FRET value of F-[7GGT]4.
Representative FRET trace (A) and heat map of the distribution of FRET intensities (B), n = 52) of F-[7GGT]4, surface immobilized in KCl-containing buffer, which was replaced with LiCl-containing buffer after 5 s.
Figure 4—figure supplement 3
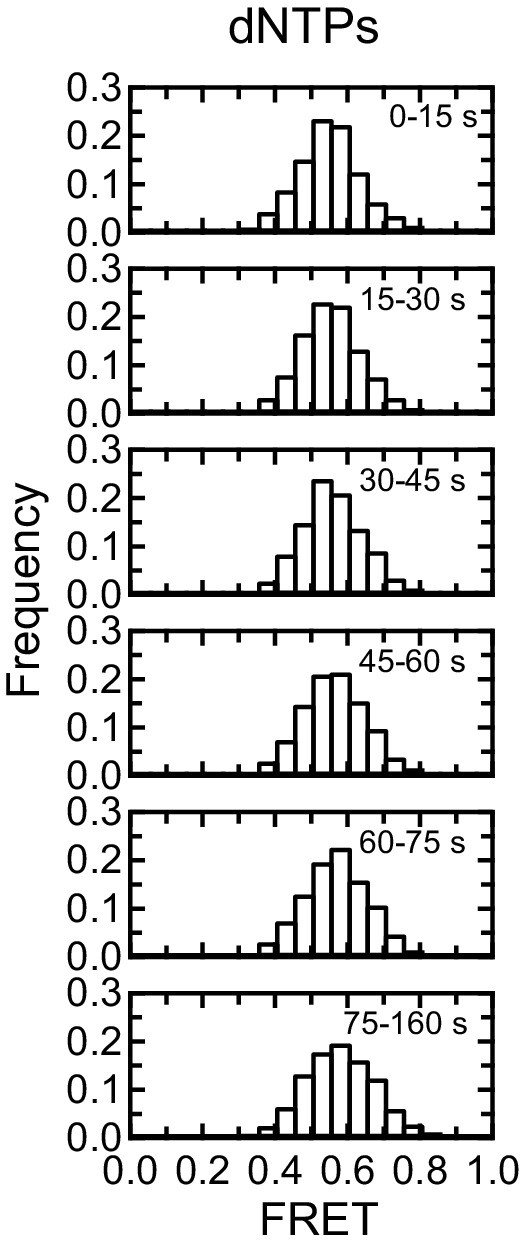
Control for effect of dNTPs on F-[7GGT]4 FRET.
Histograms showing changes in FRET values of a population of F-[7GGT]4 molecules in the presence of dNTPs but absence of telomerase over 150 s, binned into 15–85 s time intervals. n = 110 molecules.
Figure 4—figure supplement 4
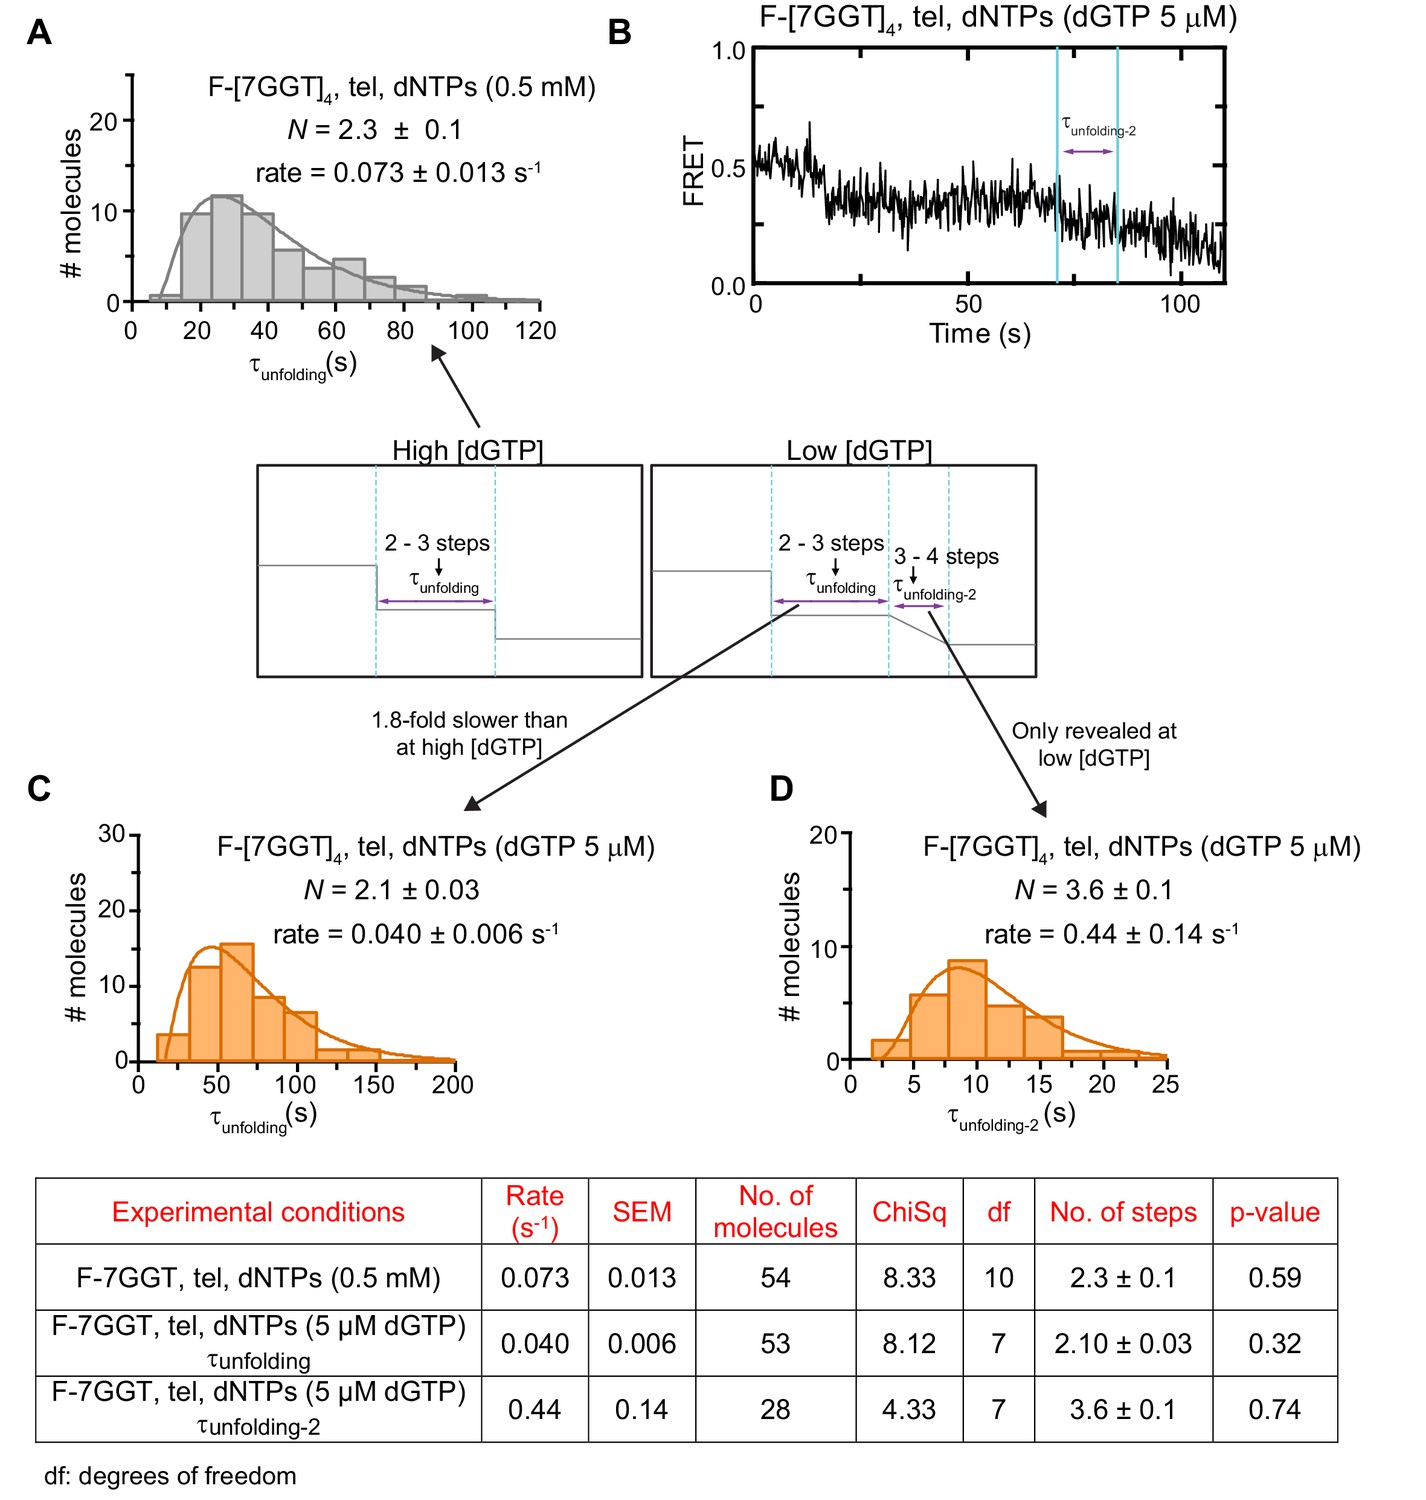
Unfolding rates of F-[7GGT]4 under different experimental conditions.
(A to C) The unfolding rates were calculated by fitting the dwell time distributions of the intermediate FRET state (see center schematic, left panel) to a gamma distribution, for F-[7GGT]4 in the presence of telomerase and either 0.5 mM of all dNTPs (A) or 0.5 mM dATP, 0.5 mM dTTP and 5 µM dGTP (C). A representative FRET trace under the latter conditions is shown in (B), illustrating the gradual reduction from ~0.4 to~0.2 FRET. (D) Gamma distribution of the approximate transition times from ~0.4 to~0.2 FRET (τunfolding-2; see center schematic, right panel) of F-[7GGT]4 in the presence of telomerase and 0.5 mM dATP, 0.5 mM dTTP and 5 µM dGTP. N represents the number of kinetic steps in the best-fitting equation; fitting parameters (Chi-square, number of molecules and associated p-value) are shown in the table.
Figure 5 with 2 supplements
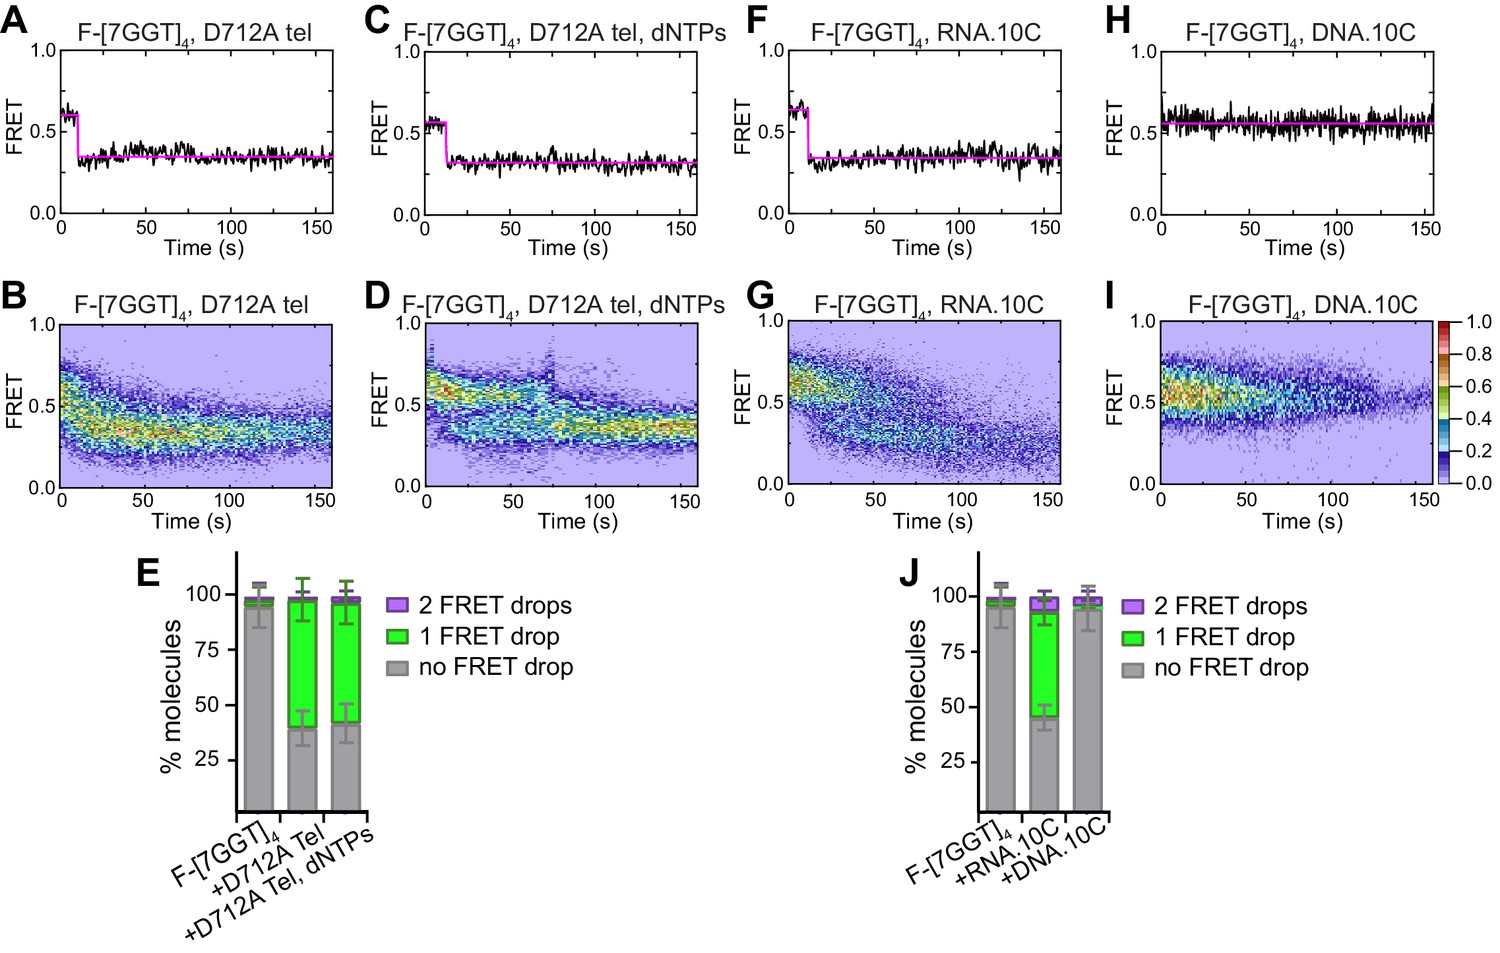
Partial unfolding of G4 does not require telomerase catalytic activity, and can be induced by the RNA template.
(A), (C), (F), (H) Examples of individual F-[7GGT]4 FRET traces under the indicated experimental conditions over 160 s. (B), (D), (G), (I) Heat maps of the distribution of FRET trajectories over 0–150 s using 80, 75, 95 and 129 molecules, respectively, under the indicated experimental conditions. All plots include molecules collected in 4–6 independent experiments. For color key, see panel (I). (E), (J) Plots of the percentage of molecules showing no change in FRET, a single FRET drop, or a two-step FRET drop, in the experiments shown above; error bars represent sample size/√total population.
-
Figure 5—source data 1
Source data for the graph shown in Figure 5E.
- https://cdn.elifesciences.org/articles/56428/elife-56428-fig5-data1-v2.xlsx
-
Figure 5—source data 2
Source data for the graph shown in Figure 5J.
- https://cdn.elifesciences.org/articles/56428/elife-56428-fig5-data2-v2.xlsx
Figure 5—figure supplement 1
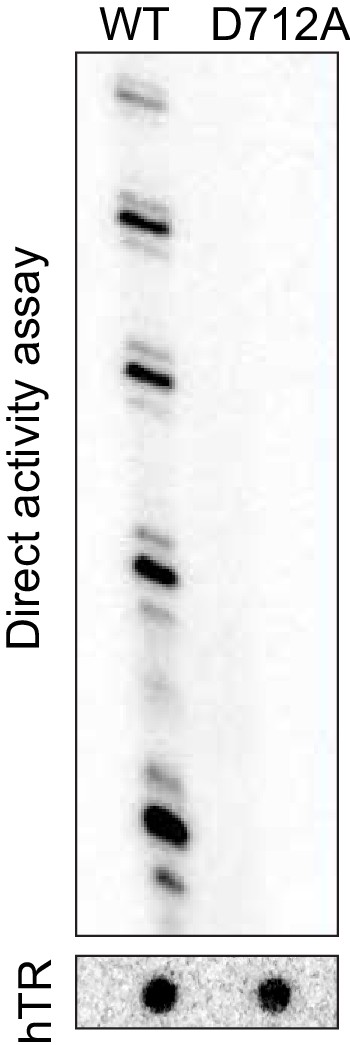
Telomerase activity assay using purified catalytically inactive human telomerase (D712A) compared with wild type (WT) telomerase.
Upper gel shows products of telomerase extension of oligonucleotide Bio-L-18GGG (1 µM; Supplementary file 1); lower panel shows a northern blot of the amount of hTR in each telomerase preparation, to control for equal amounts of enzyme.
Figure 5—figure supplement 2
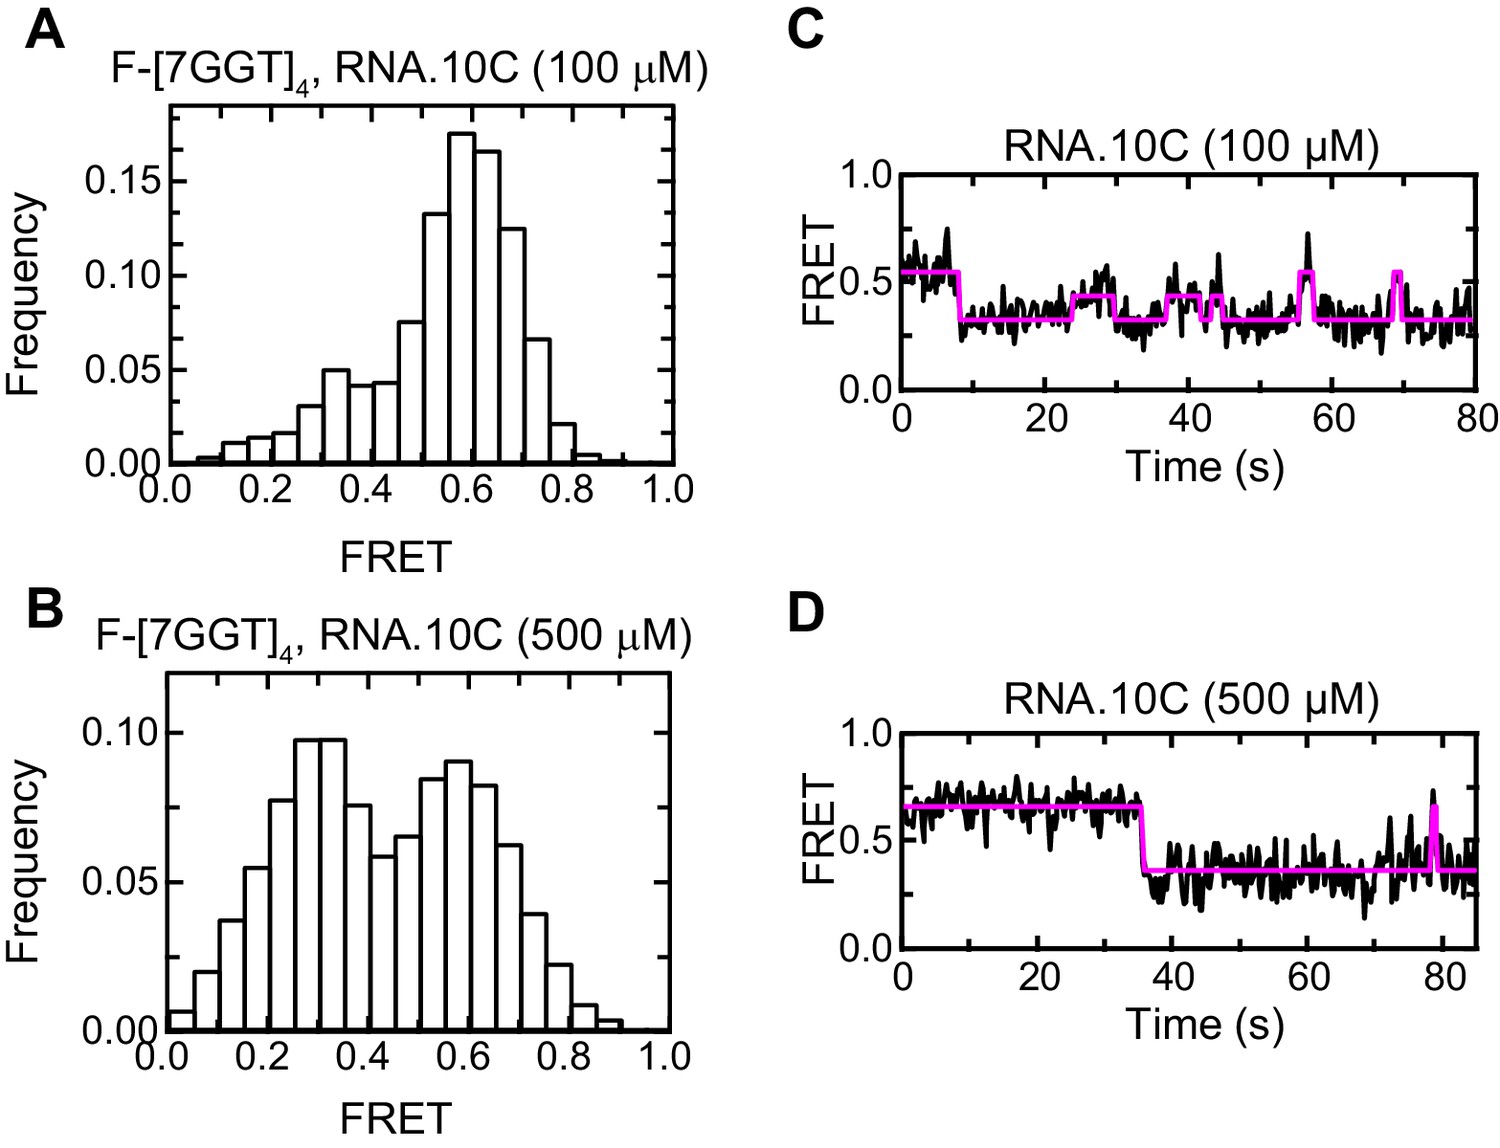
Effect of RNA.10C concentration on F-[7GGT]4 FRET.
Histograms (A, B) and representative traces (C, D) of the FRET values of a population of F-[7GGT]4 molecules, in the presence of the indicated concentrations of oligonucleotide RNA.10C; n = 84 (A) and 129 (B) molecules, collected in 4–6 independent experiments.
Figure 6 with 3 supplements
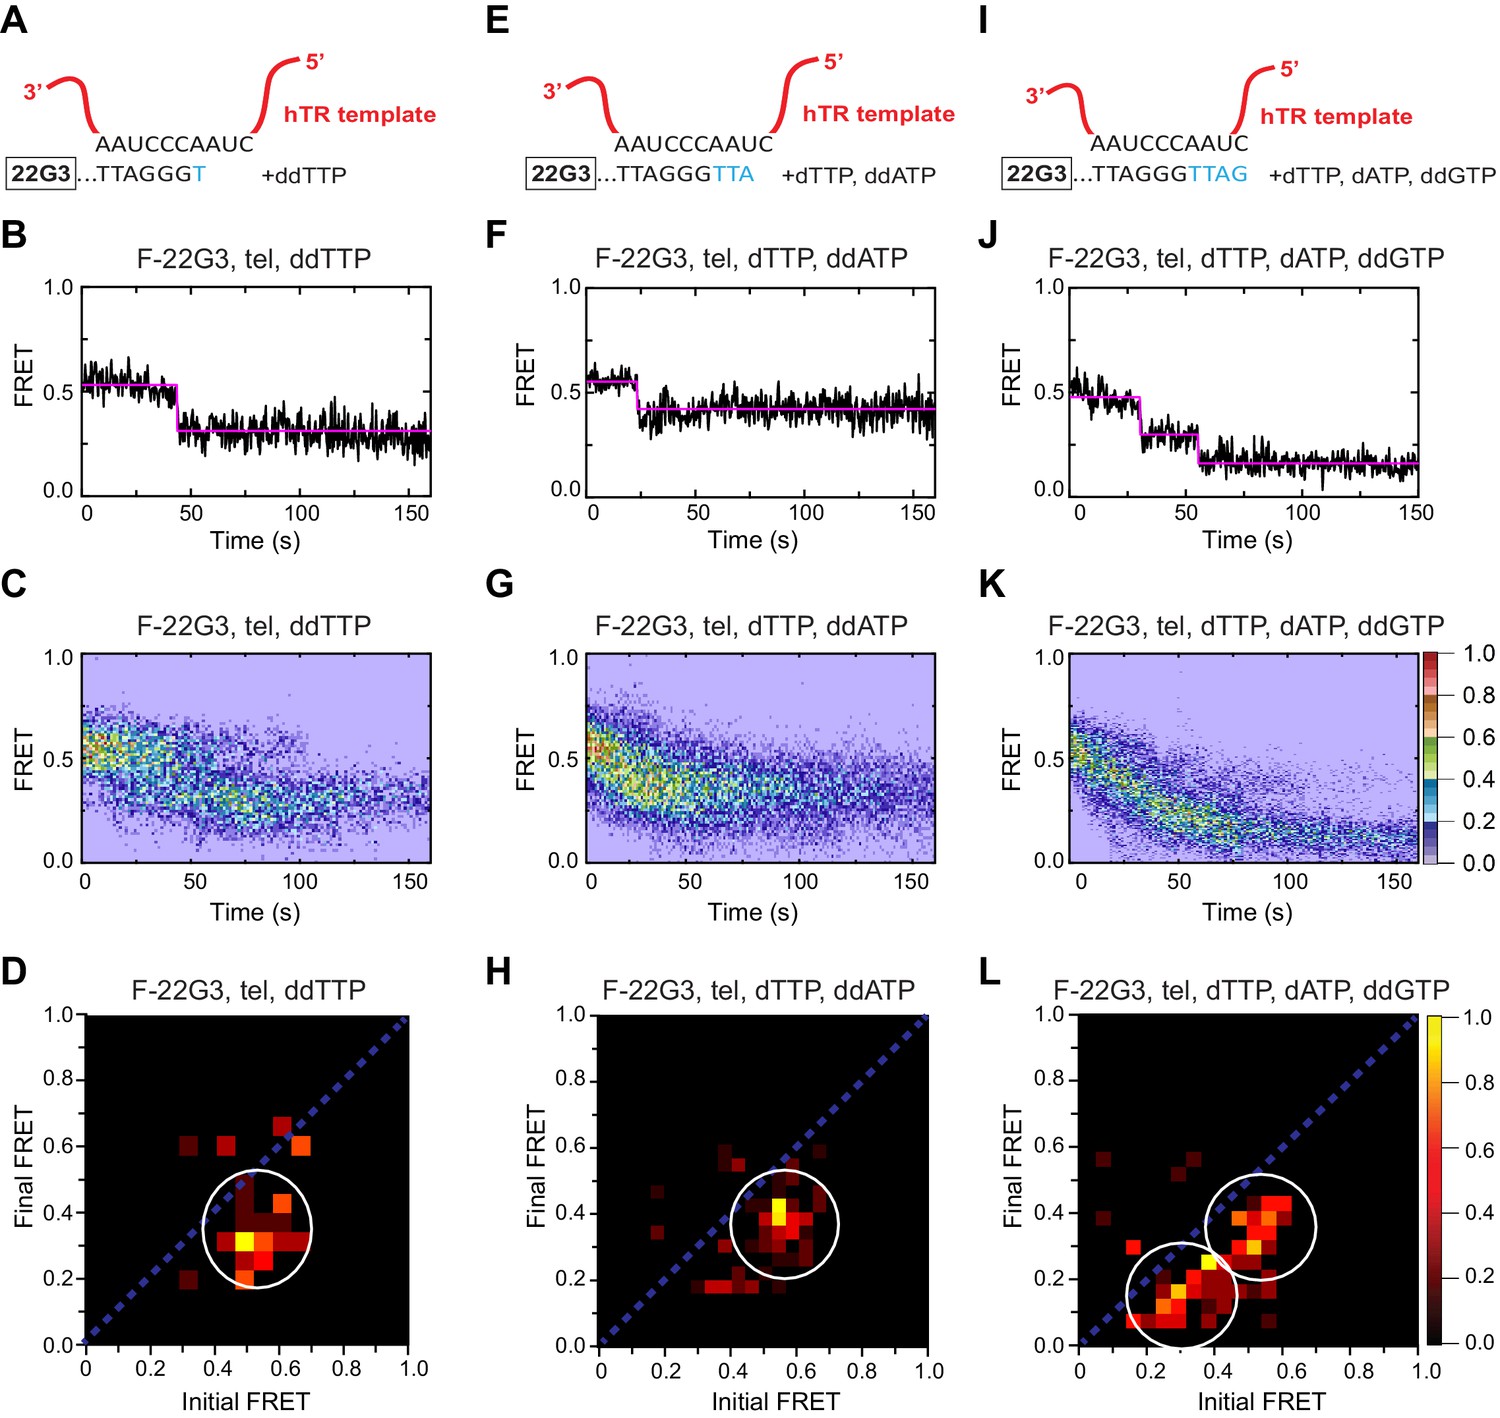
Telomerase translocation leads to complete G4 unfolding.
(A), (E), (I) Schematic diagrams showing alignment of the telomerase template RNA with 22G3 DNA and template-directed incorporation of ddTTP (A), dTTP followed by ddATP (E) or dTTP, dATP and ddGTP (I). (B), (F), (J) Examples of individual F-22G3 FRET trajectories in the presence of telomerase and the indicated combinations of nucleotides. (C), (G), (K) Heat maps of the distribution of FRET intensities over 0–150 s in 80, 90 and 82 molecules, respectively, in the presence of telomerase and the indicated combinations of nucleotides. All plots include molecules collected in 4–6 independent experiments. For color key, see panel (K). (D), (H), (L) TDPs showing the changes between the initial and final FRET values of F-22G3 in the presence of telomerase and the indicated combinations of nucleotides (n = 80, 90 and 82 molecules, respectively). For color key, see panel (L).
Figure 6—figure supplement 1
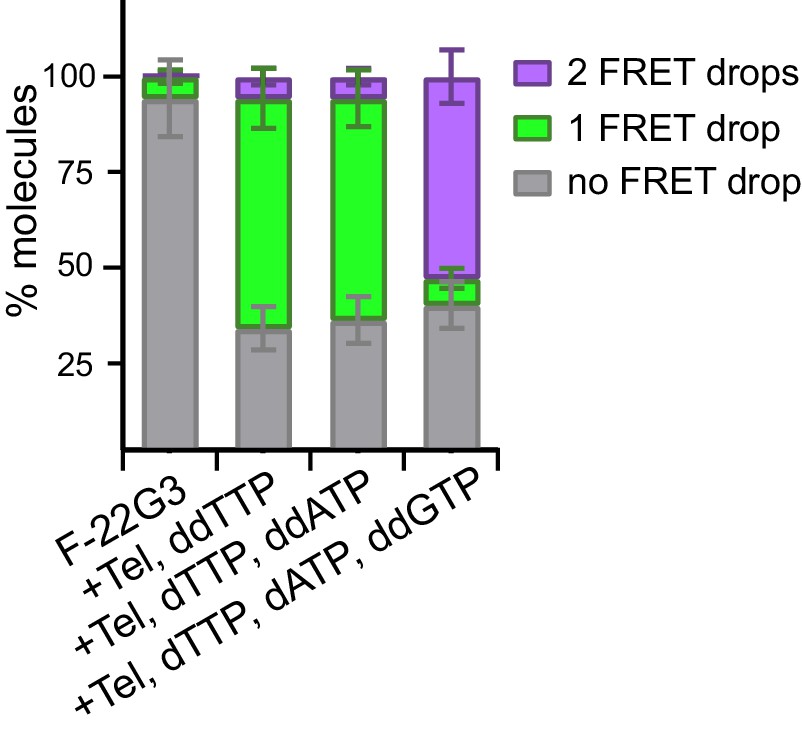
Quantitation of data in Figure 6.
Plot of the percentage of molecules showing no change in FRET, a single FRET drop, or a two-step FRET drop, during telomerase extension of F-22G3 in the presence of the indicated combinations of nucleotides; error bars represent sample size/√total population.
-
Figure 6—figure supplement 1—source data 1
Source data for the graph shown in Figure 6—figure supplement 1.
- https://cdn.elifesciences.org/articles/56428/elife-56428-fig6-figsupp1-data1-v2.xlsx
Figure 6—figure supplement 2
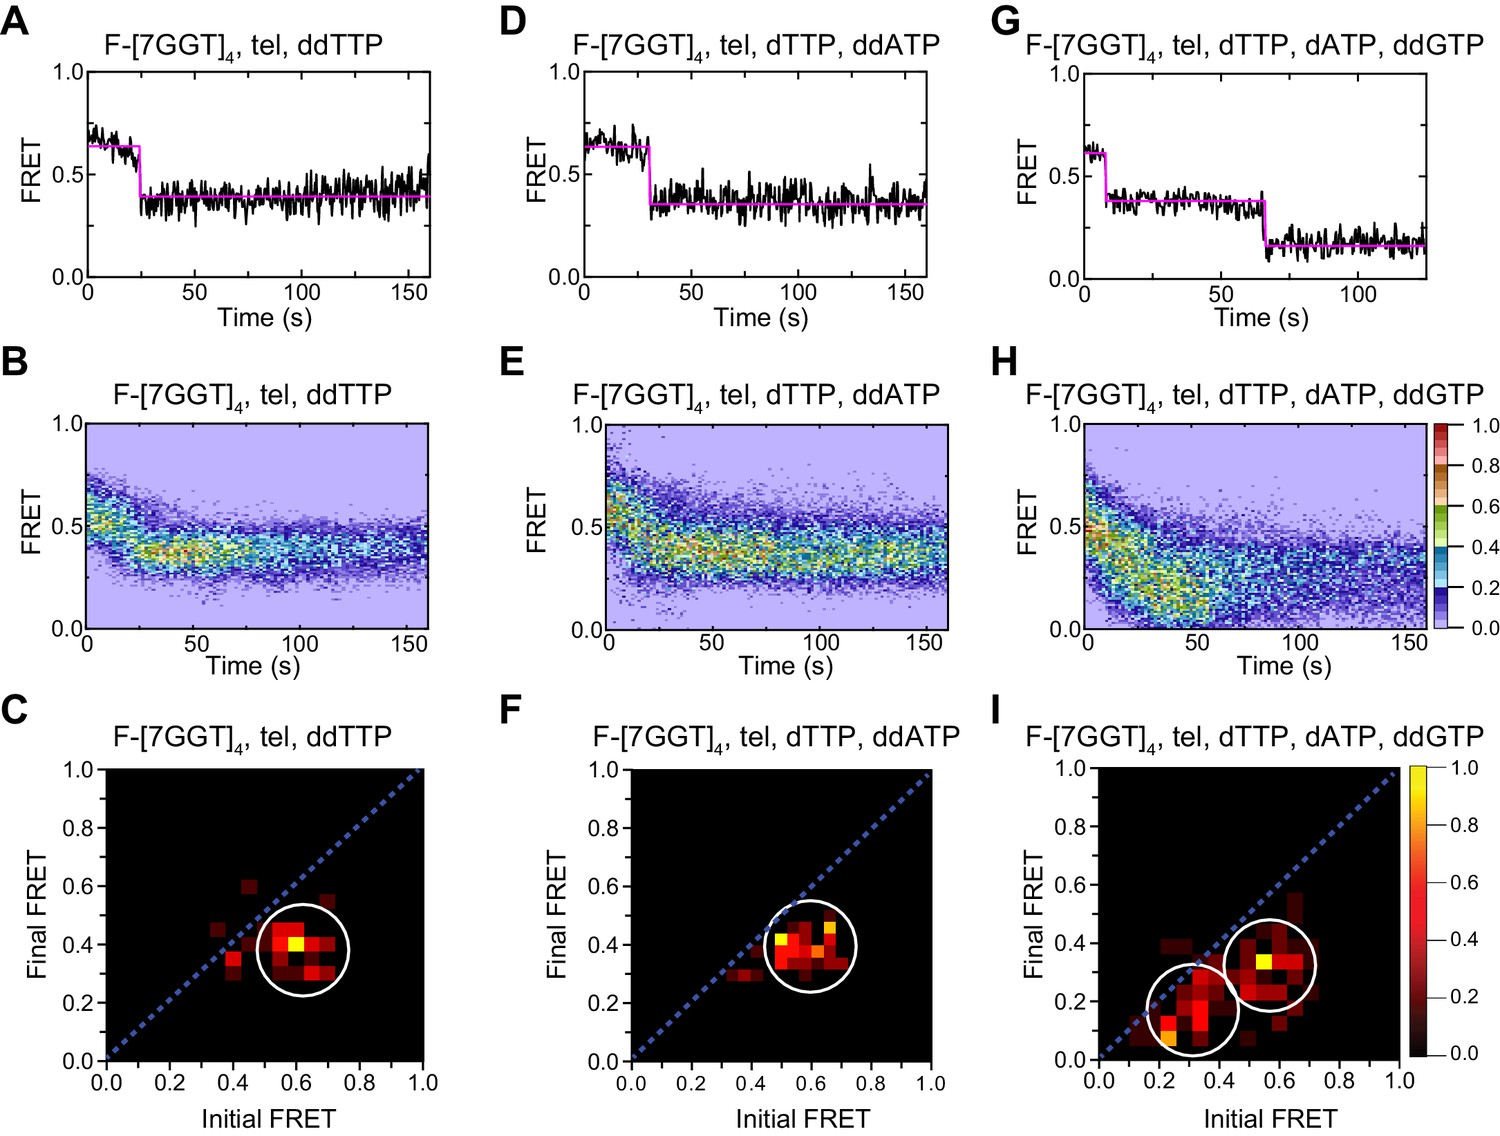
Telomerase unfolds intra- and intermolecular G4 using same mechanism.
(A), (D), (G) Examples of individual F-[7GGT]4 FRET trajectories in the presence of telomerase and the indicated combinations of nucleotides. (B), (E), (H) Heat maps of the distribution of FRET intensities over 0–150 s in 69, 73 and 80 molecules, respectively, in the presence of telomerase and the indicated combinations of nucleotides. All plots include molecules collected in 4–6 independent experiments. For color key, see panel (H). (C), (F), (I) TDPs showing the changes between the initial and final FRET values of F-[7GGT]4 in the presence of telomerase and the indicated combinations of nucleotides (n = 69, 73 and 80 molecules, respectively). For color key, see panel (I).
Figure 6—figure supplement 3
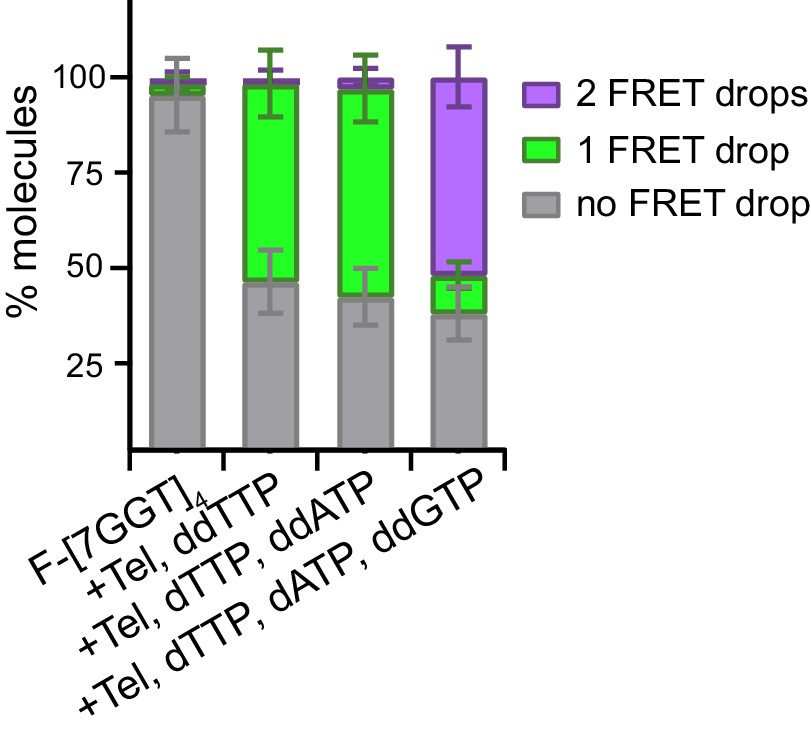
Quantitation of data in Figure 6—figure supplement 2.
Plot of the percentage of molecules showing no change in FRET, a single FRET drop, or a two-step FRET drop, during telomerase extension of F-[7GGT]4 in the presence of the indicated combinations of nucleotides; error bars represent sample size/√total population.
-
Figure 6—figure supplement 3—source data 1
Source data for the graph shown in Figure 6—figure supplement 3.
- https://cdn.elifesciences.org/articles/56428/elife-56428-fig6-figsupp3-data1-v2.xlsx
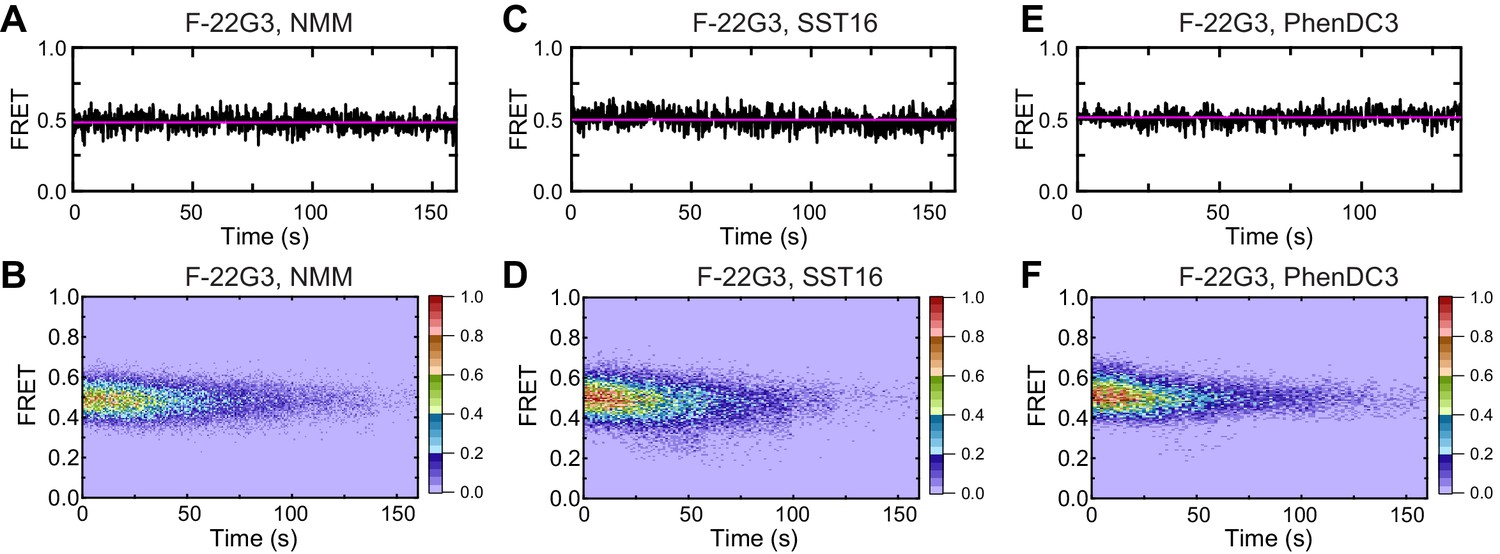
Figure 7 with 5 supplements
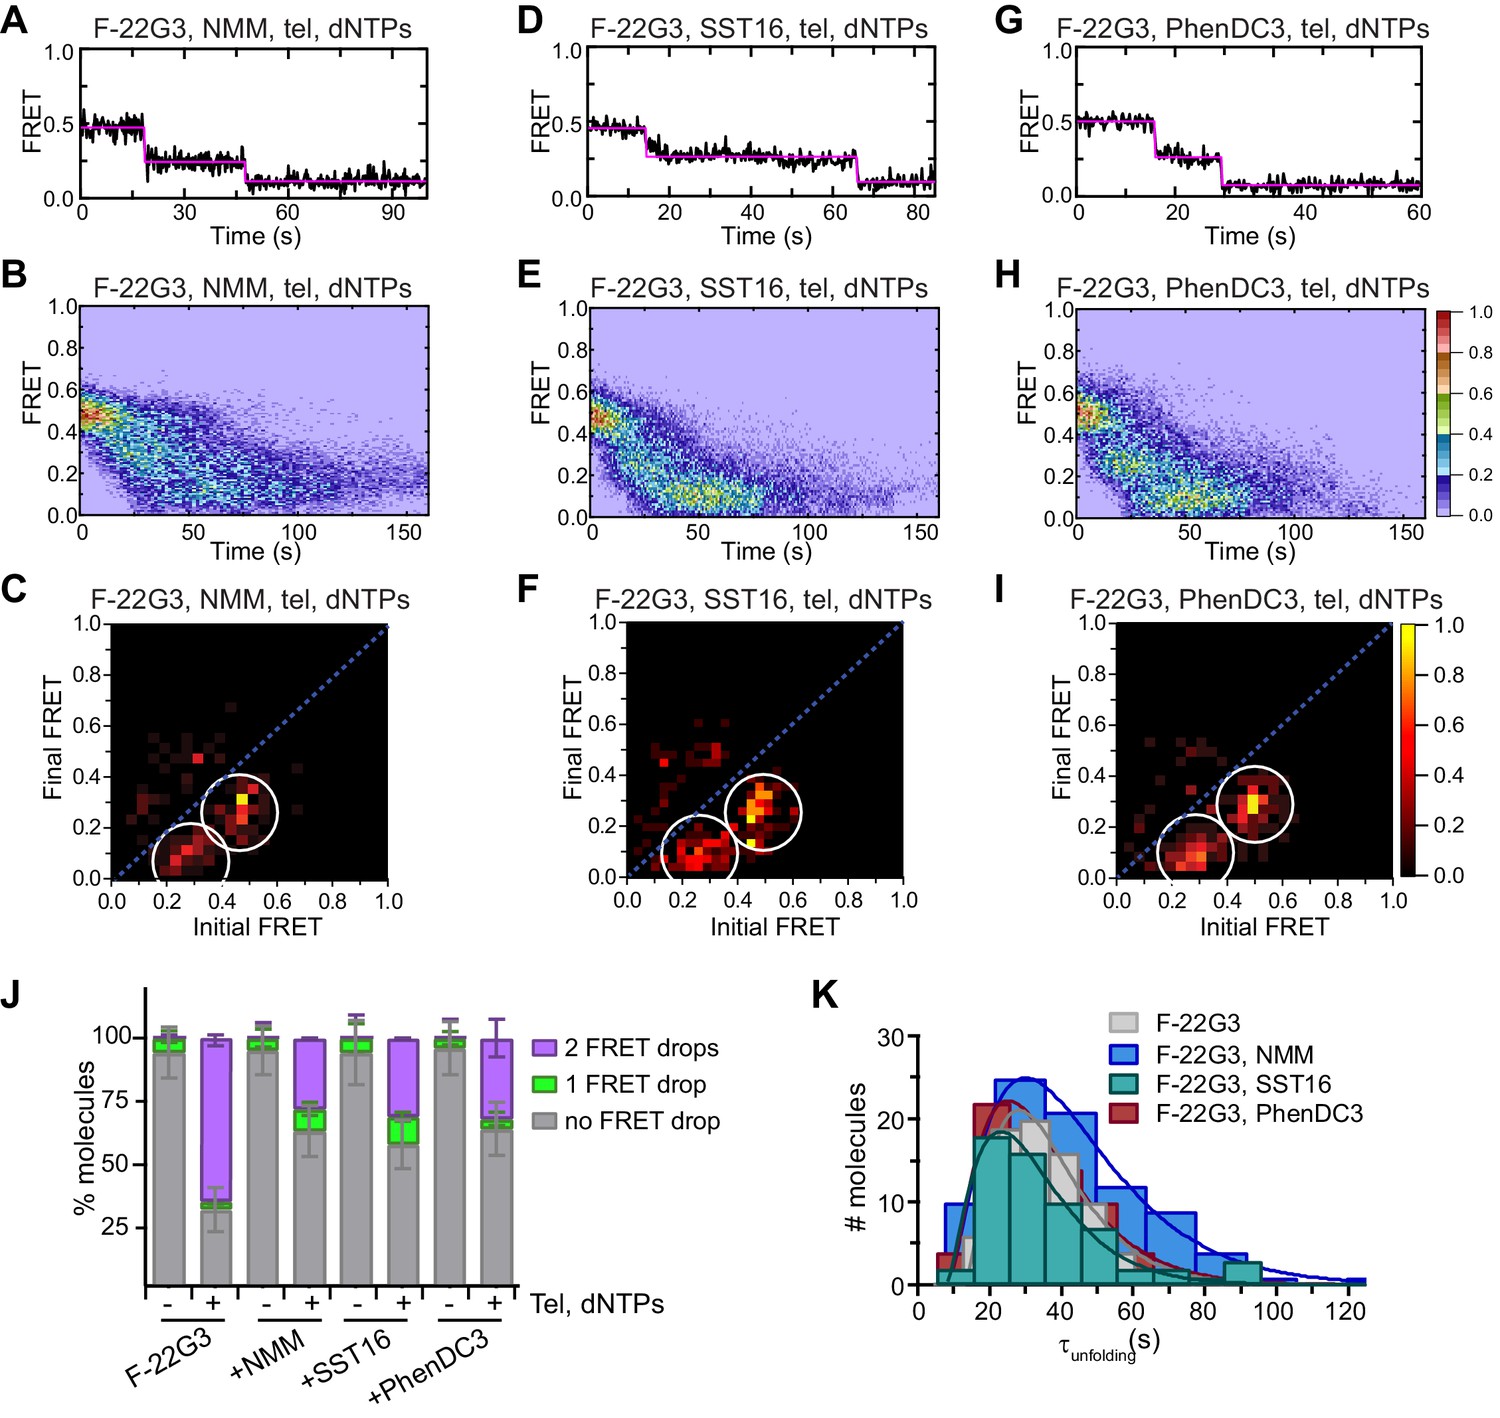
Partial inhibition of unfolding of F-22G3 by ligands NMM, SST16 and PhenDC3.
(A – I) Representative FRET trajectories, heat maps and transition density plots of F-22G3 in the presence of NMM (A – C; 800 μM in folding reaction), SST16 (D – F; 5 μM) or PhenDC3 (G – I; 1 μM), in the presence of telomerase and dNTPs; n = 84 (B,C), 60 (E,F), and 77 (H,I) molecules, collected in 2–4 independent experiments. (J) Plot of the percentage of F-22G3 molecules showing no change in FRET, a single FRET drop, or a two-step FRET drop, when incubated with telomerase, dNTPs and the indicated ligands at the concentrations shown in (A – I); error bars represent sample size/√total population. (K) The unfolding rate of F-22G3 in the presence of the above concentrations of NMM, SST16, PhenDC3 or no ligand, calculated by fitting the dwell time distributions of the intermediate FRET state to a gamma distribution. Rates and curve fitting parameters are in Figure 7—figure supplement 4.
-
Figure 7—source data 1
Source data for the graph shown in Figure 7J.
- https://cdn.elifesciences.org/articles/56428/elife-56428-fig7-data1-v2.xlsx
Figure 7—figure supplement 1
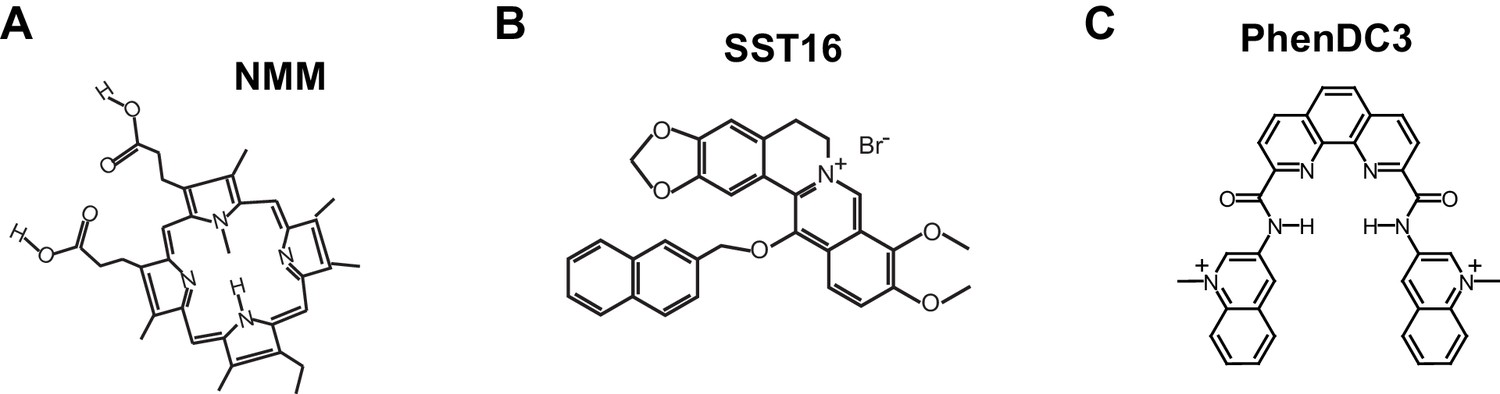
Structures of G4-stabilizing ligands used in this study.
Figure 7—figure supplement 2
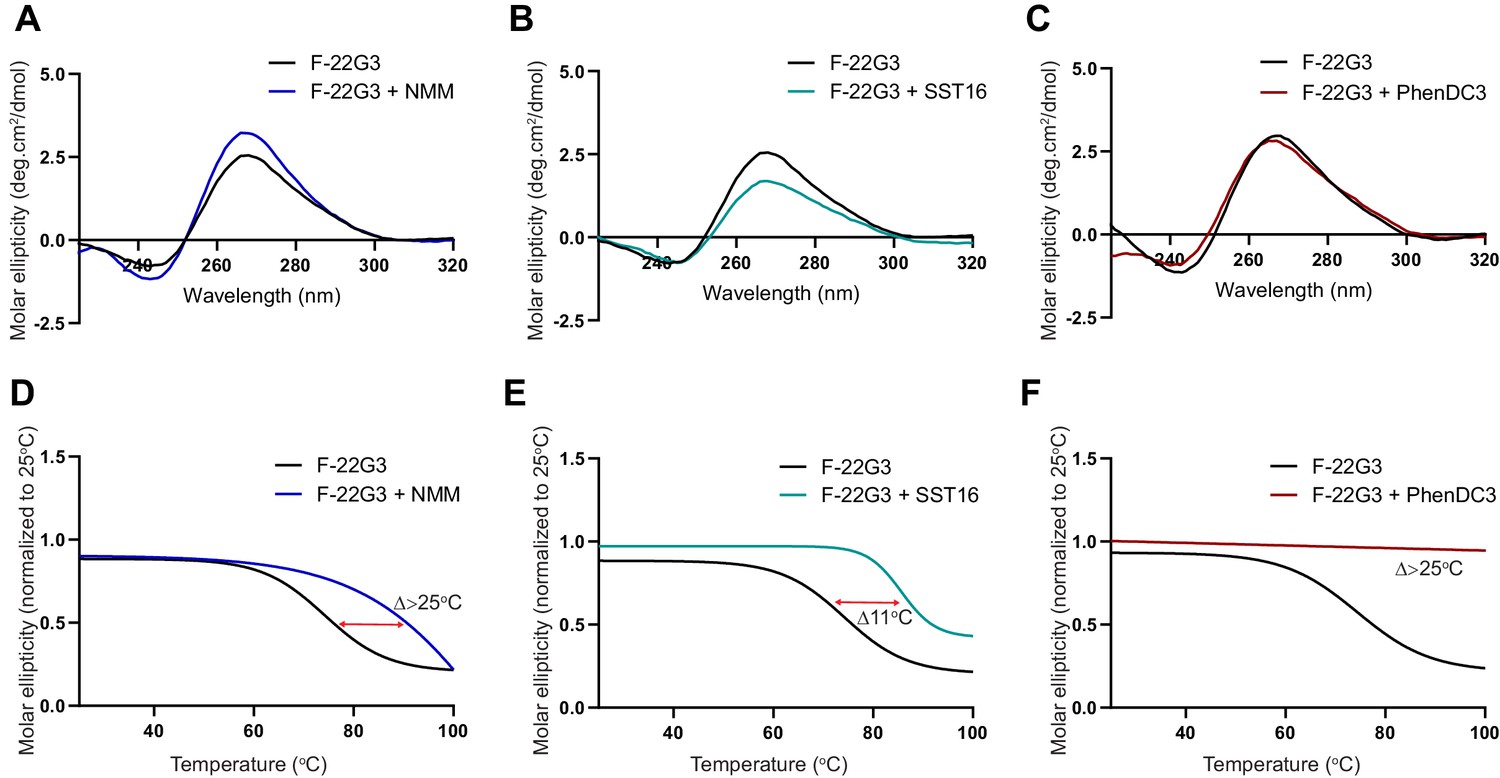
Demonstration of ligand-mediated stabilization of F-22G3.
(A – C) CD spectra and (D – F) melting curves measured by CD at 260 nm of 250 nM F-22G3 in the presence or absence of 40 μM NMM, 5 μM SST16 or 1 μM PhenDC3. NMM was incubated with F-22G3 during G4 folding at 20-fold higher concentrations, and the G4-ligand complex diluted for CD measurement.
Figure 7—figure supplement 3
Effects of ligands on F-22G3 FRET.
Representative FRET trajectories and heat maps of F-22G3 in the presence of NMM (A, B); 800 μM in folding reaction), SST16 (C, D); 5 μM) or PhenDC3 (E, F); 1 μM); n = 110 (B), n = 96 (D), n = 103 (F), collected in 2–3 independent experiments.
Figure 7—figure supplement 4
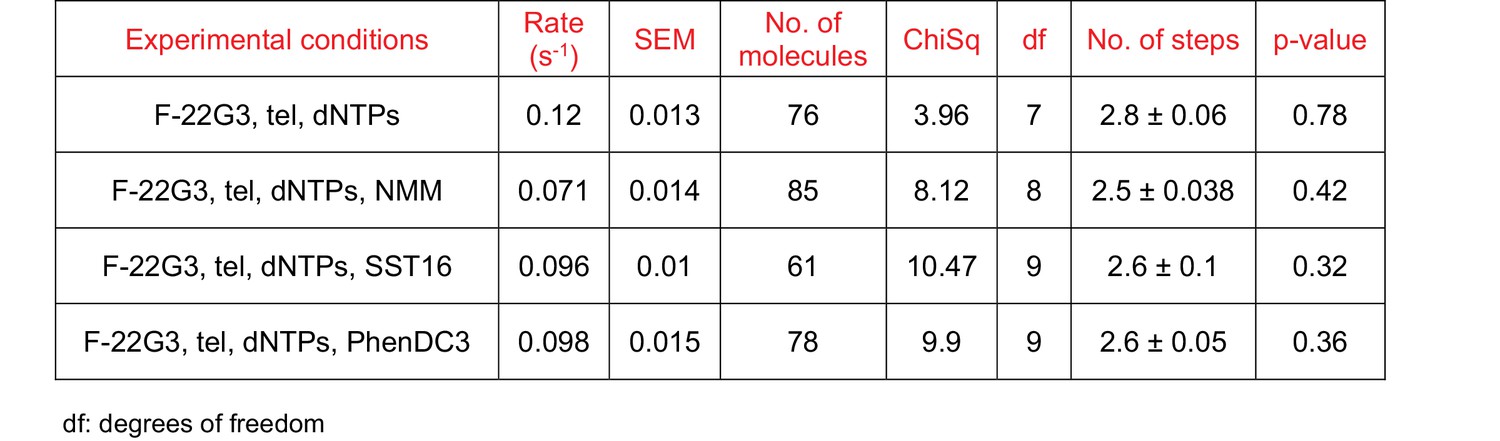
Curve fitting parameters of the curves in Figure 7K.
Figure 7—figure supplement 5
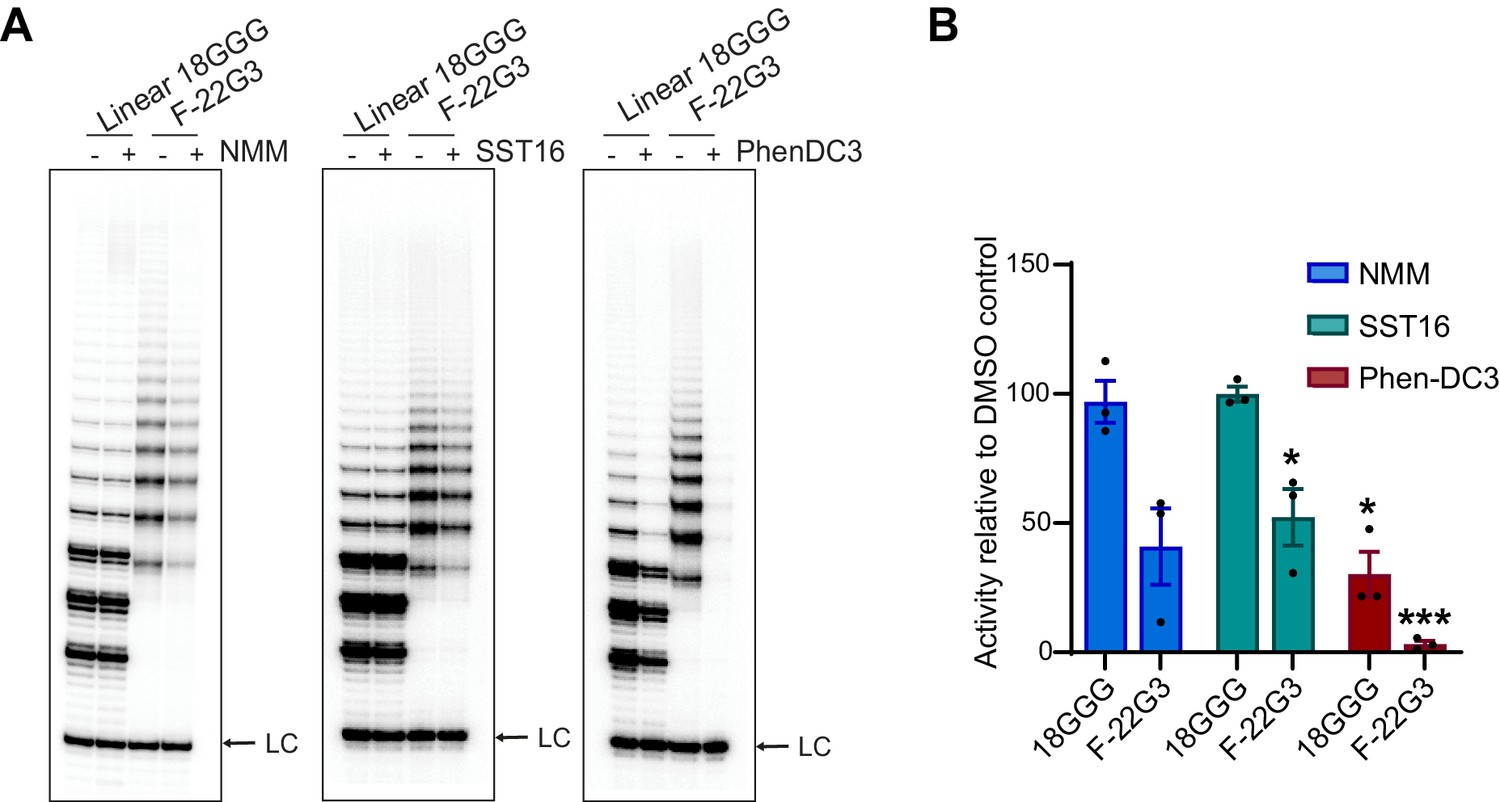
Telomerase extension assays of F-22G3 in the presence of G4 ligands.
(A) Direct extension assays using 250 nM of F-22G3 or linear Bio-L-18GGG control, in the presence or absence of NMM (800 μM in folding reaction), SST16 (5 μM) or PhenDC3 (1 μM). For the reactions with NMM, linear DNA strands (10 μM) were incubated with 800 μM NMM prior to G4 folding, and the G4-ligand complex diluted 20-fold for the activity assay. LC: 5´-32P-labeled synthetic 30 nt DNA used as a recovery/loading control. (B) Quantitation of activity in (A), normalized to the solvent (DMSO) control for each reaction. Graph shows mean ± SEM, n = 3 independent experiments. *p=0.0492 (SST16, F-22G3) or 0.0154 (PhenDC3, 18GGG), ***p=0.0002 (one-way t-tests on difference with 100%).
Figure 8 with 2 supplements
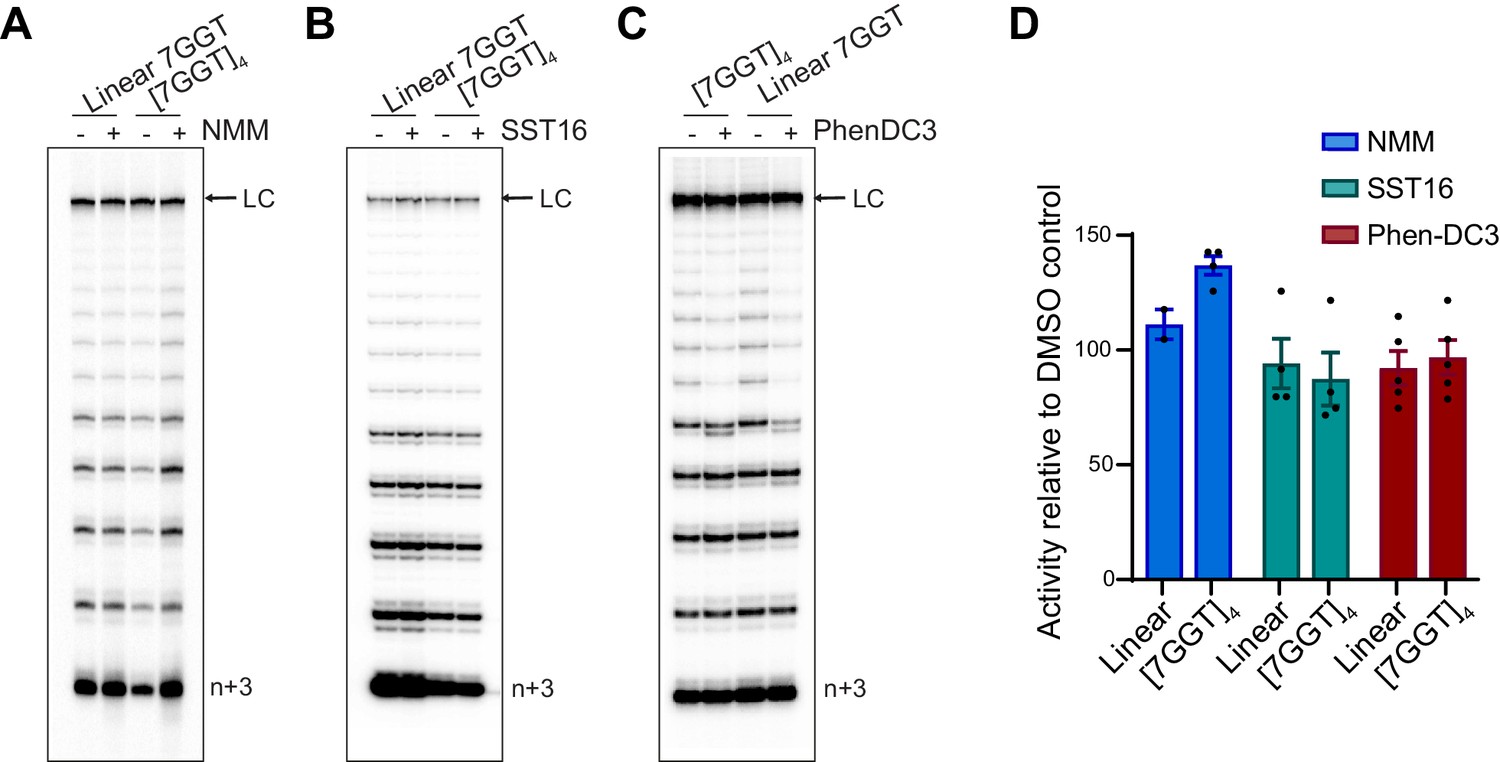
Telomerase extends ligand-stabilized tetrameric parallel G4.
(A), (B), (C) Telomerase extension assays using 1 µM of [7GGT]4 or a linear 7-mer control (or 250 nM in the reactions with PhenDC3), in the presence or absence of 40 µM NMM (A), 100 μM SST16 (B) or 1 μM PhenDC3 (C). For the reactions with NMM, linear 7GGT (1 mM) was incubated with 10 mM NMM prior to G4 folding, and the G4-ligand complex diluted 250-fold for the activity assay. n+3 indicates the position of the product with the first three nucleotides incorporated. LC: 5´-32P-labeled synthetic 100 nt DNA used as a recovery/loading control. (D) Quantitation of activity in (A–C), normalized to the solvent (DMSO) control for each reaction. Graph shows mean ± SEM, n = 2–5 independent experiments.
Figure 8—figure supplement 1
Demonstration of ligand-mediated stabilization of F-22G3.
(A – C) CD spectra and (D – F) melting curves measured by CD at 260 nm of 1 mM [7GGT]4 in the presence or absence of 40 μM NMM, 100 μM SST16 or 1 μM PhenDC3.
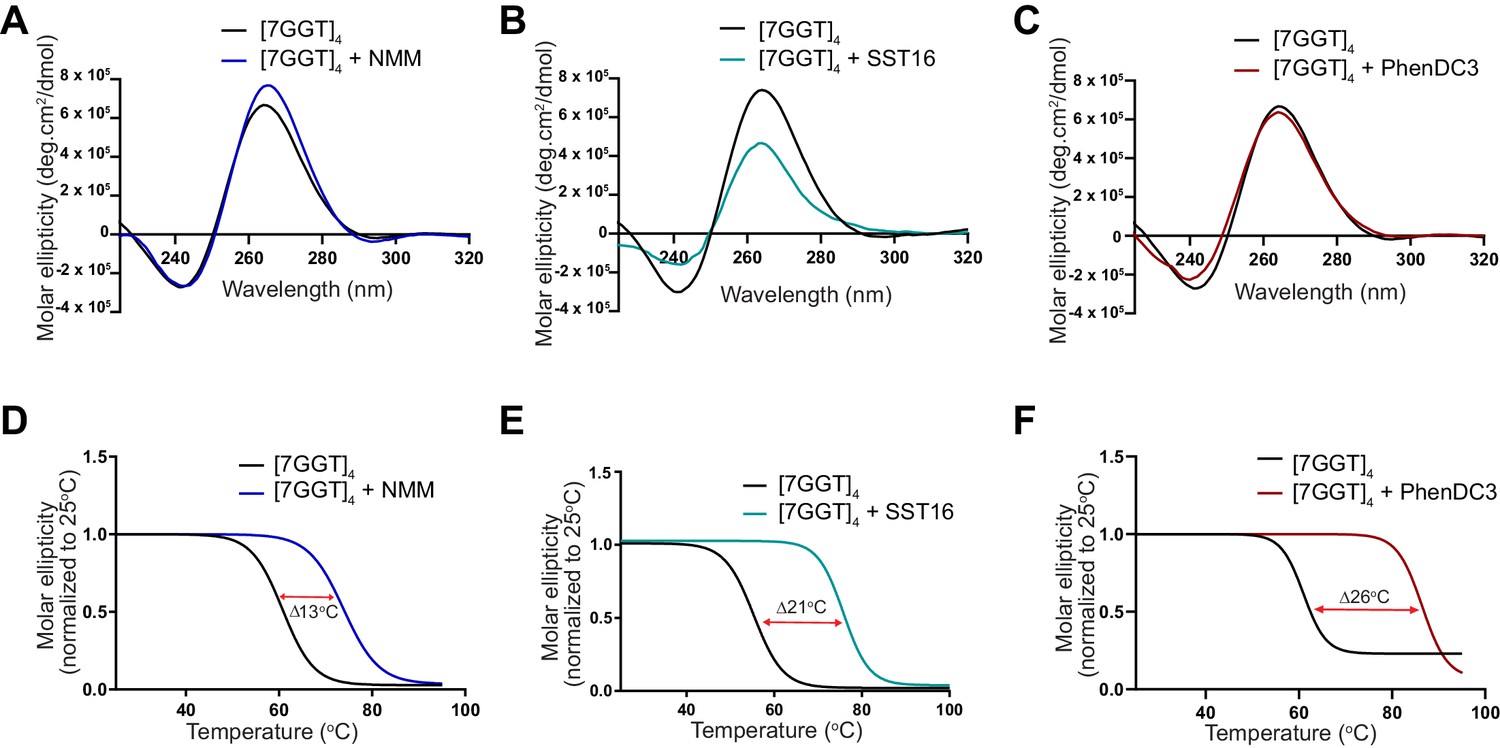
Figure 8—figure supplement 2
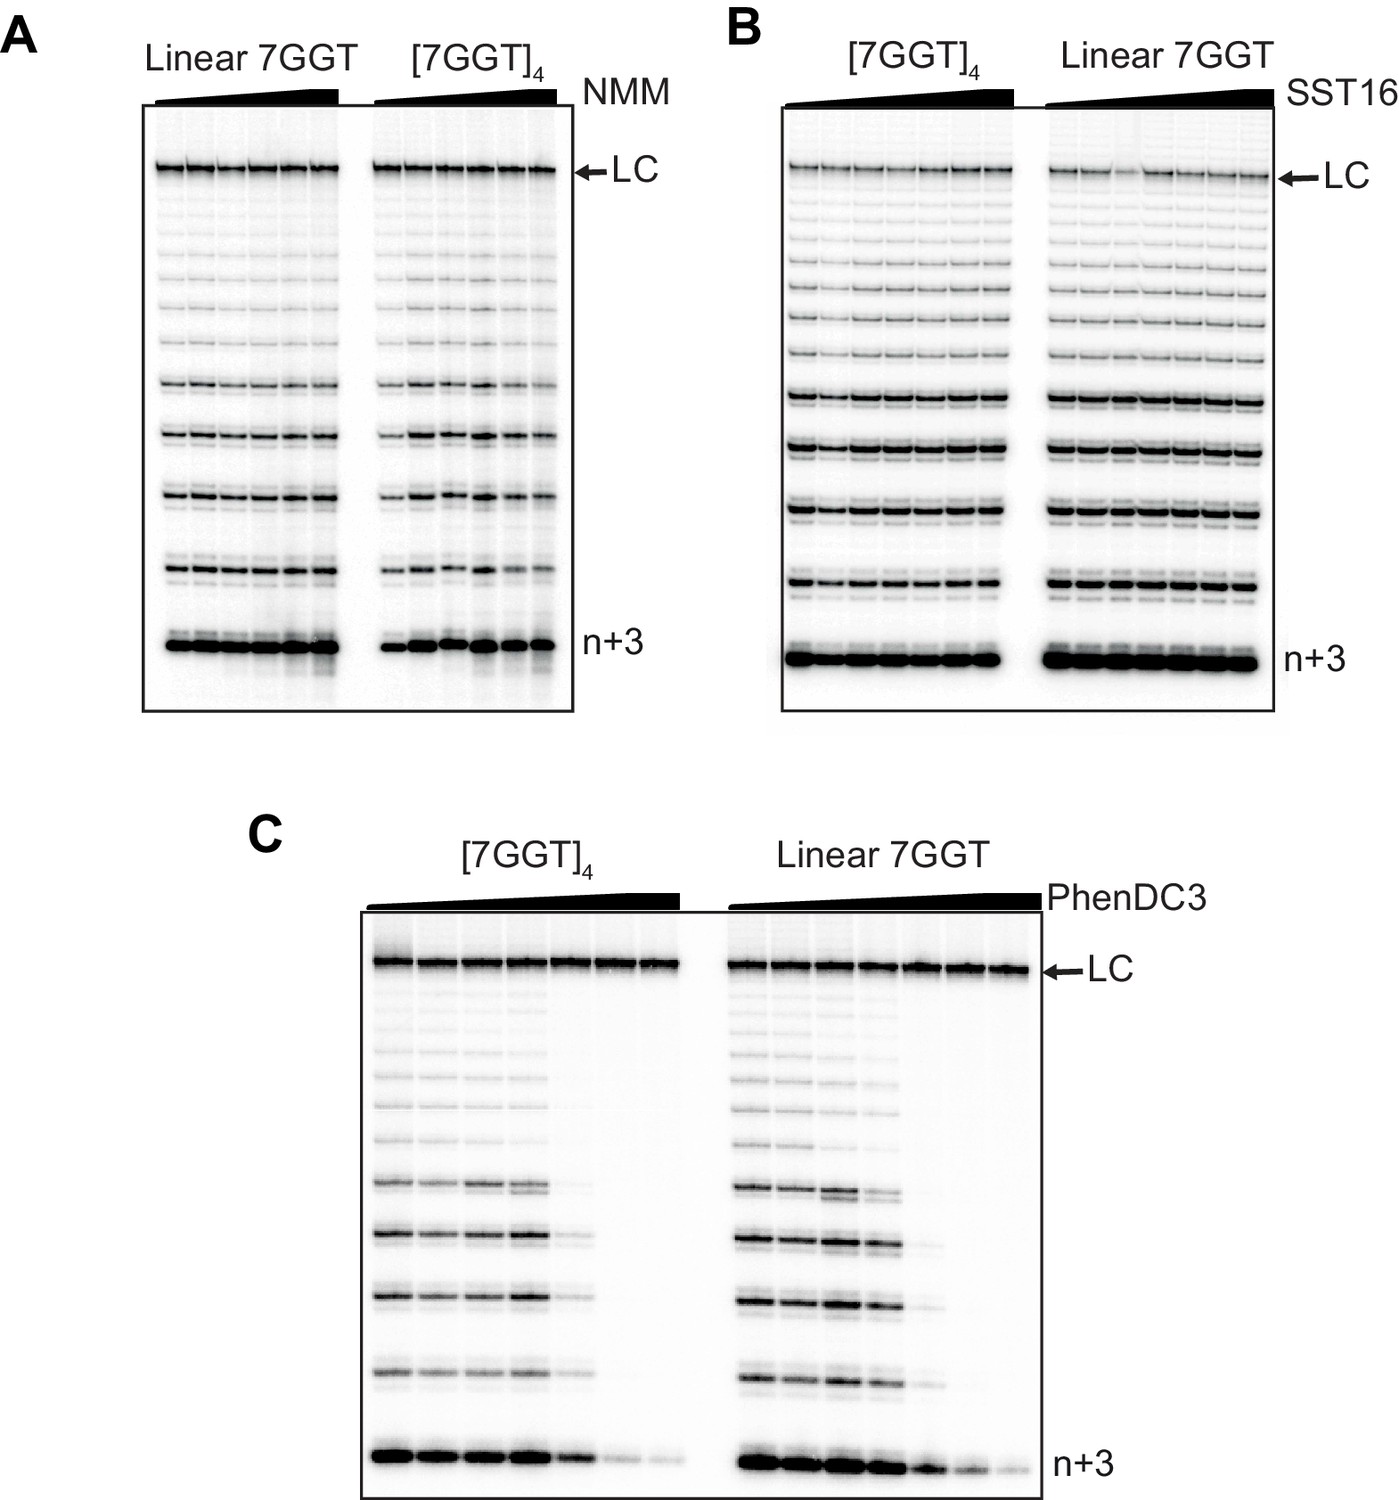
Telomerase extension of [7GGT]4 in the presence of titrations of G4 ligands.
Telomerase extension assays in the presence of either (A) NMM (0, 4 μM, 20 μM, 40 μM, 80 μM, 160 μM), (B) SST16 (0, 10 μM, 25 μM, 50 μM, 75 μM, 100 μM) or (C) PhenDC3 (0, 0, 0.5 μM, 1 μM, 2.5 μM, 5 μM, 10 μM). DNA concentrations were 1 μM (A, B) or 250 nM (C). NMM was incubated with 7GGT during G4 folding at 250-fold higher concentrations, and the G4-ligand complex diluted for the assay. LC is a 100 nt loading control and n+3 indicates the product with the first three nucleotides incorporated.
Figure 9 with 3 supplements
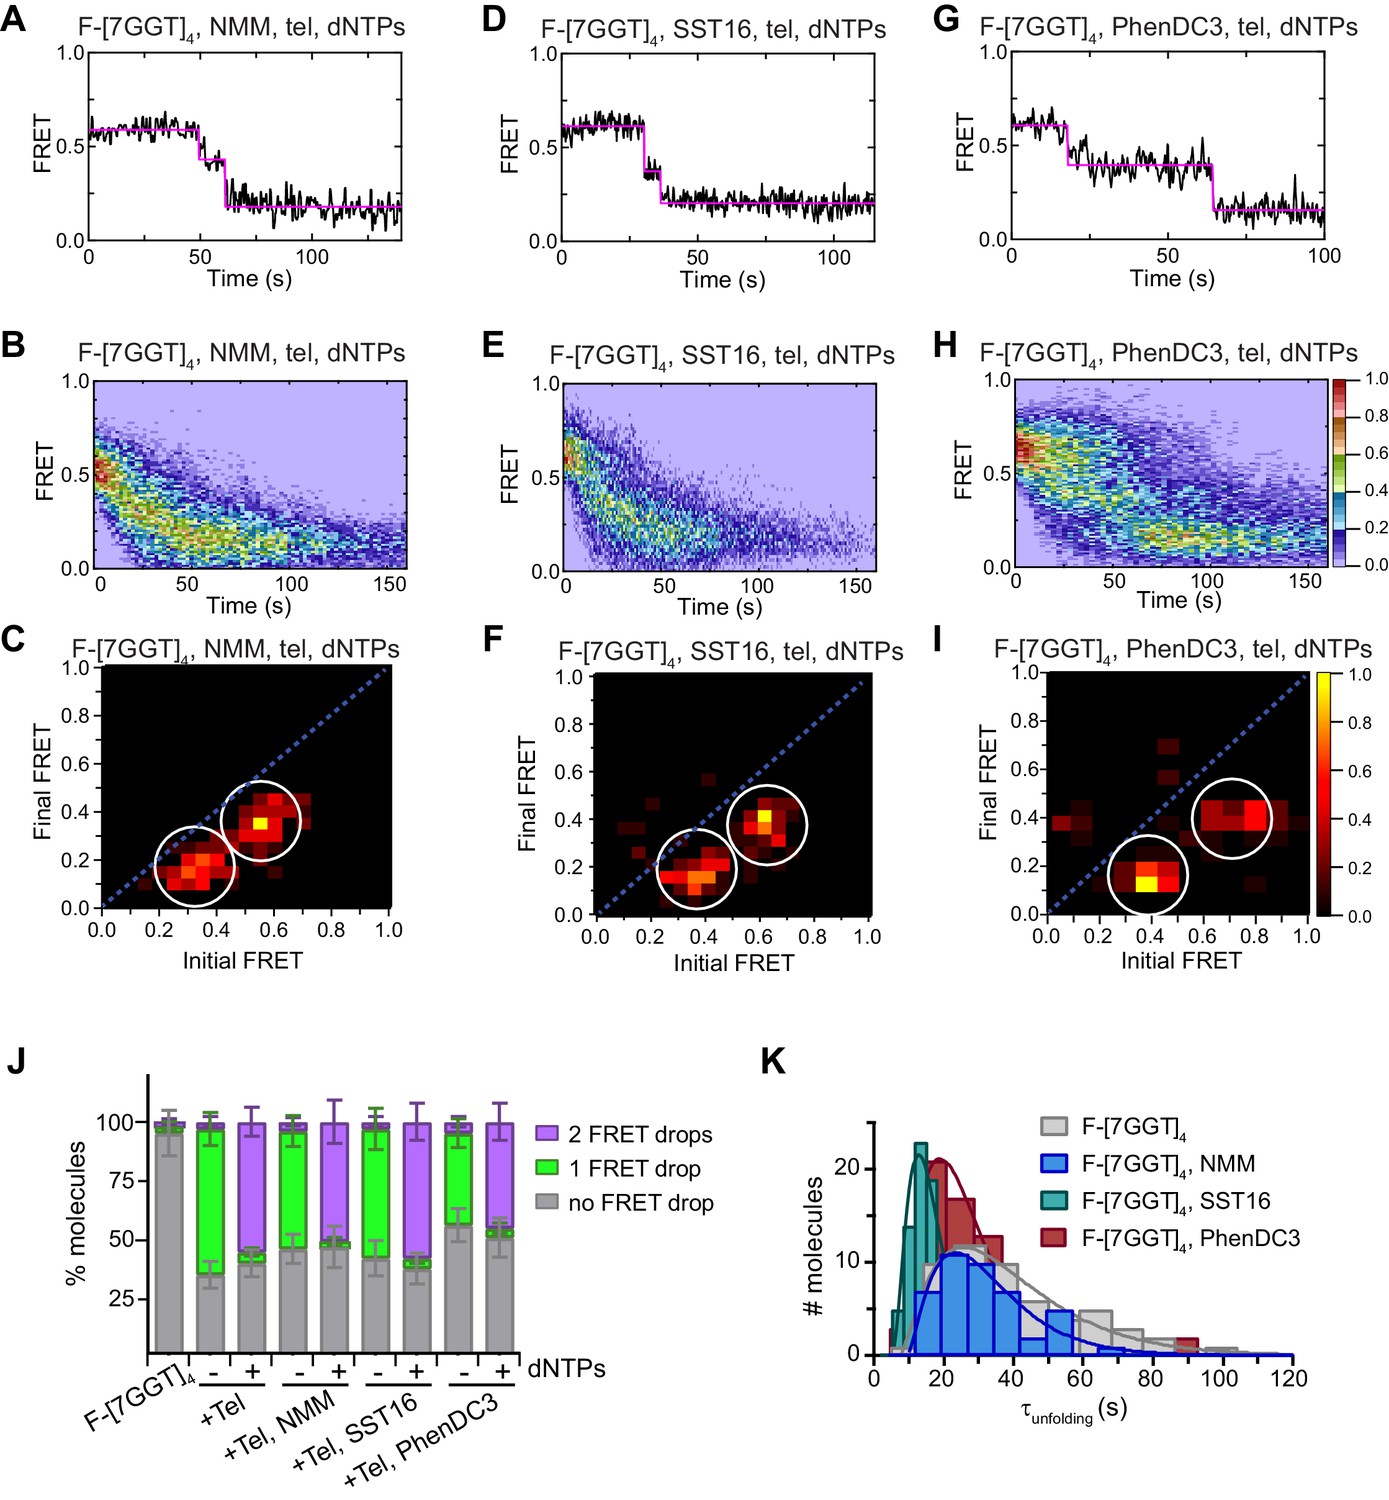
Telomerase unfolds ligand-stabilized tetrameric parallel G4.
(A), (D), (G) Representative single-molecule FRET trajectories of NMM-stabilized (A; 10 mM in folding reaction), SST16-stabilized (D; 100 µM) or PhenDC3-stabilized (G; 1 µM) F-[7GGT]4 in the presence of telomerase and dNTPs. (B), (E), (H) Heat maps of the distribution of FRET intensities over 0–150 s in the presence of telomerase, dNTPs and either NMM (n = 63) (B), SST16 (n = 90) (E) or PhenDC3 (n = 76) (H). All plots include molecules collected in 4–6 independent experiments. For color key, see panel (H). (C), (F), (I) TDPs showing the changes in FRET value of 70, 80 and 58 molecules from the experiments in (A) to (I). (J) Plot of the percentage of F-[7GGT]4 molecules showing no change in FRET, a single FRET drop, or a two-step FRET drop, when incubated with telomerase and the indicated ligands at the concentrations shown in (A) – (I); error bars represent sample size/√total population. (K) The unfolding rate of F-[7GGT]4 in the presence of the above concentrations of NMM, SST16, PhenDC3 or no ligand, calculated by fitting the dwell time distributions of the intermediate FRET state to a gamma distribution. Rates and curve fitting parameters are in Figure 9—figure supplement 3.
-
Figure 9—source data 1
Source data for the graph shown in Figure 9J.
- https://cdn.elifesciences.org/articles/56428/elife-56428-fig9-data1-v2.xlsx
Figure 9—figure supplement 1
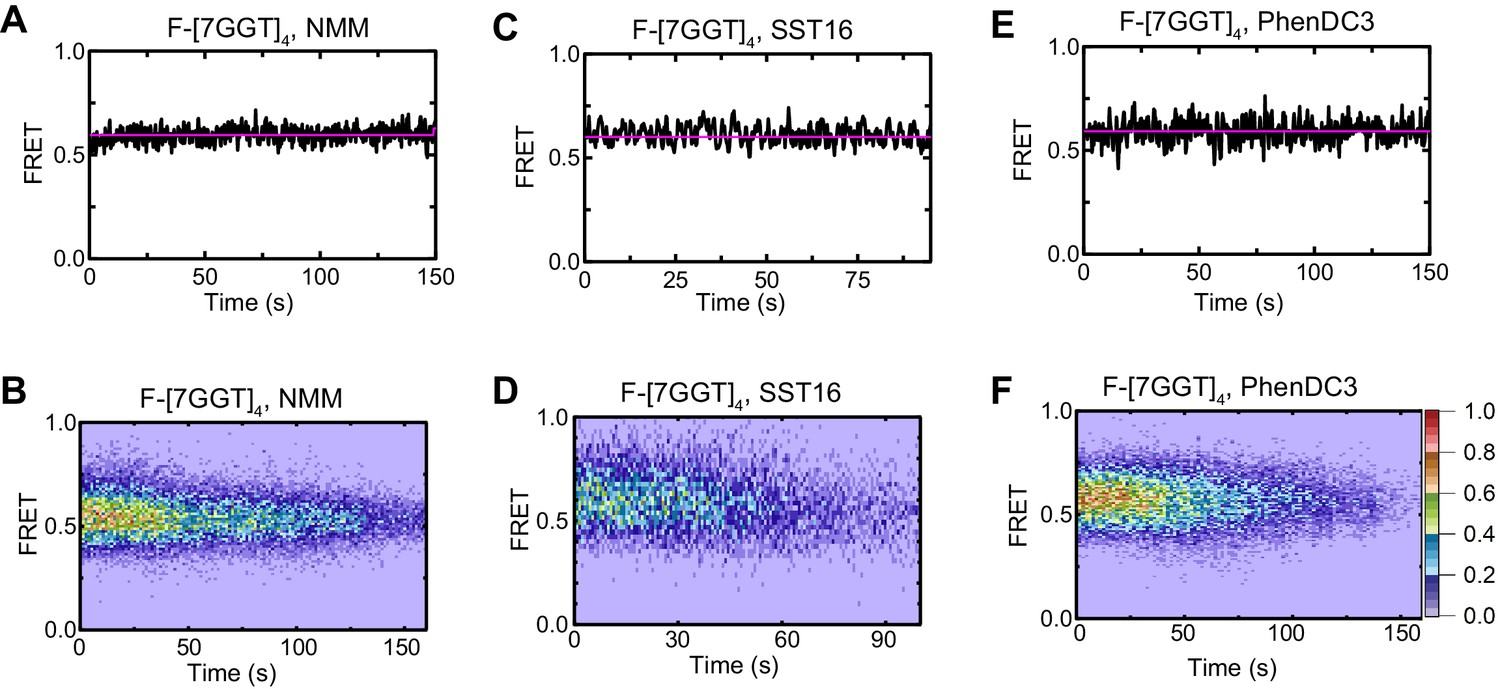
Effects of ligands on F-[7GGT]4 FRET.
Representative FRET trajectories (A, C, E) and heat maps (B, D, F) of F-[7GGT]4 in the presence of NMM (10 mM in folding reaction), SST16 (100 µM) or PhenDC3 (1 µM), without telomerase; n = 120 (B), 73 (D), 111 (F), molecules, collected in 4–6 independent experiments. For color key, see panel (F).
Figure 9—figure supplement 2
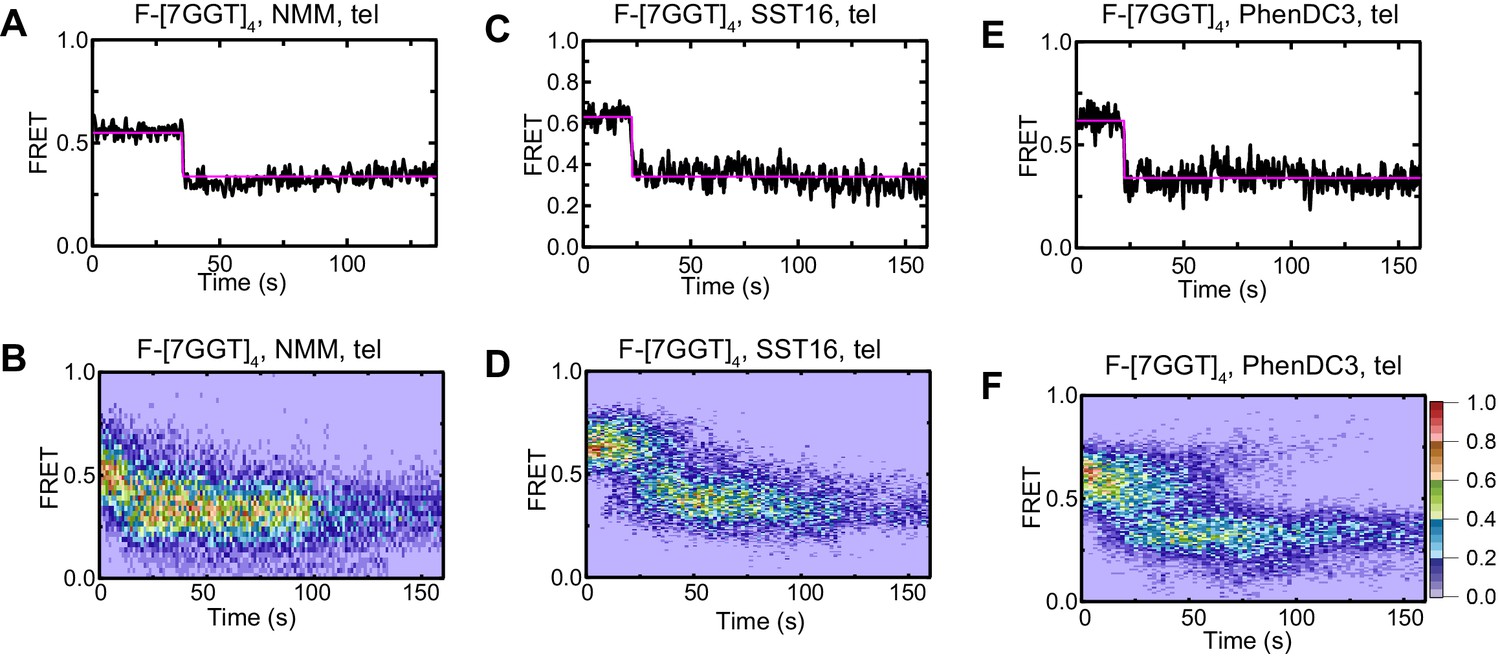
Effect of ligands on FRET of F-[7GGT]4 in the presence of telomerase.
Representative FRET trajectories (A, C, E) and heat maps (B, D, F) of F-[7GGT]4 in the presence of NMM (10 mM in folding reaction), SST16 (100 µM) or PhenDC3 (1 µM), with telomerase; n = 80 (B), 60 (D), 74 (F) molecules, collected in 4–6 independent experiments. For color key, see panel (F).
Figure 9—figure supplement 3
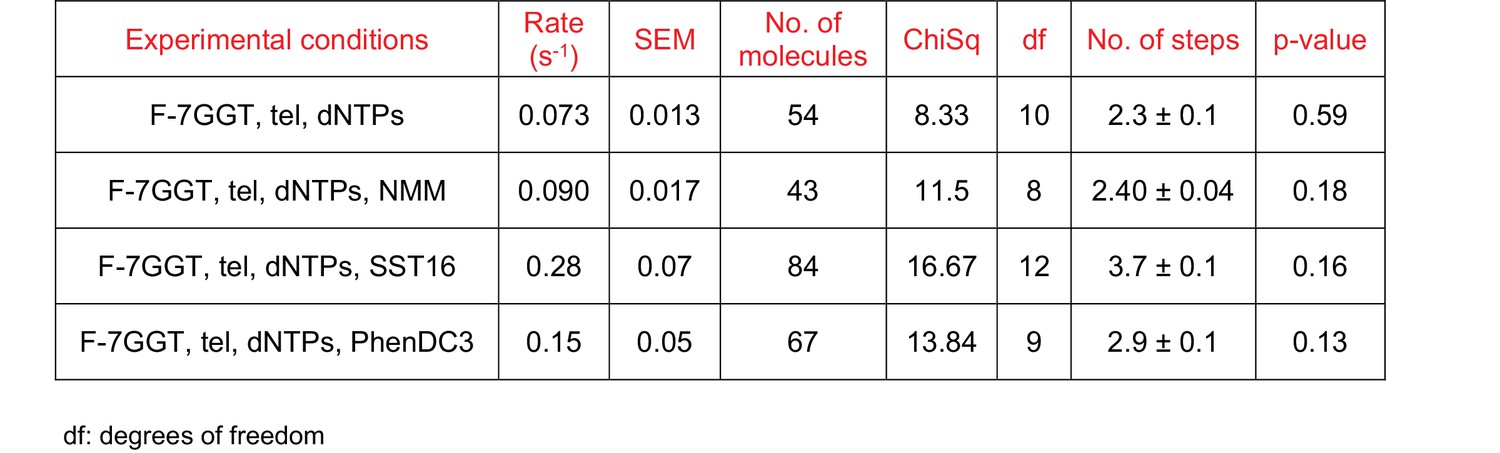
Curve fitting parameters of the curves in Figure 9K.
Figure 10
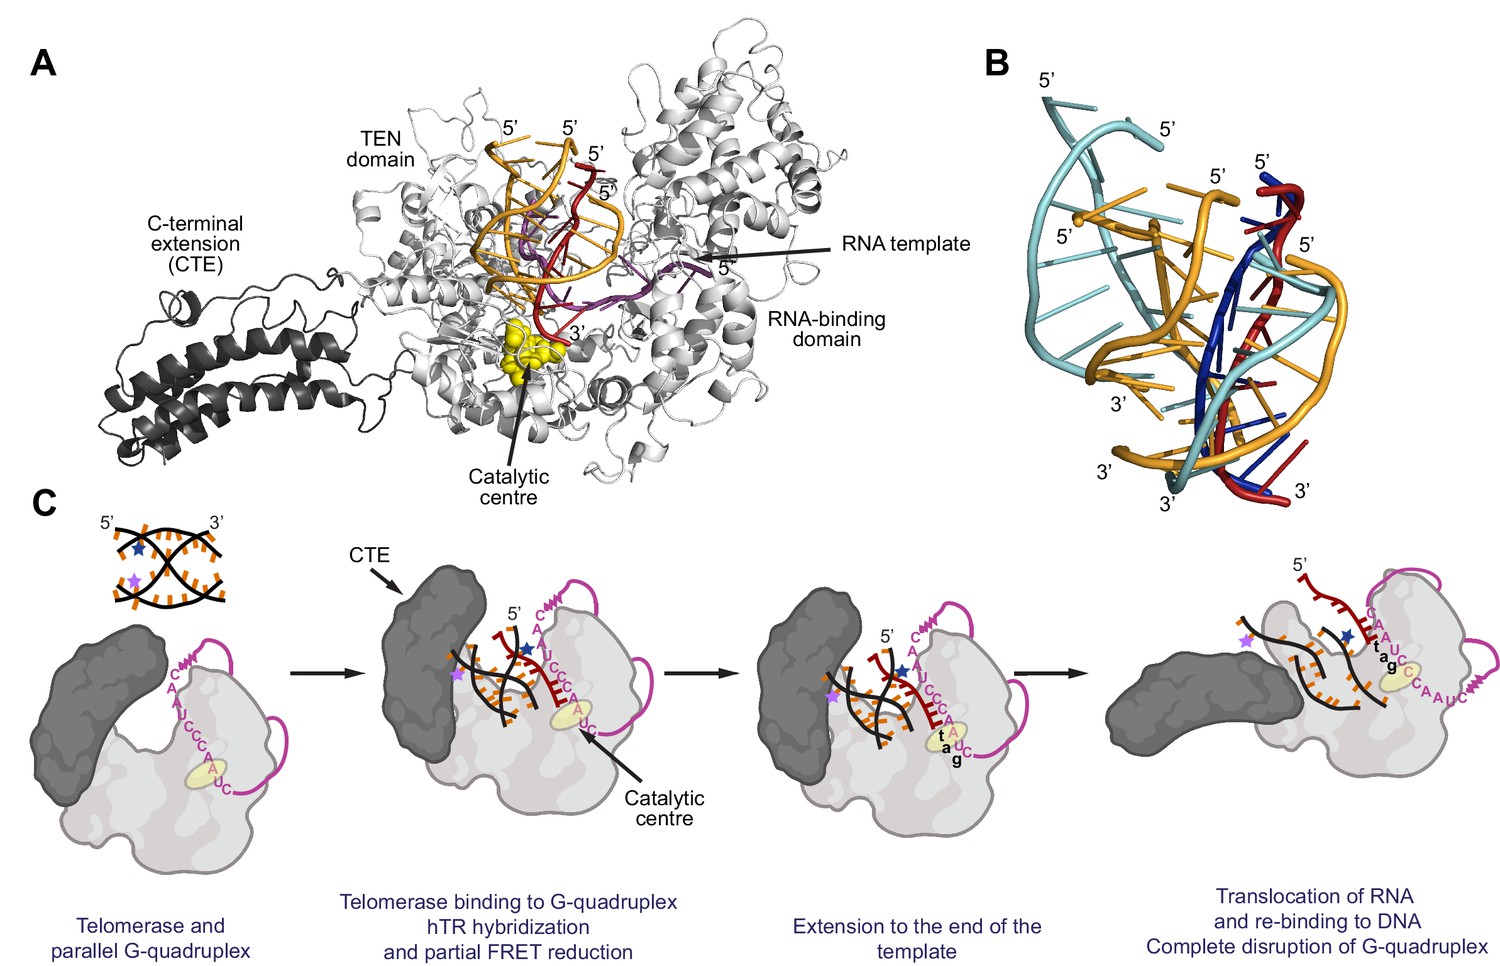
Model for binding and extension of parallel G-quadruplexes by telomerase.
(A) Model of an extended conformation of the human telomerase reverse transcriptase (hTERT; grey) with a 10 nt RNA template (magenta) and the [7GGT]4 G-quadruplex (orange and dark red) docked into the active site. The extended CTE is highlighted in dark grey; the catalytic aspartate residues (Asp 712, 868, 869) are shown as yellow spheres. A single strand of the G4 (dark red) is flipped out of the structure in order for it to interact with the RNA at the catalytic center of the reverse transcriptase. Note that the conformation shown has a fully-extended CTE, but intermediate angles of pivoting are also compatible with binding of [7GGT]4. (B) Positions of the strands of [7GGT]4 after 10 ns (orange, dark red strands) or 100 ns (blue strands) of energy minimization with molecular dynamics. The dark red/dark blue strand is the one hybridizing with RNA. The modeling was performed with the G4 in the active site of telomerase; the protein and RNA are not shown. (C) A proposed model for parallel G4 extension and unfolding by human telomerase. See text for details.
Author response image 1
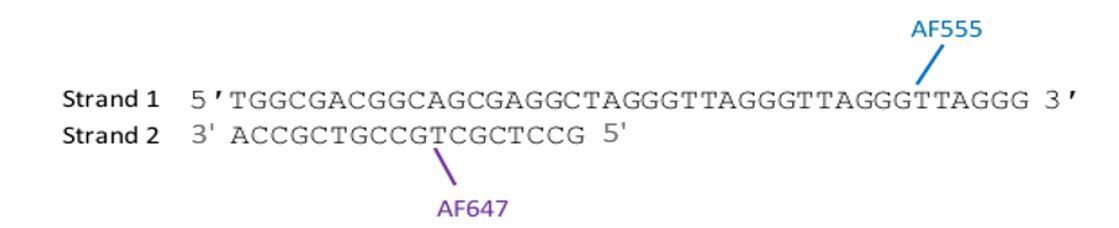
Intramolecular (F-22G3) forming sequence (top) and hybridisation sequence (bottom).
Tables
Key resources table
| Reagent type (species) or resource | Designation | Source or reference | Identifiers | Additional information |
|---|---|---|---|---|
| Cell line (Homo sapiens) | HEK293T (embryonic kidney, immortalized with adenovirus) | American Type Tissue Collection | Cat#: ATCC CRL-3216 | |
| Antibody | Anti-hTERT (sheep polyclonal) | Abbexa Ltd. | Cat#: abx120550 | IP (40 µg/ml) |
| Recombinant DNA reagent | pApex-CMV-hTERT (plasmid) | PMID:26158869 | Dr Tracy Bryan, Dr Scott Cohen | |
| Recombinant DNA reagent | pApex-CMV-dyskerin-U3-hTR (plasmid) | PMID:26158869 | Dr Tracy Bryan, Dr Scott Cohen | |
| Peptide, recombinant protein | hTERT amino acids 276–294 (peptide) | Abbexa Ltd. | Cat#: abx069990 | Sequence: ARPAEEATSLEGALSGTRH |
| Commercial assay or kit | Dynabeads M-280 Streptavidin | Thermo-Fisher | Cat#: 11206D | |
| Commercial assay or kit | NeutrAvidin Protein | Thermo-Fisher | Cat#: 31050 | |
| Commercial assay or kit | Unylinker CPG solid support | ChemGenes | Cat#: N-4000–05 | |
| Commercial assay or kit | Gel-Pak 2.5 Desalting Column | Glen Research | Cat#: 61-5025-25 | |
| Chemical compound, drug | AlexaFluor 555 NHS Ester | Thermo-Fisher | Cat#: A20009 | |
| Chemical compound, drug | (3-Aminopropyl)triethoxy silane | Alfa Aesar | Cat#: A10668 | |
| Chemical compound, drug | Biotin-PEG-SVA and mPEG-SVA | Laysan Bio | Cat#: BIO-PEG-SVA-5K-100MG and MPEG-SVA-5K-1g | |
| Chemical compound, drug | N-Methyl Mesoporphyrin IX (NMM) | Frontier Scientific | Cat#: NMM580 | |
| Chemical compound, drug | PhenDC3 | PMID:17260991 | Dr Marie-Paule Teulade-Fichou | |
| Chemical compound, drug | SST16 | PMID:19419877 | Dr Siritron Samosorn |
Additional files
-
Supplementary file 1
Table of oligonucleotides used in this study.
- https://cdn.elifesciences.org/articles/56428/elife-56428-supp1-v2.docx
-
Transparent reporting form
- https://cdn.elifesciences.org/articles/56428/elife-56428-transrepform-v2.pdf
Download links
A two-part list of links to download the article, or parts of the article, in various formats.
Downloads (link to download the article as PDF)
Open citations (links to open the citations from this article in various online reference manager services)
Cite this article (links to download the citations from this article in formats compatible with various reference manager tools)
A mechanism for the extension and unfolding of parallel telomeric G-quadruplexes by human telomerase at single-molecule resolution
eLife 9:e56428.
https://doi.org/10.7554/eLife.56428


