Stochastic bond dynamics facilitates alignment of malaria parasite at erythrocyte membrane upon invasion
- Theoretical Physics of Living Matter, Institute of Biological Information Processing and Institute for Advanced Simulation, Forschungszentrum Jülich, Germany
Figures
Figure 1
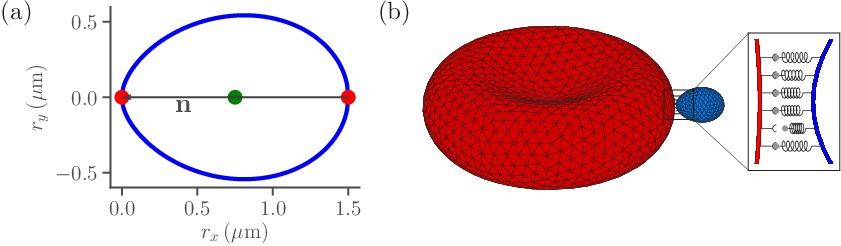
Sketch of parasite and RBC models.
(a) Two-dimensional sketch of a parasite with a directional vector from the parasite’s back at to its apex at . (b) Three-dimensional triangulated surfaces of a RBC (red) and a parasite (blue). Bonds between the parasite and RBC can form within the contact zone which is illustrated by a magnified view, where discrete receptor-ligand interactions (or bonds) are sketched. A bond can form with a constant on-rate and break with a constant off-rate .
Figure 2
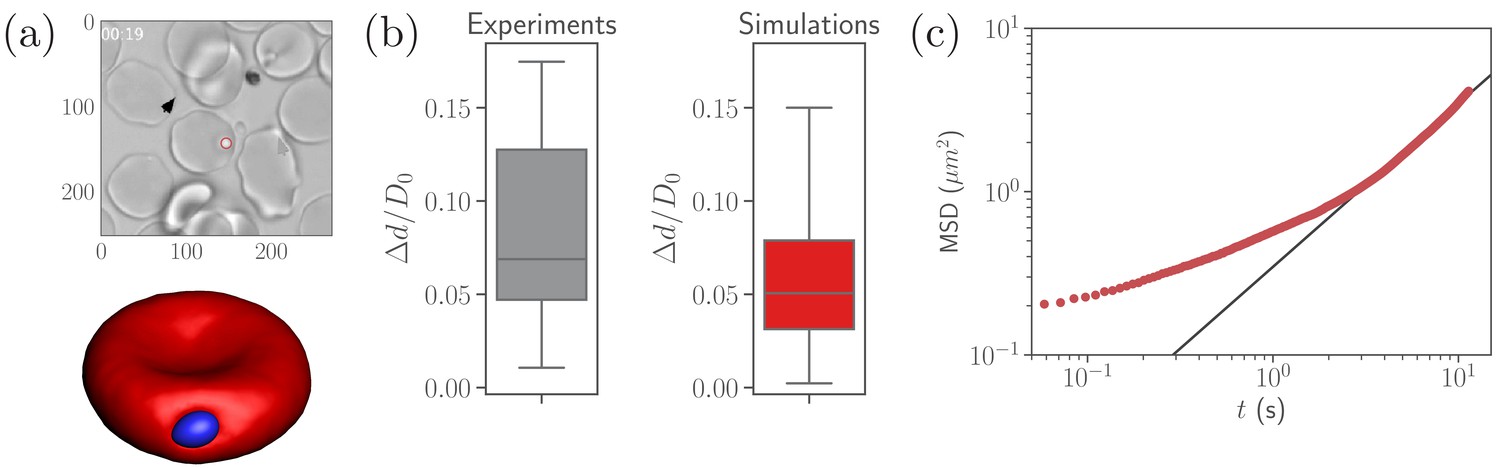
Calibration of parasite adhesion parameters.
(a) A time instance of parasite motion at RBC membrane from an experimental video (Weiss et al., 2015) (top) and simulation (bottom), see also Video 1. To obtain the distribution of merozoite fixed-time displacements, the marked parasite (red circle) is tracked over the course of its interaction with the RBC membrane. (b) Comparison between experimental (20 samples) and simulated (100 samples) fixed-time displacements () of the parasite at RBC membrane, which is normalized by the effective RBC diameter calculated from the membrane area . By adapting the interaction parameters, the displacement distribution in simulations is calibrated against the experimental distribution. The resulting reference parameters for our model can be found in Table 2. (c) Mean squared displacement (MSD) of a parasite from simulations as a function of time. The black solid line marks a diffusive regime with . Note the subdiffusive dynamics for short times, less than about .
-
Figure 2—source data 1
Source data for graphs shown in Figure 2(b,c).
- https://cdn.elifesciences.org/articles/56500/elife-56500-fig2-data1-v2.zip
Figure 3 with 1 supplement
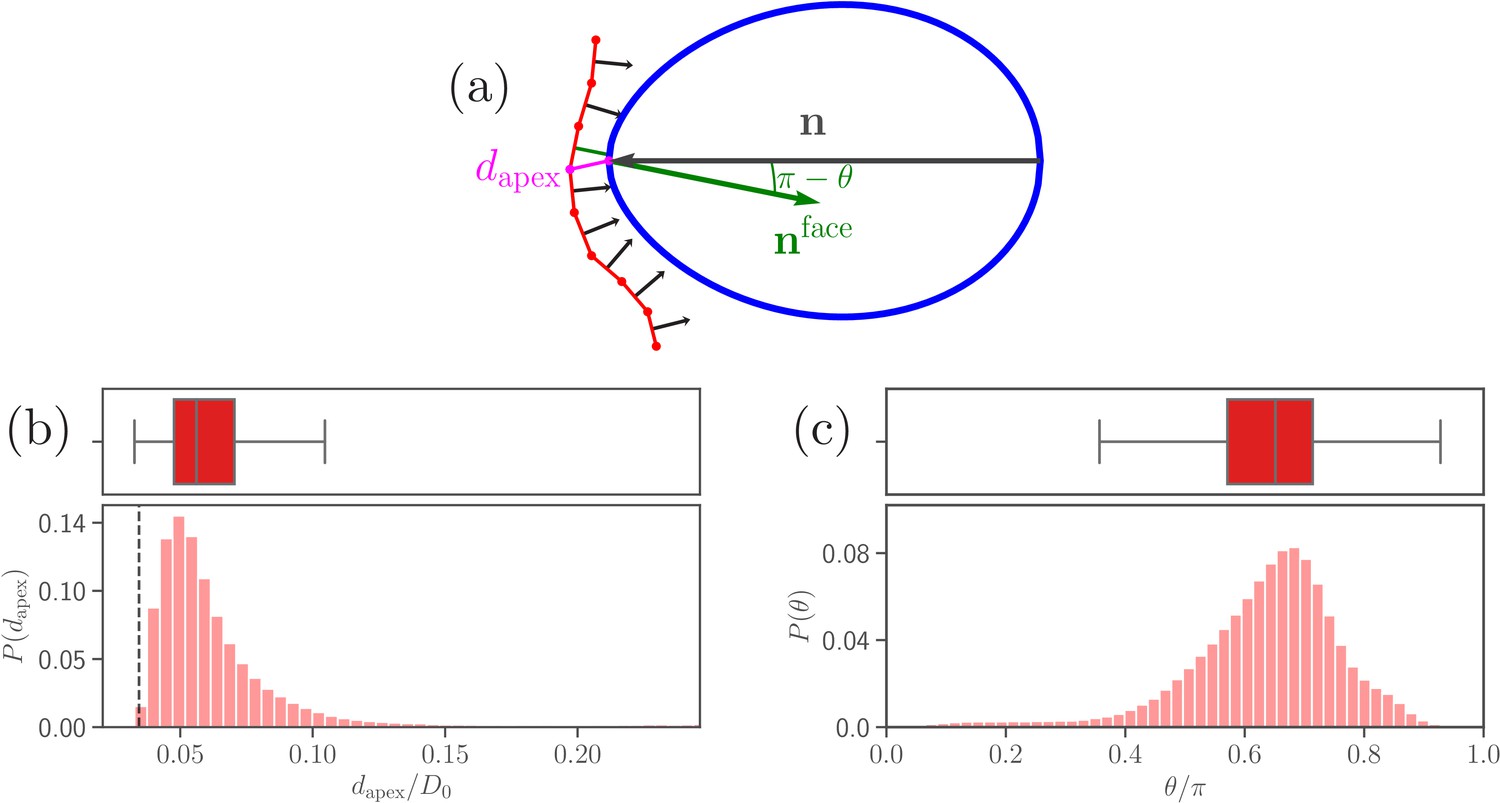
Parasite adhesion to a deformable RBC.
(a) Sketch of apex distance and alignment angle . The apex distance is defined as a distance (magenta line) between the parasite’s apex and the closest vertex of RBC membrane. The alignment angle corresponds to the angle between the parasite’s directional vector (black arrow) and the normal vector (green arrow) of a triangular face whose center is closest to the apex. Note that the angle is drawn in the plot. (b and c) Probability distributions of the apex distance and the alignment angle . Data are obtained for parameters shown in Table 2, and accumulated starting from an initial adhesion contact (i.e., formation of a few bonds). The dashed line in the apex distance distribution indicates the cutoff of repulsive LJ interactions. Note that a good parasite alignment requires small values of and values of close to unity.
-
Figure 3—source data 1
Source data for graphs shown in Figure 3b,c and Figure 3—figure supplement 1.
- https://cdn.elifesciences.org/articles/56500/elife-56500-fig3-data1-v2.zip
Figure 3—figure supplement 1
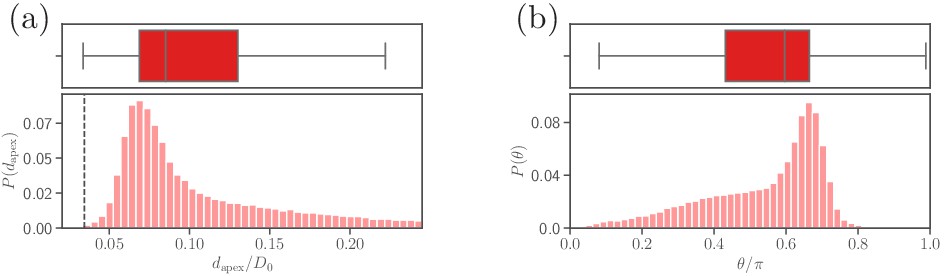
Parasite adhesion to a rigid RBC (see section ‘Effect of RBC rigidity’).
Probability distributions of (a) the apex distance , and (b) the alignment angle . The dashed line in the apex distance distribution indicates the cutoff of repulsive LJ interactions.
Figure 4
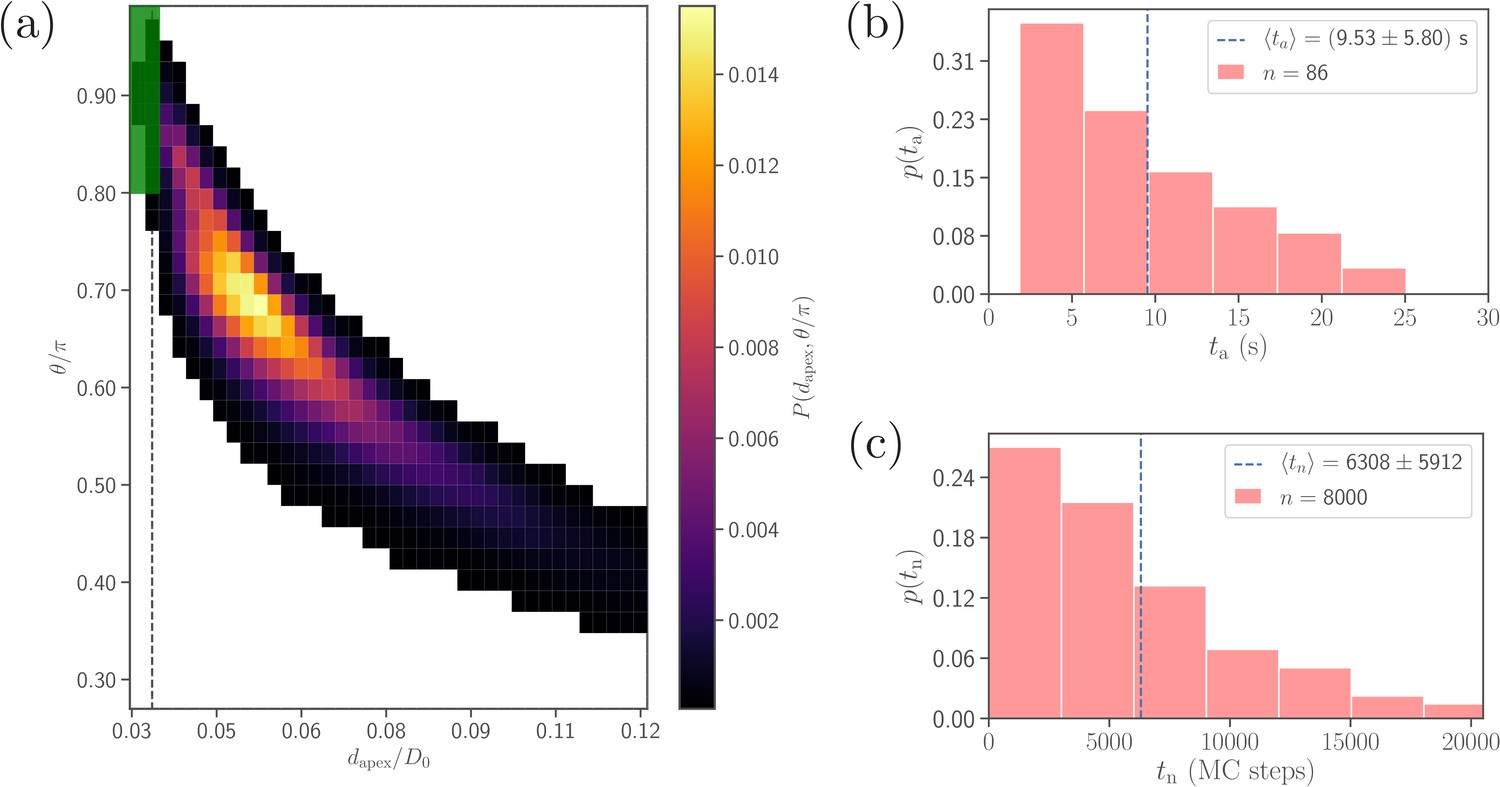
Comparison of alignment times obtained from direct DPD simulations and MC sampling.
(a) Two-dimensional probability map as a function of and . Each bin represents a single alignment state and the color corresponds to probability of that state. The dark green area ( and , compare with Equation 4) represents the criteria for a successful alignment. The black dashed line corresponds to the cutoff of repulsive LJ interactions. (b) Distribution of alignment times obtained from 86 statistically independent DPD simulations. is defined as a time interval starting from an initial adhesive contact (i.e., formation of a few bonds) to the instance when the alignment criteria for and in Equation 4 are met. The average alignment time is equal to . (c) Alignment time distribution from MC sampling using the probability map in (a). The alignment time is defined as a number of MC steps needed to satisfy the alignment criteria, as the MC procedure does not have an inherit timescale. Note that the sample size in MC modeling (8000 trajectories) is much larger than that in (b).
-
Figure 4—source data 1
Source data for graphs shown in Figure 4a–c.
- https://cdn.elifesciences.org/articles/56500/elife-56500-fig4-data1-v2.zip
Figure 5 with 2 supplements

Variations in stretching and bending energies, the number of bonds , the head distance , and the alignment angle as a function of time for the default parameter set given in Table 2.
Temporal changes in the number of bonds are shown for both long and short bond types. The dashed lines in the bottom plot correspond to the alignment criteria in Equation 4. For all quantities, the corresponding averages and variances represented by box plots are depicted on the right.
-
Figure 5—source data 1
Source data for graphs shown in Figure 5 and Figure 5—figure supplements 1 and 2.
- https://cdn.elifesciences.org/articles/56500/elife-56500-fig5-data1-v2.zip
Figure 5—figure supplement 1
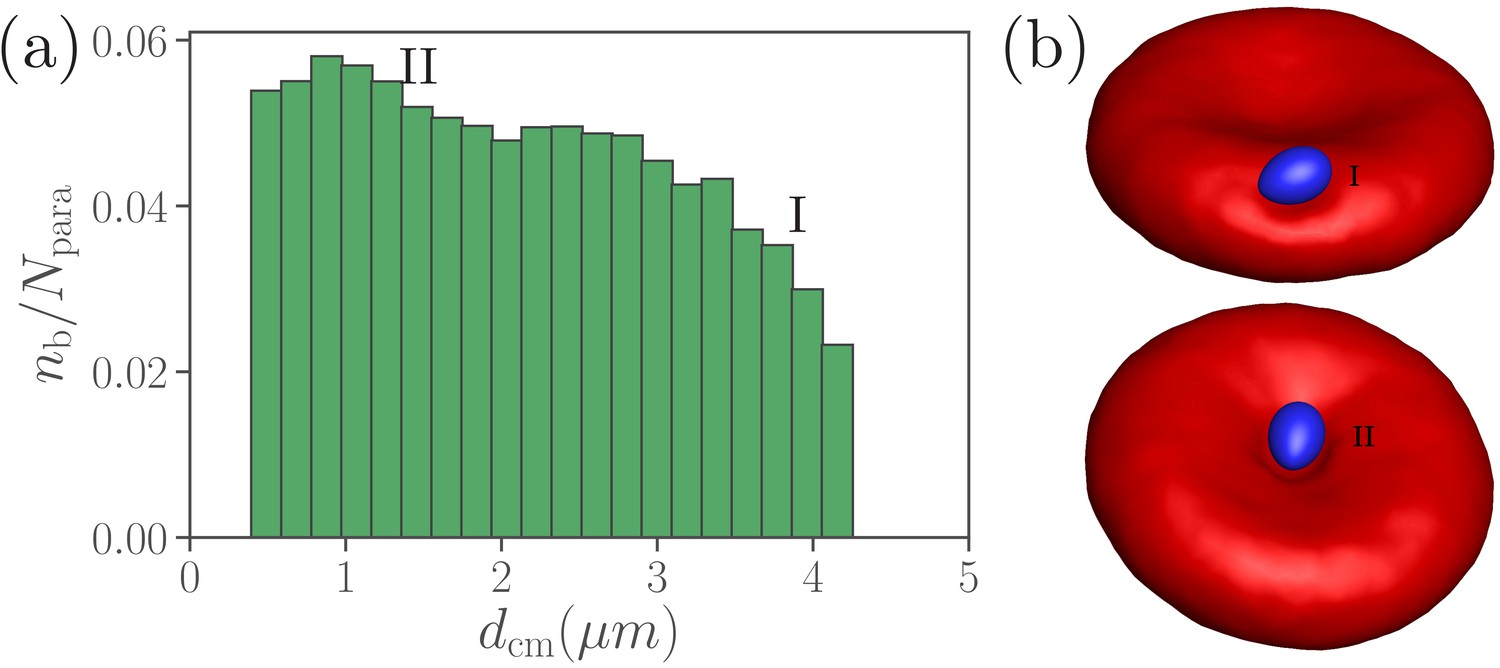
Dependence of parasite wrapping on the position at RBC membrane.
(a) Average total number of bonds between the merozoite and RBC as a function of the distance between their centers of mass. (b) Illustration of parasite adhesion at the RBC rim (marked by I) and in the dimple (II). The parasite forms more bonds in the dimples (position II) than at the RBC rim (position I).
Figure 5—figure supplement 2
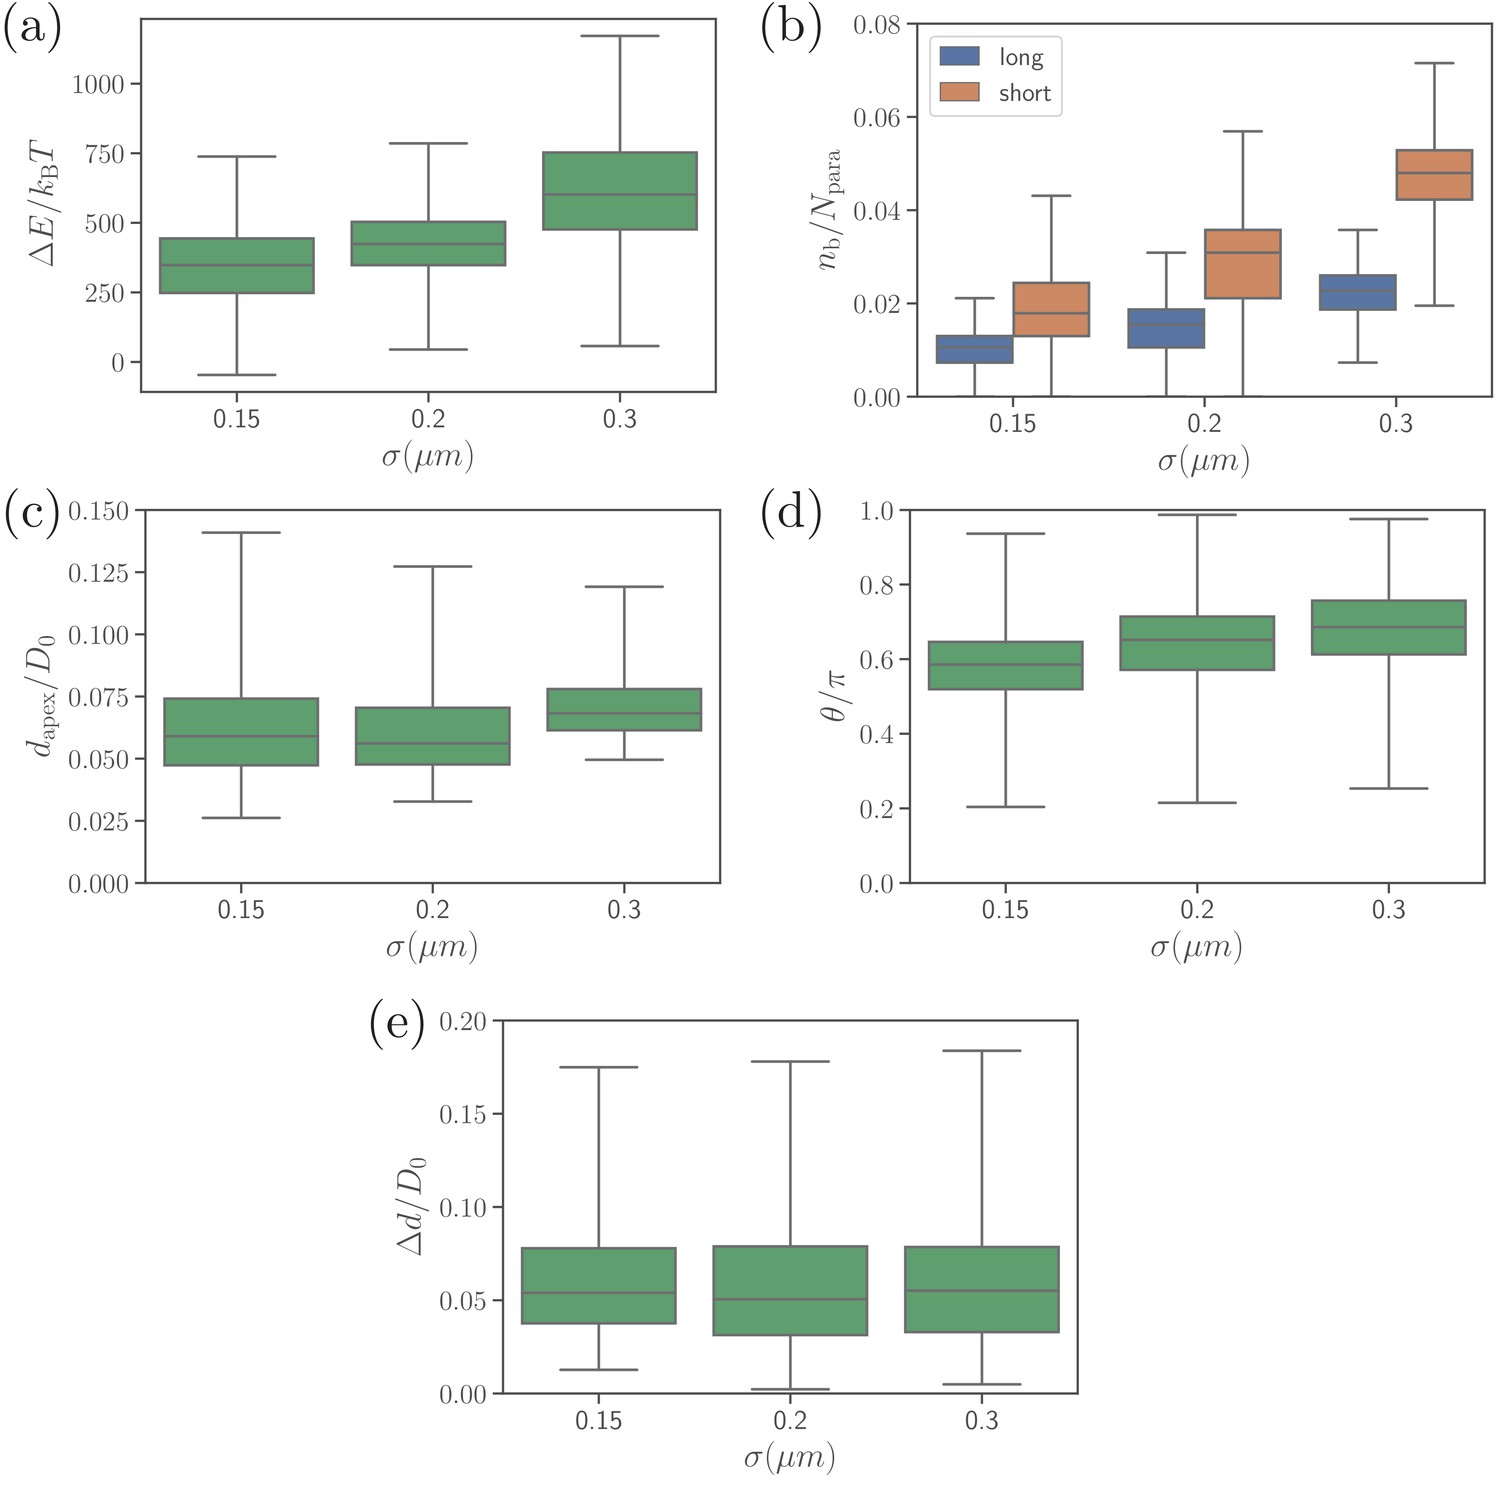
Different alignment characteristics, including (a) deformation energy, (b) number of bonds, (c) apex distance, (d) alignment angle, and (e) fixed-time displacement, for several values of parameter which determines the effective membrane thickness.
Figure 6 with 1 supplement
Effect of the off-rate on (a) the parasite’s fixed-time displacement, (b) RBC deformation energy, and (c) alignment time.
Since the off-rate controls the lifetime of bonds, a smaller off-rate results in a stronger adhesion, a lower parasite displacement, and a faster alignment time.
-
Figure 6—source data 1
Source data for graphs shown in Figure 6a–c and Figure 6—figure supplement 1.
- https://cdn.elifesciences.org/articles/56500/elife-56500-fig6-data1-v2.zip
Figure 6—figure supplement 1
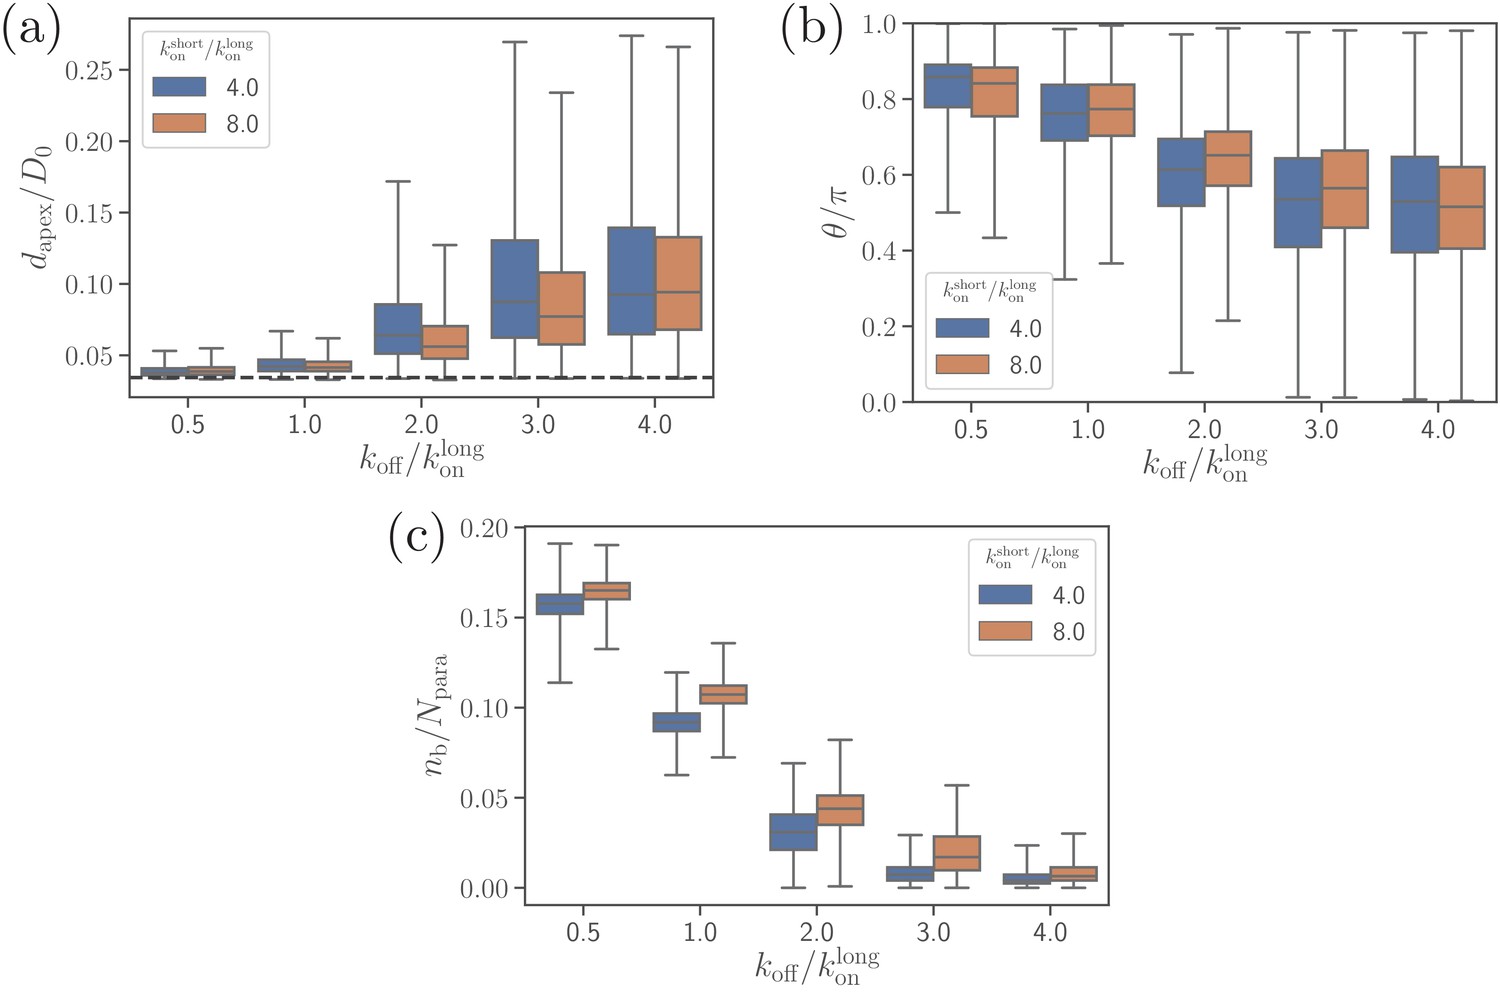
Effect of the off-rate on (a) the apex distance, (b) alignment angle, and (c) the number of bonds.
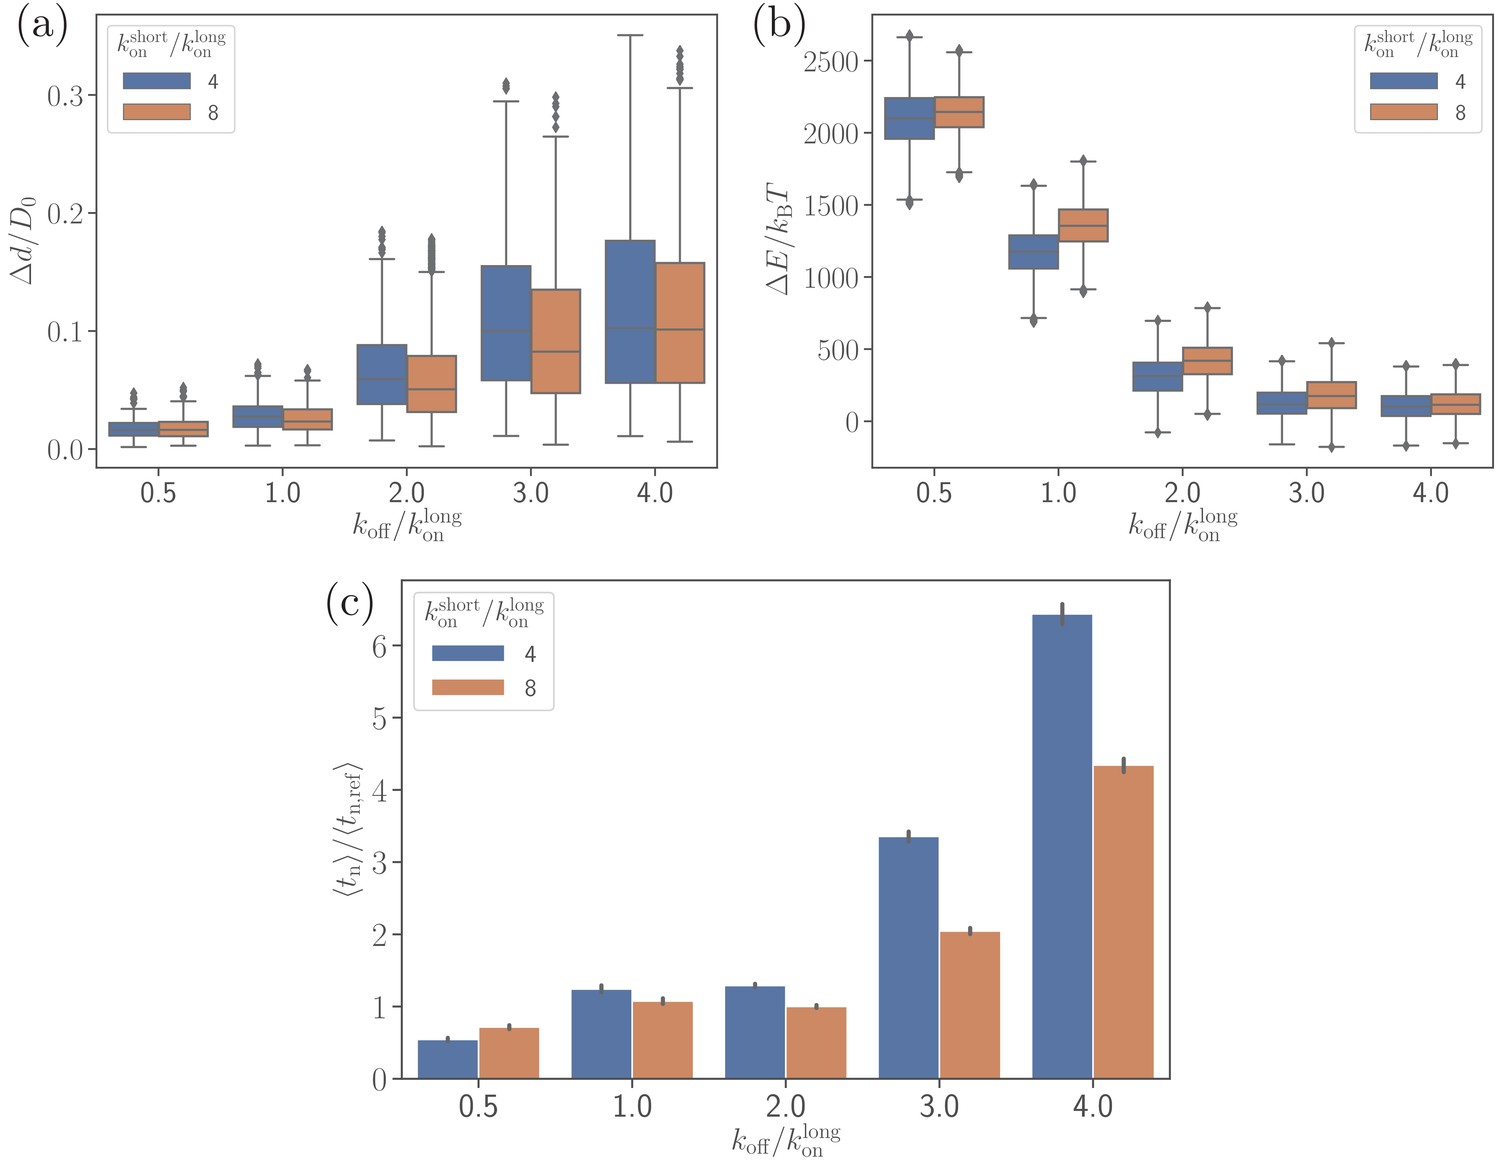
Figure 7 with 1 supplement
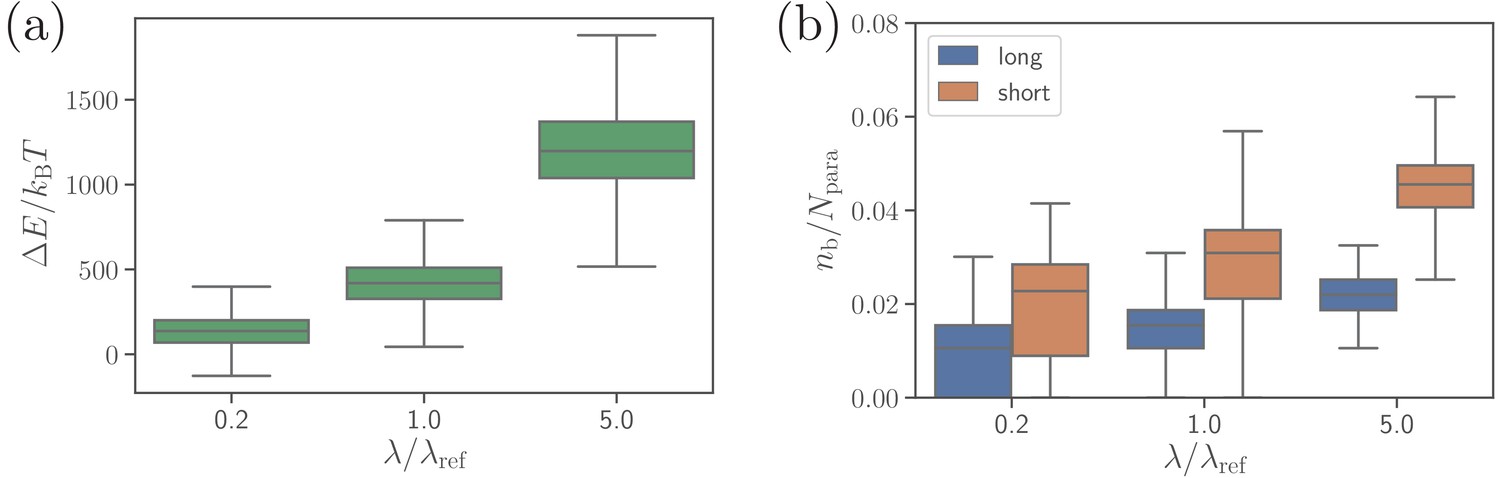
Effect of the extensional bond rigidities on parasite alignment.
(a) RBC deformation energy and (b) the number of short and long bonds as a function of . corresponds to the reference case with parameters given in Table 2. Note that both and are changed by the same factor with respect to their values. Here, the bond kinetic rates are , , and .
-
Figure 7—source data 1
Source data for graphs shown in Figure 7a,b and Figure 7—figure supplement 1.
- https://cdn.elifesciences.org/articles/56500/elife-56500-fig7-data1-v2.zip
Figure 7—figure supplement 1
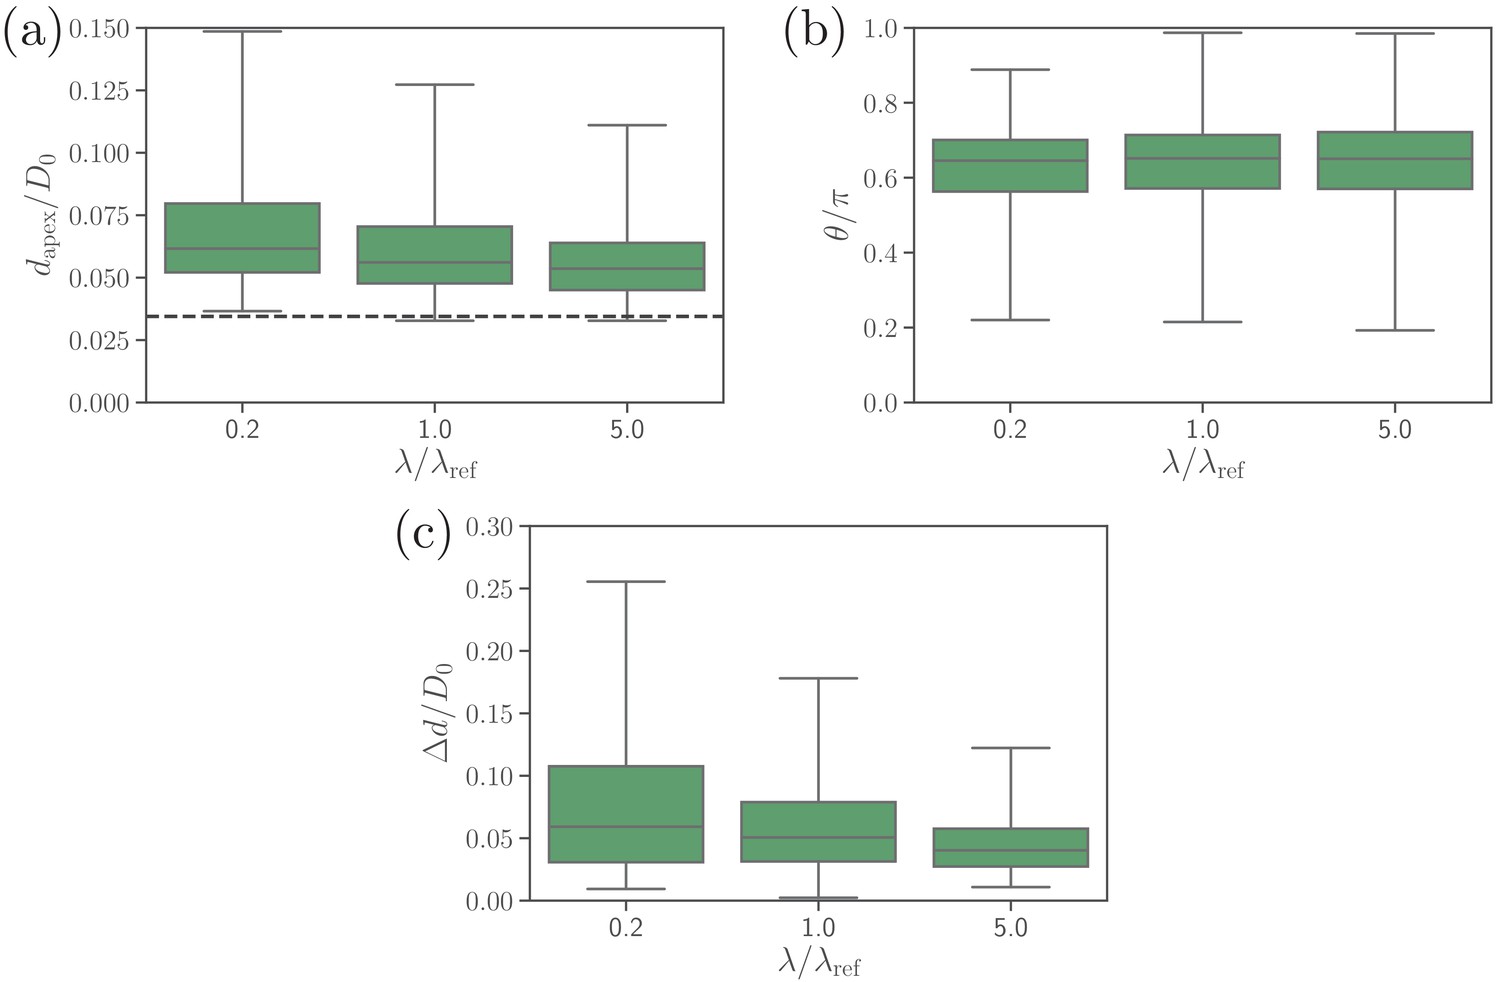
Effect of the extensional bond rigidities on (a) the apex distance, (b) alignment angle, and (c) fixed-time displacement of the parasite.
Figure 8 with 2 supplements
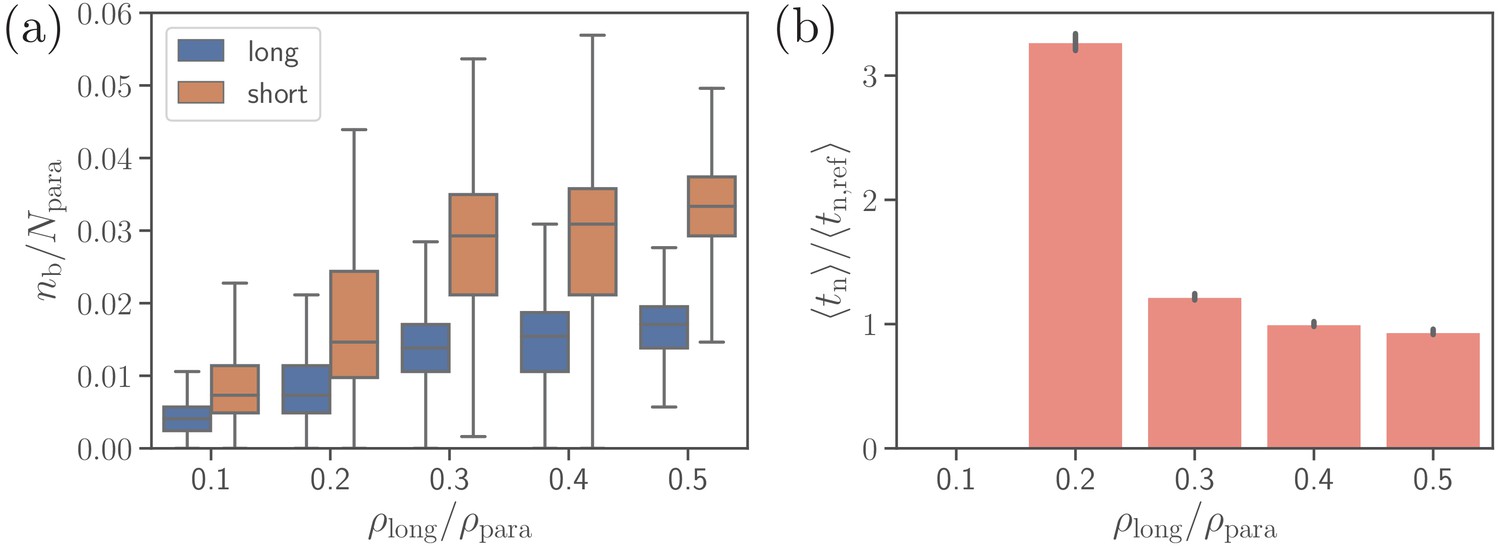
Effect of the density of long ligands on parasite alignment.
(a) Number of short and long bonds and (b) parasite alignment times as a function of . Note that remains constant in all simulations. Here, the bond kinetic rates are , , and . In case of , parasite alignment time could not be computed through the MC sampling, since merozoite alignment has never occurred in direct simulations.
-
Figure 8—source data 1
Source data for graphs shown in Figure 8a,b and Figure 8—figure supplements 1 and 2.
- https://cdn.elifesciences.org/articles/56500/elife-56500-fig8-data1-v2.zip
Figure 8—figure supplement 1
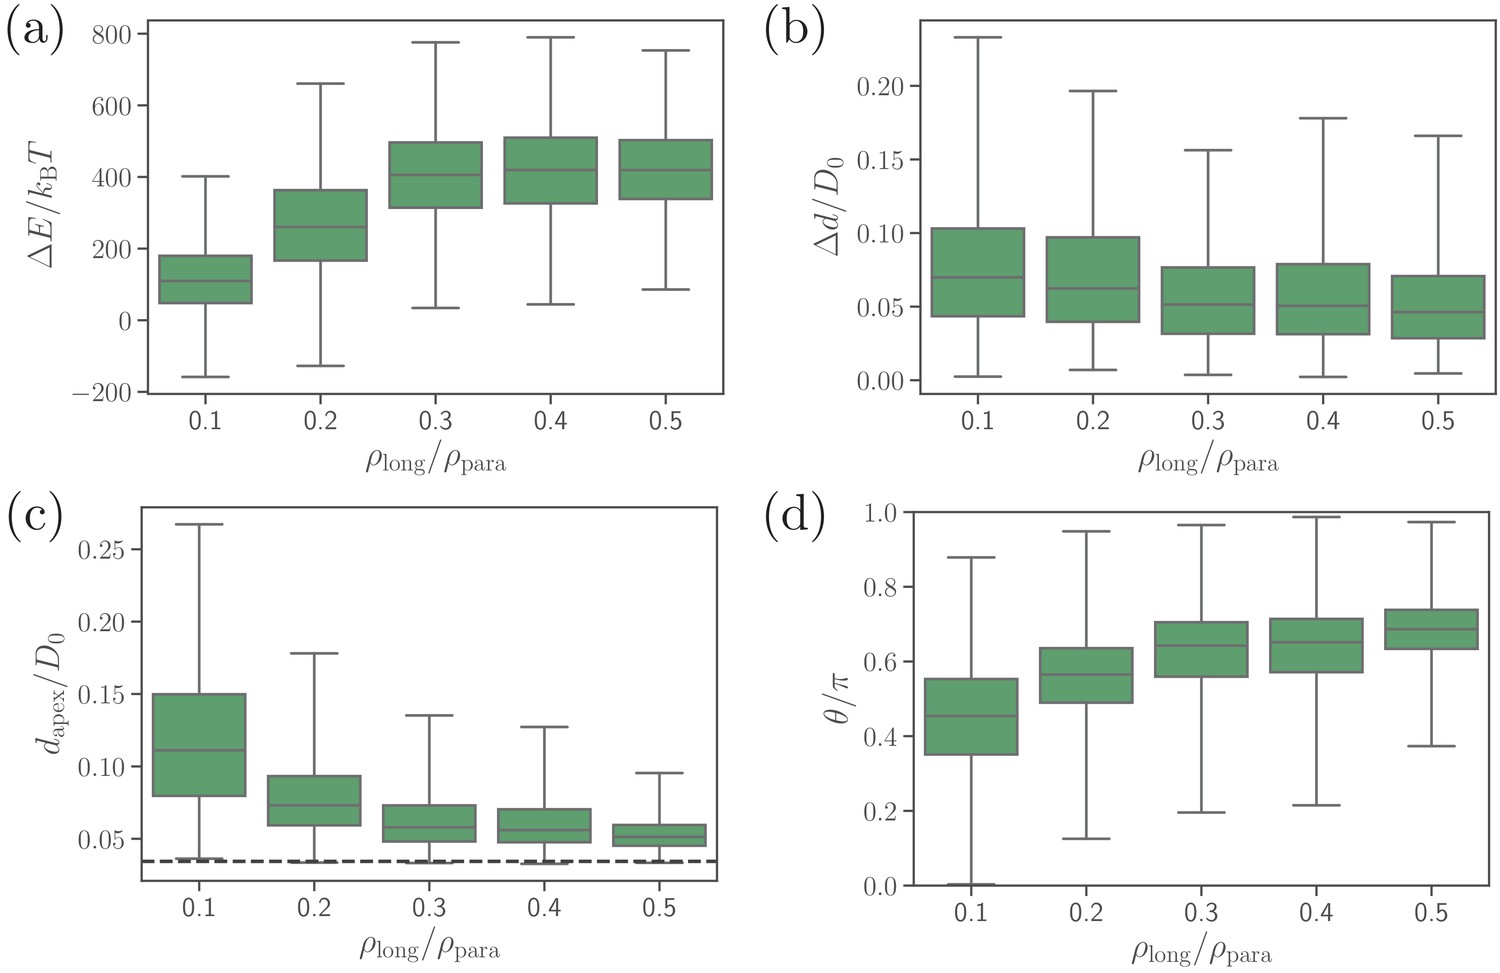
Effect of the density of long ligands on (a) deformation energy, (b) fixed-time displacement, (c) apex distance, and (d) alignment angle.
Figure 8—figure supplement 2
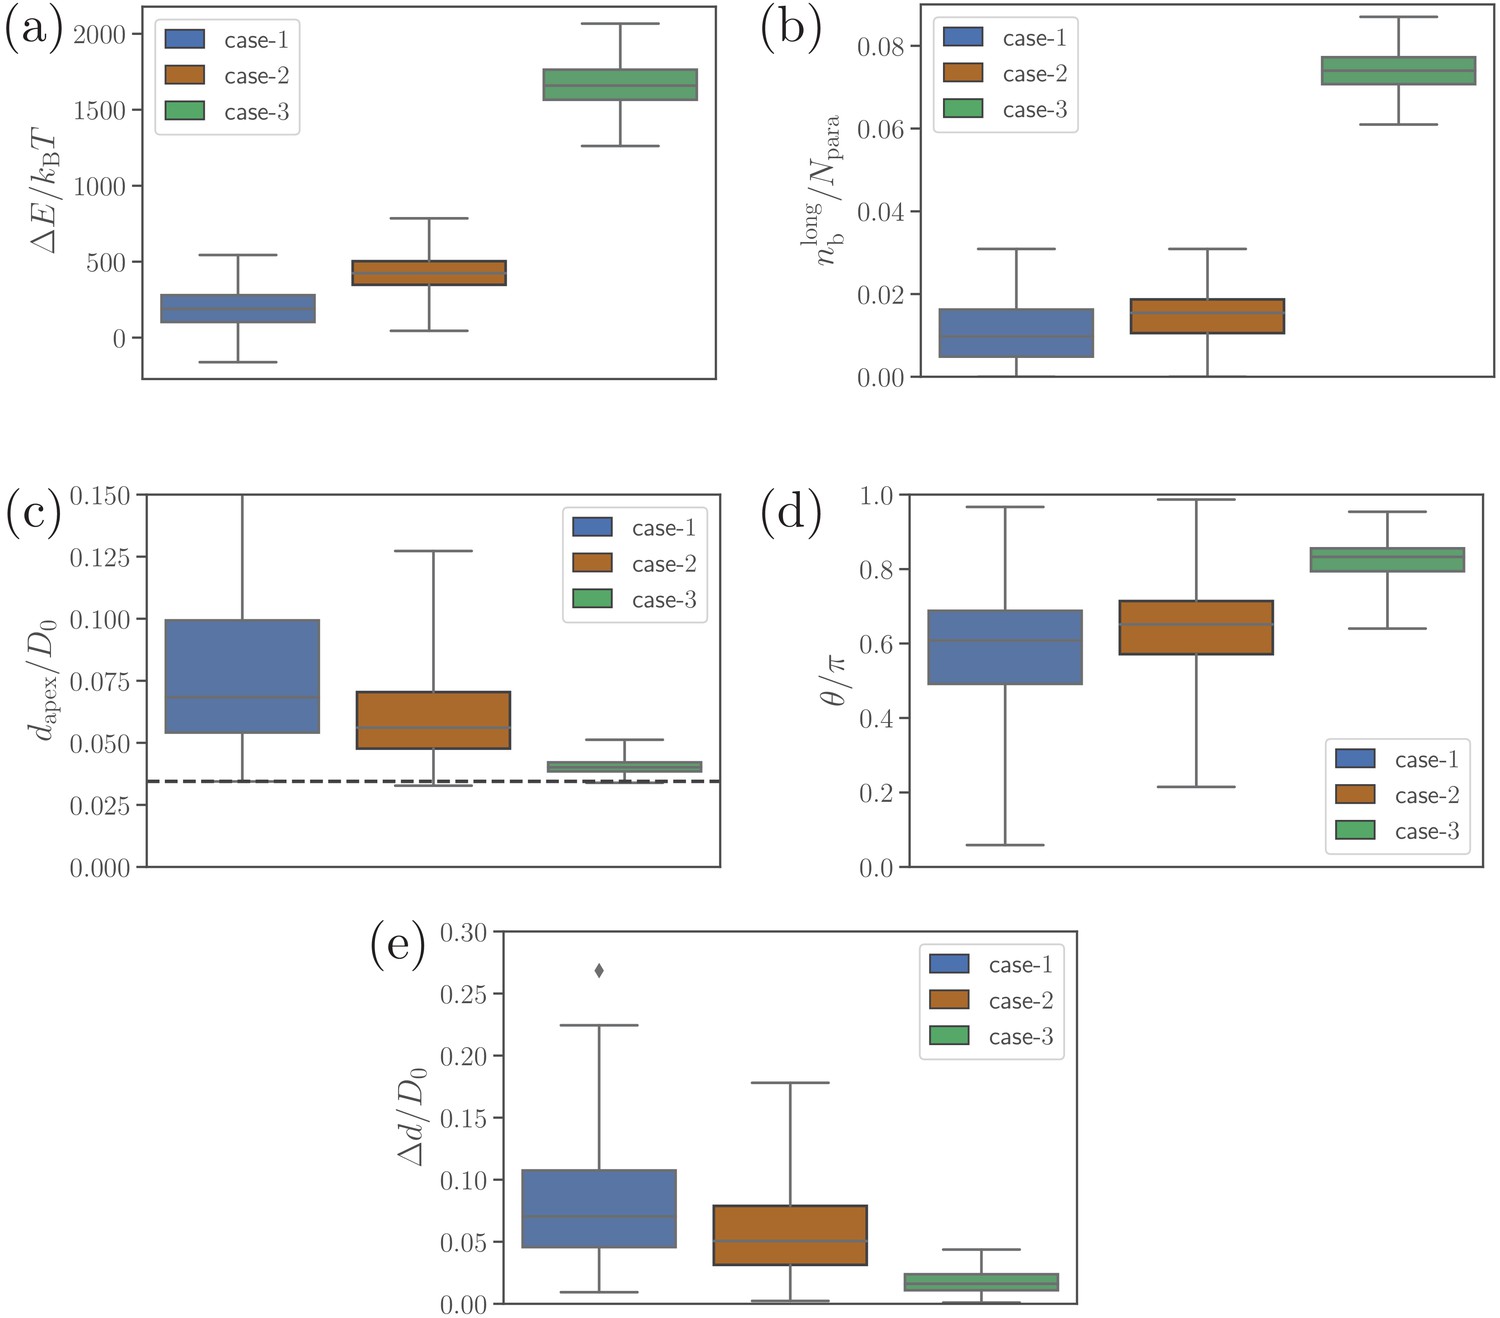
Alignment results of simulations with only long ligands, i.e. for .
(a) Deformation energy, (b) the number of bonds, (c) apex distance, (d) alignment angle, and (e) fixed-time displacement of the merozoite for the three cases: (1) and , (2) and (the reference case), (3) and .
Figure 9
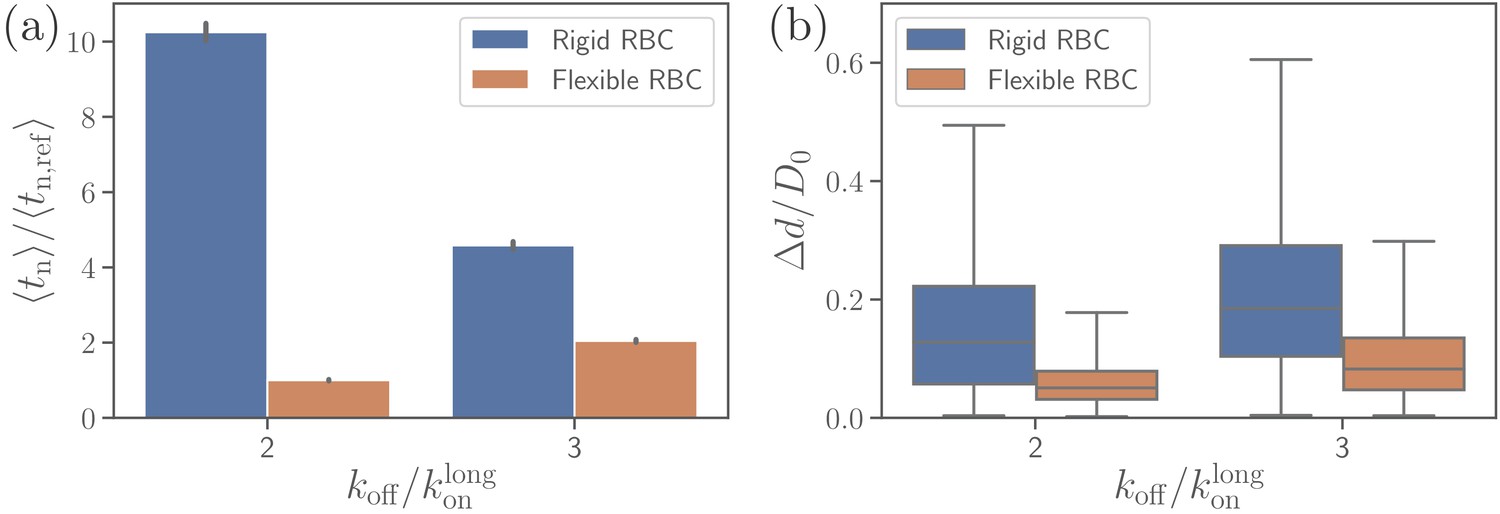
Effect of RBC membrane rigidity on (a) alignment time and (b) parasite fixed-time displacement for different off-rates .
Note that for a rigid RBC with , parasite alignment time could not be computed through the MC sampling, as the alignment criteria have never been met in direct simulations.
-
Figure 9—source data 1
Source data for graphs shown in Figure 9a,b.
- https://cdn.elifesciences.org/articles/56500/elife-56500-fig9-data1-v2.zip
Videos
Video 1
Parasite motion at the membrane of a deformable RBC for the reference RBC-parasite interactions from Table 2.
. See Figure 2a.
Video 2
Parasite adhesion and dynamics on a deformable RBC for a reduced off-rate .
.
Video 3
Parasite dynamics at the surface of a rigid RBC for the reference RBC-parasite interactions from Table 2.
.
Tables
Table 1
Simulation parameters given in both model and physical units.
The effective RBC diameter sets a basic length, the thermal energy defines an energy scale, and RBC relaxation time sets a time scale in the simulated system, where is the RBC surface area, is the bending rigidity, and is the fluid dynamic viscosity. The values of bending rigidity , 2D shear µ and Young’s moduli are chosen such that they correspond to average properties of a healthy RBC. Parameters and correspond to RBC-parasite excluded-volume interactions represented by the purely repulsive LJ potential in Equation 11.
| Parameter | Simulation value | Physical value |
|---|---|---|
| 133.5 | ||
| 0.01 | ||
| 0.92 s | ||
| 1.85 | ||
| µ | ||
| 1230 | ||
| 3000 | ||
Table 2
List of bond parameters that are used to calibrate displacement of the parasite at the RBC membrane in simulations (see Video 1) against available experimental data (Weiss et al., 2015), as shown in Figure 2b.
The parameter values in simulations are given in terms of the length scale , energy scale , and timescale . The densities of long and short ligands are given in terms of parasite vertex density . Note that in all simulations.
| Parameter | Simulation value | Physical value |
|---|---|---|
| 0.4 | ||
| 0.6 | ||
Additional files
Download links
A two-part list of links to download the article, or parts of the article, in various formats.
Downloads (link to download the article as PDF)
Open citations (links to open the citations from this article in various online reference manager services)
Cite this article (links to download the citations from this article in formats compatible with various reference manager tools)
Stochastic bond dynamics facilitates alignment of malaria parasite at erythrocyte membrane upon invasion
eLife 9:e56500.
https://doi.org/10.7554/eLife.56500


