A quantitative inventory of yeast P body proteins reveals principles of composition and specificity
- Department of Biophysics, Howard Hughes Medical Institute, UT Southwestern Medical Center, United States
- Department of Biochemistry, Howard Hughes Medical Institute, University of Colorado, United States
Figures
Figure 1 with 3 supplements

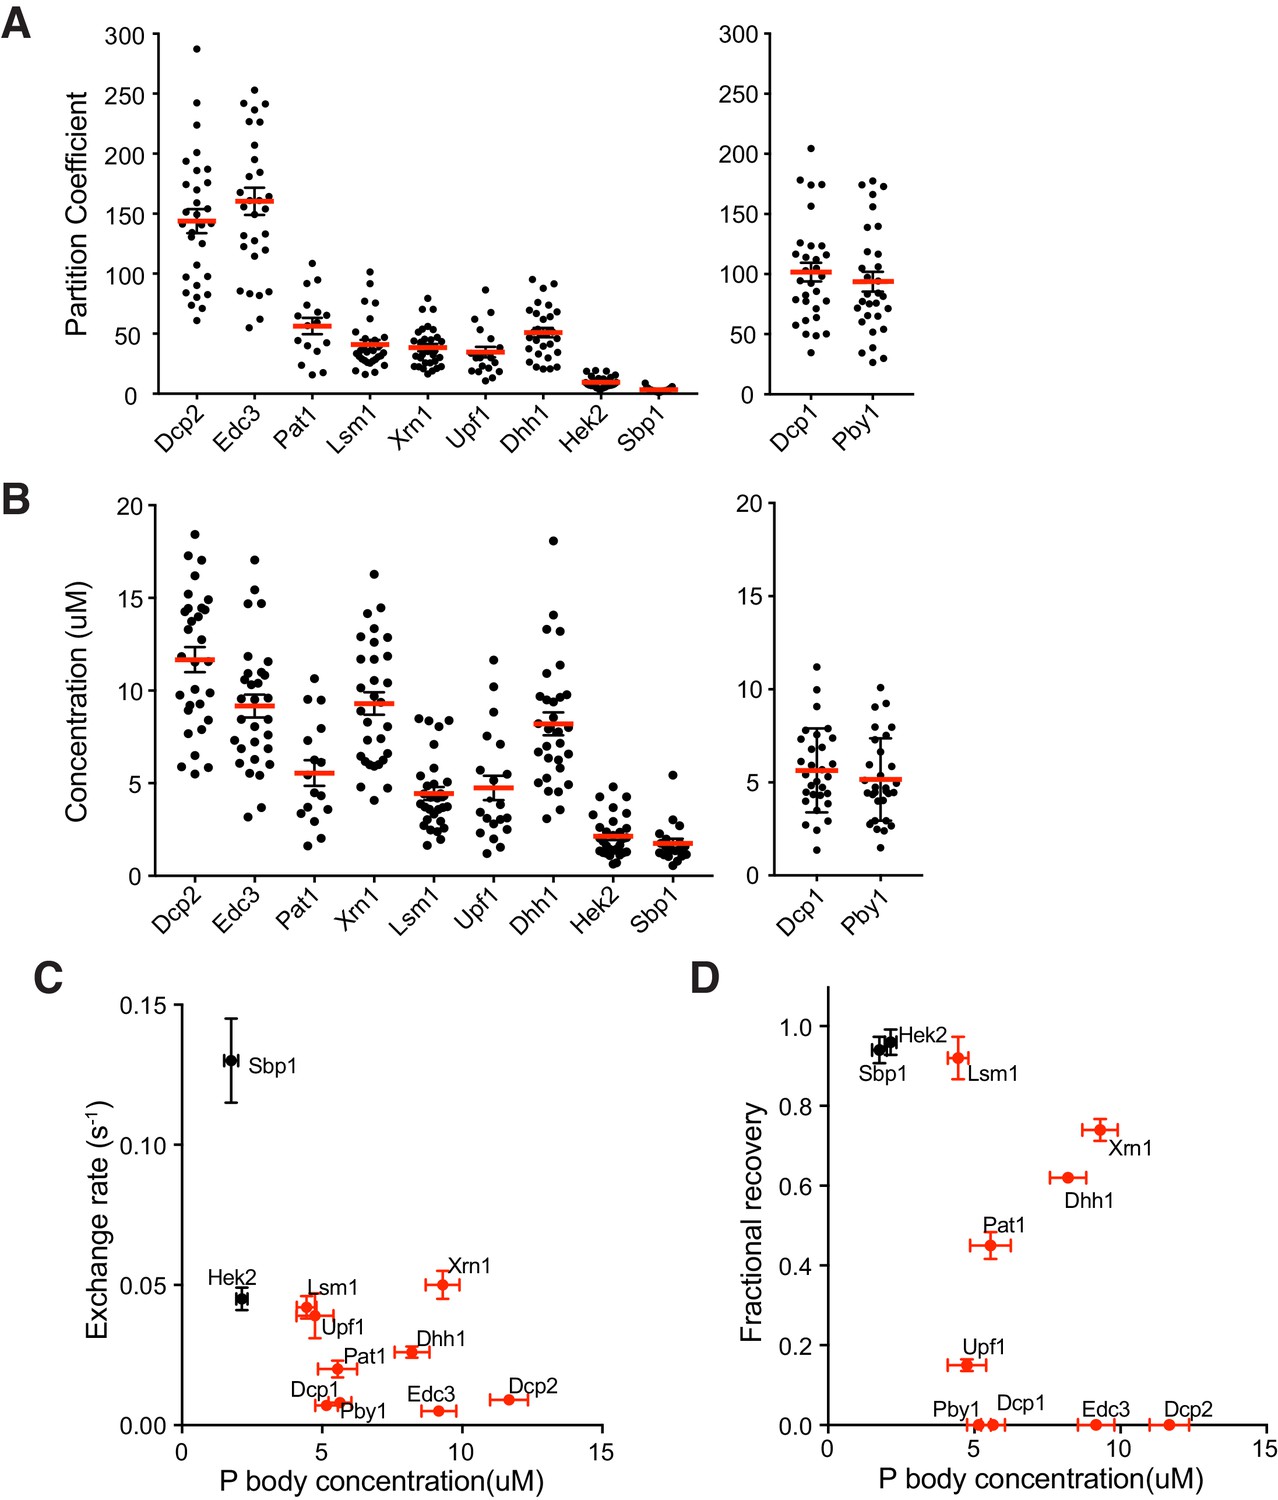
Seven proteins are highly concentrated in P bodies.
(A) Partition coefficients (PCs) of 19 P body proteins. Plots show PCs and mean values (blue lines)± standard error of the mean (SEM). (B) Absolute concentrations in P bodies of 19 P body proteins. Plots show absolute concentrations in P bodies and mean values (blue lines)± SEM. For (A) and (B) each dot represents an individual P body. Red, HC P body proteins. Black, LC P body proteins. One P body per cell was analyzed from 16 to 25 cells for each protein.
Figure 1—figure supplement 1
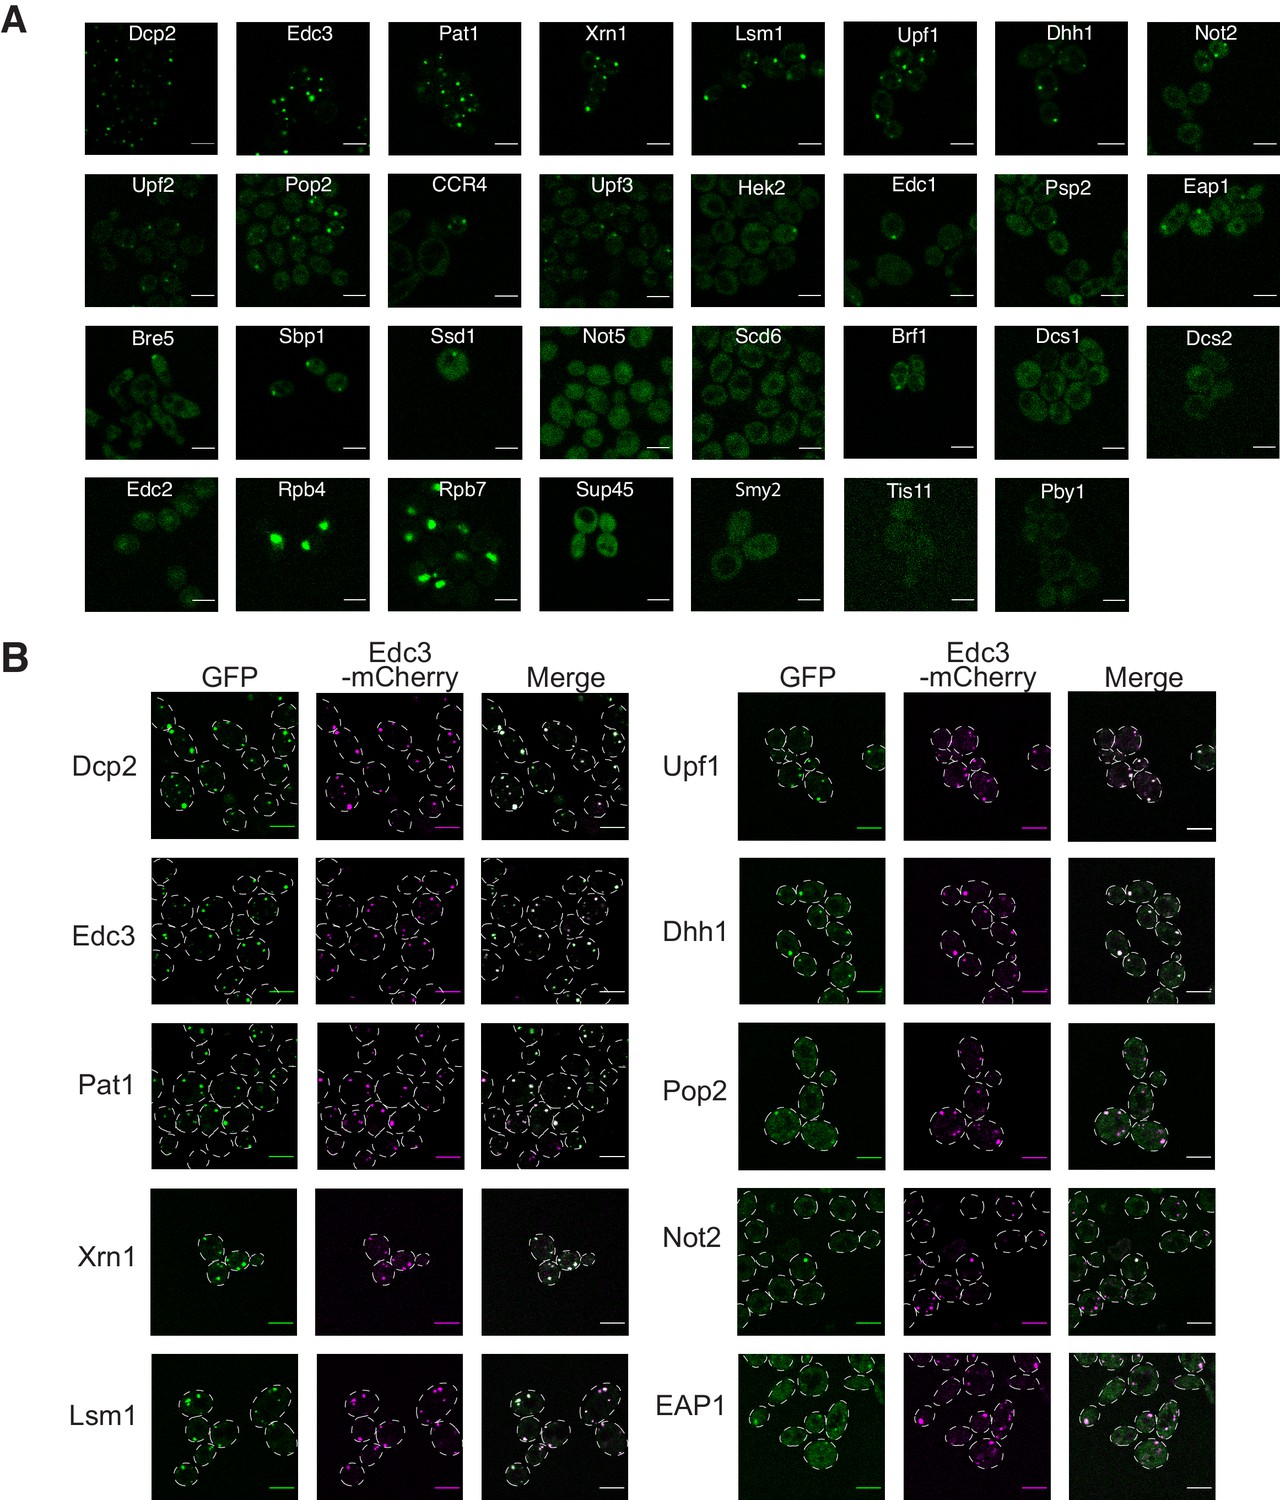
Punctate localization of GFP tagged proteins and co-localization with P body marker.
(A) Confocal fluorescence microscopy images of 31 P body proteins fused to GFP expressed in dcp1Δ strain in log-phase. Scale bar, 5 µm. (B) Fluorescence microscopy images of yeast co-expressing Edc3-mcherry and selected GFP-fused P body proteins. Scale bar, 5 µm.
Figure 1—figure supplement 2
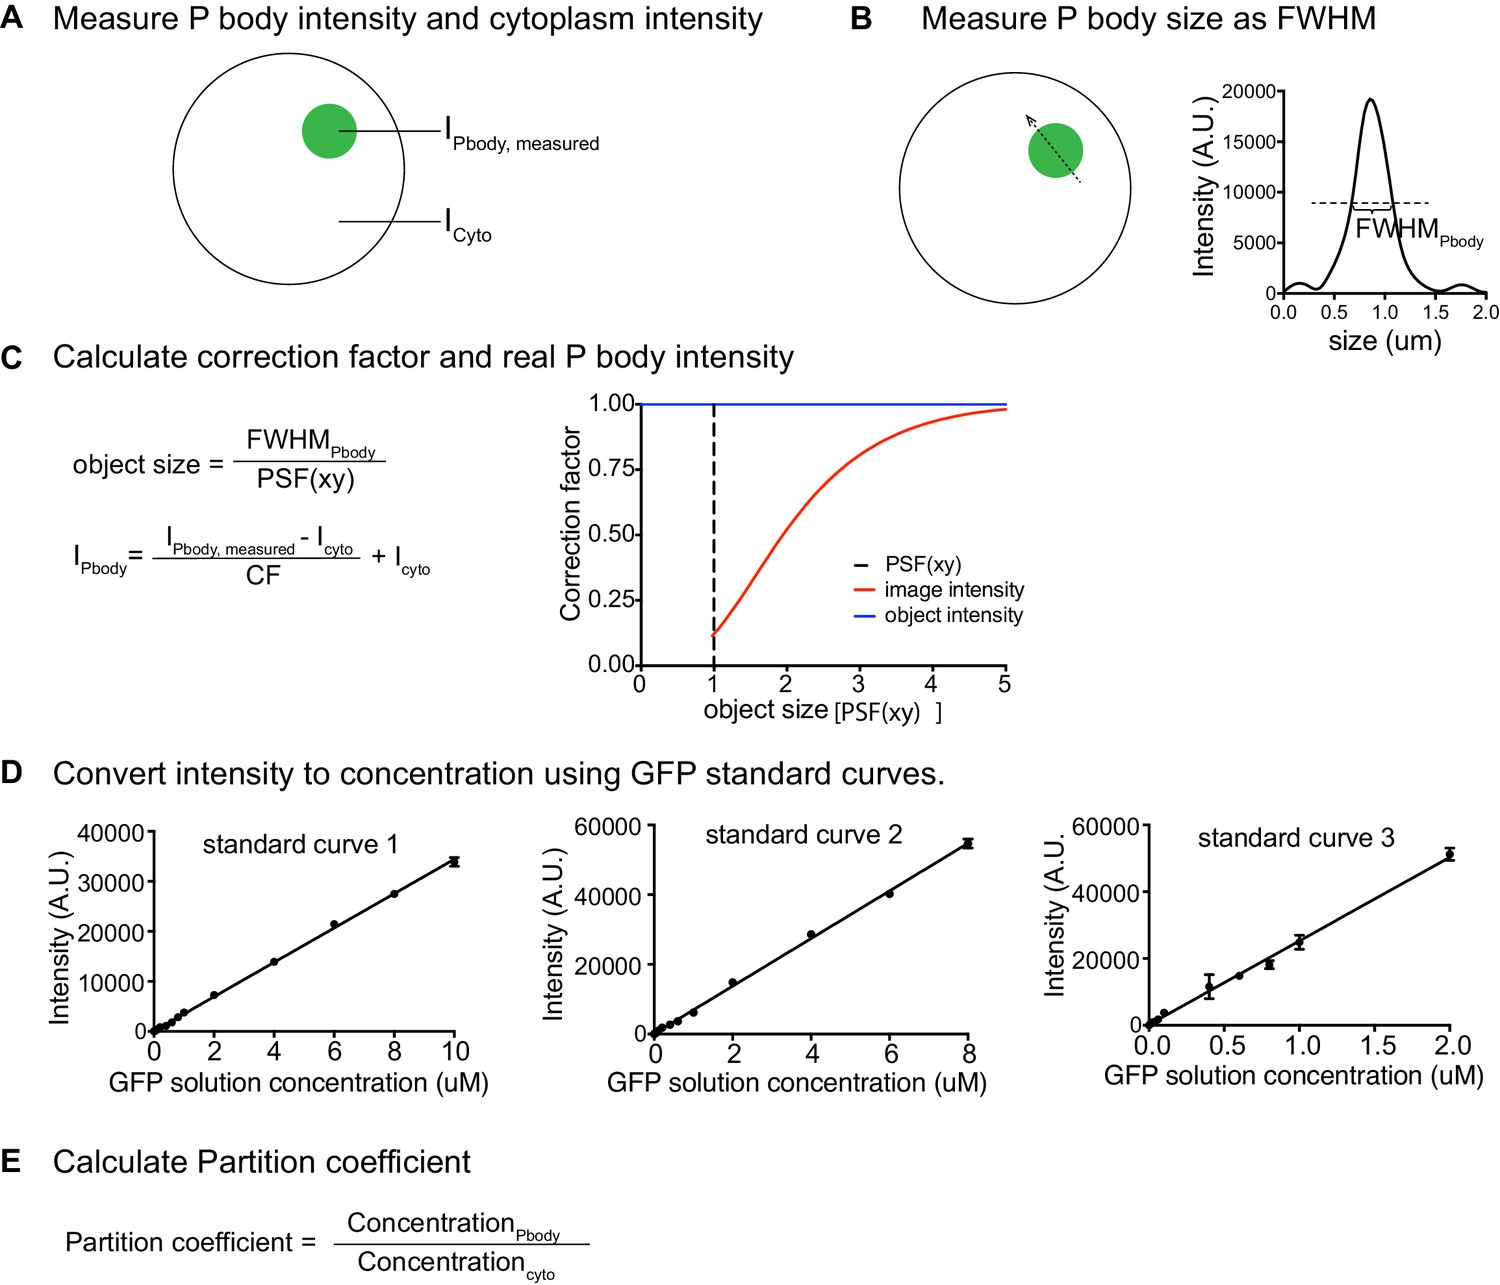
Quantifications of protein concentrations using fluorescence intensities.
(A) Measure maximum intensity of P body and average intensity of cytoplasm. (B) Measure size of P body by drawing a line across the P body and measure the full width at half maximum intensity (FWHM). (C) The correction curve relates size of P body to the fraction of true maximum intensity measured in the image as indicated by the red line. (D) Three standard curves generated by different concentrations of GFP solutions correspond to three different imaging settings. (E) Partition coefficient is the ratio of P body concentration to cytoplasm concentration.
Figure 1—figure supplement 3
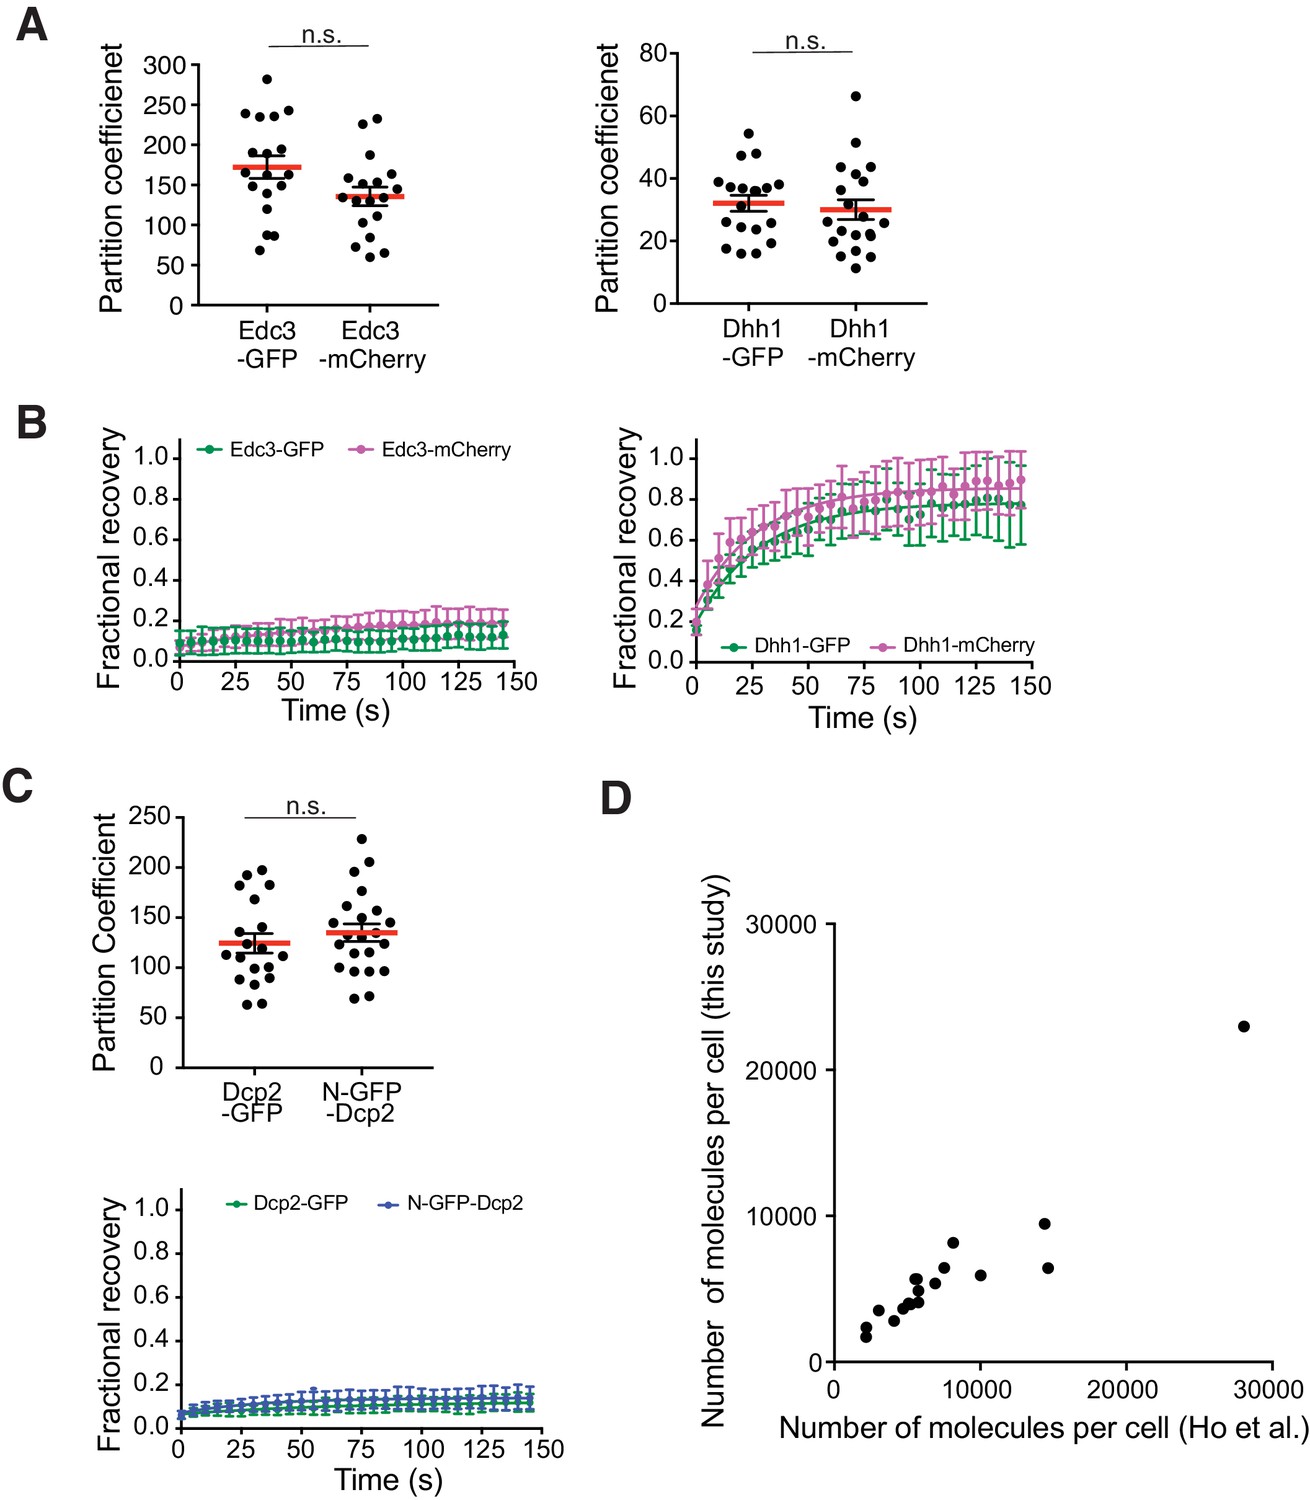
Verification of quantitative measurements.
(A) A C-terminal GFP tag does not affect protein partitioning into P bodies. Plots show PCs (black dots) and mean values (red lines)± SEM when Edc3 and Dhh1 tagged at their C-termini with either GFP or mCherry. Each dot represents an individual P body in one cell. 18–20 cells were analyzed. Significance was calculated using the Wilcoxon rank-sum test. (B) A C-terminal GFP tag does not affect protein dynamics. Recovery curve of C-terminal GFP- or mCherry-tagged Edc3 and Dhh1 as an average of 20 P bodies ± SD. (C) Location of the GFP tag does not affect partitioning or dynamics of Dcp2. Dcp2 was tagged with GFP at either its N- (N-GFP-Dcp2) or C-terminus (Dcp2-GFP). Top: PCs (black dots) and mean values (red lines)± SEM. Significance was calculated by Wilcoxon rank-sum test. Bottom: recovery curve as an average of 20 P bodies ± SD. (D) Comparison of protein abundance (molecules per cell) measured in this study to previous unified database (Ho et al., 2018).
Figure 2 with 4 supplements
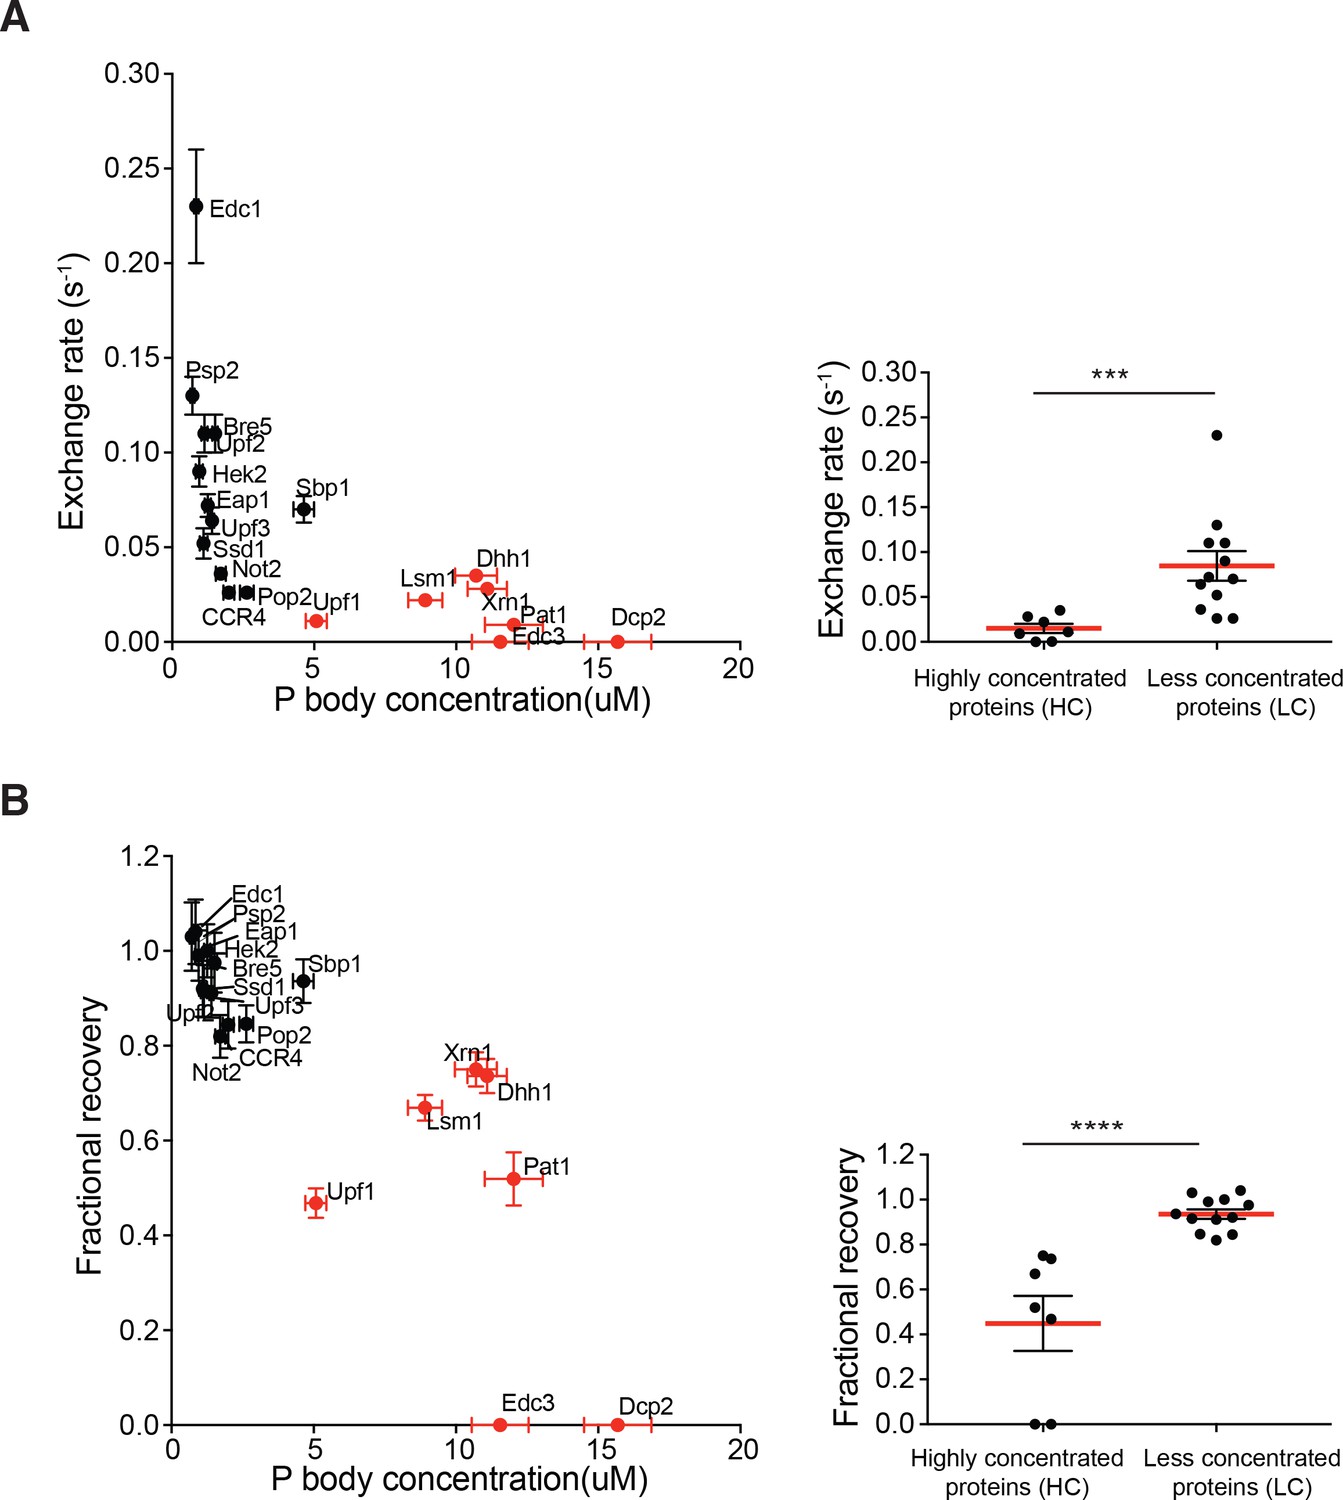
Highly concentrated proteins tend to have slow dynamics.
Exchange rate (A) or fractional recovery (B) was plotted as a function of absolute concentrations in P bodies, respectively (mean ± SEM). HC and LC proteins are indicated by red and black symbols, respectively. Graphs on the right show averaged exchange rate or fractional recovery (red lines) in HC and LC groups. Analysis of significance was calculated by Wilcoxon rank-sum test. *** and **** indicate p values less than 0.001 and 0.0005, respectively.
Figure 2—figure supplement 1
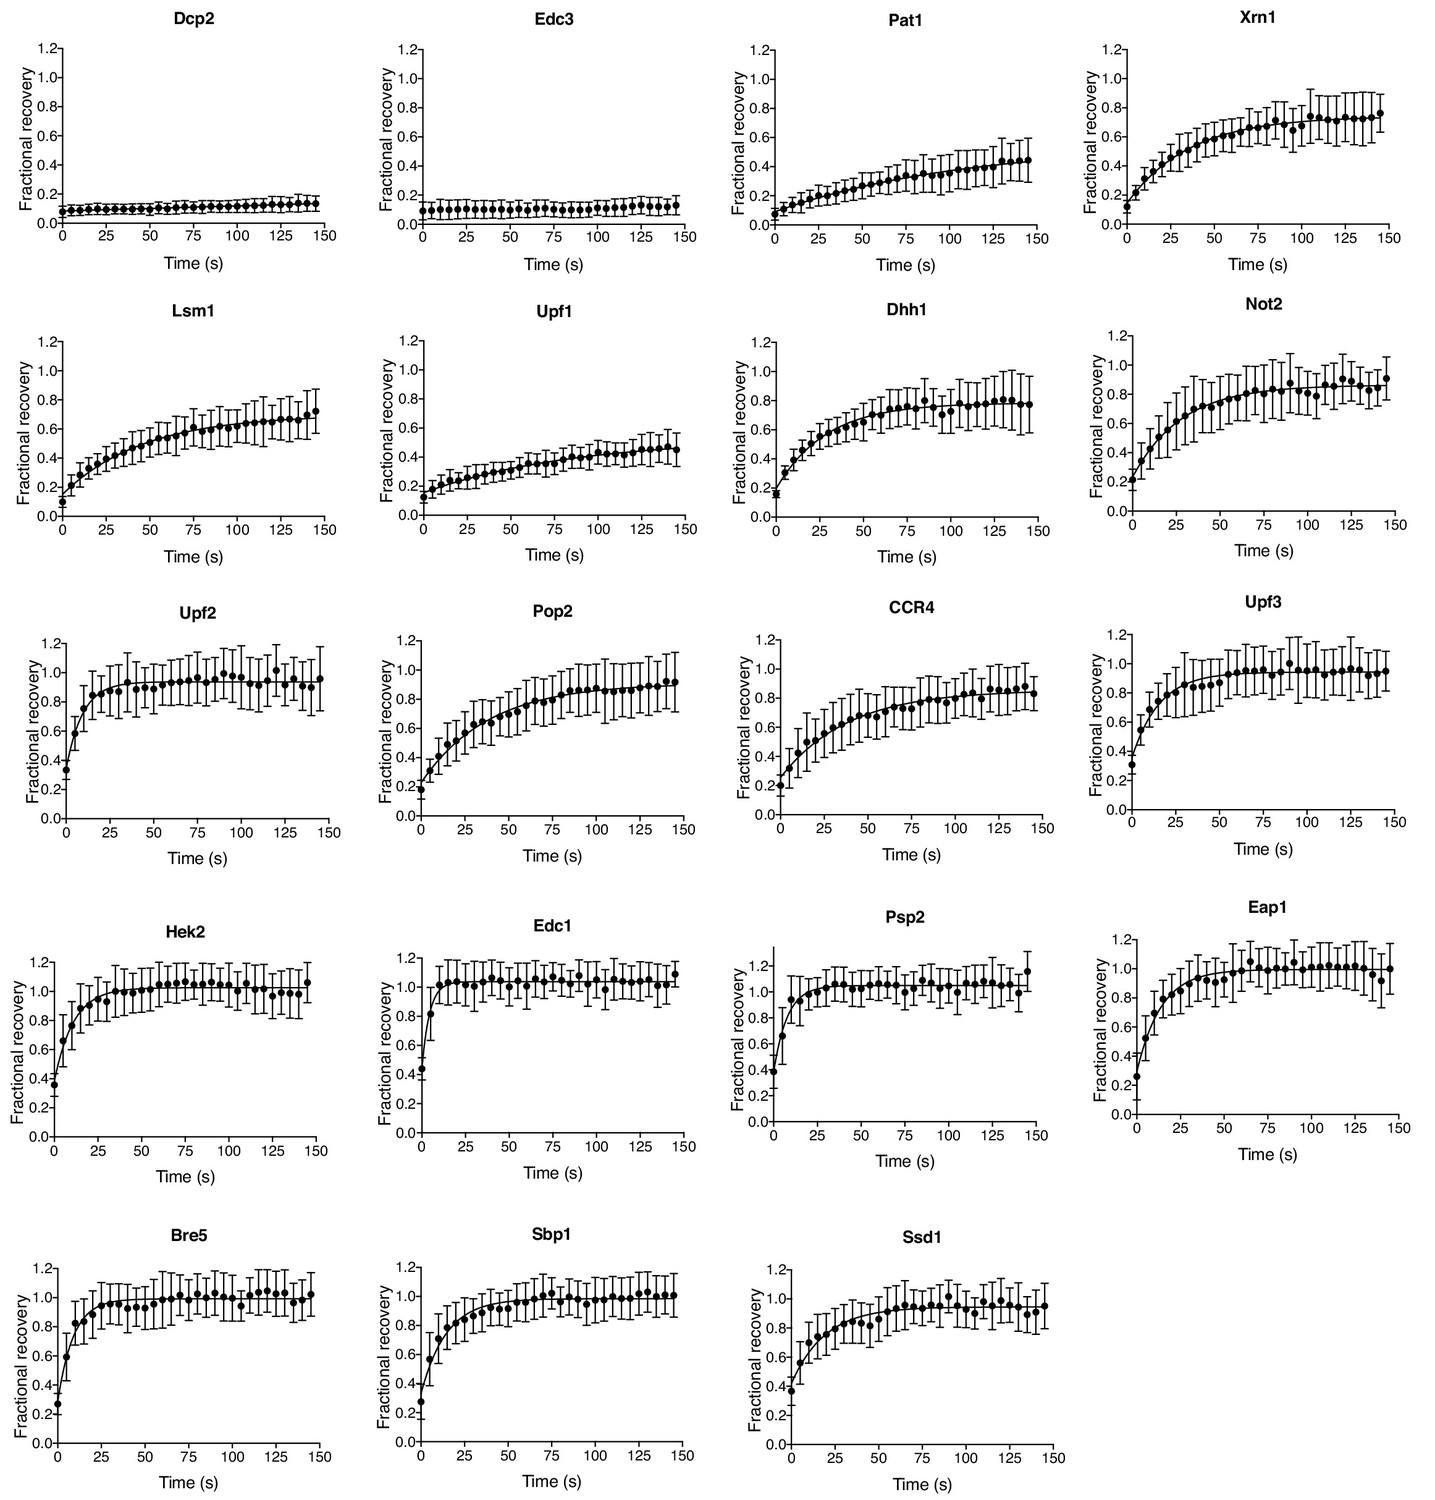
FRAP recovery curves of 19 P body proteins.
FRAP recovery curves of 19 P body proteins reported as average of 16–25 P bodies ± SD.
Figure 2—figure supplement 2
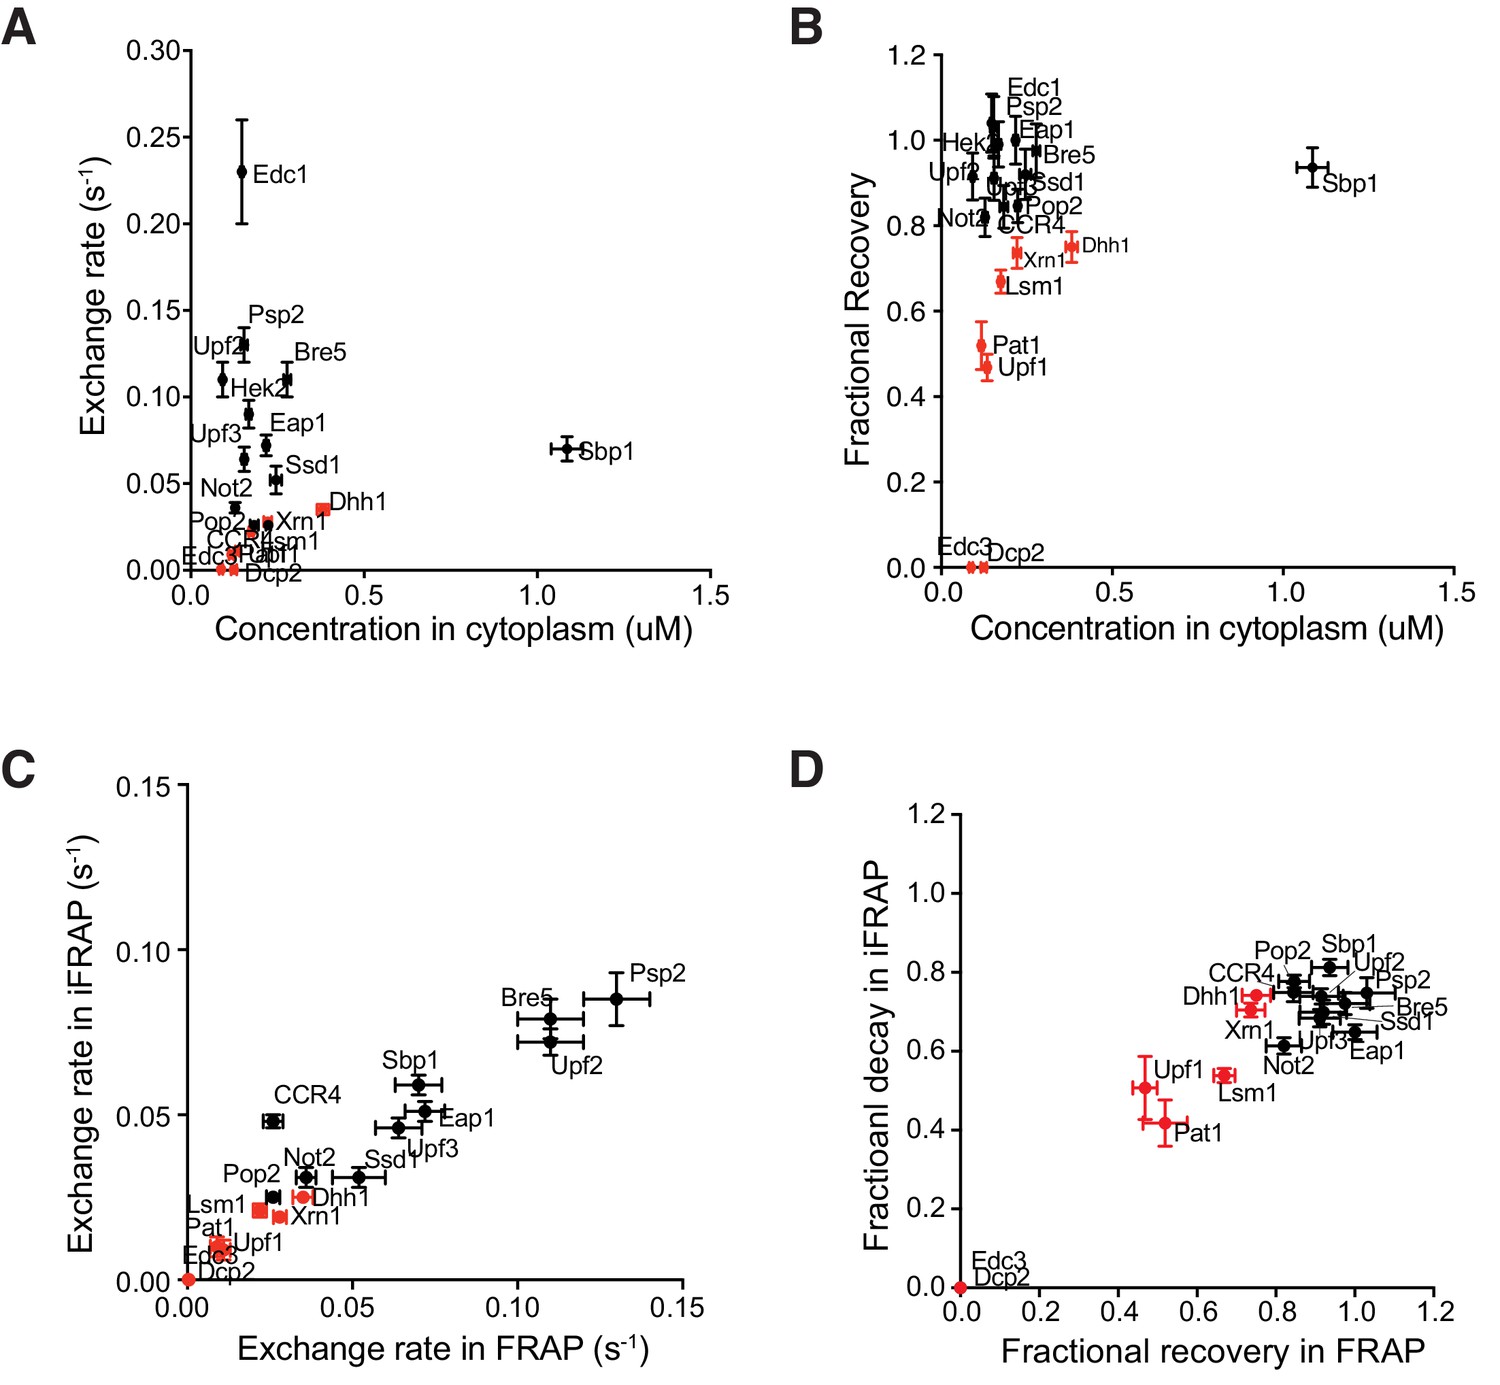
Slow dynamics are not caused by smaller fluorescence pool in cytoplasm.
(A/B) Exchange rate (A) or fractional recovery (B) is not correlated with protein concentrations in cytoplasm. Exchange rate or fractional recovery (mean ± SEM) were plotted as a function of absolute concentrations in cytoplasm (mean ± SEM), respectively. HC and LC proteins are indicated by red and black symbols, respectively. (C/D) Exchange rate (C) or fractional decay (D) measured by iFRAP (16–20 cells measured for each protein) are qualitatively similar to values measured using FRAP. The fractional decay of more rapidly exchanging proteins measured by iFRAP is systematically smaller than measured using FRAP due to the longer time to bleach the whole cytoplasm in the former experiments. HC and LC proteins are indicated by red and black symbols, respectively. Pearson correlation coefficients were calculated in Prism (GraphPad).
Figure 2—figure supplement 3
Partitioning and dynamics of P body proteins in wild type strains under glucose starvation are qualitatively similar to dcp1Δ strains.
(A/B) Partition coefficients (A) or absolute concentrations (B) in P bodies in wild type strains under 30–60 min glucose starvation. Plots show PC values, and absolute concentrations in P bodies (black dots) and mean values (red lines)± SEM. Each dot represents an individual P body in one cell. We analyzed 20–30 cells for each protein. Left, proteins found in both wild type and dcp1Δ strains ordered by their PC in dcp1Δ strains. Right, proteins only found in P bodies in wild type strains. (C/D) Exchange rate (C) or fractional recovery (D) was plotted as a function of absolute concentrations in P bodies (mean ± SEM). HC and LC proteins are indicated by red and black symbols, respectively.
Figure 2—figure supplement 4
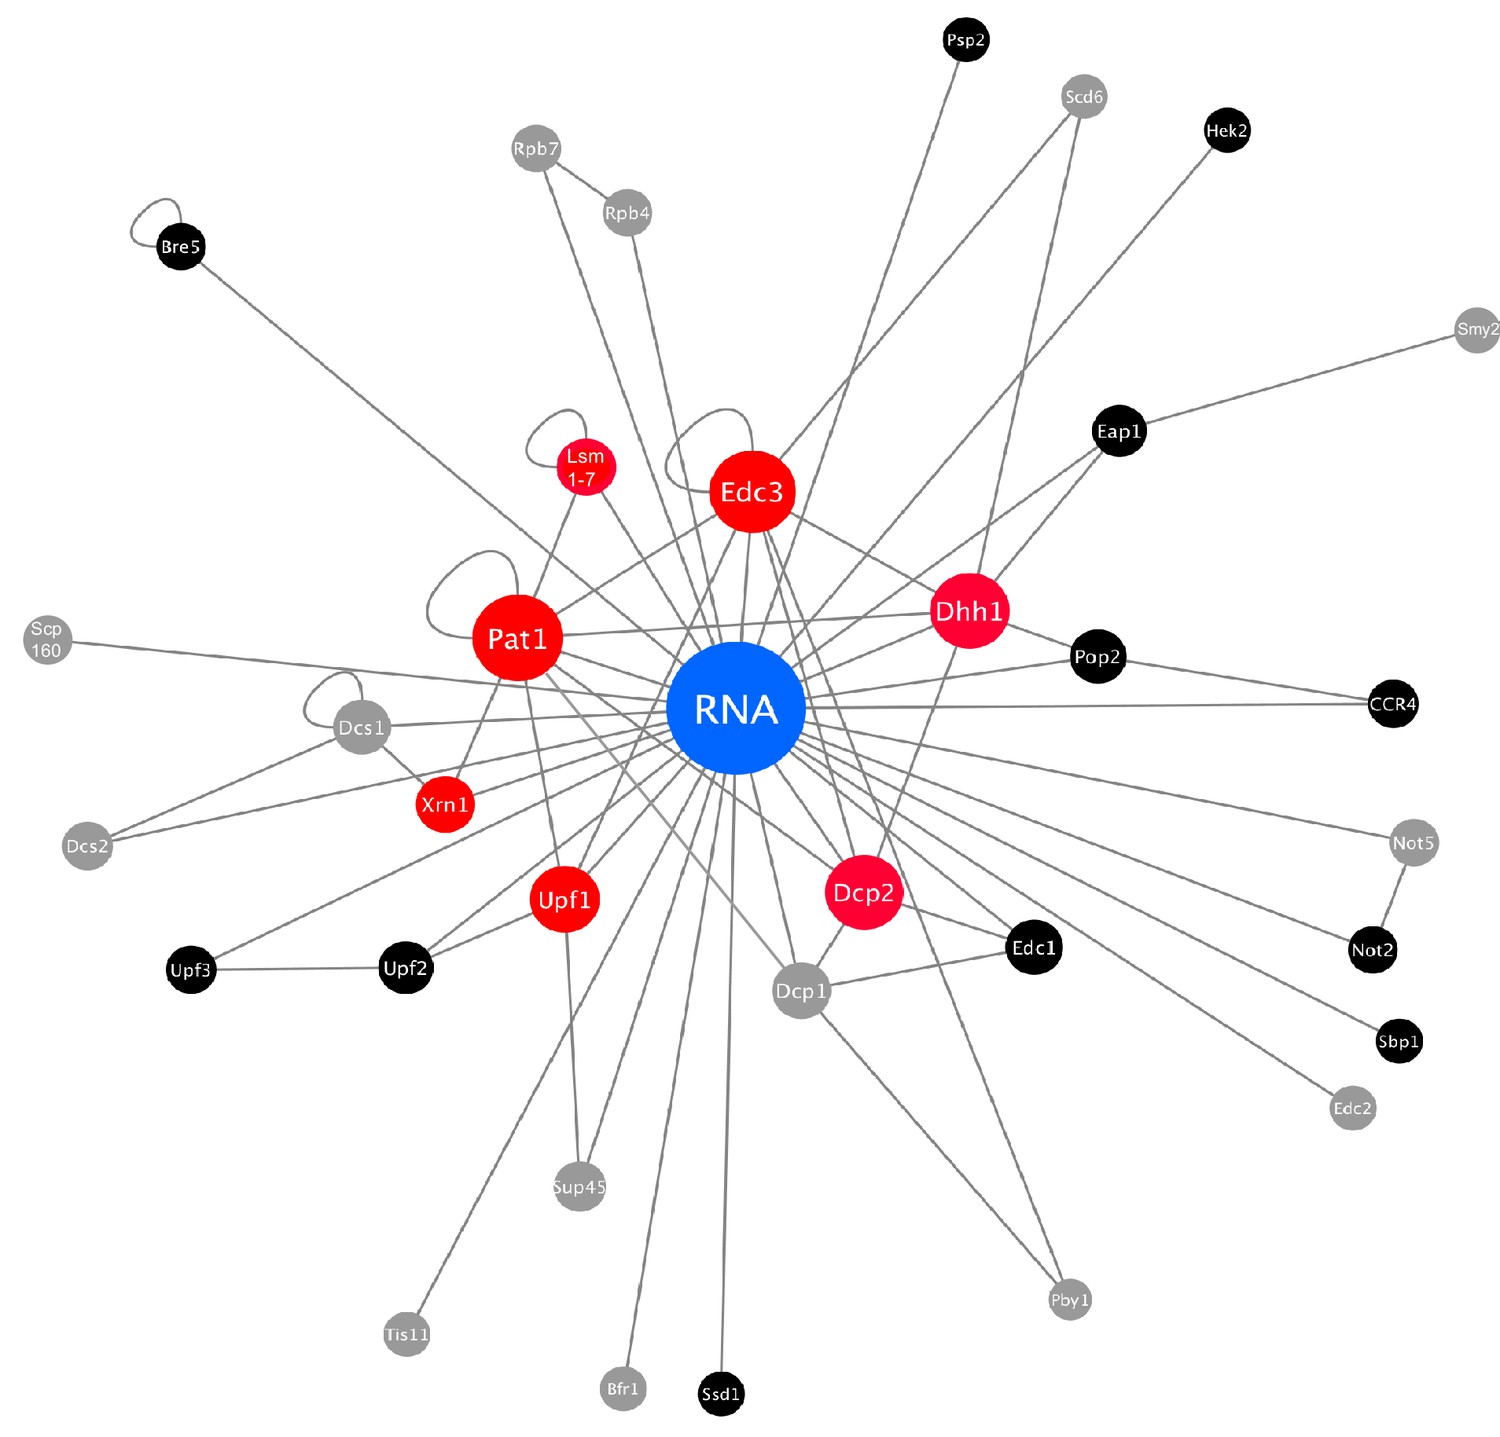
Protein-protein and protein-RNA connections among regular P body proteins.
Protein-protein and protein-RNA interactions are summarized from literatures as shown in Supplementary file 3. Red, HC P body proteins. Black, LC P body proteins. Grey, 12 P body proteins that lacked clear punctate localization in our studies. Size of node and distance of other nodes to RNA node reflect its centrality.
Figure 3
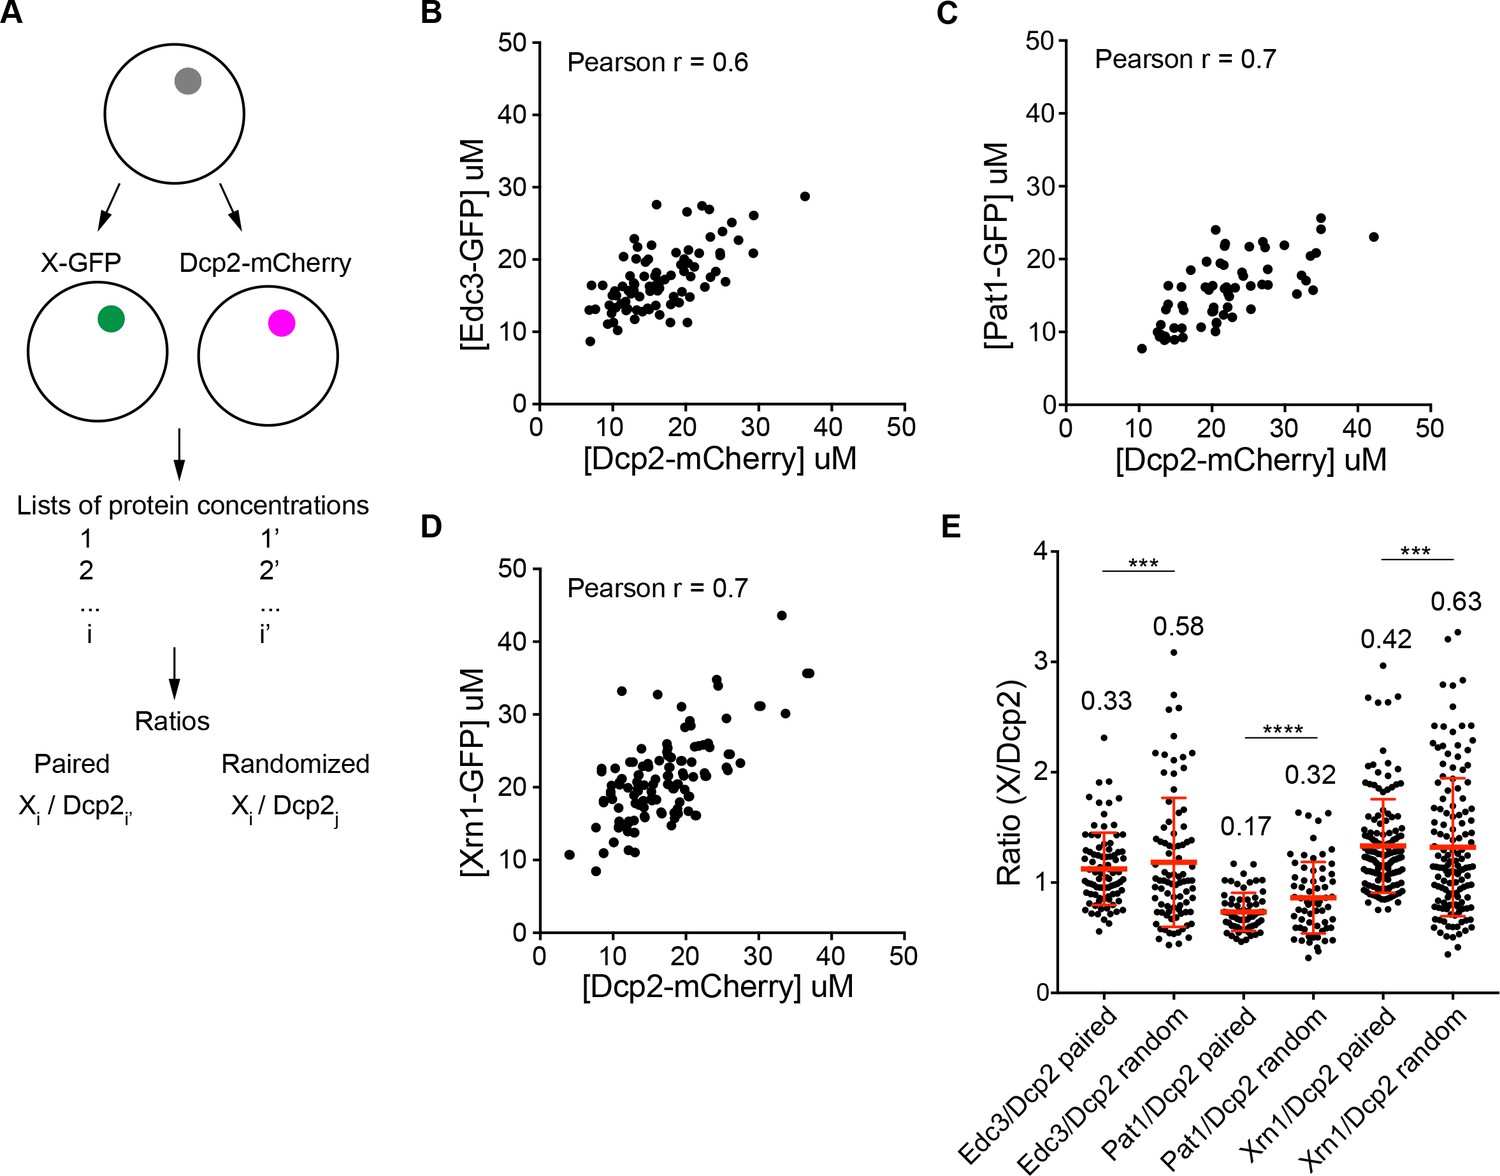
Partitioning of proteins into P bodies is correlated.
(A) Schematics of calculations of ratios of paired and randomized proteins. Paired ones are ratios of X-GFP to Dcp2-mCherry in the same P bodies where i = i’. Randomized pairing are achieved by randomly generating i and j in Excel where i ≠ j. The sample size is kept the same as paired ones. (B/C/D) Concentrations of Edc3 and Dcp2 (B), Pat1 and Dcp2 (C), and Xrn1 and Dcp2 (D) are correlated in P bodies. Each dot represents one P body in a cell, 86 cells (B), 64 cells (C), and 135 cells (D) were analyzed. Pearson correlation coefficients were calculated in Prism (GraphPad ). (E) Ratios of paired proteins have tighter ranges than ratios when randomizing pairing. Plots show ratios (black dots) and mean values ± standard deviation (red lines), values are shown. Fligner-Killeen test was used to test equality of variance in R. ***, p<0.001, ****, p<0.0005.
Figure 4 with 1 supplement
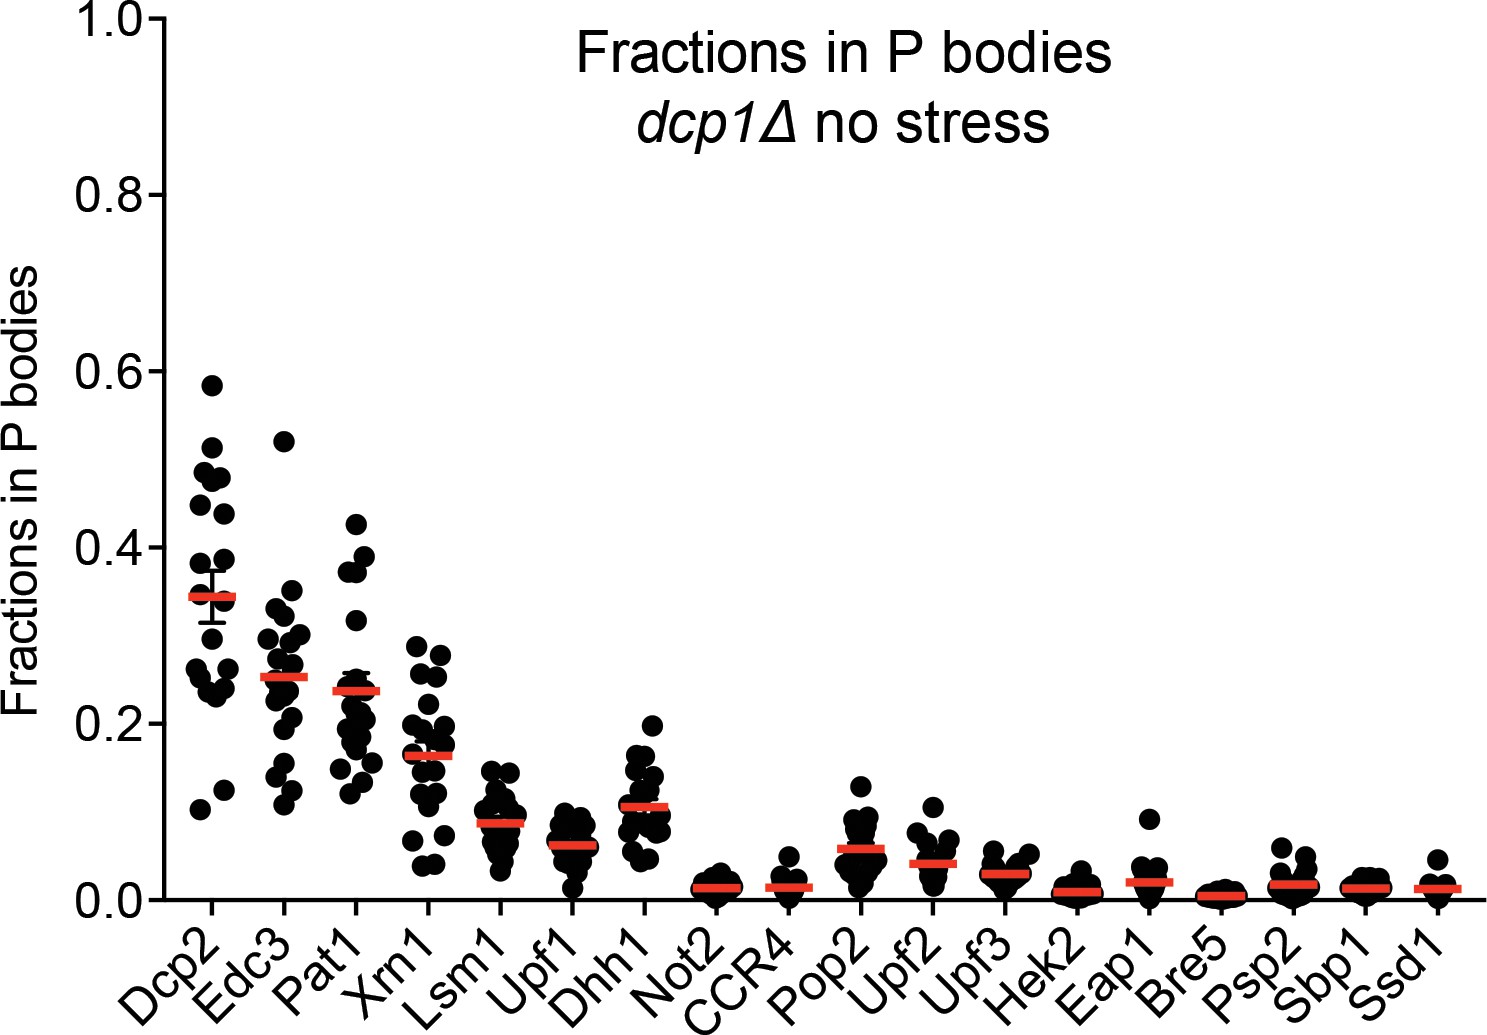
P bodies do not strongly sequester their resident proteins.
Plots show fractions in visible P bodies (black dots) and mean values (red lines)± SEM in mid-log phase without any cellular stress. Each dot represents fraction of protein in visible P bodies corresponding to an individual cell. 16–25 cells were analyzed for each protein.
Figure 4—figure supplement 1
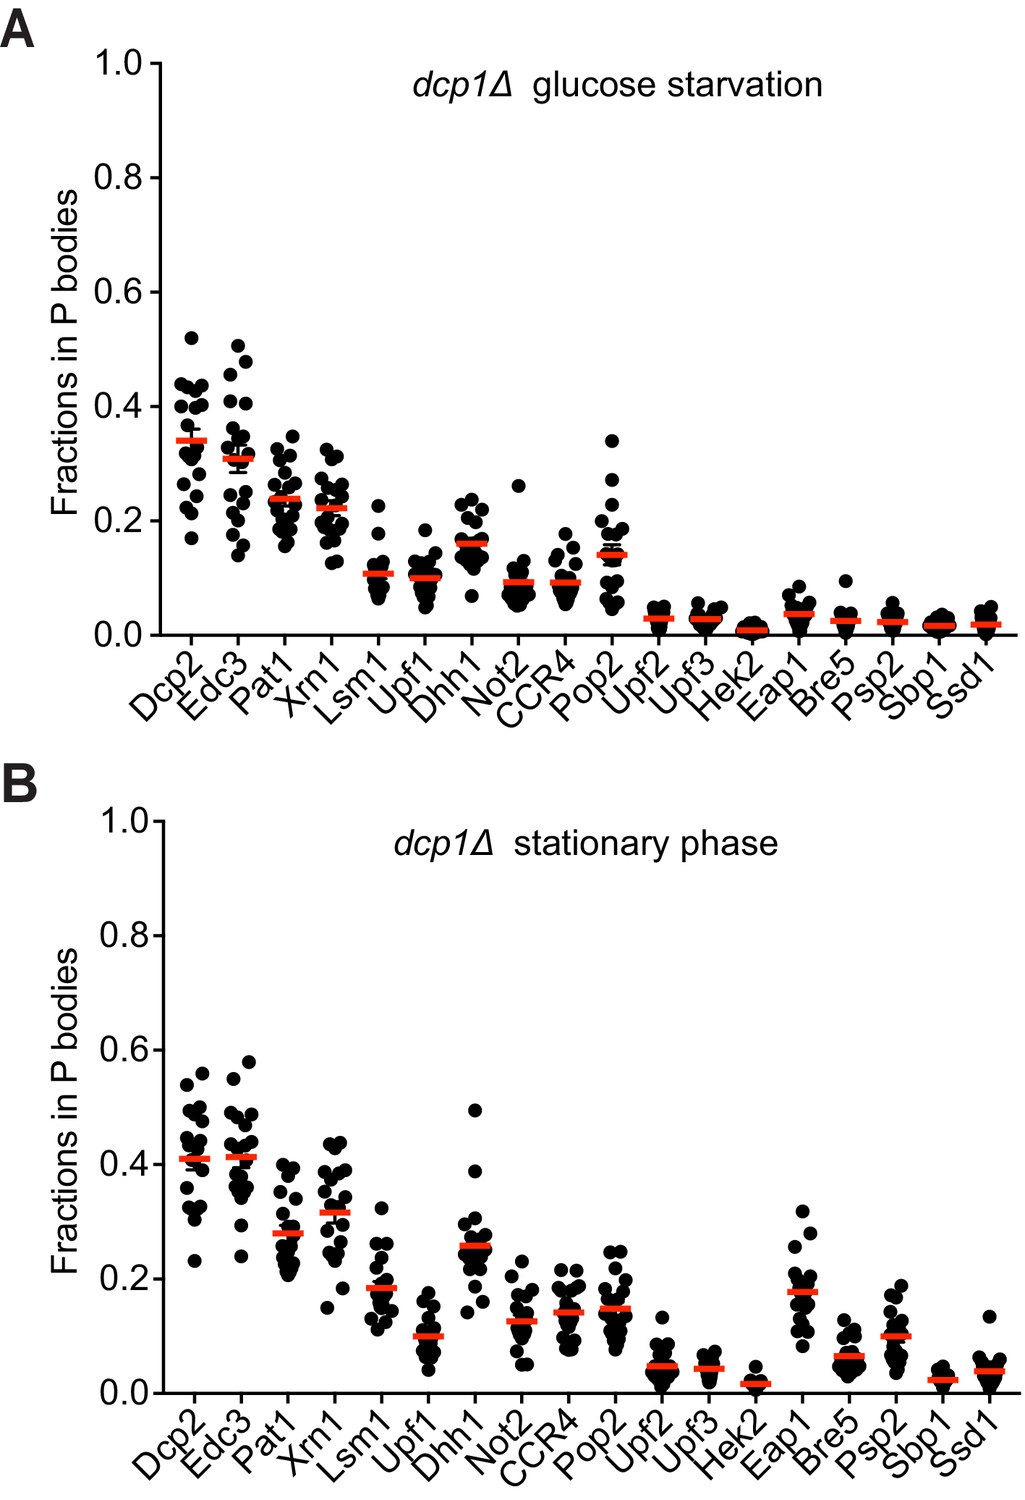
P bodies do not strongly sequester their resident proteins.
(A) Fractions of total protein localized to P bodies (black dots) and mean values (red lines)± SEM in dcp1Δ strains. Cells were grown to mid-log phase followed by 4 hr glucose starvation. (B) Fractions of total protein localized to P bodies (black dots) and mean values (red lines)± SEM in dcp1Δ strains in stationary phase. In A and B, each dot corresponds to an individual cell, and 20 cells were analyzed for each protein.
Figure 5 with 1 supplement
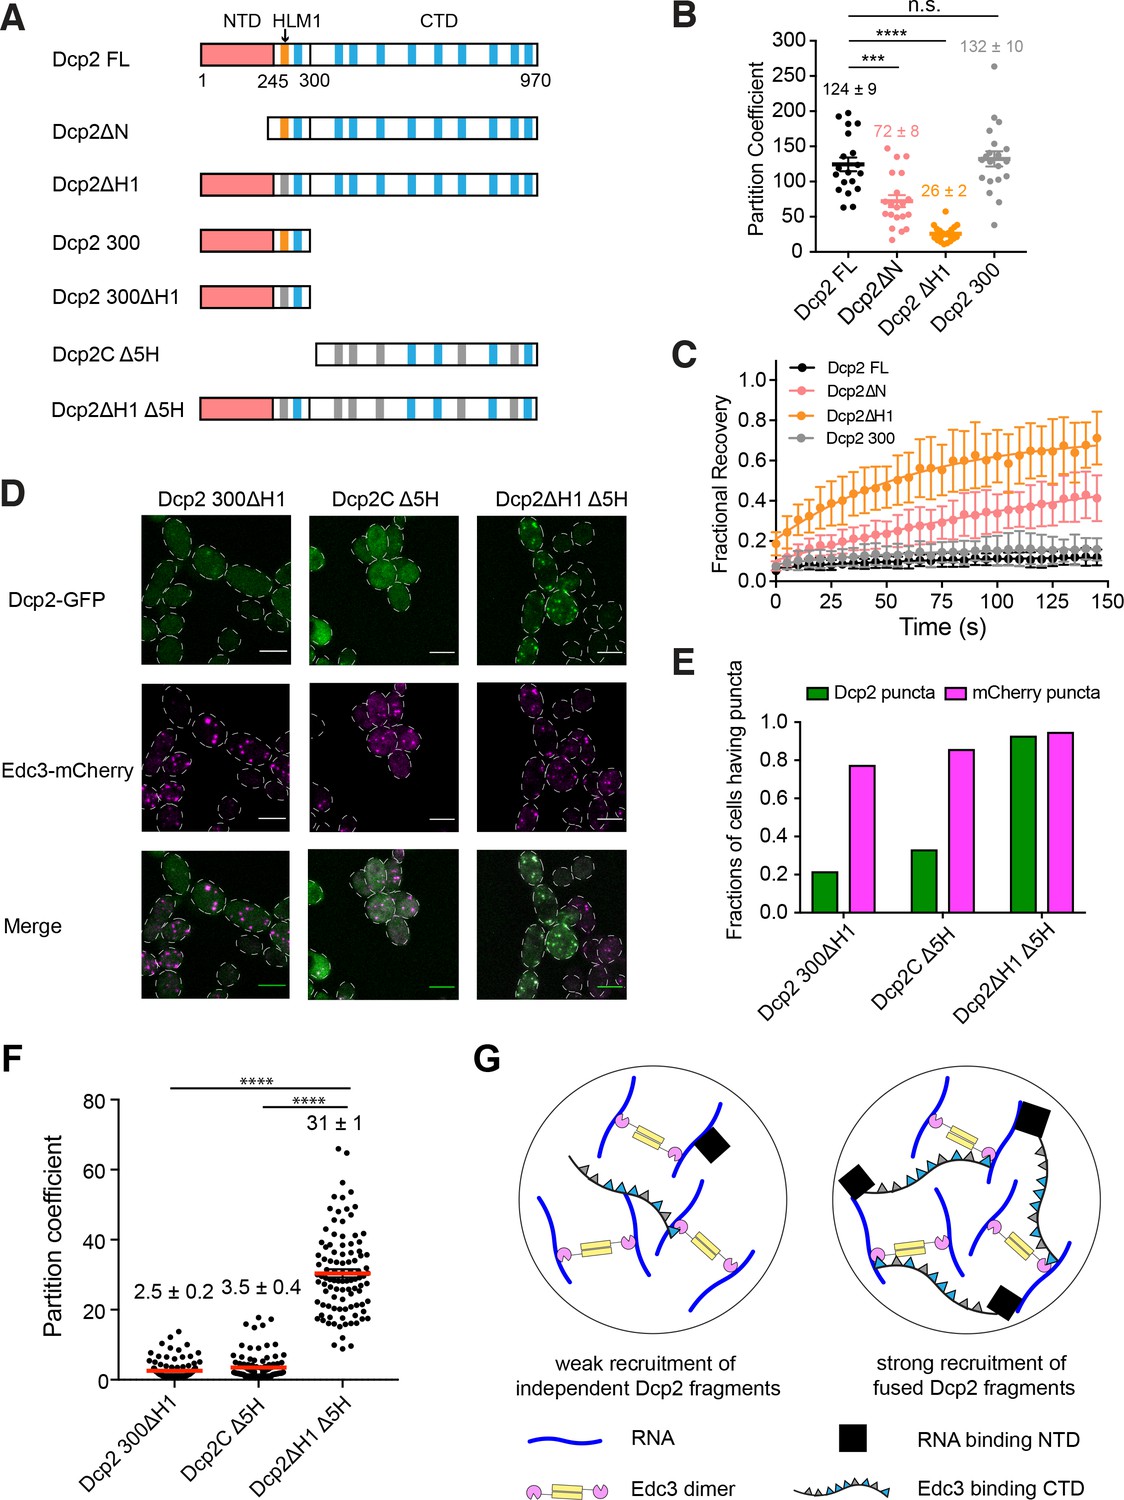
Elements controlling Dcp2 partitioning and dynamics are distributed across the protein, and contribute to specific recruitment to biomolecular condensates.
(A) Schematics of domain architecture of Dcp2 FL and mutants. Red, N-terminal domain (NTD). Orange, HLM1. Blue, other 10 HLMs in C-terminal domain. Grey, inactivated HLMs. (B/C) Partition coefficients (B) and dynamics (C) of GFP tagged Dcp2 FL (black), Dcp2ΔN (red), Dcp2 ΔH1 (orange), and Dcp2 300 (grey) in dcp1Δdcp2Δ strain. One P body per cell was analyzed from 19 cells. PCs are shown as mean values (bold lines)± SEM (B). Recovery curves are shown as average of 19 P bodies ± SEM (C). Significance was calculated by the Wilcoxon rank-sum test. *** and **** indicate p values less than 0.001 and 0.0005, respectively. (D) Representative images showing dcp1Δdcp2Δ yeast strains expressing GFP tagged Dcp2 300 ΔH1, Dcp2C Δ5H and Dcp2ΔH1 Δ5H. Edc3-mCherry was also expressed as a P body marker. Scale bar, 5 µm. (E) Fractions of cells exhibiting puncta formed by each mutant. n(Dcp2 300 ΔH1)=163, n(Dcp2C Δ5H)=188, n(Dcp2ΔH1 Δ5H)=204. (F) Partition coefficients of GFP-tagged Dcp2 300 ΔH1, Dcp2C Δ5H and Dcp2ΔH1 Δ5H, and mean values (red lines)± SEM. 100 P bodies were analyzed. Significance was calculated by the Wilcoxon rank-sum test. **** indicates p values less than 0.0005. (G) Specific recruitment to P bodies can be achieved by distributing elements across Dcp2, even when they recognize distinct ligands within a condensate.
Figure 5—figure supplement 1
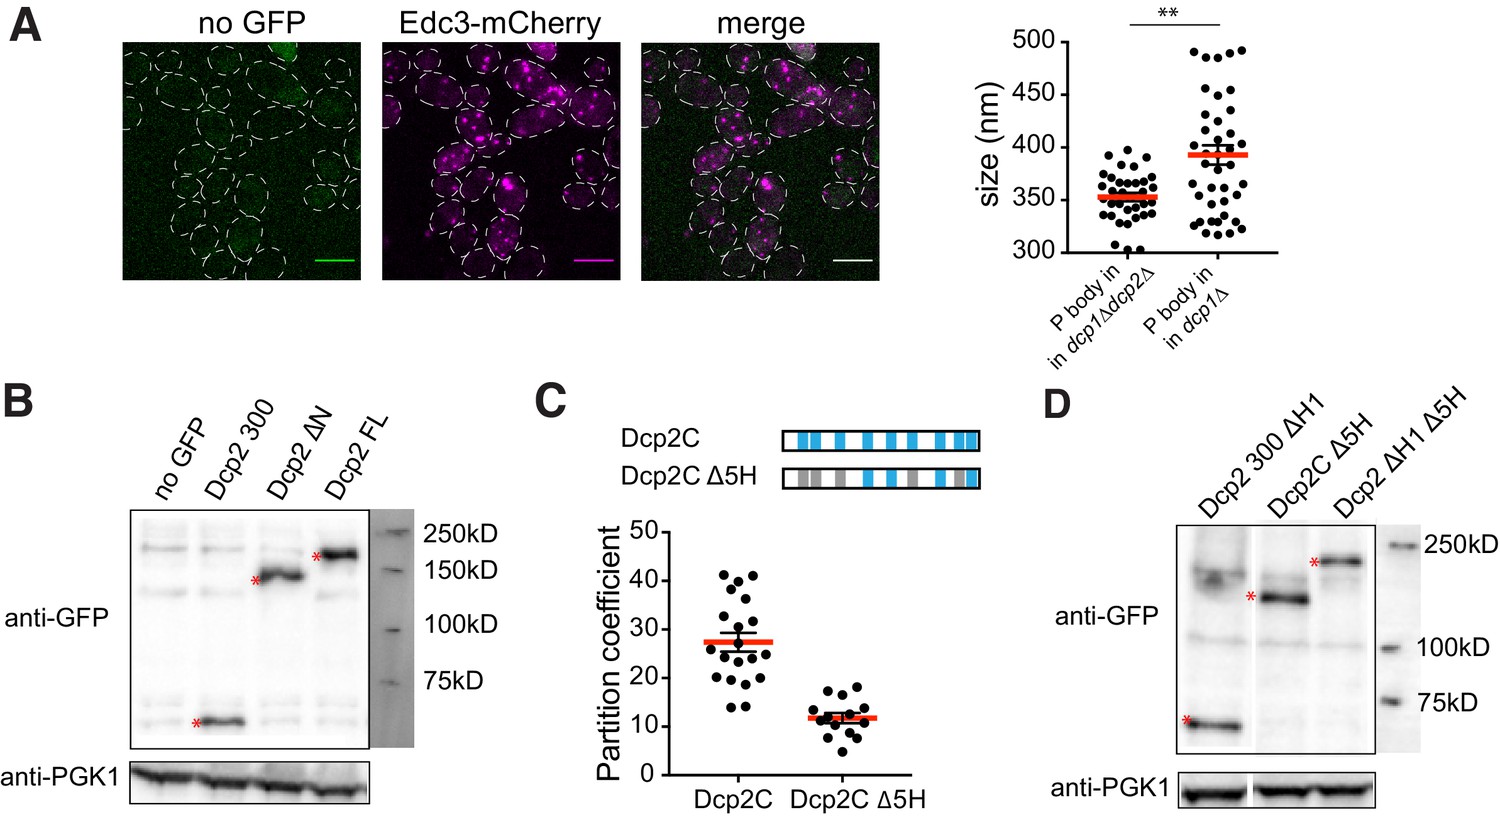
Partitioning of Dcp2 variants.
(A) Representative images of dcp1Δdcp2Δ yeast expressing Edc3-mCherry as a P body marker. Scale bar, 5 µm. Plot shows size of P body in dcp1Δdcp2Δ (n = 34) and dcp1Δ strains (n = 40)± SEM. (B) Western blot of Dcp2 FL, Dcp2 300, and Dcp2 ΔN in dcp1Δdcp2Δ strain shows that they expressed at similar levels. (C) Dcp2C Δ5H partitions into P bodies more weakly than Dcp2C in dcp1Δdcp2Δ yeast. PCs of Dcp2C (n = 20), and Dcp2C Δ5H (n = 14), and mean values (red lines)± SEM. (D) Western blot of Dcp2 300 ΔH1, Dcp2C Δ5H and Dcp2ΔH1 Δ5H in dcp1Δdcp2Δ strain shows that they expressed at similar levels.
Figure 6 with 1 supplement

Partitioning of Dcp2 into P bodies can be saturated.
(A) Schematics of domain architecture of Dcp2 FL, Dcp2 FL-H1, Dcp2C Δ5H, and Dcp2C Δ5H-H1. (B) Representative images showing dcp1Δdcp2Δ yeast strains expressing GFP tagged Dcp2 FL, Dcp2 FL-H1, Dcp2C Δ5H, and Dcp2C Δ5H-H1, with Edc3-mCherry co-expressed as a P body marker. Scale bar, 5 µm. (C/D) P body concentrations/PCs of Dcp2 FL (n = 49), Dcp2 FL-H1 (n = 79), Dcp2C Δ5H (n = 63), and Dcp2C Δ5H-H1 (n = 52), and mean values (red lines)± SEM.
Figure 6—figure supplement 1
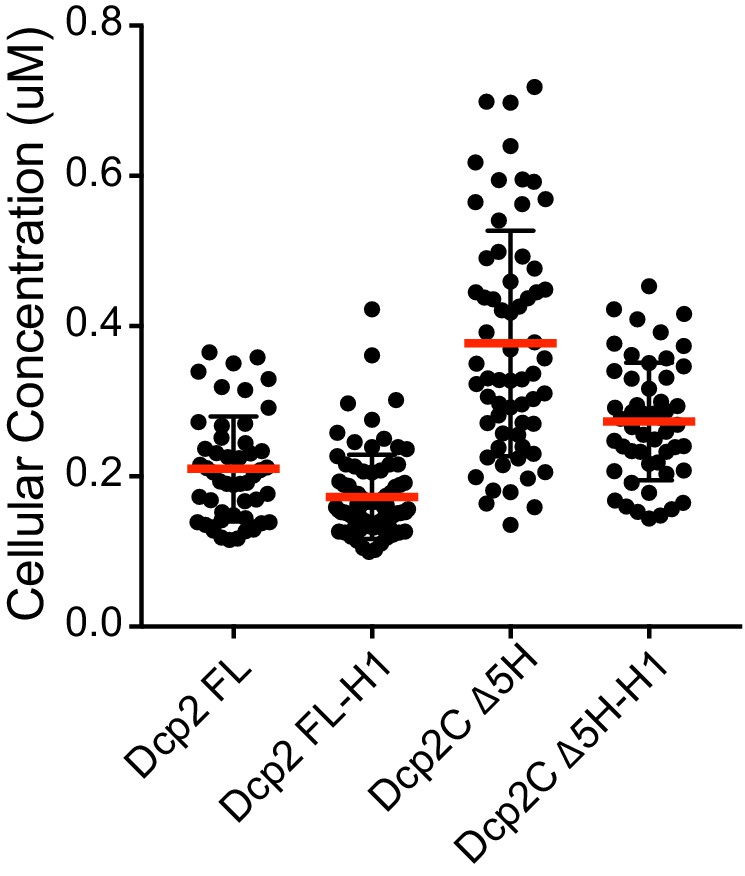
Average cellular concentrations of Dcp2 FL, Dcp2 FL-H1, Dcp2C Δ5H, and Dcp2C Δ5H-H1 in dcp1Δdcp2Δ strain expressing Edc3-mCherry, and mean values (red lines)± SD.
Figure 7 with 1 supplement

RNA binding and turnover affect Dcp2 partitioning and dynamics.
(A) Schematics of domain architecture of Dcp2 300, Dcp2 300 AAAA, Dcp2ΔH1 and Dcp2ΔH1 WD. (B) Representative images of dcp1Δdcp2Δ yeast strain expressing GFP tagged Dcp2 300 and Dcp2 300 AAAA. Scale bar, 5 µm. (C) Representative images of dcp2Δ yeast strain expressing GFP tagged Dcp2ΔH1 and Dcp2ΔH1 WD under normal and glucose starvation conditions. Scale bar, 5 µm. (D) Inhibition of RNA turnover promotes P body formation. Number of P bodies formed by Dcp2ΔH1 (blue, n = 115) and Dcp2ΔH1 WD (red, n = 91) under normal conditions, Dcp2ΔH1 (light blue, n = 119) and Dcp2ΔH1 WD (light red, n = 144) under 30–60 min glucose starvation. (E) Inhibition of RNA turnover promotes more Dcp2ΔH1 to partition into P bodies. Total fractions of Dcp2ΔH1(blue, n = 20) and Dcp2ΔH1 WD (red, n = 20) without stress, and Dcp2ΔH1(light blue, n = 23) and Dcp2ΔH1 WD (light red, n = 32) with glucose starvation, in P bodies. Numbers show mean values ± SEM. Significance was calculated by the Wilcoxon rank-sum test. ****, p<0.0005 (F) Inhibition of RNA turnover slows Dcp2ΔH1 exchange rate by increasing amount of RNA. Top, FRAP recovery curves of Dcp2ΔH1 (blue, n = 20) and Dcp2ΔH1 WD (red, n = 20) without stress. Bottom, FRAP recovery curves of Dcp2ΔH1 (light blue, n = 23) and Dcp2ΔH1 WD (light red, n = 32) under glucose starvation.
Figure 7—figure supplement 1
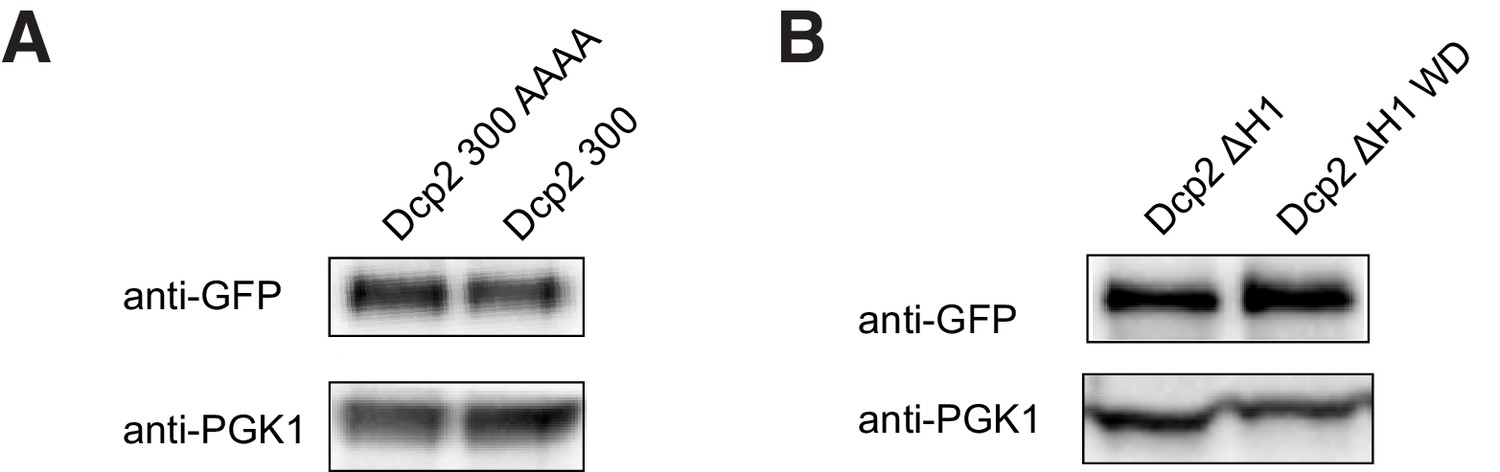
Mutant Dcp2 proteins express at similar levels.
(A) Western blot of Dcp2 300 and Dcp2 300 AAAA in dcp1Δdcp2Δ strain shows that they expressed at similar levels. (B) Western blot of Dcp2ΔH1 and Dcp2ΔH1 WD in dcp2Δ strain shows that they expressed at similar levels.
Additional files
-
Supplementary file 1
Yeast strains used in this study.
- https://cdn.elifesciences.org/articles/56525/elife-56525-supp1-v2.xlsx
-
Supplementary file 2
Dynamics and partitioning of P body proteins.
- https://cdn.elifesciences.org/articles/56525/elife-56525-supp2-v2.docx
-
Supplementary file 3
Protein-Protein and Protein-RNA interactions among P body proteins.
- https://cdn.elifesciences.org/articles/56525/elife-56525-supp3-v2.xlsx
-
Supplementary file 4
Plasmids used in this study.
- https://cdn.elifesciences.org/articles/56525/elife-56525-supp4-v2.xlsx
-
Transparent reporting form
- https://cdn.elifesciences.org/articles/56525/elife-56525-transrepform-v2.docx
Download links
A two-part list of links to download the article, or parts of the article, in various formats.
Downloads (link to download the article as PDF)
Open citations (links to open the citations from this article in various online reference manager services)
Cite this article (links to download the citations from this article in formats compatible with various reference manager tools)
A quantitative inventory of yeast P body proteins reveals principles of composition and specificity
eLife 9:e56525.
https://doi.org/10.7554/eLife.56525


