Cytotoxic T cells swarm by homotypic chemokine signalling
- EMBL Australia, Single Molecule Science node, University of New South Wales, Australia
- School of Medical Sciences, Faculty of Medicine, University of New South Wales, Australia
- Sydney Medical School, The University of Sydney, Australia
- The Walter and Eliza Hall Institute of Medical Research, Australia
- Department of Medical Biology, University of Melbourne, Australia
- Children's Cancer Research Unit, The Children's Hospital at Westmead, Australia
- The Kirby Institute for Infection and Immunity in Society, UNSW, Australia
- Neuroscience Research Australia (NeuRA), Australia
- Department of Statistics and Actuarial Science, University of Waterloo, Canada
- Discipline of Child and Adolescent Health, University of Sydney, Australia
- Biofab3D, St. Vincent’s Hospital, Australia
- Institute for Innovation in Mental and Physical Health and Clinical Translation (iMPACT), School of Medicine, Deakin University, Australia
- Advanced Biomaterials Lab, Research School of Engineering, ANU, Australia
- School of Computer Science, Westmead Initiative, and Charles Perkins Centre, University of Sydney, Australia
Figures
Figure 1 with 1 supplement
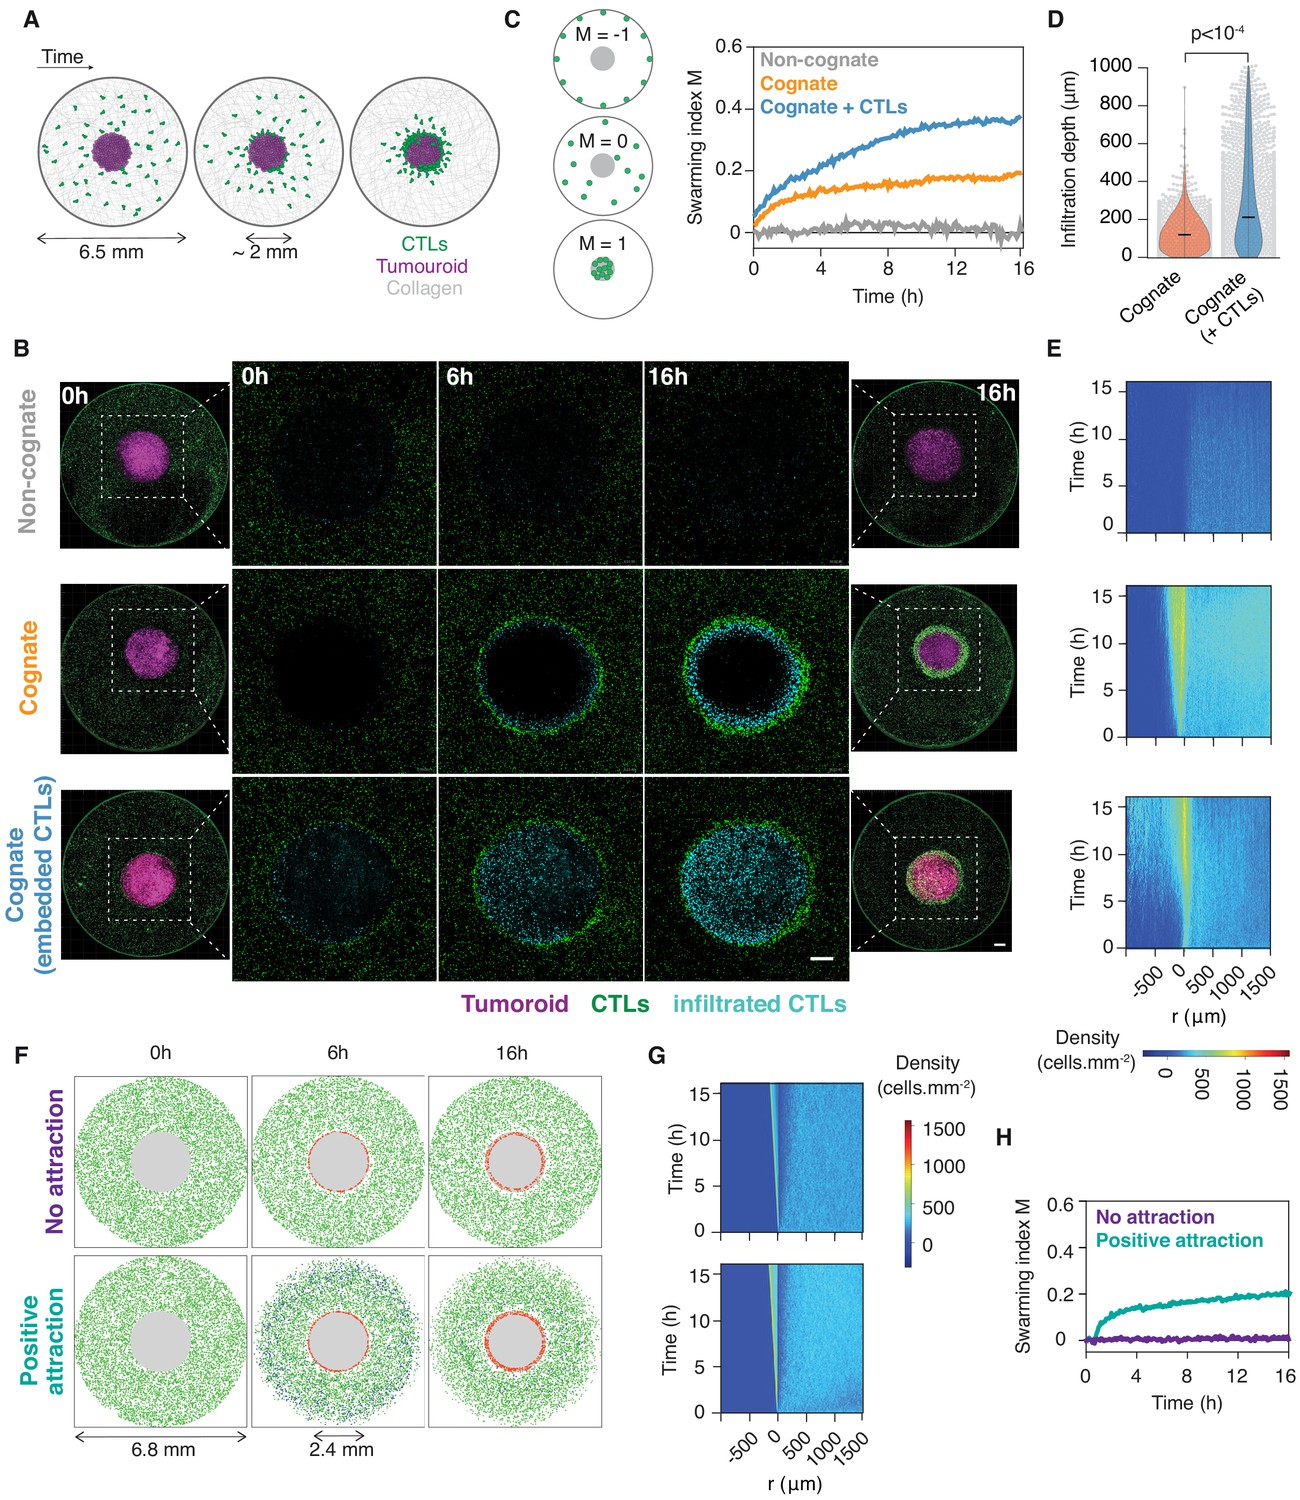
CTLs swarm as they attack tumour masses.
(A) Schematic of ex vivo tumouroid model: a high-density mass of tumour cells and collagen (tumouroid, magenta) is surrounded by a 3D collagen matrix containing dispersed CTLs (green) in a closed well with a 6.5 mm diameter and is imaged live over time. (B) Representative confocal images from three independent experiments showing CTLs responding to a non-cognate EL4 tumouroid (top), a cognate antigen-presenting tumouroid comprising EL4 pulsed with SIINFEKL (middle) or a cognate tumouroid pre-embedded with tumour-reactive CTLs (bottom). Insets show the proportion of CTL infiltrates for each condition as indicated. Scale bars: 500 μm. (C) Left: Schematic showing the swarming index ‘M’ that quantifies the evolution of CTL spatial distribution around the tumouroid over time. A value of −1 denotes perfect anti-swarming, that is all cells evenly distributed on the well perimeter; a value of 0 corresponds to a uniform distribution of CTLs outside the tumouroid; and all CTLs having infiltrated the tumouroid yields a value of 1. Right: Quantification of CTL convergence at the tumour masses shown in (B) via the swarming index. (D) Infiltration depth of CTLs into tumouroid (measured as shortest distance from tumouroid edge) for cognate tumouroids with and without pre-embedded tumour-reactive CTLs. Violin plots show the distribution of pooled data from three independent experiments, black bars represent medians, grey dots are individual data points. p-values from Mann Whitney U test. (E) Density kymographs depicting cell density over space and time for data shown in (B). r: distance from tumouroid edge. (F) In silico simulations of T cells surrounding a tumour mass (grey) as agent-based processes. No attraction: agents (green) reach the tumouroid by random non-directed movement only and remain within following contact (red). ‘Positive attraction’: agents arriving at the tumouroid (red) secrete chemoattractant that induces directional motility towards the tumouroid in surrounding agents within range (blue), which can revert to non-directed motility in excess chemoattractant concentration. (G, H) Swarming index and density kymographs for in silico simulations.
-
Figure 1—source data 1
Source data file for Figure 1.
- https://cdn.elifesciences.org/articles/56554/elife-56554-fig1-data1-v3.xlsx
Figure 1—figure supplement 1
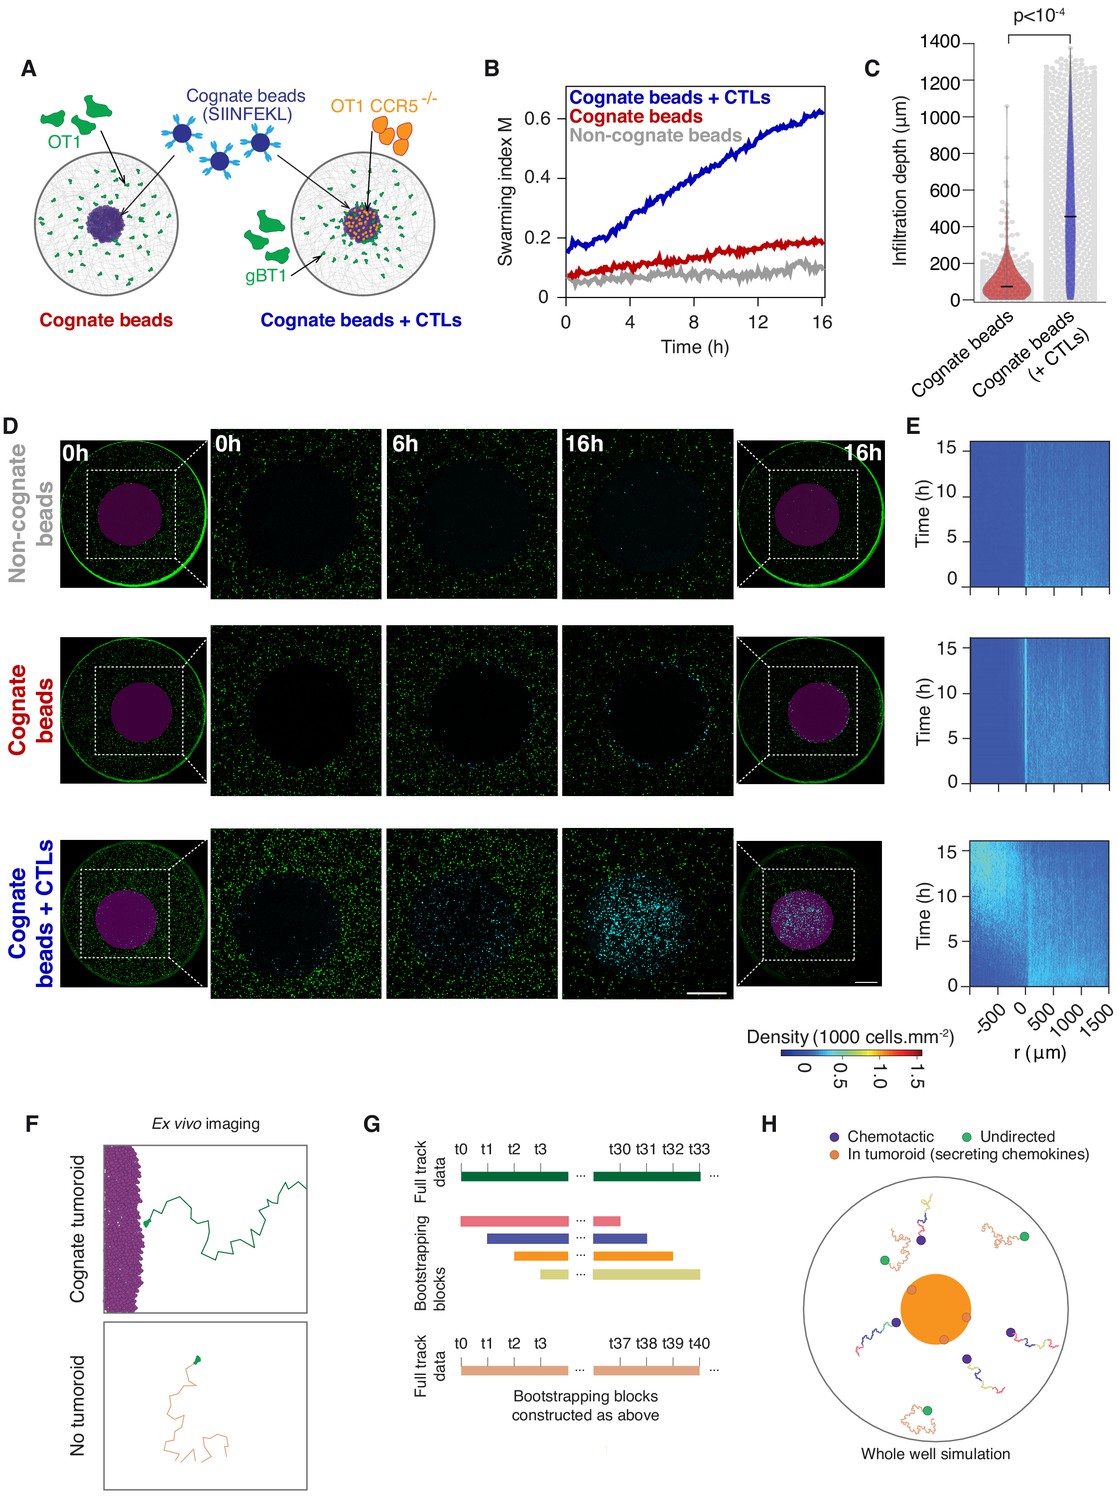
In silico model of CTL recruitment towards sites of tumour engagement.
(A) Schematic of bead tumouroid model: a high-density mass of collagen and beads blue, either uncoated or coated with cognate H-2Kb/SIINFEKL is surrounded by a 3D collagen matrix containing dispersed CTLs (green) in a closed well with a 6.5 mm diameter and is imaged live over time. If Ccr5-/- OT1 CTLs are embedded in the bead mass, then the surrounding CTLs are gBT1 (not cognate for the beads). (B) Quantification of CTL convergence at the tumour masses shown in (A) via the swarming index. (C) Infiltration depth of CTLs into bead masses with and without pre-embedded cognate CTLs. Violin plots show the distribution of pooled data from three independent experiments, black bars represent medians, grey dots are individual data points. p-values from Mann Whitney U test. (D) Representative confocal images from three independent experiments showing CTLs responding to a non-cognate bead mass (top), a cognate antigen-presenting bead mass (middle) or a cognate bead mass pre-embedded with Ccr5-/- cognate CTLs (bottom). Insets show the proportion of CTL infiltrates for each condition as indicated. Scale bars: 1 mm. (E) Density kymographs depicting cell density over space and time for data shown in (G). r: distance from tumouroid edge. (F) Principles of in silico modelling and simulations as agent-based processes of non-directed and chemotactic agent motility based on experimental setup of Figure 1B. Motility parameters are drawn from experiments in Figure 2A,B. (G) All tracks (only one full track shown) are decomposed into 10 min blocks of motility from which modelled agents sample (with replacement; ‘bootstrapping’) to construct their own motility. (H) Modelled chemotactic agents sample from CTL motility data with respect to the cognate tumouroid (as in F) and are reoriented towards the chemokine gradient they perceive.
-
Figure 1—figure supplement 1—source data 1
Source data file for Figure 1—figure supplement 1.
- https://cdn.elifesciences.org/articles/56554/elife-56554-fig1-figsupp1-data1-v3.xlsx
Figure 2 with 1 supplement
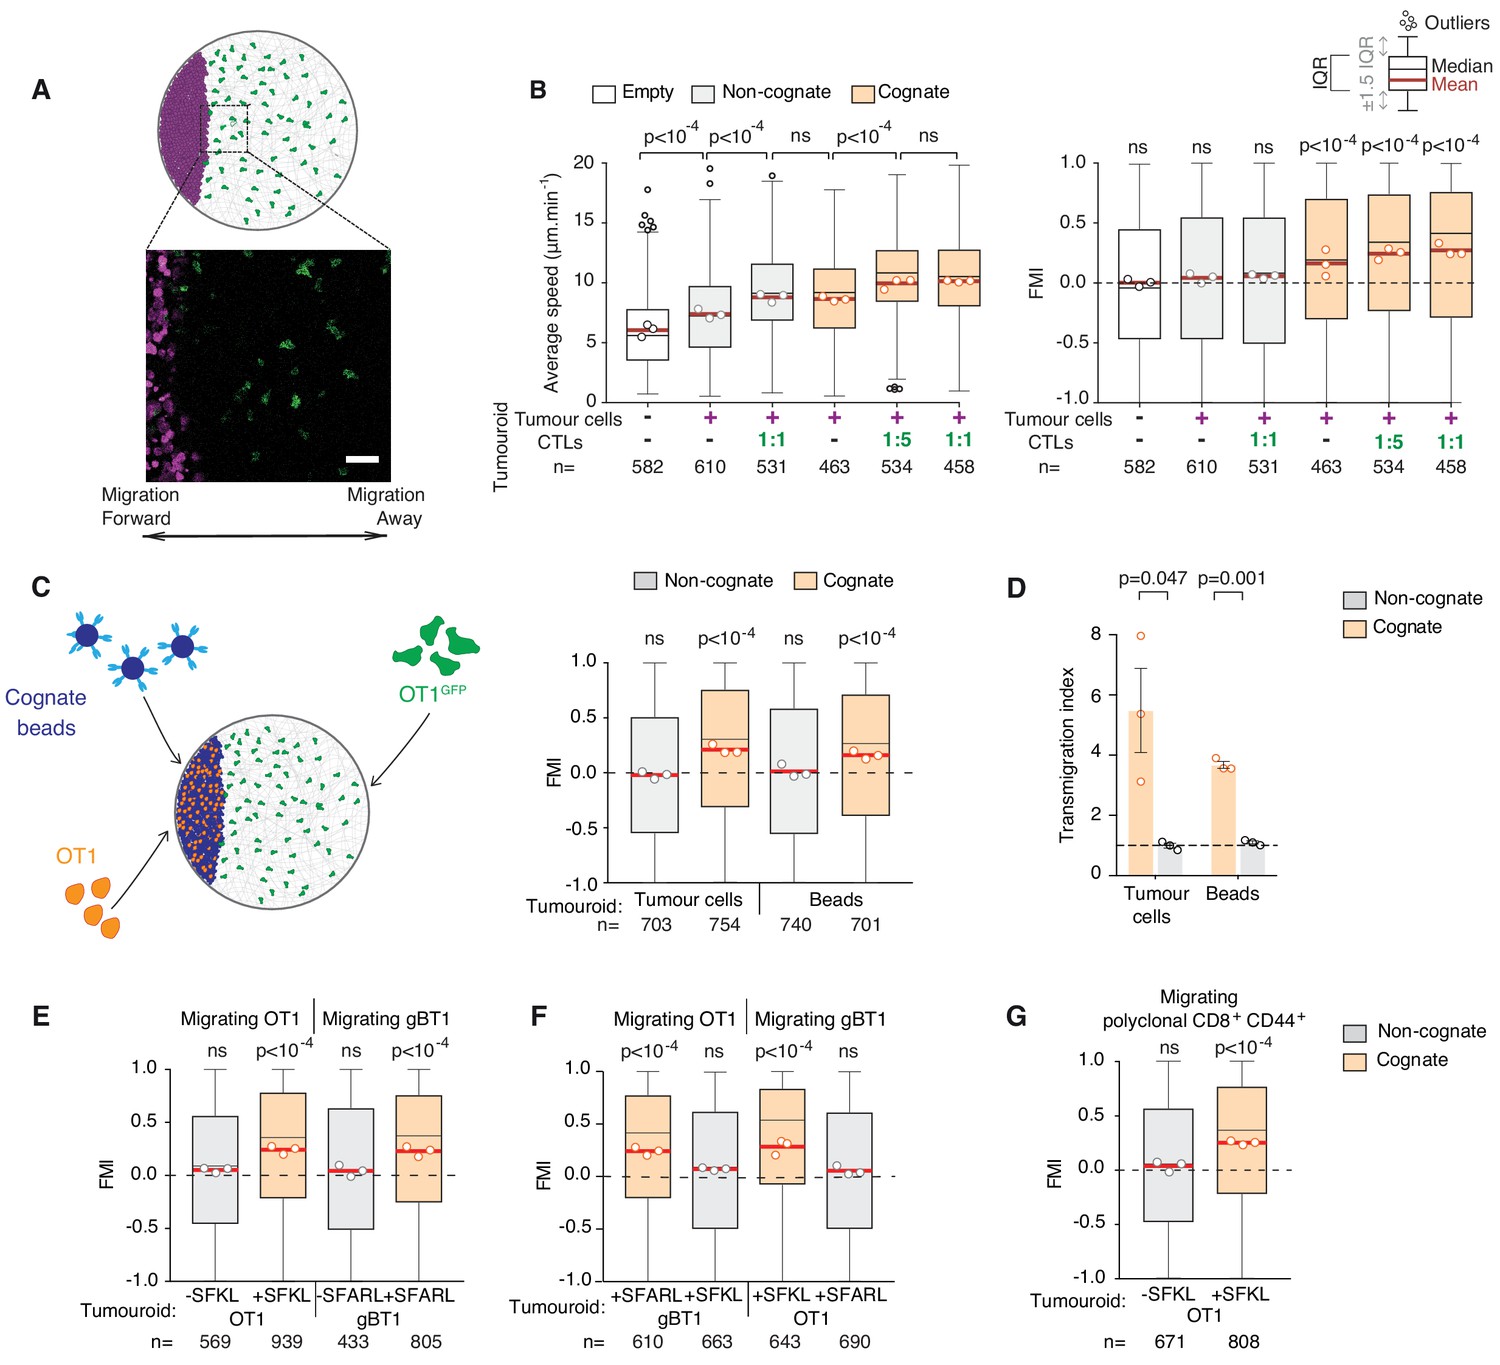
CTLs migrate rapidly and directionally towards sites of cognate target engagement due to a diffusing homotypic signal.
(A) Schematic of assay enabling 3D tracking of CTL movements relative to a tumouroid exposing a straight interface (scale bar: 50 µm). (B) Average speed and forward migration index (FMI) of CTLs adjacent to tumouroids containing cognate (SIINFEKL-pulsed) EL4 tumour cells or non-cognate (unpulsed) EL4, and without (-) or with pre-embedded tumour-reactive CTLs at indicated CTL:tumour cell ratios. (C) Left: Schematic showing H-2Kb/SIINFEKL cognate antigen-coated beads co-embedded with CTLs (OT1) in a dense mass, with the migration of adjacent fluorescent CTLs (OT1GFP) tracked in 3D over time. Right: FMI of CTLs migrating towards tumouroids containing OT1 CTLs and non-cognate or cognate tumour cells or beads. (D) Transmigration of CTLs towards supernatant obtained from CTLs conjugated with non-cognate or cognate cells and beads. Bars: mean from three independent experiments (data points). Error bars: SEM. p-values for comparisons of cognate and non-cognate conditions by t tests. (E) FMI of OT1 or gBT1 CTLs migrating towards tumouroids pre-embedded at a 1:1 ratio with OT1 or gBT1 CTLs respectively, showing ‘self-recruitment’ of CTLs. (F) FMI of OT1 or gBT1 CTLs migrating towards cognate tumoroids (EL4 pulsed with SIINFEKL or SSIEFARL as indicated) pre-embedded at a 1:1 ratio with gBT1 or OT1 CTLs, showing ‘cross-recruitment’ of CTLs of different antigen specificity towards tumour-reactive CTLs. Tumouroid densities are kept constant, and when pre-embedded with CTLs contain only half the number of tumour cells compared to masses in 2B constituted exclusively of tumour cells. (G) FMI of polyclonal CD8+CD44+ T cells migrating towards tumouroids containing OT1 CTLs with cognate or non-cognate tumour cells. Box-whiskers indicate medians and the interquartile range (IQR) with outliers outside whiskers. Red bars: mean of pooled data from three independent experiments. Data points: mean of each individual experiment. n: number of tracks. ns: p>0.05, where FMI in (B) to (G) were compared to a theoretical median of 0 using the two-tailed Wilcoxon signed rank test and average speeds in (B) were compared using the Kruskal-Wallis test followed by Dunn’s multiple comparisons tests.
-
Figure 2—source data 1
Source data file for Figure 2.
- https://cdn.elifesciences.org/articles/56554/elife-56554-fig2-data1-v3.xlsx
Figure 2—figure supplement 1
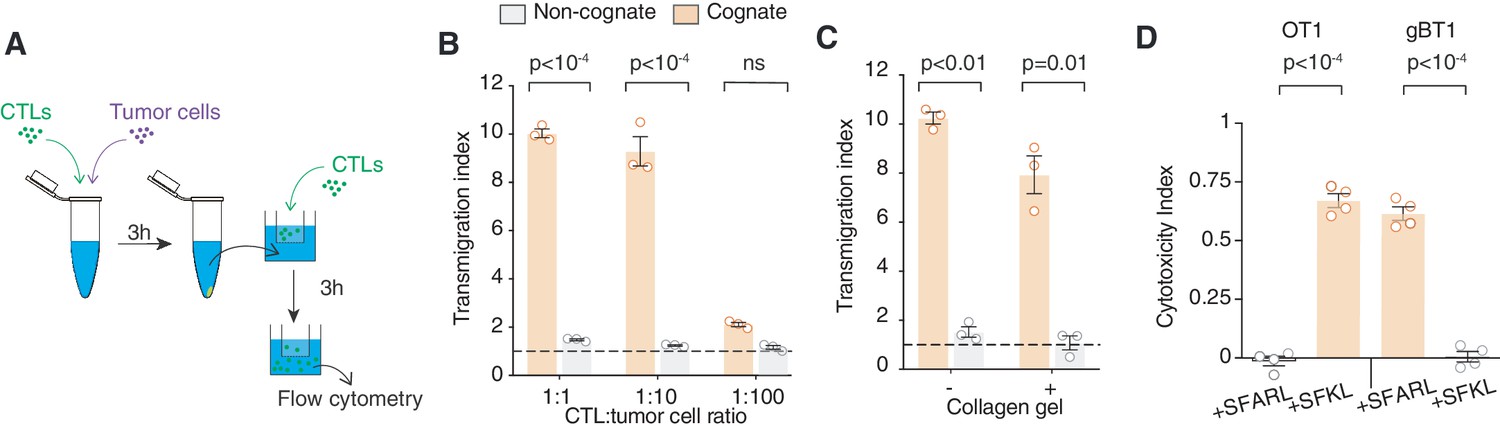
CTLs transmigrate towards cognate supernatants.
(A) Schematic illustration of the transmigration assay. CTLs were co-incubated with SIINFEKL-pulsed EL4 tumour cells or unpulsed non-cognate EL4 cells for 3 hr. The supernatant was filtered and used in the lower compartment of transwell chambers to quantify its chemotactic effect on CTLs. (B) Transmigration of CTLs towards cognate or non-cognate supernatant obtained from different CTL: tumour cell ratios. Data points from three independent experiments. (C) Transmigration of CTLs embedded in 3D collagen matrices towards cognate or non-cognate supernatant using transwells. Data points from three independent experiments. (D) Quantification of the killing efficiency (cytotoxicity index) of OT1 and gBT1 CTLs in the presence or absence of their respective cognate antigen-presenting cells (+SFKL for OT1; SFARL for gBT1). Data points from four independent experiments. (B–D) Bars: mean; error bars: SEM. ns: p>0.05, p-values by ANOVA and Tukey’s multiple comparison test of transmigration indices and cytotoxic indices in (B) to (C).
-
Figure 2—figure supplement 1—source data 1
Source data file for Figure 2—figure supplement 1.
- https://cdn.elifesciences.org/articles/56554/elife-56554-fig2-figsupp1-data1-v3.xlsx
Figure 3 with 1 supplement
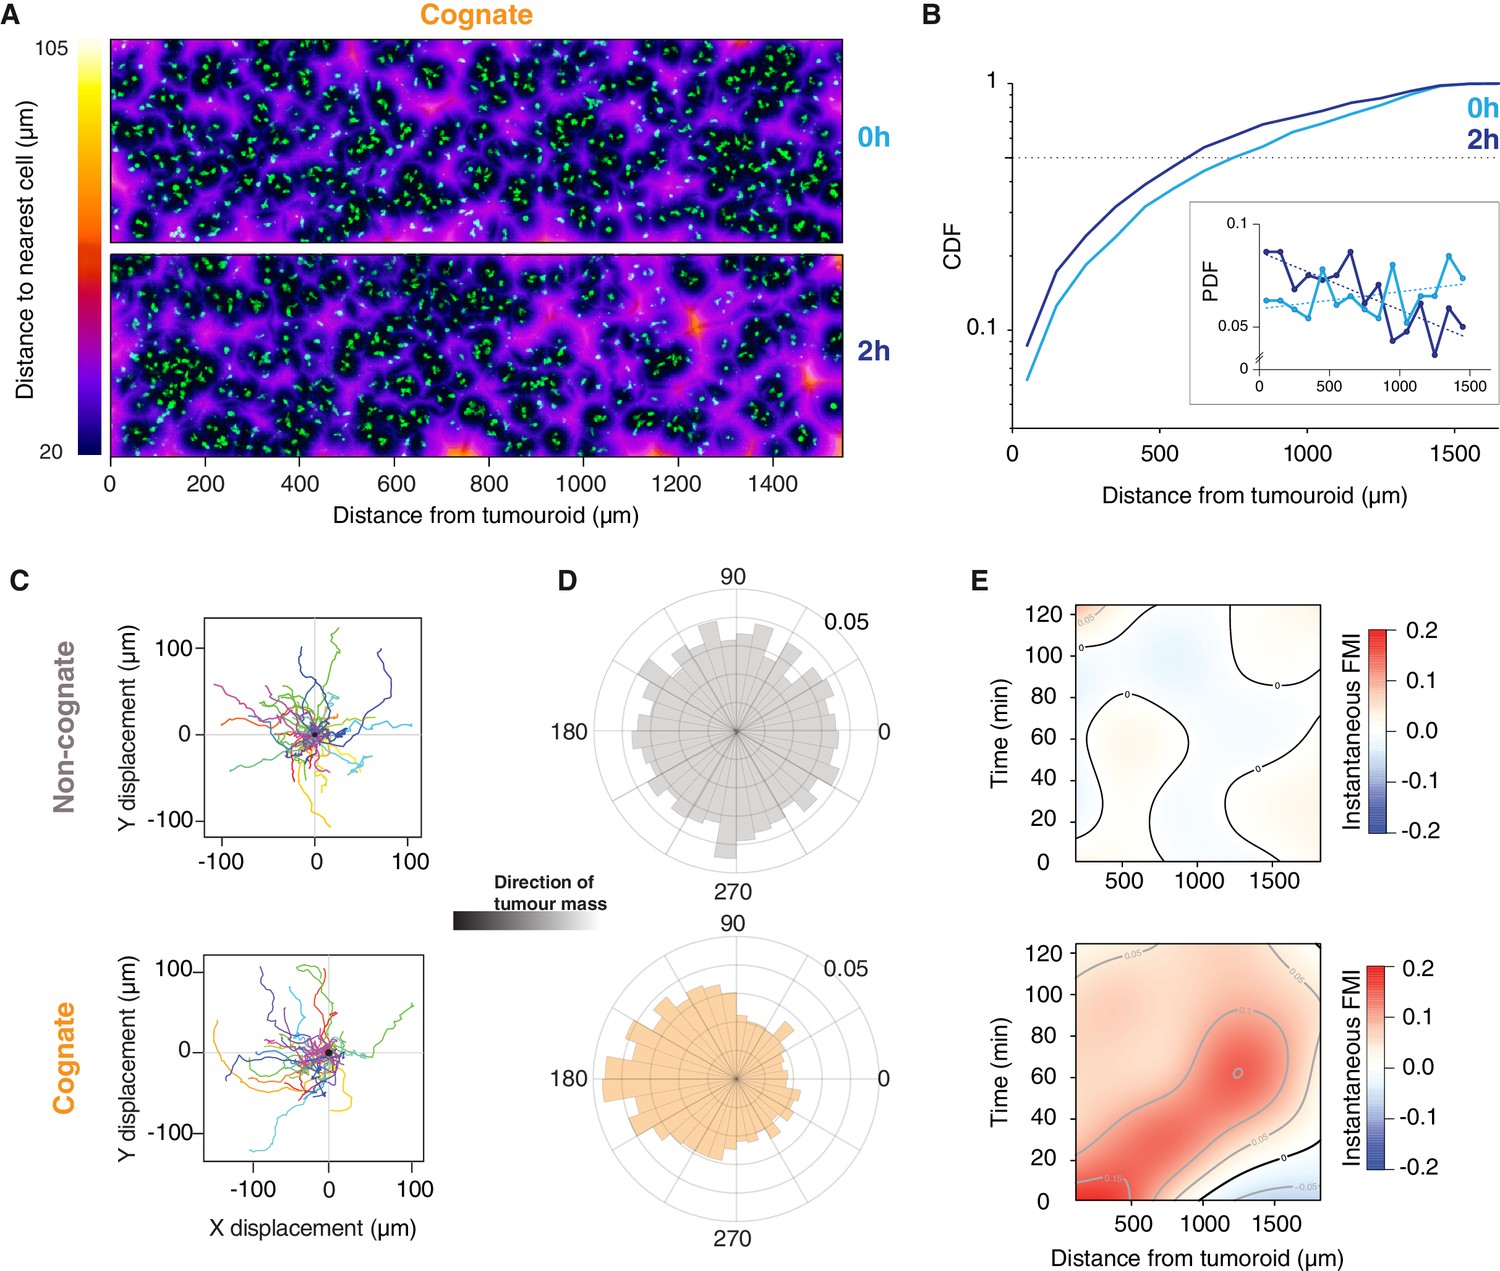
Engagement of cognate tumouroid gives rise to a diffusing wave of chemoattraction.
(A) Confocal images showing the distribution of CTLs (green) in relation to a SIINFEKL-pulsed EL4 cognate tumouroid at 0 and 2 hr. Pseudocolour: distance to nearest cell in µm. (B) Cumulative distribution function (CDF) of nearest distances of CTLs to a cognate tumouroid at 0 hr and 2 hr. Insert shows the corresponding probability density function (PDF), where dashed lines are linear fits. (C) Randomly selected representative tracks of CTLs migrating towards a non-cognate (top) or cognate (bottom) tumouroid with pre-embedded tumour-reactive CTLs (located towards -X); outset of all tracks centred on origin. (D) Angular histograms of CTL track displacements. 0°: away from tumour, 180°: towards tumour. Data pooled from three independent experiments (n = 4947 for non-cognate; top, n = 3926 tracks for cognate; bottom). (E) Kymographs of instantaneous FMI (based on displacement vector at each timeframe) for data shown in (D).
Figure 3—figure supplement 1
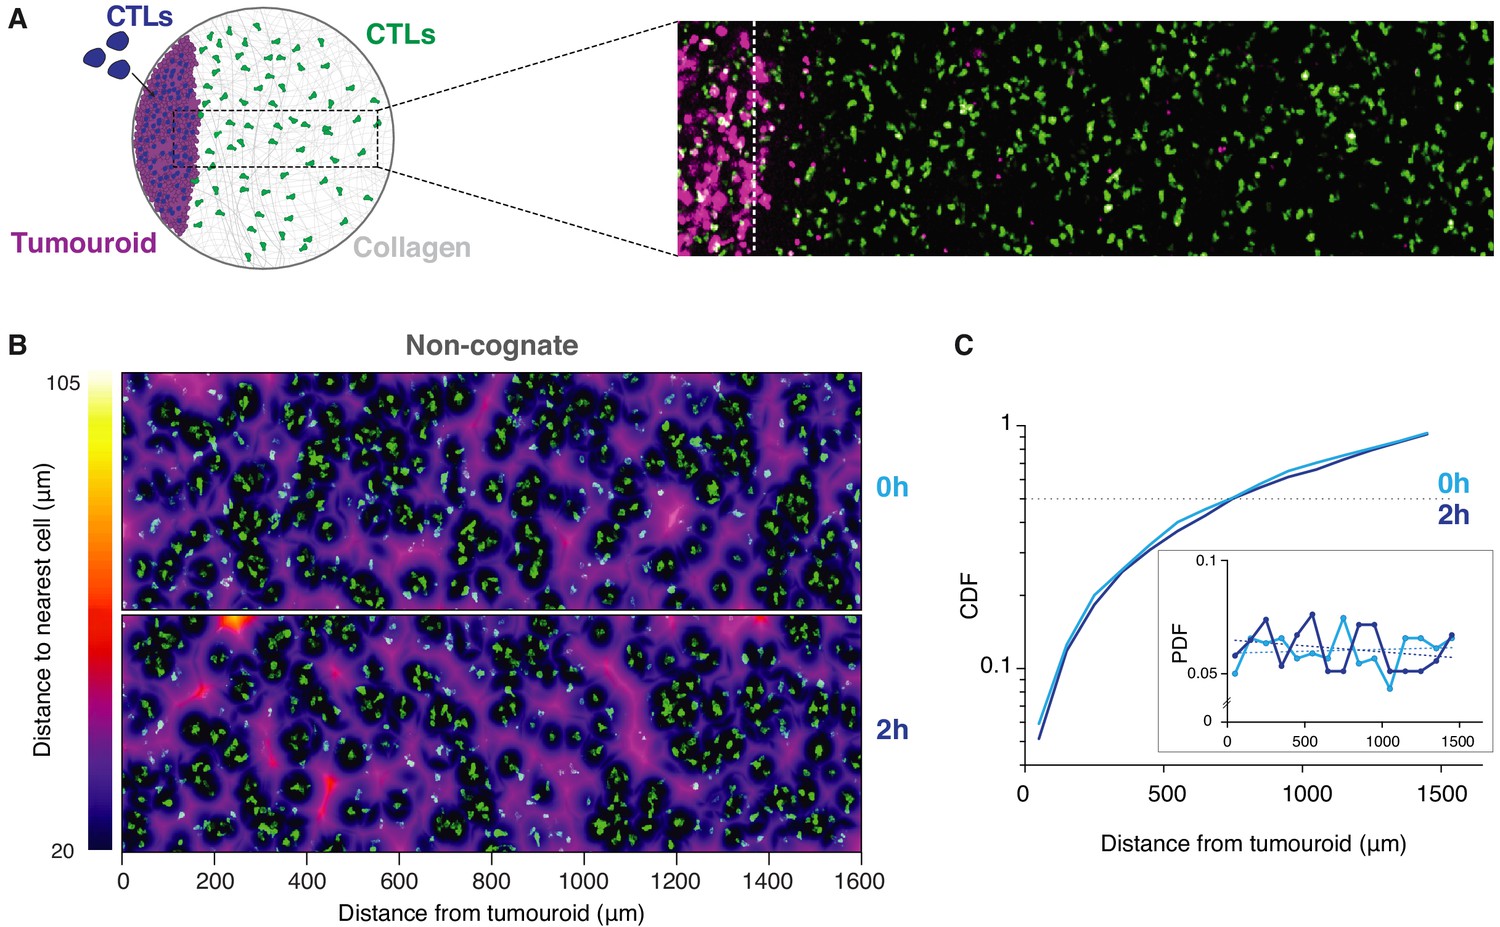
Long-range attraction assay in a non-cognate setting.
(A) Left: Schematic illustration showing CTL movements up to 1.6 mm away from the tumouroids comprising EL4 cells. Right: Representative confocal imaging showing the distribution of CTLs in relation to solid masses. CTL trajectories were only analysed from the right side of the dashed line, thus excluding CTLs directly engaging the tumoroids. (B) Confocal images showing the distribution of CTLs (green) in relation to a non-cognate tumouroid at 0 and 2 hr. Pseudocolour: distance to nearest cell in µm. (C) Cumulative distribution function (CDF) of nearest distances of CTLs to a non-cognate tumouroid at 0 hr and 2 hr. Insert shows the corresponding probability density function (PDF), where dashed lines are linear fits.
Figure 4 with 4 supplements
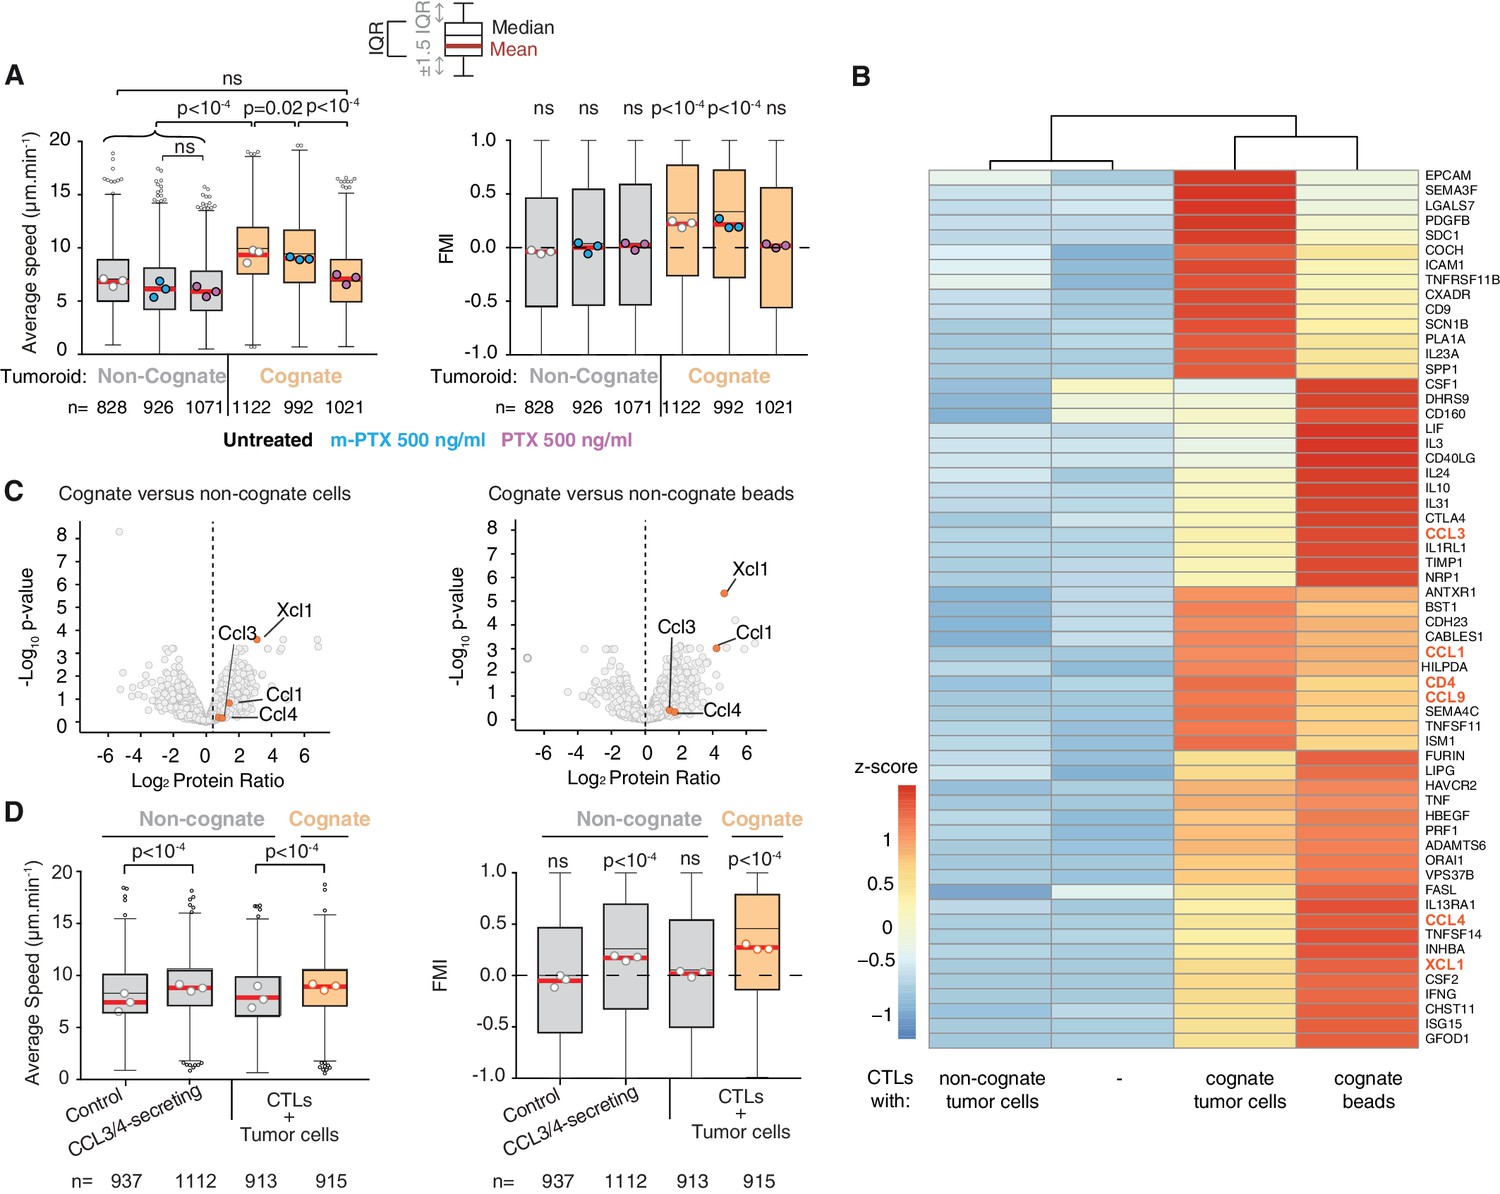
CCL3 and CCL4 secretion drives T cell swarming.
(A) Average speed (Left) and FMI (Right) of OT1 CTLs adjacent to non-cognate EL4 or cognate SIINFEKL-pulsed EL4 tumouroids with pre-embedded tumour-reactive CTLs not treated with pertussis toxin (PTX) or its inactive variant m-PTX. Adjacent CTLs were either untreated, or treated with 500 ng/ml of PTX or m-PTX for 1 hr prior to the migration experiment. (B) Hierarchically clustered heat map of differentially expressed genes encoding secreted proteins in resting CTLs (-) or CTLs exposed to non-cognate, cognate tumour cells or cognate beads. GPCR ligands are highlighted. (C) Volcano plots of proteins secreted during CTL interactions with tumour cells (left) or beads (right) identified by quantitative mass spectrometry analysis. GPCR ligands identified in (B) are highlighted. (D) Average speed (Left) and FMI (Right) of CTLs adjacent to tumouroids containing control or CCL3/CCL4-secreting EL4 tumour cells compared with non-cognate and SIINFEKL-pulsed cognate tumouroids pre-embedded with tumour-reactive CTLs. For A and D, box-whiskers indicate medians and the interquartile range (IQR) with outliers outside whiskers. Red bars: mean of pooled data from three independent experiments. Data points: mean of each individual experiment. n: number of tracks. ns: p>0.05, p-values from two-tailed Wilcoxon signed rank test compared to a theoretical median of 0 for FMI. Average speeds were compared using the Kruskal-Wallis test followed by Dunn’s multiple comparisons test.
-
Figure 4—source data 1
Source data file for Figure 4.
- https://cdn.elifesciences.org/articles/56554/elife-56554-fig4-data1-v3.xlsx
Figure 4—figure supplement 1
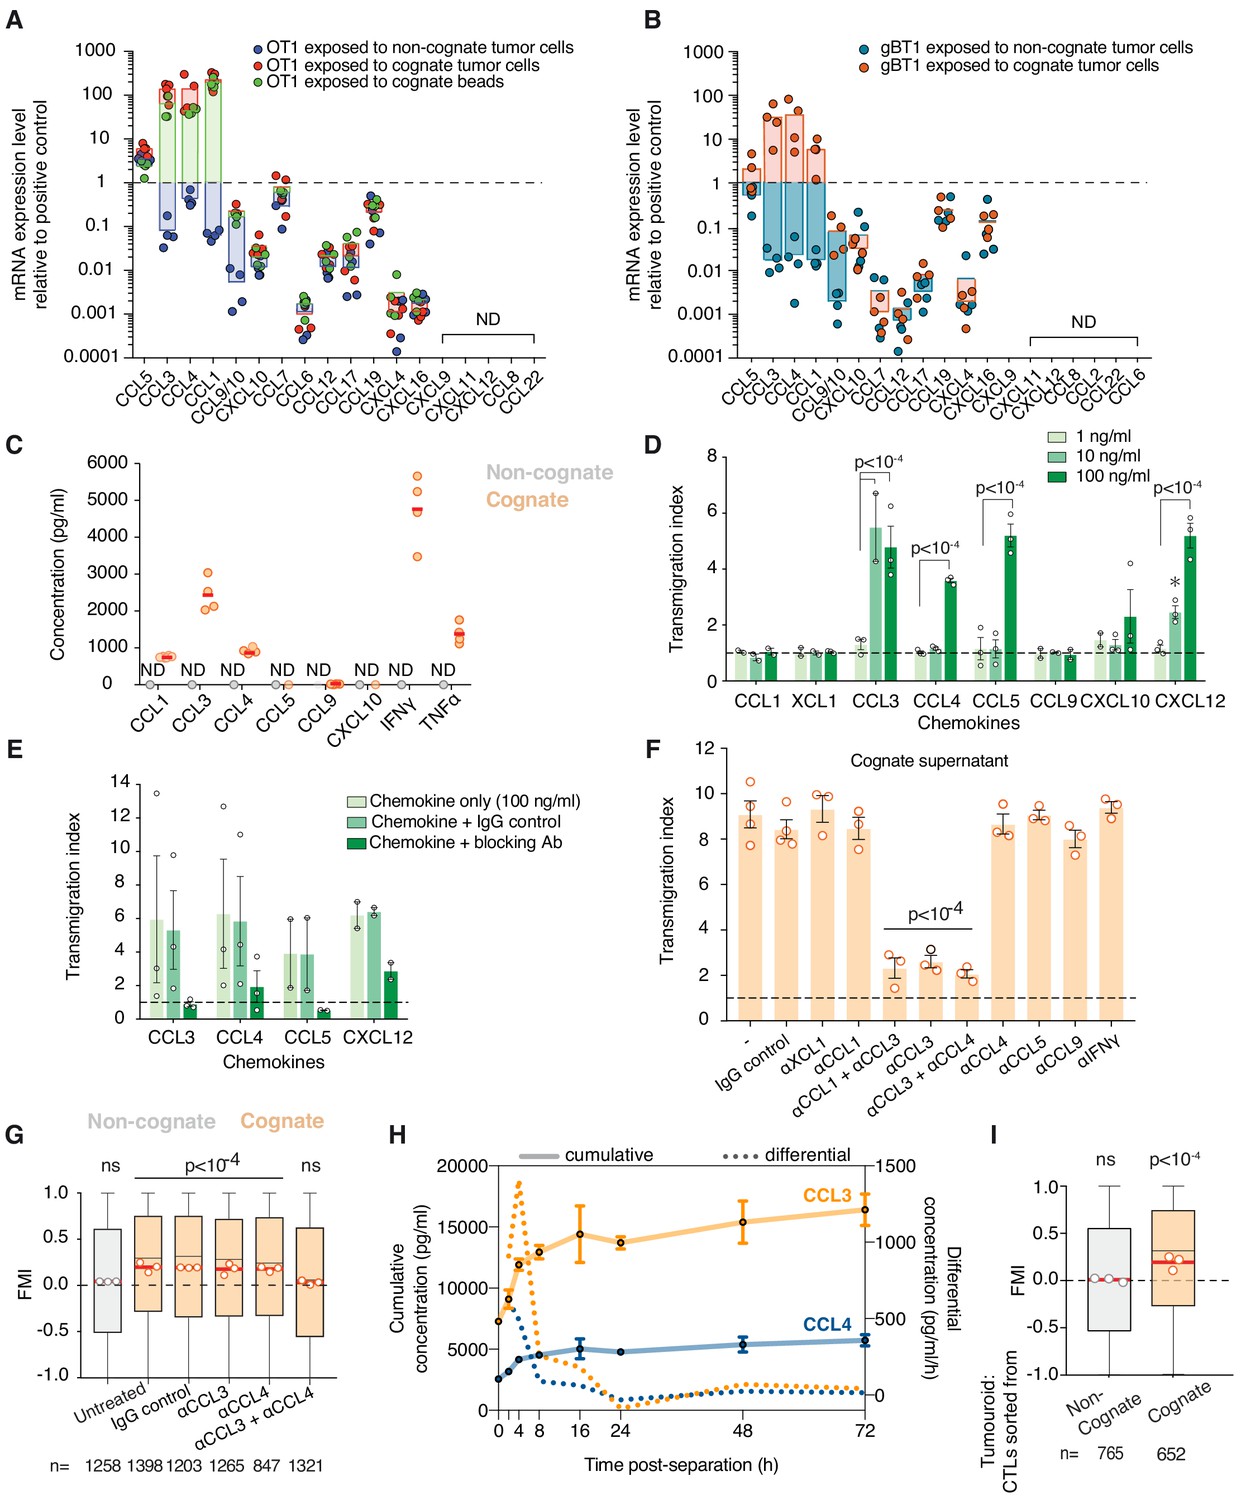
CCL3 and CCL4 are upregulated and secreted by activated CTLs and mediate homotypic recruitment.
(A, B) Quantification of chemokine mRNA levels by qRT-PCR in OT1 (A) or gBT1 (B) CTLs exposed to H-2Kb/SIINFEKL cognate beads, or cognate SIINFEKL- or SSIEFARL-pulsed EL4 respectively, or non-cognate unpulsed EL4 tumour cells, as indicated. Data is normalised to universal mouse cDNA (positive control). Data points from four independent experiments; bars indicate mean. ND: not detected. (C) Quantification of absolute chemokine concentration detected in non-cognate and cognate OT1 supernatants by ELISA (for CCL1 and CCL9) or CBA (for CCL3, CCL4, CCL5, CXCL10, IFN-γ, and TNF-α). Data points from four independent experiments; red lines indicate mean. ND: not detected. (D) Transmigration of OT1 CTLs towards basal medium containing indicated concentrations of recombinant chemokine. Data normalised to basal medium (dashed line). Data points from three independent experiments; bars indicate mean. Error bars represent standard deviation. p- values are displayed when means are significantly different compared to the 1 ng/ml condition. (E) Transmigration of OT1 CTLs towards chemokine-containing basal medium in the presence of corresponding neutralising antibodies or isotype (IgG) control antibody. Data points from four independent experiments; bars indicate mean. Error bars represent standard deviation. (F) Transmigration of CTLs towards cognate supernatant in the presence of neutralising antibodies or IgG isotype control. Data normalised to basal medium (dashed line). Data points from at least three independent experiments; bars indicate mean. Error bars represent standard deviation. p-values are displayed when means are significantly different to both the negative control and the IgG isotype control conditions. (G) FMI of OT1 CTLs adjacent to tumouroids containing non-cognate or cognate tumour cells with pre-embedded tumour-reactive CTLs in the presence of chemokine-neutralising antibodies as indicated. (H) Time course of CCL3 and CCL4 concentrations in supernatants from CTLs sorted by FACS from 4 hr conjugations with cognate tumour cells (0 hr: completion of conjugation). Solid line: cumulative concentration. Dotted line: differential concentration per hour (difference of cumulative concentrations at consecutive timepoints divided by number of hours in-between). Error bars and shaded areas: range. (I) FMI of OT1 CTLs adjacent to masses containing CTLs only (no tumour cells) sorted from conjugations with cognate or non-cognate tumour cells. Comparisons of transmigration indices in (C) to (E) were performed using ANOVA and Tukey’s multiple comparisons tests. In (G) and (I), box-whiskers indicate medians and the interquartile range (IQR) with outliers outside whiskers. ns: p>0.05, p-values from two-tailed Wilcoxon signed rank test compared to a theoretical median of 0.
-
Figure 4—figure supplement 1—source data 1
Source data file for Figure 4—figure supplement 1.
- https://cdn.elifesciences.org/articles/56554/elife-56554-fig4-figsupp1-data1-v3.xlsx
Figure 4—figure supplement 2
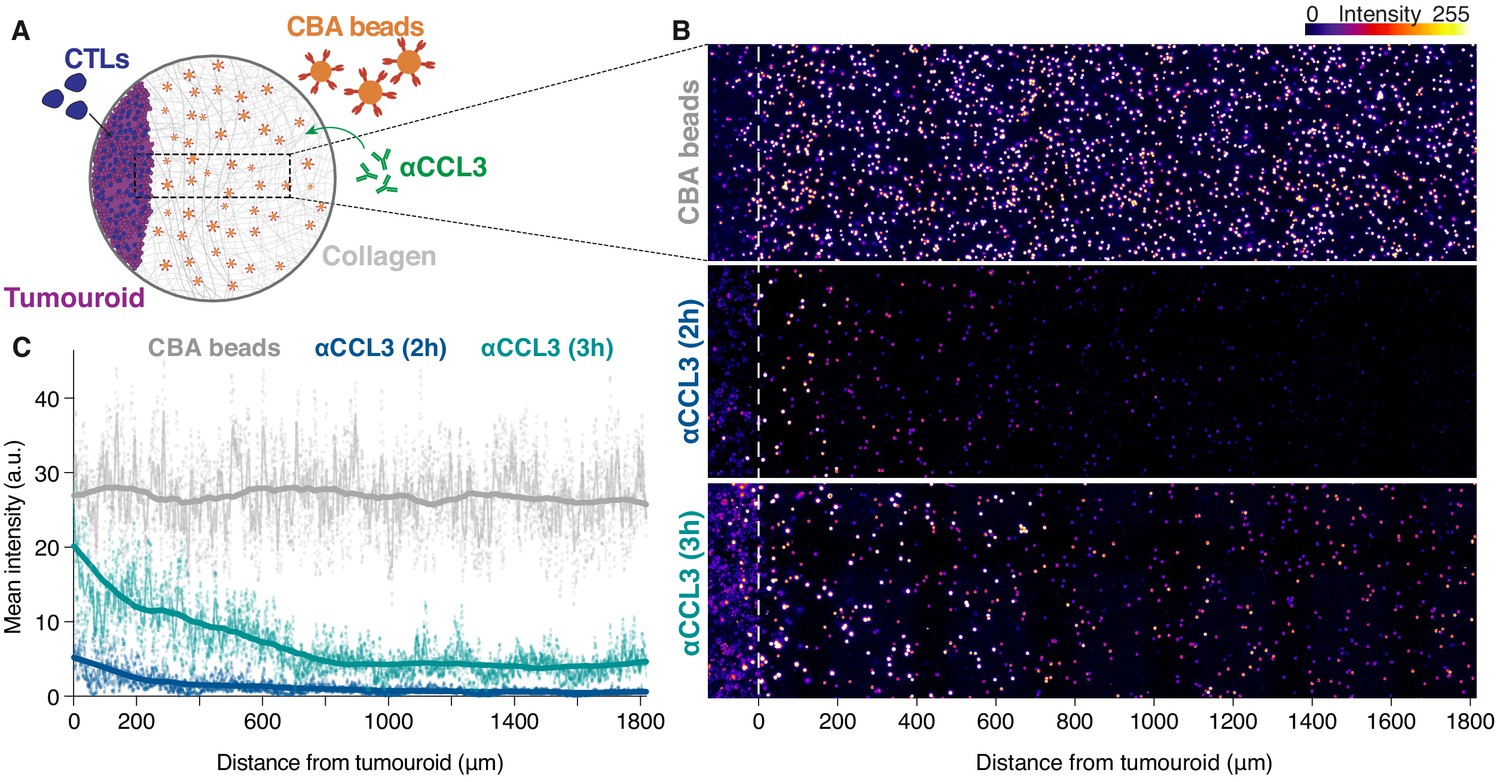
CTLs engaging cognate targets generate long-range chemokine gradients.
(A) Schematic illustration of experiment with cytometric bead array (CBA) beads embedded in collagen matrix adjacent to a cognate SIINFEKL-pulsed EL4 tumouroid co-embedded with CTLs. The CBA beads capture chemokines secreted by the CTLs in the tumouroid and the CCL3 gradient is then revealed by staining the beads with an anti-CCL3 antibody (αCCL3). (B) Representative confocal images of the distribution of beads and CCL3 gradients at 2 hr and 3 hr post-embedding of CTLs in tumouroid. (C) Fluorescence intensities of anti-CCL3 antibody staining 2 hr (blue) or 3 hr (green) post-embedding of CBA beads (grey) that capture cytokines and chemokines secreted from a cognate tumouroid with CTLs (to the left of origin). Graph shows mean x-projected intensities, data points are pooled from three separate fields; light curve: mean of pooled data; thick curve: smoothed mean of pooled data.
Figure 4—figure supplement 3
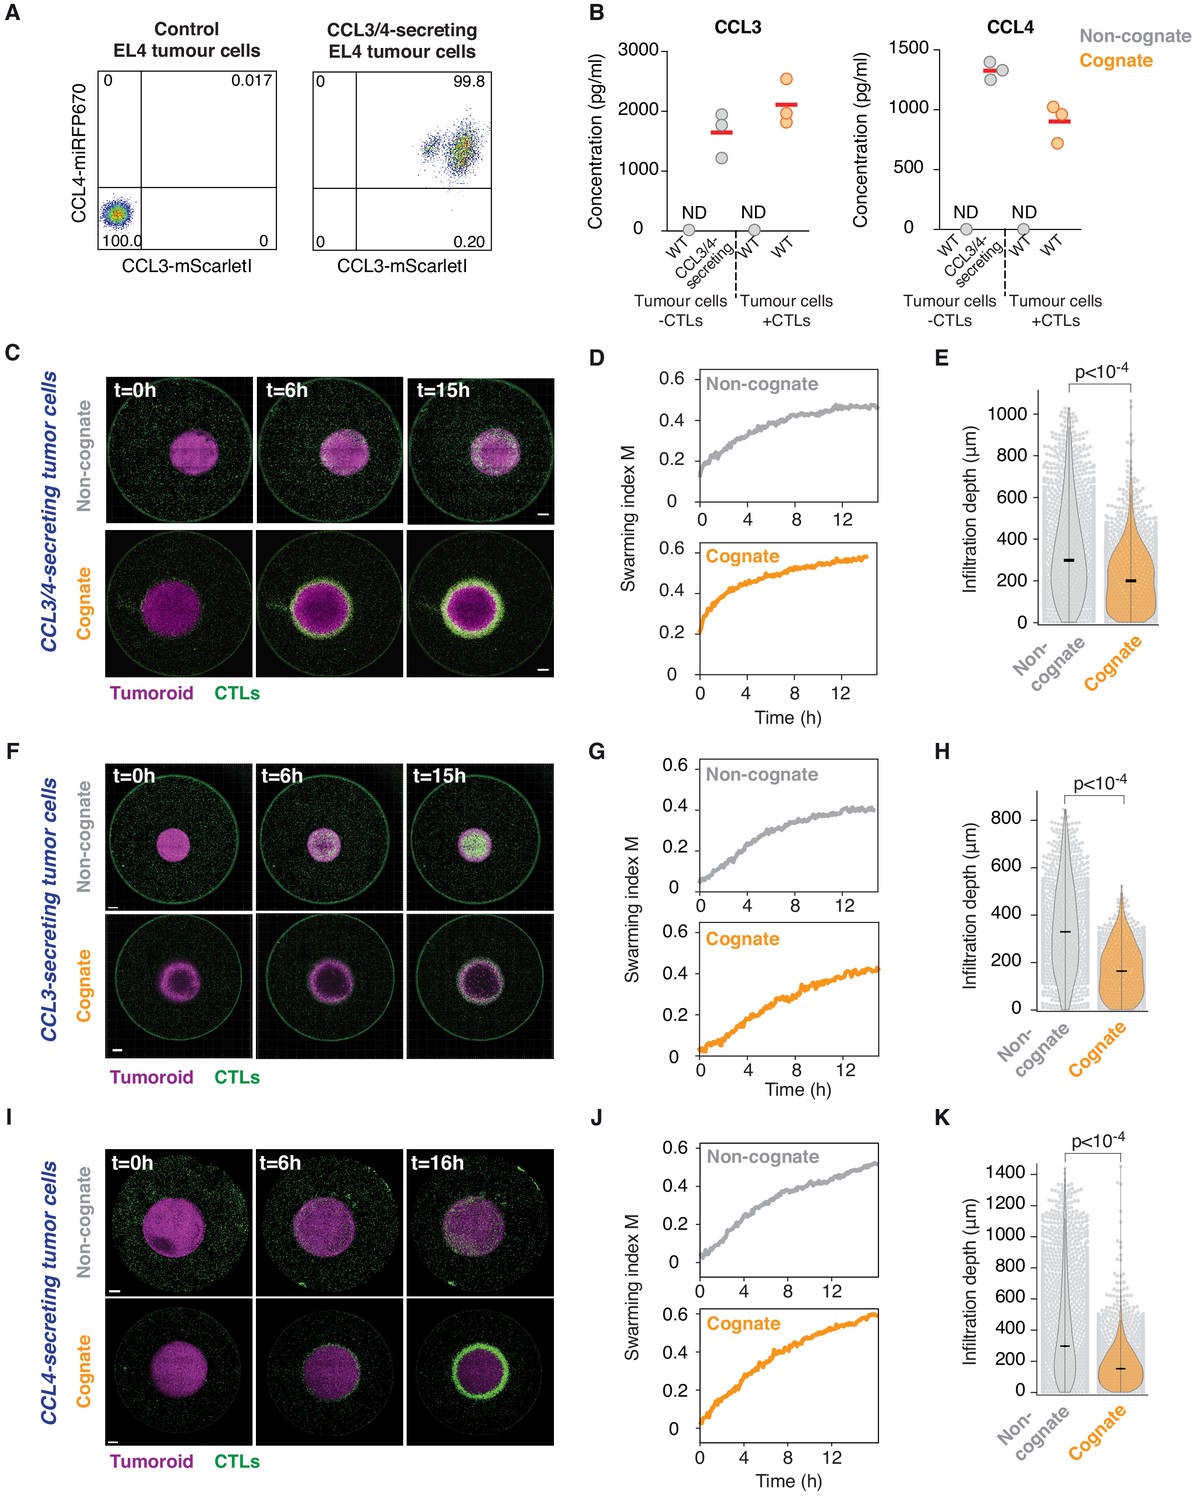
CCL3/CCL4-secreting tumour cells induce swarming and tumour infiltration.
(A) Flow cytometry analysis of EL4 tumour cells that constitutively secrete CCL3-mScarletI and CCL4-miRFP670. (B) Quantification of absolute CCL3 (right) and CCL4 (left) concentration detected in supernatants from control or CCL3/CCL4-secreting tumour cells, compared to CTLs conjugated with cognate or non-cognate tumour cells. Data points from three independent experiments; red bars indicate mean. ND: not detected. (C) CTLs responding to tumouroids containing non-cognate (top) or cognate (bottom) CCL3/4-secreting tumour cells. Scale bars: 500 µm. (D) Quantification of CTL convergence at the tumour masses shown in (C) via swarming index. (E) Infiltration depth of CTLs into CCL3/4-secreting tumouroids from three independent experiments. (F) CTLs responding to tumouroids containing non-cognate (top) or cognate (bottom) CCL3-secreting tumour cells. Scale bars: 500 µm. (G) Quantification of CTL convergence at the tumour masses shown in (F) via swarming index. (H) Infiltration depth of CTLs into CCL3-secreting tumouroids from three independent experiments. (I) CTLs responding to tumouroids containing non-cognate (top) or cognate (bottom) CCL4-secreting tumour cells. Scale bars: 500 µm. (J) Quantification of CTL convergence at the tumour masses shown in (I) via swarming index. (K) Infiltration depth of CTLs into CCL4-secreting tumouroids from three independent experiments. (E), (H) and (K): p-values from Mann-Whitney U test. Cognate EL4 cells in Figure 4 were pulsed with SIINFEKL and non-cognate cells were unpulsed.
-
Figure 4—figure supplement 3—source data 1
Source data file for Figure 4—figure supplement 3.
- https://cdn.elifesciences.org/articles/56554/elife-56554-fig4-figsupp3-data1-v3.xlsx
Figure 4—figure supplement 4
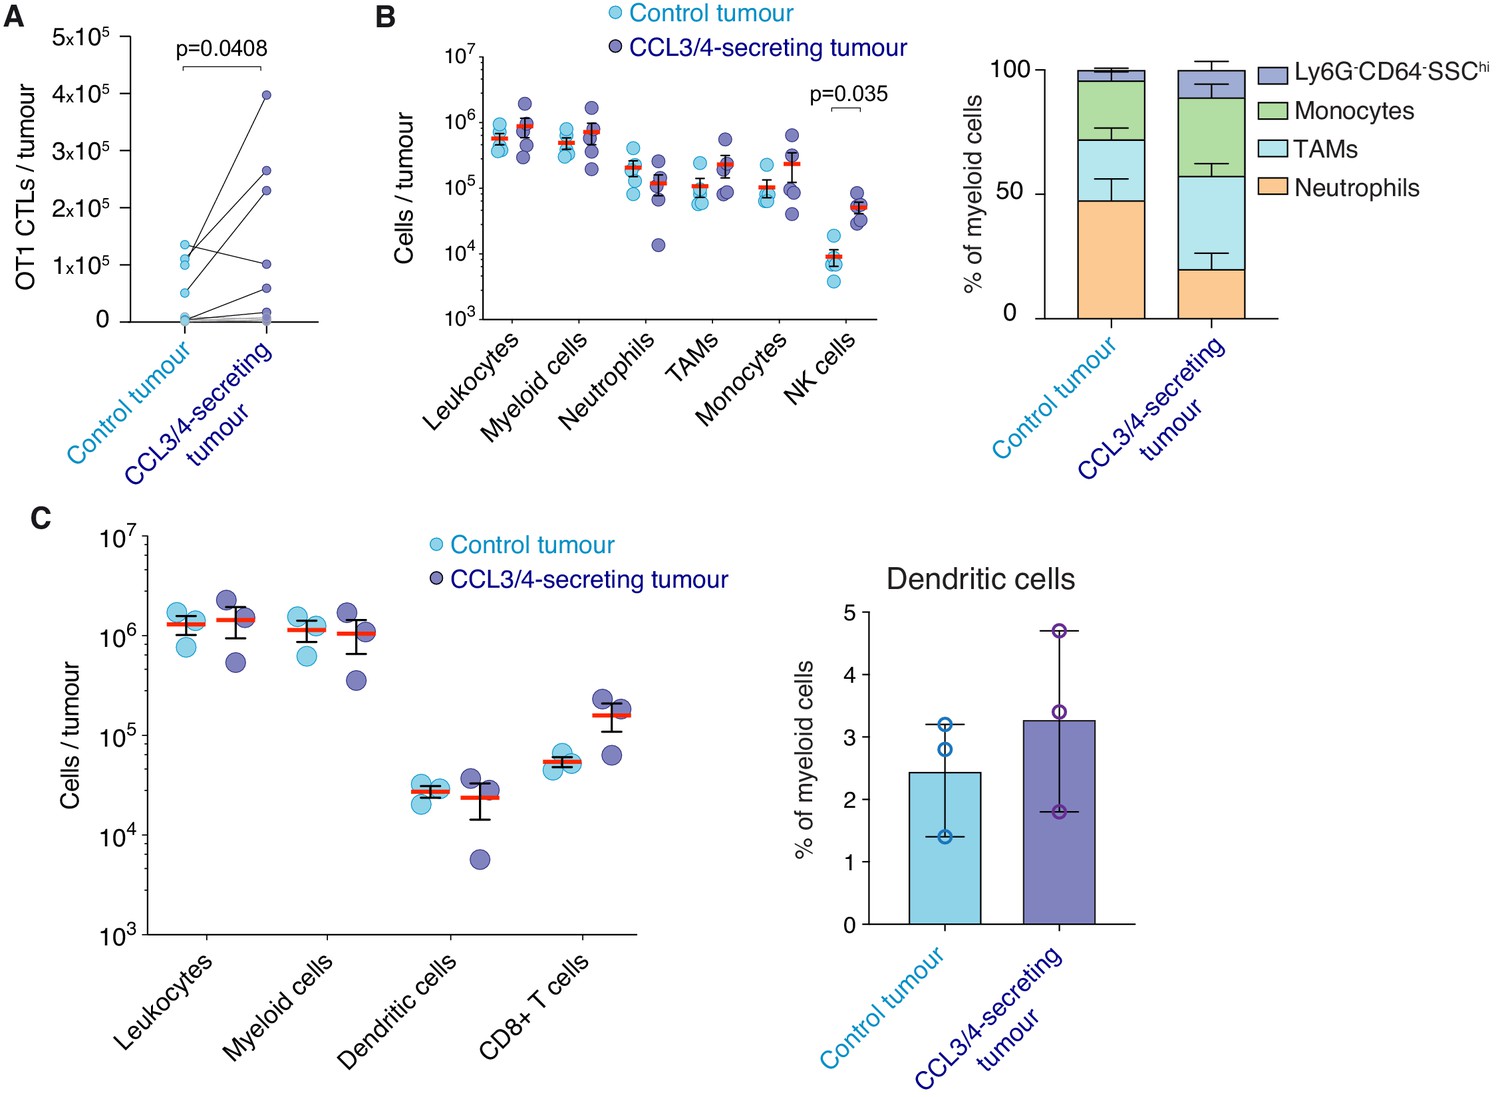
Leukocyte tumour infiltration in vivo.
(A) Rag-/- mice were engrafted subcutaneously with EL4 or CCL3/4-secreting EL4 tumour cells in contralateral flanks. On day 7 post-engraftment, 5 × 10⁶ OT1GFP CTLs were transferred intravenously. 2–3 days later, the number of GFP+ OT1 cells within tumour infiltrates were enumerated by flow cytometry. n = 10 mice. p-value from paired t test. Ineffective adoptive transfers where neither of the contralateral tumours contained at least 10,000 OT1 cells are indicated with grey lines. (B) PTPRCA mice were inoculated subcutaneously with EL4 or CCL3/4-secreting EL4 tumour cells in contralateral flanks and single-cell suspensions were prepared from both tumours on day seven for flow cytometry analysis. The number of CD45.1+ host leukocytes, myeloid cells (CD11b+CD90.2-), neutrophils (Ly6G+), tumour associated macrophages (TAMs) (CD64+), inflammatory monocytes (Ly6Chi), as well as NK cells (CD64-NK1.1+) were calculated (left panel), or expressed as a percentage of CD11b+ myeloid cells (right panel). Red bars, means of n = 5 mice. Error bars represent standard error of mean. (C) Experiments conducted as per (B) reflecting tumour-infiltrating dendritic cells (CD11chi MHC IIhi) and CD8+ T cells per tumour (left panel), and dendritic cells as percentage of myeloid cells (right panel). Red bars or columns, means of n = 3 mice. Error bars represent standard deviation. (B, C) p-values from student’s t test with Holm-Sidak’s tests for multiple comparisons are indicated when p<0.05.
-
Figure 4—figure supplement 4—source data 1
Source data file for Figure 4—figure supplement 4.
- https://cdn.elifesciences.org/articles/56554/elife-56554-fig4-figsupp4-data1-v3.xlsx
Figure 5 with 3 supplements
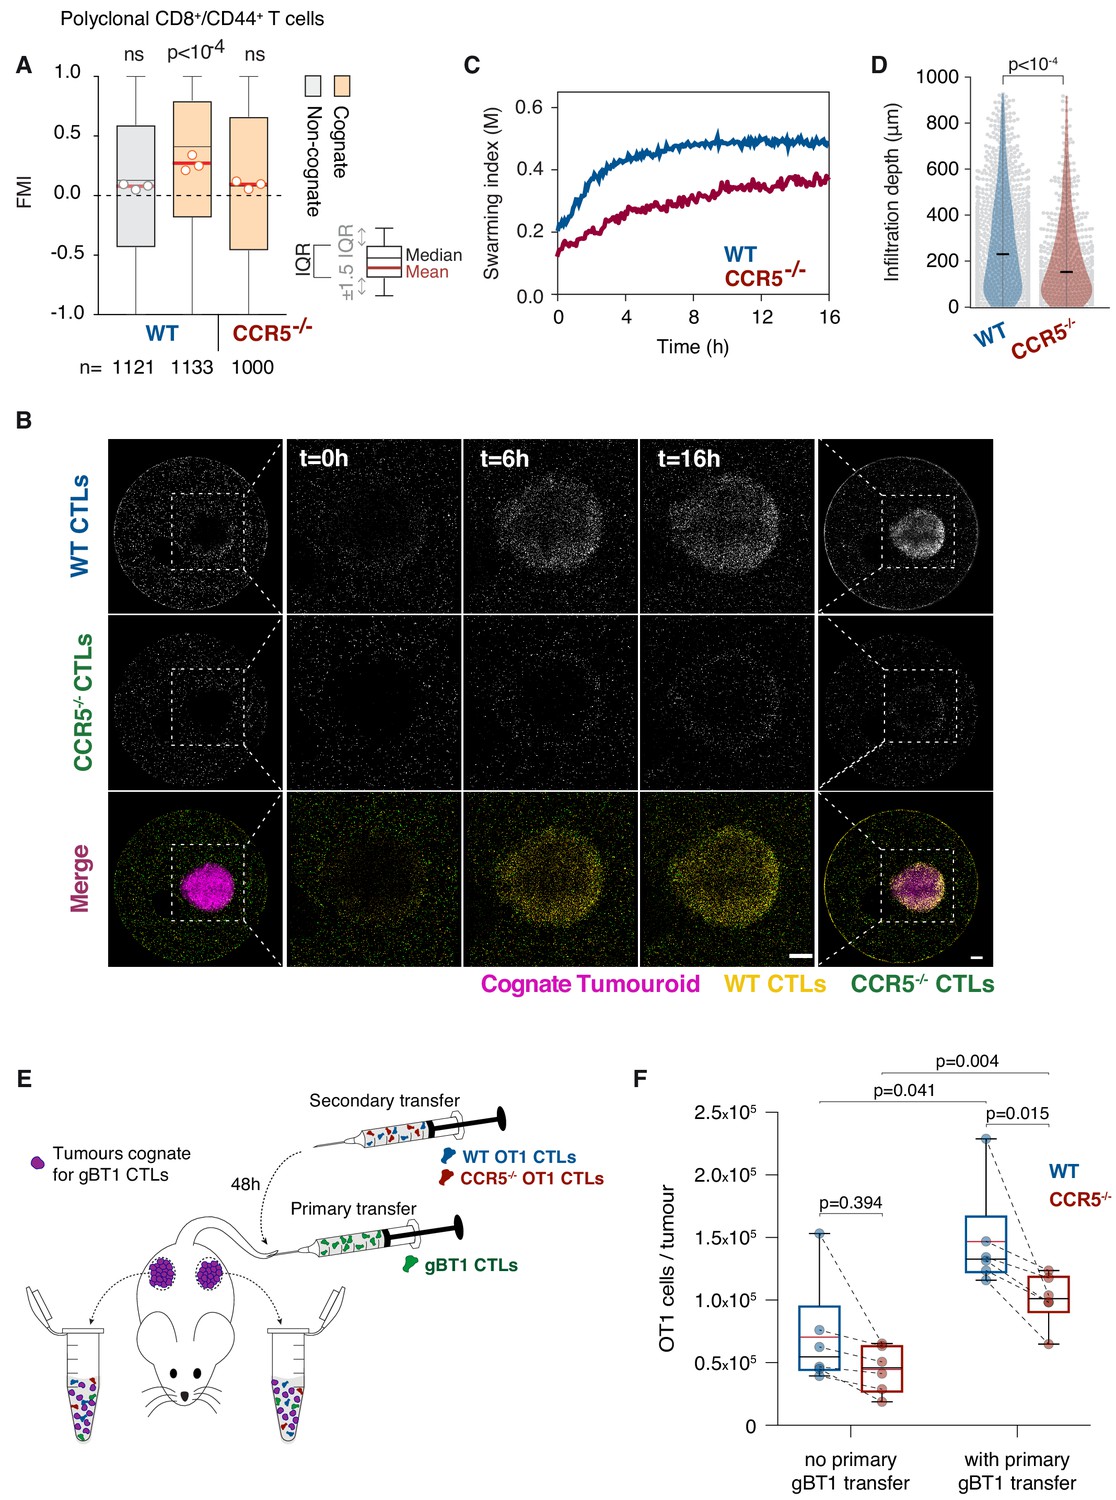
T cell swarming is CCR5-dependent.
(A) FMI of polyclonal WT or Ccr5-/- T cells adjacent to non-cognate EL4 or cognate SIINFEKL-pulsed EL4 tumouroids pre-embedded with tumour-reactive CTLs. Box-whiskers indicate medians and the interquartile range (IQR) with outliers outside whiskers. Red bars: mean of pooled data from three independent experiments. Data points: mean of each individual experiment. n: number of tracks for each experimental condition. ns: p>0.05, p-values from Kruskal-Wallis test followed by Dunn’s multiple comparison test. (B) WT and Ccr5-/- OT1 CTLs responding to a cognate tumouroid containing tumour-reactive CTLs. Insets highlight WT or Ccr5-/- CTLs infiltrating the cognate tumouroid. Scale bars: 500 μm. (C) Swarming index over time for WT and Ccr5-/- OT1 CTLs from data shown in (B). (D) Infiltration depth of WT and Ccr5-/- OT1 cells into tumouroid from data shown in (B). Violin plots show the distribution of probability densities, black bars represent medians, grey dots are individual data points. (E) Rag-/- mice were engrafted subcutaneously with SSIEFARL-expressing EL4 tumours. On day nine post-engraftment, 5 × 10⁶ gBT1 CTLs were transferred intravenously where indicated. 48 hr after gBT1 transfer, WT and Ccr5-/- OT1 (5 × 10⁶ each) were co-transferred intravenously. Tumour infiltrates were enumerated by flow cytometry a further 48 hr later. (F) Number of tumour-infiltrating WT and Ccr5-/- OT1 CTLs, with and without prior gBT1 CTL transfer. Box: medians and quartiles; whiskers: range; red bar: mean. Data points from one tumour each, n = 3 mice per group. p-values from Mann-Whitney U tests.
-
Figure 5—source data 1
Source data file for Figure 5.
- https://cdn.elifesciences.org/articles/56554/elife-56554-fig5-data1-v3.xlsx
Figure 5—figure supplement 1
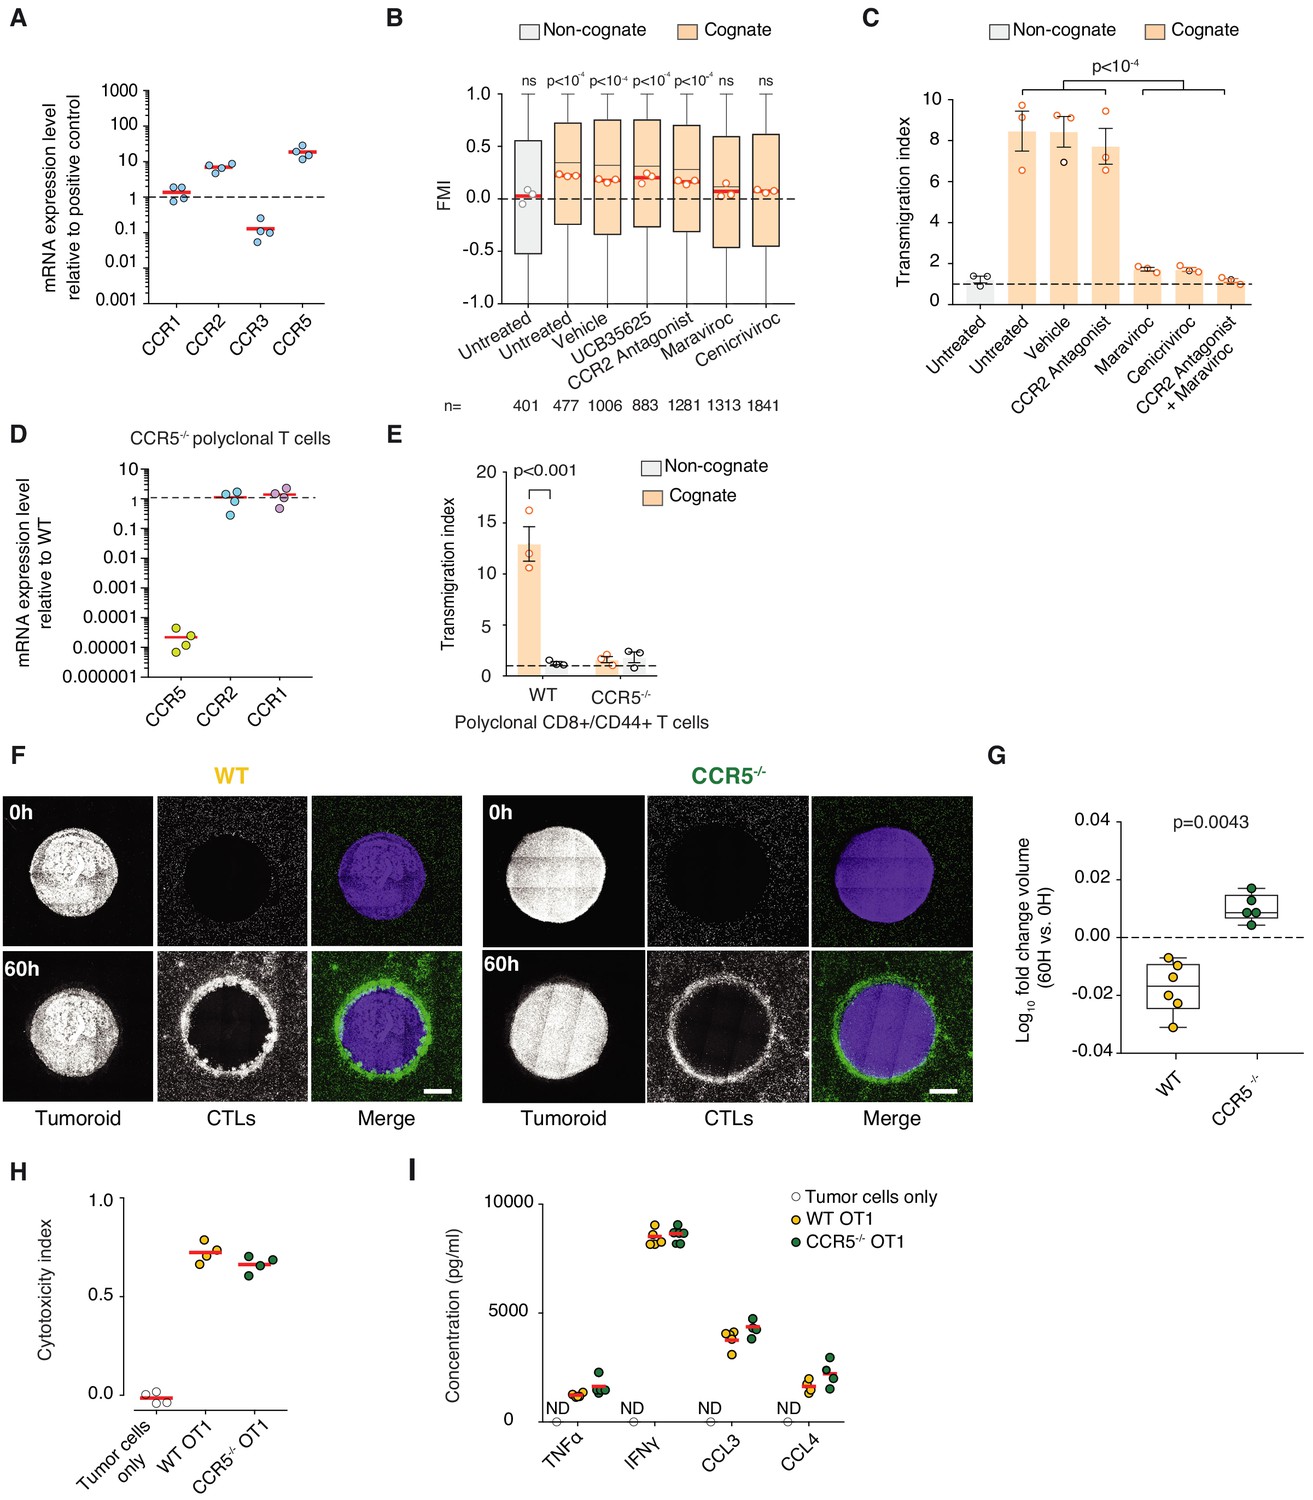
Chemokine receptor CCR5 mediates homotypic recruitment of CTLs.
(A) qRT-PCR analysis of chemokine receptor expression in OT1 CTLs. Data points from four independent experiments; red bars indicate mean. Data is normalised to universal mouse cDNA (positive control) (B) FMI of CTLs adjacent to tumouroids containing pre-embedded tumour-reactive CTLs with non-cognate unpulsed or cognate SIINFEKL-pulsed EL4 tumour cells in the presence of chemokine receptor inhibitors targeting CCR1 and CCR3 (UCB35625), CCR2 (CCR2 Antagonist), CCR5 (Maraviroc), or CCR2 and CCR5 (Cenicriviroc). p-values from Kruskal-Wallis test followed by Dunn’s multiple comparison test. (C) Transmigration of CTLs towards non-cognate or cognate supernatant in the presence of chemokine receptor inhibitors or vehicle (DMSO). Data normalised to basal medium (dashed line). Data points from three independent experiments; bars indicate mean. Error bars represent standard deviation. p-values from one-way ANOVA and Tukey’s multiple comparison test. (D) qRT-PCR analysis of chemokine receptor expression in Ccr5-/- CD8+ CD44+ polyclonal T cells relative to WT cells. (E) Transmigration of polyclonal WT or Ccr5-/- T cells in the presence of cognate or non-cognate supernatants. Data points from three independent experiments; bars indicate mean. Error bars represent standard deviation. p-value from two-way ANOVA and Tukey’s multiple comparison test. (F) Representative cross-sectional confocal images of tumouroids at 0 and 60 hr after incubation with surrounding WT or Ccr5-/- CTLs. (G) Log10 fold change of cognate tumouroid volumes after 60 hr of incubation with surrounding WT or Ccr5-/- CTLs relative to 0 hr. Box-whiskers: medians and quartiles from at least five independent experiments (data points); p-value from Mann-Whitney U test. (H) Quantification of the killing efficiency (cytotoxicity index) of WT or Ccr5-/- OT1 CTLs in the presence of cognate tumour cells. Data points from four independent experiments; red bars indicate mean. (I) Quantification of absolute TNFα, IFNγ, CCL3, and CCL4 concentration detected in cognate supernatant for Ccr5-/- and WT OT1 CTLs and in supernatant from tumour cells alone. ND: not detected.
-
Figure 5—figure supplement 1—source data 1
Source data file for Figure 5—figure supplement 1.
- https://cdn.elifesciences.org/articles/56554/elife-56554-fig5-figsupp1-data1-v3.xlsx
Figure 5—figure supplement 2

In vivo tumour homing and rejection.
(A) WT and Ccr5-/- OT1 CTLs were adoptively transferred into Rag-/- mice engrafted with control and CCL3-mScarletI/CCL4-miRFP670 secreting non-cognate tumours in contralateral flanks. Tumours were harvested 24 hr after adoptive transfer. (B) Relative homing of CTLs is quantified as a ratio of Ccr5-/-: WT OT1 CTLs in tumours, normalised to the same ratio in the spleen. Data points from four mice. p-values by Mann Whitney U test. (C) Representative CCL3-mScarletI fluorescence distribution for WT OT1 and Ccr5-/- OT1 CTLs isolated from control and contralateral CCL3/CCL4-secreting tumours in (E). MFI: mean fluorescence intensity. (D) Log10 fold change of the MFI of CCL3-mScarletl in Ccr5-/- CTLs relative to WT CTLs isolated in (E). p-values by ANOVA and Tukey’s multiple comparison test. (E) Representative flow cytometry gating to identify tumour infiltrates from Figure 5E,F. dsRed-expressing gBT1 CTLs were identified after exclusion of DAPI+ dead cells. A Not-gate was constructed to exclude gBT1 cells, from which CMFDA-stained WT and CellTracker DeepRed-stained Ccr5-/- OT1 CTLs were identified. In one out of three mice per group, dye combinations were reversed. (F) Absolute numbers of gBT1 cells per tumour. Box: median and interquartile range; and whiskers: range; red bar: mean. Data points from individuals tumours, n = 3 mice per group. p-values from Mann-Whitney U tests. (G) Tumour clearance by 5 × 10⁶ WT or Ccr5-/- OT1 CTLs transferred intravenously into Rag-/- mice engrafted with SIINFEKL-expressing tumours on day 9 of engraftment. Tumour volumes were normalised to the day of OT1 transfer. Data points represent means of normalised tumour volumes from mice that received WT (n = 9) or Ccr5-/- (n = 10) OT1 CTLs. Shaded areas represent standard deviations. t-tests were performed for each time point.
-
Figure 5—figure supplement 2—source data 1
Source data file for Figure 5—figure supplement 2.
- https://cdn.elifesciences.org/articles/56554/elife-56554-fig5-figsupp2-data1-v3.xlsx
Figure 5—figure supplement 3
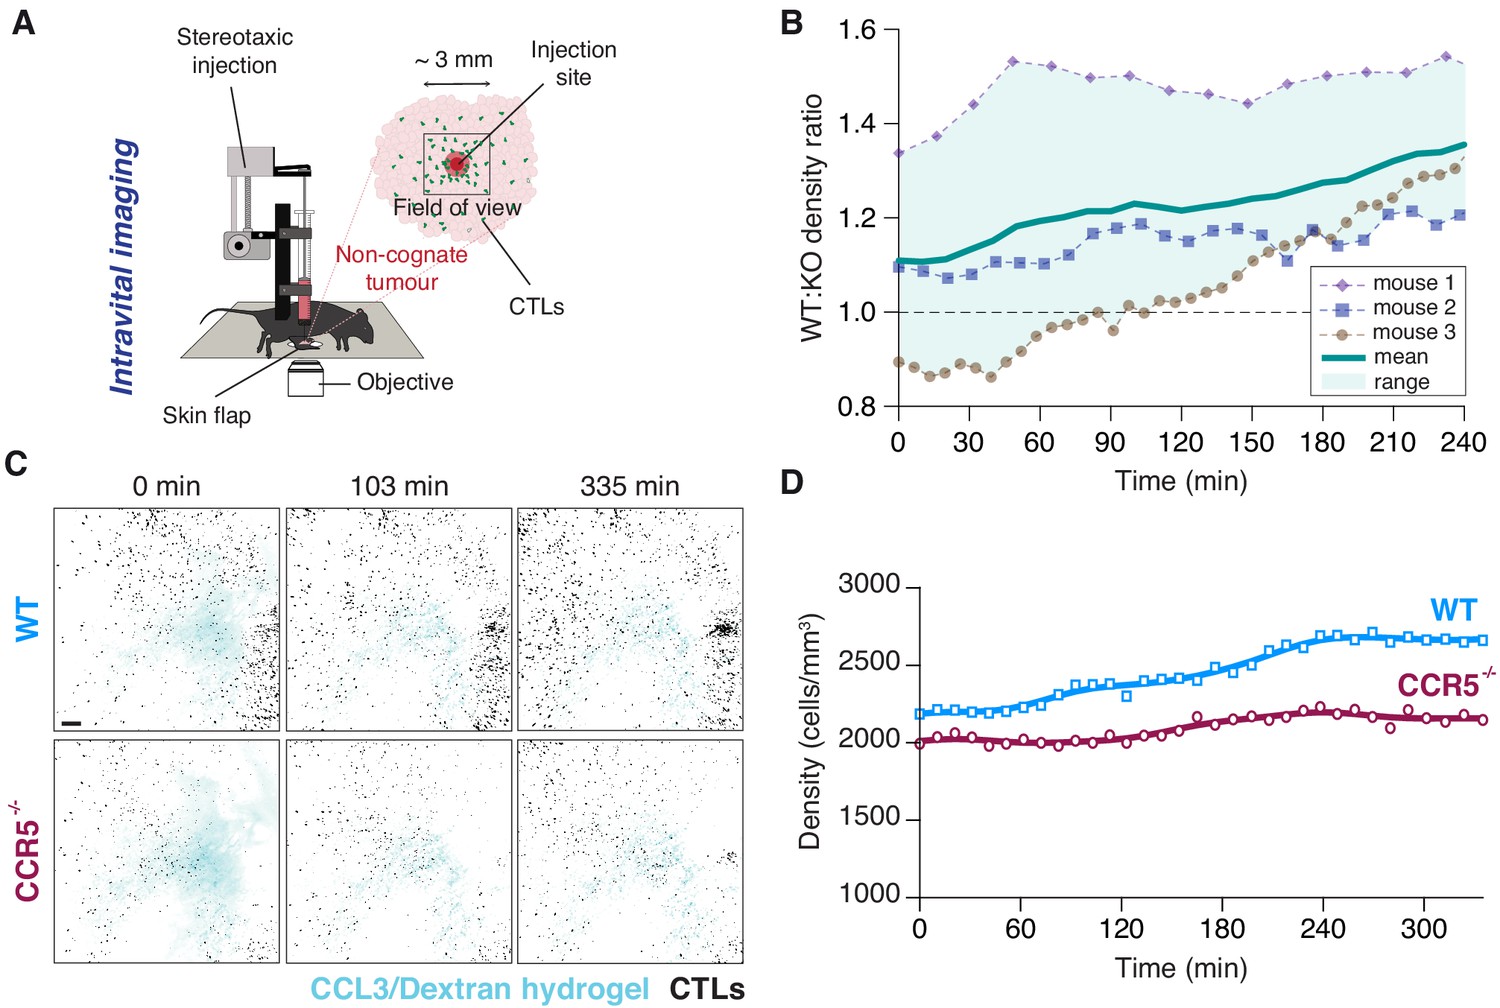
Intravital imaging following local intratumoural injection of CCL3.
(A) Schematic representation of the intravital imaging set-up allowing for intratumoural delivery of CCL3-containing hydrogel into the centre of a field of view with a side of ~3 mm recording CTL movements. (B) Ratios of OT1 (WT) to Ccr5-/- OT1 (KO) CTL densities in fields of view in three independent experiments. Solid line and shaded area show mean and range. (C) Intravital imaging of the recruitment of WT OT1 (top) and Ccr5-/- OT1 (bottom) CTLs towards site of intratumoural injection of CCL3 and Dextran-AF647 contained in a shear-thinning hydrogel (from mouse two in (B)). Scale bar: 200 μm. (D) Evolution of cell density over time following intratumoural delivery of CCL3 for WT and Ccr5-/- OT1 CTLs shown in (C) Solid lines: smoothing of data points by factor 3.
Figure 6 with 1 supplement
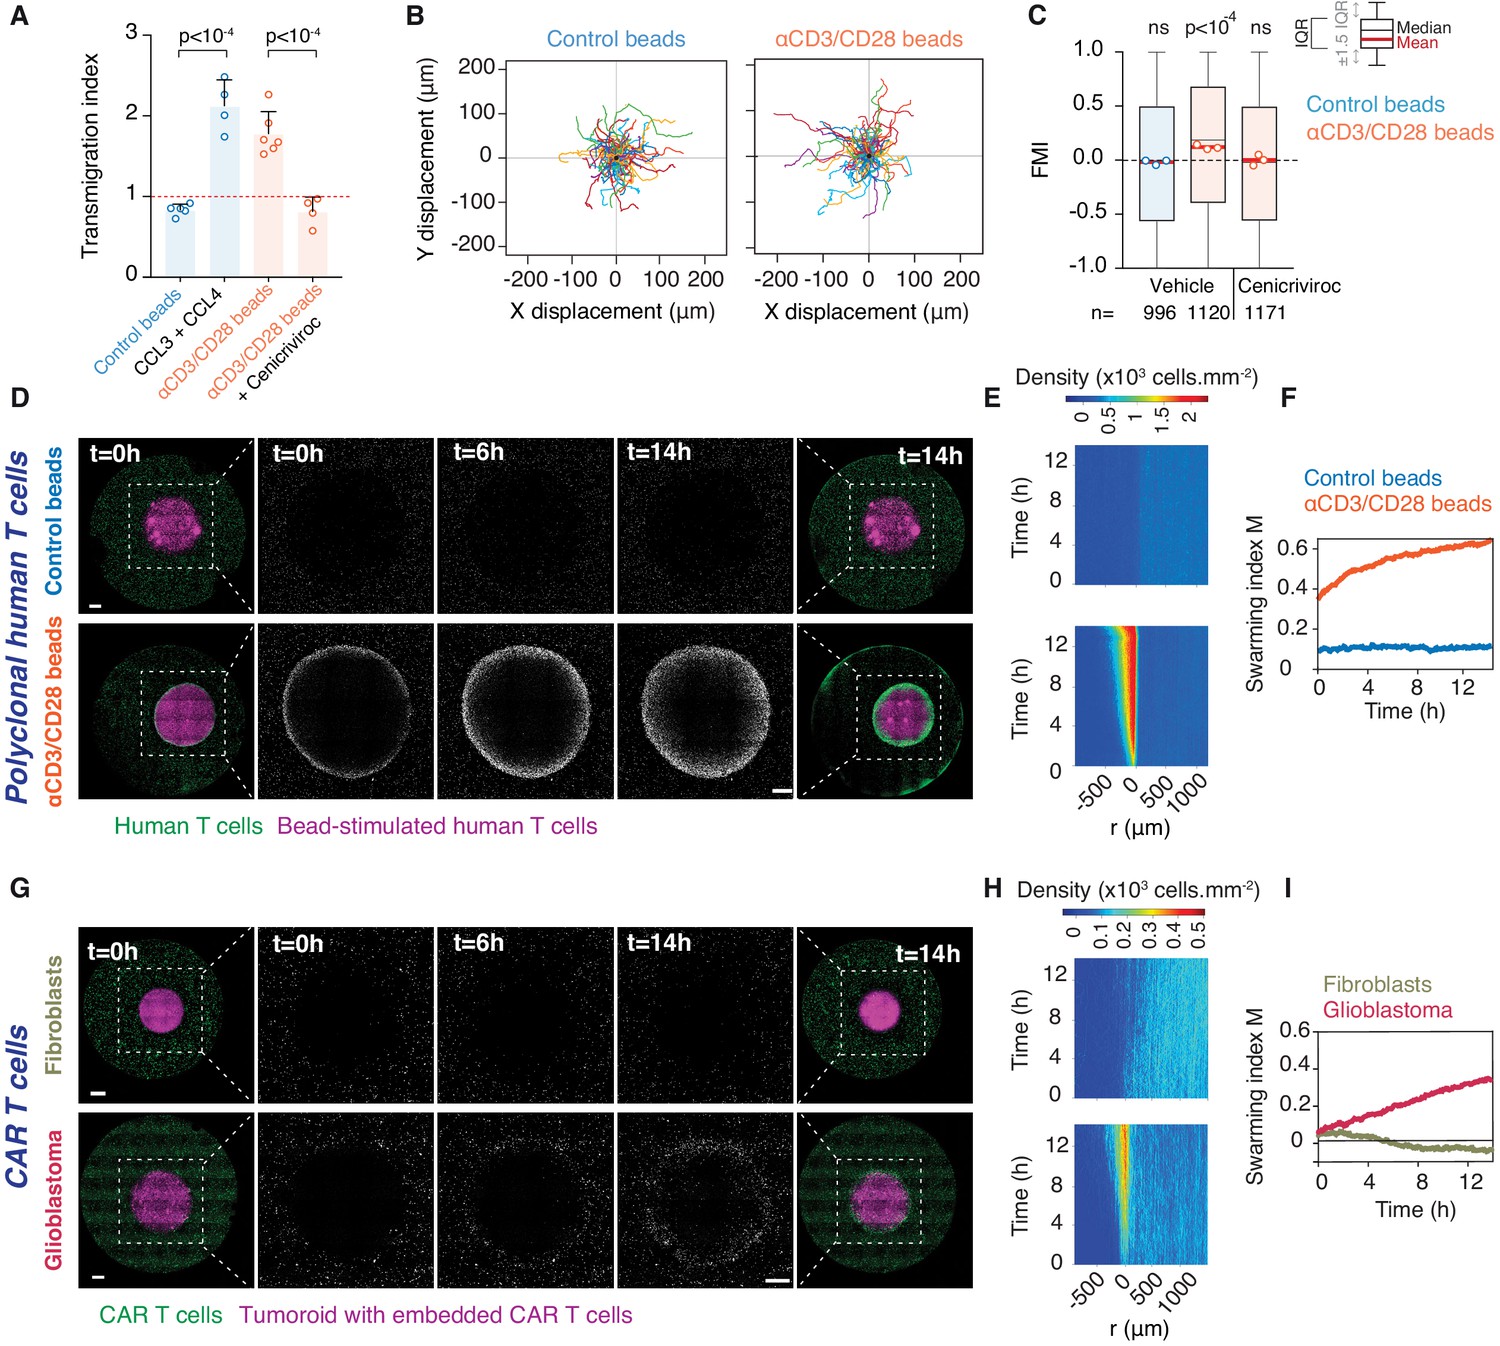
Homotypic recruitment of human polyclonal and CAR T cells.
(A) Transmigration of human T cells towards supernatant from T cells conjugated with IgG-coated beads (control beads), recombinant human CCL3 and CCL4, or supernatant from T cells conjugated with αCD3/CD28-coated beads in the absence or presence of CCR2/CCR5 dual antagonist (Cenicriviroc), relative to transmigration towards basal medium. Bars: mean from four independent experiments (data points). Error bars: SEM. p-values from ANOVA and Tukey’s multiple comparison test. (B) Cell trajectories of primary polyclonal human T cells adjacent to a tumouroid containing human T cells stimulated with control or αCD3/CD28 beads. Random representative tracks from dataset of three independent experiments, quantified in (C). (C) FMI of polyclonal human T cells as per (B), also assessed in the presence of Cenicriviroc. Box-whiskers indicate medians and the interquartile range (IQR). Red bars: mean of pooled data from three independent experiments. Data points: mean of each individual experiment. n: number of tracks for each experimental condition. ns: p>0.05, p-value from two-tailed Wilcoxon signed rank test compared to hypothetical median of 0. (D) Human polyclonal T cells (green) responding to a tumouroid containing T cells (magenta) stimulated with control (top) or αCD3/CD28 beads (bottom). Insets highlight CTLs infiltrating the tumouroid. Scale bars: 500 μm. (E, F) Swarming index and density kymographs quantify human T cell movements with respect to tumouroids in (D). r: distance from tumouroid edge. (G) Human CAR T cells (green) responding to tumouroids containing additional CAR T cells (magenta) and control fibroblast cells (top) or target glioblastoma cells (bottom). Insets highlight CTLs infiltrating the tumouroid. Scale bars: 500 µm. (H, I) Swarming index and density kymographs quantify CAR T cell movements with respect to tumouroids in (G). r: distance from tumouroid edge.
-
Figure 6—source data 1
Source data file for Figure 6.
- https://cdn.elifesciences.org/articles/56554/elife-56554-fig6-data1-v3.xlsx
Figure 6—figure supplement 1

Chemokine expression in activated human polyclonal T cells, and CAR T cell sorting and cytotoxicity.
(A) qRT-PCR analysis of chemokine expression in human T cells exposed to activating (αCD3/CD28-coated) beads relative to control (IgG-coated) beads. (B) Primary human T cells were transduced with EphA2-specific CAR constructs containing a truncated CD19 domain and subsequently enriched for CD19 expression by magnetic sorting. Percentages of CD19+ populations as assessed by flow cytometry are shown for untransduced T cells (blue), unsorted CAR T cells (red) and enriched CAR T cells (yellow). (C) Quantification of the killing efficiency (cytotoxic index) of untransduced or CAR T cells (unsorted) conjugated with target glioblastoma cells. p-value from unpaired t test used to compare group means.
-
Figure 6—figure supplement 1—source data 1
Source data file for Figure 6—figure supplement 1.
- https://cdn.elifesciences.org/articles/56554/elife-56554-fig6-figsupp1-data1-v3.xlsx
Figure 7
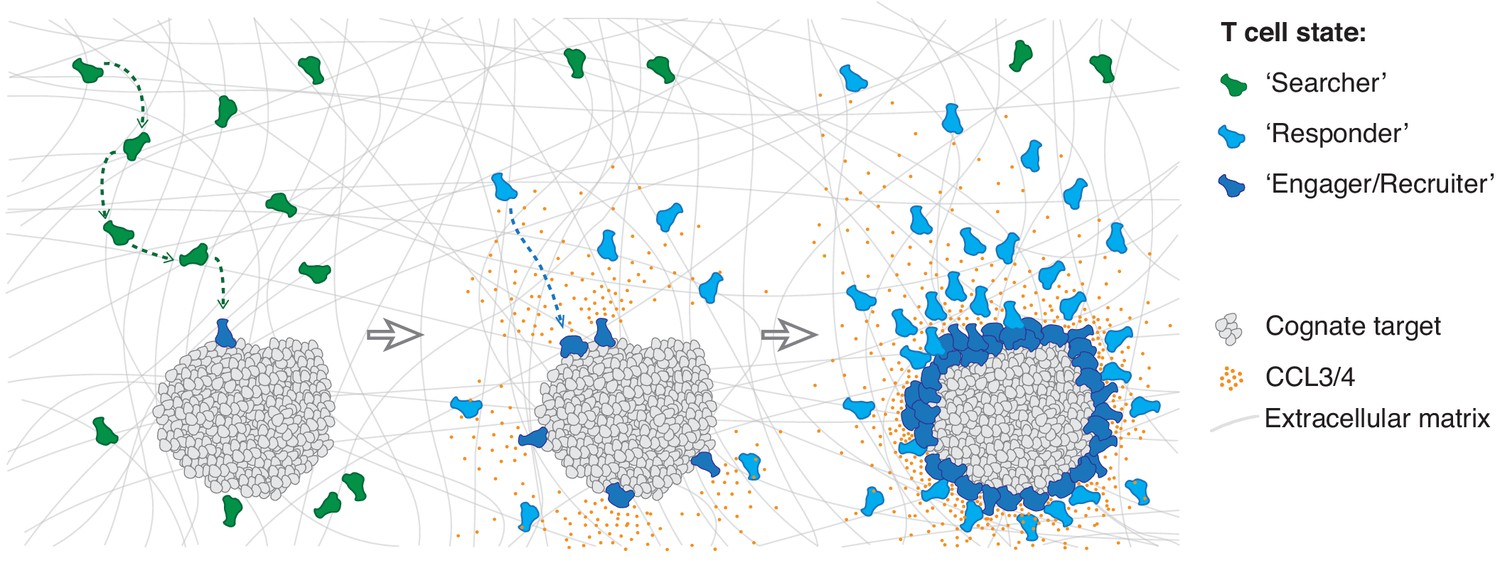
Model of multistate mass recruitment of CTLs to a target site.
‘Searcher’ CTLs migrate randomly in search of target cells. When they recognise targets, they become ‘engager/recruiter’ CTLs that secrete CCL3 and CCL4. CCR5-expressing CTLs within range migrate rapidly and directionally towards the effector site in a ‘responder’ state. Newly arriving CTLs engage and convert to recruiters: they contribute to the chemoattractive signal, thus further amplifying recruitment of other ‘responder’ CTLs from distal regions, resulting in sustained accumulation of large numbers of CTLs at the target site (swarming).
Author response image 1
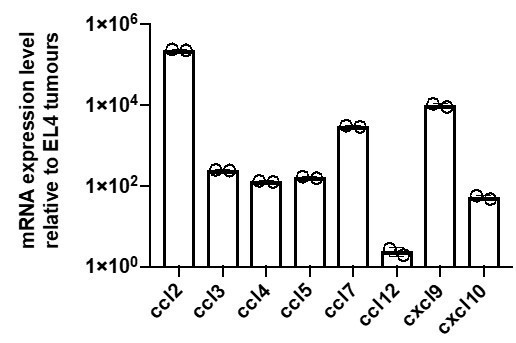
mRNA expression levels of various chemokines in B16 tumour cells relative to EL4 tumour cells as measured by qPCR.
Videos
Video 1
CTLs swarm around a cognate tumouroid.
(Total view) Long-term time-lapse imaging (40 hr) of OT1GFP CTLs (dark) embedded in 3D collagen matrix around cognate EL4 tumouroid (light grey disc). (Inset view) Brightfield (BF) and fluorescence (FL, OT1GFP) imaging of OT1 CTLs amassing at tumouroid edge. Scale bars, 100 µm. Time in h:min.
Video 2
CTLs infiltrate deep into cognate tumour masses embedded with tumour-reactive CTLs.
Long-term (16 hr) time-lapse imaging of OT1 CTLs (green) embedded in collagen matrix around EL4 tumouroid (magenta). (Left) Non-cognate tumouroid; no significant accumulation of CTLs at tumouroid. (Centre) Cognate tumouroid; rapid recruitment and swarming of CTLs around tumouroid edge. (Right) Cognate tumouroid embedded with tumour-reactive CTLs (red); swarming and deep infiltration of tumouroid by CTLs. Scale bar, 500 µm. Time in h:min:s.
Video 3
Tumour-reactive CTLs actively eliminate cognate tumour cells within the tumouroid.
3D time-lapse (3 hr) imaging of OT1 CTLs (green) embedded in a tumouroid composed of cognate tumour cells (purple) and dense collagen matrix. Propidium iodide was added to the medium to detect lysed cells in real time (red). Scale bar, 50 µm. Time in h:min:s.
Video 4
In silico simulations of CTL movements around cognate tumouroid as agent-based processes.
Motility models bootstrapped from experimental data. Gray: tumouroid; green: agents migrating without influence of chemoattractive signal; blue: agents encountering chemoattractant concentrations above threshold migrate directionally; red: agents infiltrating tumouroid. (Left) Agents arrive at tumouroid by random (non-directed) movement only. (Right) Agents arriving at tumouroid secrete diffusing chemoattractant that induces spatial bias in the movement of other agents towards tumouroid. Time in h:min.
Video 5
Tracking individual CTL movements in 3D at high temporal resolution.
3D timelapse (1 hr) imaging of OT1 CTLs (green) embedded in collagen matrix near cognate tumouroid exposing straight interface (out of view to the left) with embedded tumour-reactive CTLs. Track colour, time; scale bar, 50 µm.
Video 6
Tracking individual CTL movements up to 2 mm from tumouroid.
3D time-lapse (2 hr) imaging of OT1 CTLs (green) embedded in collagen matrix adjacent to a tumouroid (magenta). (Top) Non-cognate tumouroid. (Bottom) Cognate tumouroid with embedded tumour-reactive CTLs. Scale bars, 200 µm. Time in h:min:s.
Video 7
Intravital imaging reveals CTL recruitment to site of intratumoural CCL3 injection.
(Injection Process) 2D time-lapse imaging of intratumoural injection of shear-thinning hydrogel containing recombinant CCL3 and Dextran-AF647 (white). (Injection Site) 2D fluorescence confocal image showing tumour tissue with adoptively transferred WT CTLs (green) and CCR5-/- CTLs (magenta) immediately following injection. (Post Injection) 3D long-term (5.6 hr) intravital imaging around intratumoural injection site. Scale bars, 200 μm.
Video 8
Activated primary human T cells engage in homotypic recruitment.
Long-term (14 hr) time-lapse imaging of primary human T cells (green) embedded in collagen around bead-stimulated human T cells (magenta). (Left) Control (IgG-coated) beads. (Right) Activating (anti-CD3/CD28-coated) beads. Scale bar, 500 µm. Time in h:min:s.
Video 9
CAR T cells engaging antigen-expressing glioblastoma tumouroids induce swarming.
Long-term (14 hr) time-lapse imaging of human CAR T cells (green) embedded in collagen matrix around tumouroids (magenta). (Left) Tumouroid contains EphA2-specific CAR T cells and EPhA2-negative cells (NIH/3T3). (Right) Tumouroid contains EphA2-specific CAR T cells and glioblastoma cells (WK1). Scale bar, 500 µm. Time in h:min:s.
Tables
Key resources table
| Reagent type (species) or resource | Designation | Source or reference | Identifiers | Additional information |
|---|---|---|---|---|
| Strain, strain background (M. musculus) | Rag-deficient B6.129S7-Rag < tm1mom > JAusb (RAG1) | Australian BioResources | Used for in vivo experiments | |
| Strain, strain background (M. musculus) | B6.SJL-PtprcaPepcb/BoyJAusb (PTPRCA) | Australian BioResources | Used for in vivo experiments | |
| Strain, strain background (M. musculus) | B6.129p2-ccr5 tm1Kuz/J (CCR5-/-) | Australian BioResources | 7–12 week mice used to isolate CCR5KO CTLs | |
| Strain, strain background (M. musculus) | B6-Tg-OTI (OT1) | Australian BioResources | 7–12 week mice used to isolate OT1 CTLs | |
| Strain, strain background (M. musculus) | B6-Tg(CAG-Lifeact/EGFP)-OTI (OT1GFP) | Galeano Niño et al., 2020 | 7–12 week mice used to isolate LifeactGFP OT1 CTLs | |
| Strain, strain background (M. musculus) | B6.gBT-I/uGFP (gBT1-GFP) | Gift from W. R. Heath | 7–12 week mice used to isolate GFP gBT1 CTLs | |
| Strain, strain background (M. musculus) | B6.gBT-I/dsRED (gBT1-dsRED) | Gift from W. R. Heath | 7–12 week mice used to isolate dsRED gBT1 CTLs | |
| Cell line (M. musculus) | EL-4 lymphoma | ATCC | Cat. #: TIB-39 | |
| Cell line (M. musculus) | NIH/3T3 fibroblast | ATCC | Cat. #: CRL-1658 | |
| Cell line (Homo-sapiens) | WK1 glioblastoma cells | Day et al., 2013 | Cultured as described in Stringer et al., 2019 | |
| Cell line (Homo-sapiens) | GP2-293 embryonic kidney cells | Clonetech | Cat. #: 631458 | |
| Cell line (M. musculus) | mCCL3-mScarletI secreting EL4 cells | This paper | EL4 cells transduced with CCL3-mScarletI construct. Sequence available in Materials and methods. | |
| Cell line (M. musculus) | mCCL4-miRFP670 secreting EL4 cells | This paper | EL4 cells transduced with CCL4-miRFP670 construct. Sequence available in Materials and methods. | |
| Cell line (M. musculus) | ‘CCL3/4-secreting EL4’ i.e. mCCL3-mScarletI and mCCL4-miRFP670 secreting EL4 cells | This paper | EL4 cells transduced with CCL3-mScarletI and CCL4-miRFP670 construct. Sequences available in Materials and methods. | |
| Cell line (M. musculus) | EL4.HSV | This paper | EL4 cells transduced with bicistronic SSIEFARL epitope and mTagBFP2. Sequence available in Materials and methods. | |
| Cell line (M. musculus) | EL4.OVA | This paper | EL4 cells transduced with bicistronic SIINFEKL epitope and mTagBFP2. Sequence available in Materials and methods. | |
| Cell line (Homo-sapiens) | CAR T cells | This paper | Primary human T cells transduced with EphA2-specific CAR construct. Produced by Kramer lab at Children's Cancer Research Unit, The Children's Hospital at Westmead. Information on CAR constructs available in Materials and methods. | |
| Transfected construct (M. musculus) | MSCV-based retrovial expression vector (LENC) | Fellmann et al., 2013 Gift from J. Zuber | http://doi.org/10.1016/j.celrep.2013.11.020 | Retrovirus construct to express cDNA |
| Transfected construct (M. musculus) | pMD2.G | Gift from Didier Trono | Addgene plasmid # 12259; RRID:Addgene_12259 | Construct for VSVG pseudotyping retrovirus |
| Transfected construct (M. musculus) | mCCL3-mScarletI gBlocks | Integrated DNA Technologies | gBlocks cloned into LENC | |
| Transfected construct (M. musculus) | mCCL4-miRFP670 gBlocks | Integrated DNA Technologies | gBlocks cloned into LENC | |
| Transfected construct (M. musculus) | SSIEFARL-mTagBFP2 gBlocks | Integrated DNA Technologies | gBlocks cloned into LENC | |
| Transfected construct (M. musculus) | SIINFEKL-mTagBFP2 gBlocks | Integrated DNA Technologies | gBlocks cloned into LENC | |
| Transfected construct (Homo- sapiens) | EphA2-specific CAR construct | Chow et al., 2013 and Yi et al., 2018 | Construct for lentiviral transduction of human T cells | |
| Biological sample (Homo-sapiens) | Peripheral blood mononuclear cells (PBMCs) | Sydney Children’s Hospitals Network | Used to isolate human T cells | |
| Antibody | Anti-XCL1 (polyclonal goat IgG) | R & D Systems | Cat. #: AF486 RRID:AB_2216915 | (5 µg/ml) |
| Antibody | Anti-CCL1 (monoclonal rat IgG2a) | R & D Systems | Cat. #: MAB845 RRID:AB_2070618 | (5 µg/ml) |
| Antibody | Anti-CXCR2 (monoclonal rat IgG2a) | R & D Systems | Cat. #: MAB2164-100 RRID:AB_358062 | (10 µg/ml) |
| Antibody | Anti-CCL3 (polyclonal goat IgG) | R & D Systems | Cat. #: AF-450-NA RRID:AB_354492 | (5 µg/ml) |
| Antibody | Anti-CCL4 (monoclonal rat IgG2a) | R & D Systems | Cat. #: MAB451-100 RRID:AB_2259676 | (5 µg/ml) |
| Antibody | Anti-CXCR4 (monoclonal rat IgG2b) | R & D Systems | Cat. #: MAB21651-100 RRID:AB_2801441 | (10 µg/ml) |
| Antibody | Anti-CCL5 (polyclonal goat IgG) | R & D Systems | Cat. #: AF478 RRID:AB_10080077 | (1 µg/ml) |
| Antibody | Anti-CCL9/10 (monoclonal rat IgG1) | R & D Systems | Cat. #: MAB463 RRID:AB_2259783 | (5 µg/ml) |
| Antibody | Anti-CXCL10 (monoclonal rat IgG2a) | R & D Systems | Cat. #: MAB466 RRID:AB_2292486 | (1 µg/ml) |
| Antibody | Anti-CXC12 (monoclonal mouse IgG1) | R & D Systems | Cat. #: MAB310 RRID:AB_2276927 | (1 µg/ml) |
| Antibody | Anti-CD3ε (monoclonal Armenian Hamster) | BioLegend | Cat. #: 100302 RRID:AB_312667 | (1 µg/ml) |
| Antibody | Anti-CD28 (monoclonal Syrian Hamster) | BioLegend | Cat. #: 102101 RRID:AB_312866 | (1 µg/ml) |
| Antibody | Rat IgG1, κ Isotype control (Rat monoclonal) | BioLegend | Cat. #: 400402 RRID:AB_326508 | (1 µg/ml) |
| Antibody | Mouse IgG1, κ Isotype control (Mouse monoclonal) | BioLegend | Cat. #: 401401 RRID:AB_2801452 | (1 µg/ml) |
| Antibody | APC anti-CD44 (monoclonal rat IgG2b) | BD Biosciences | Cat. #: 553991 RRID:AB_10050405 | (1 µg/ml) |
| Antibody | Pacific Blue anti-CD8a (monoclonal rat IgG2a) | BD Biosciences | Cat. #: 558106 RRID:AB_397029 | (1 µg/ml) |
| Antibody | Biotin anti-CD3ε (monoclonal Armenian Hamster) | Thermo Fisher Scientific | Cat. #: 13-0031-82 RRID:AB_466319 | (1 µg/ml) |
| Antibody | Biotin anti-CD28 (monoclonal Syrian Hamster) | Thermo Fisher Scientific | Cat. #: 13-0281-82 RRID:AB_466411 | (1 µg/ml) |
| Antibody | Biotin anti-CD3 (monoclonal mouse IgG2a) | Thermo Fisher Scientific | Cat. #: 13-0037-82 RRID:AB_1234955 | (1 µg/ml) |
| Antibody | Biotin anti-CD28 (monoclonal mouse IgG1) | Thermo Fisher Scientific | Cat. #: 13-0289-82 RRID:AB_466415 | (1 µg/ml) |
| Antibody | Biotin rat IgG2a κ Isotype Control (Rat polyclonal) | eBioscience | Cat. #: 13-4321-82 RRID:AB_470084 | (1 µg/ml) |
| Antibody | Biotin IgG Isotype Control (Armenian hamster) | eBioscience | Cat. #: 14-4888-81 RRID:AB_470128 | (1 µg/ml) |
| Antibody | Brilliant Violet 711 anti-CD11b (monoclonal rat IgG2b) | BioLegend | Cat. #: 101241 RRID:AB_11218791 | (2 µg/ml) |
| Antibody | Alexa Fluor 488 anti-NK1.1 (monoclonal mouse IgG2a) | BioLegend | Cat. #: 108717 RRID:AB_493184 | (2 µg/ml) |
| Antibody | FITC anti-Ly-6C (monoclonal rat IgG2c) | BioLegend | Cat. #: 128005 RRID:AB_1186134 | (2 µg/ml) |
| Antibody | Brilliant Violet 510 anti-CD90.2 (monoclonal rat IgG2b) | BioLegend | Cat. #: 105335 RRID:AB_2566587 | (2 µg/ml) |
| Antibody | Brilliant Violet 421 anti-CD64 (monoclonal mouse IgG1) | BioLegend | Cat. #: 139309 RRID:AB_AB_2562694 | (2 µg/ml) |
| Antibody | APC/Fire 750 anti-CD45 (monoclonal rat IgG2b) | BioLegend | Cat. #: 103153 RRID:AB_2572115 | (2 µg/ml) |
| Antibody | APC/Fire 750 anti-CD45.1 (monoclonal mouse IgG2a) | BioLegend | Cat. #: 110751 RRID:AB_2629805 | (2 µg/ml) |
| Antibody | FITC anti-CD11c (monoclonal Armenian Hamster) | BioLegend | Cat. #: 117305 RRID:AB_313774 | (2 µg/ml) |
| Antibody | Pacific blue anti-MHC class II (monoclonal rat IgG2b) | BioLegend | Cat. #: 107619 RRID:AB_493528 | (2 µg/ml) |
| Antibody | APC anti-CD8a (monoclonal rat IgG2a) | BioLegend | Cat. #: 100711 RRID:AB_312750 | (2 µg/ml) |
| Antibody | Biotin anti-CCL3 (polyclonal Rabbit sera) | PeproTech | Cat. #: 500-P121BT | (1 µg/ml) |
| Peptide, recombinant protein | OVA257-264 peptide, SIINFEKL | AusPep | Cat. #: 2711 | (1, 0.2, 0.1, 0.02, 0.001 µg/ml) |
| Peptide, recombinant protein | gB498-505 peptide, SSIEFARL | Auspep | Cat. #: gb498-505 | (1 µg/ml) |
| Peptide, recombinant protein | Recombinant mouse IL-2 | BioLegend | Cat. #: 575408 | (100 ng/ml) |
| Peptide, recombinant protein | Recombinant human IL-7 | Miltenyi Biotech Australia | Cat. #: 130-095-362 | (10 ng/ml) |
| Peptide, recombinant protein | Recombinant human IL-15 | Miltenyi Biotech Australia | Cat. #: 130-095-764 | (5 ng/ml) |
| Peptide, recombinant protein | Corning Collagen I Rat Tail Natural | In Vitro Technologies | Cat. #: FAL354236 | (~1.5 mg/ml) |
| Peptide, recombinant protein | Monobiotinylated H-2Kb/SIINFEKL | Tetramer Synthesis Service | John Curtin School of Medical Research | (1 µg/ml) |
| Peptide, recombinant protein | Recombinant human (cross reactive with murine) CCL1 | Peprotech | Cat. #: 300–37 | (1, 10 and 100 ng/ml) |
| Peptide, recombinant protein | Recombinant Mouse XCL1 | R & D systems | Cat. #: 486-LT-025 | (1, 10 and 100 ng/ml) |
| Peptide, recombinant protein | Recombinant Murine CCL3 | Peprotech | Cat. #: 250–09 | (1, 10 and 100 ng/ml) |
| Peptide, recombinant protein | Recombinant Murine CCL4 | Peprotech | Cat. #: 250–32 | (1, 10 and 100 ng/ml) |
| Peptide, recombinant protein | Recombinant Murine CCL5 | Peprotech | Cat. #: 250–07 | (1, 10 and 100 ng/ml) |
| Peptide, recombinant protein | Recombinant murine CCL9/10 | Peprotech | Cat. #: 250–12 | (1, 10 and 100 ng/ml) |
| Peptide, recombinant protein | Recombinant murine CXCL10 | Peprotech | Cat. #: 250–16 | (1, 10 and 100 ng/ml) |
| Peptide, recombinant protein | Recombinant Human CXCL12 | Peprotech | Cat. #: 300-28A | (1, 10 and 100 ng/ml) |
| Peptide, recombinant protein | Lysyl Endopeptidase, Mass Spectrometry Grade (Lys-C) | FUJIFILM Wako Pure Chemical Corp | Cat. #: 121–05063 | (1 µg) |
| Sequence-based reagent | TruSeq Stranded mRNA | Illumina | Cat. #: 20020594 | |
| Chemical compound, drug | CellTracker Orange 5-(and-6)-(((4-chloromethyl) benzoyl) amino) tetramethylrhodamine (CMTMR) | Invitrogen | Cat. #: C2927 | (5 µM) |
| Chemical compound, drug | CellTracker Deep Red | Invitrogen | Cat. #: C34565 | (1 µM) |
| Chemical compound, drug | CellTracker Green 5-chloromethylfluorescein diacetate (CMFDA) | Invitrogen | Cat. #: C7025 | (5 µM) |
| Chemical compound, drug | Ketamine | Provet Pty Ltd | Cat. #: KETAM I | (100 mg/kg) |
| Chemical compound, drug | Xylazine | Provet Pty Ltd | Cat. #: XYLA Z2 | (15 mg/kg) |
| Chemical compound, drug | Pertussis toxin from Bordetella pertussis (PTX) | Sigma Aldrich | Cat. #: P7208 | (100 ng/ml) |
| Chemical compound, drug | Inactive mutated version of Pertussis toxin from Bordetella pertussis (m-PTX) | Sigma Aldrich | Cat. #: PT-16.0003 | (100 ng/ml) |
| Chemical compound, drug | Maraviroc (CCR5 antagonist) | Sigma Aldrich | Cat. #: PZ0002-5mg | (10 µg/ml) |
| Chemical compound, drug | Cenicriviroc (CCR2 + CCR5 dual inhibitor) | AdooQ Bioscience | Cat. #: A13632-10 (000–22038) | (1 µM) |
| Chemical compound, drug | CCR2 antagonist | Santa Cruz Biotechnology Inc | Cat. #: sc-202525 | (1 µM) |
| Chemical compound, drug | UCB35625 (CCR1 + CCR3 dual inhibitor) | R & D Systems | Cat. #: 2757/1 | (50 µM) |
| Chemical compound, drug | Iodoacetamide (IAM) | Sigma Aldrich | Cat. #: I6125-5G | (1 M) |
| Chemical compound, drug | Dithiothreitol (DTT) | Sigma Aldrich | Cat. #: 43816–10 ML | (50 mM) |
| Commercial assay or kit | EasySep Direct Human T Cell Isolation Kit | Stem Cell Technologies | Cat. #: 19661 | |
| Commercial assay or kit | T Cell TransAct, human | Miltenyi Biotech Australia | Cat. #: 130-111-160 | |
| Commercial assay or kit | EasySep Human CD19 Positive Selection Kit II | Stem Cell Technologies | Cat. #: 17854 | |
| Commercial assay or kit | RNeasy Mini Kit | Qiagen | Cat. #: 74104 | |
| Commercial assay or kit | High-Capacity cDNA Reverse Transcription Kit | ThermoFisher Scientific | Cat. #: 4368814 | |
| Commercial assay or kit | Sandwich ELISA kits (CCL1) | OriGene Technologies | Cat. #: EA100390 | |
| Commercial assay or kit | Sandwich ELISA kits (CCL9) | OriGene Technologies | Cat. #: EA100725 | |
| Commercial assay or kit | Cytometric Bead Array: Multi-Analyte Flow Assay Kit (CCL3, CCL4, CCL5, CXCL10, TNF-α and IFN-γ) | LEGENDplex | Custom mouse panel | |
| Commercial assay or kit | BD Cytometry Beads array Mouse MIP-1b Flex Set (Bead C9) | BD Biosciences | Cat. #: 558343 | |
| Commercial assay or kit | BD Cytometry Beads array Mouse MIP-1a Flex Set (Bead C7) | BD Biosciences | Cat. #: 558449 | |
| Commercial assay or kit | CellTrace CFSE Proliferation Kit | ThermoFisher Scientific | Cat. #: C34554 | |
| Commercial assay or kit | CellTrace Violet Proliferation Kit | ThermoFisher Scientific | Cat. #: C34571 | |
| Commercial assay or kit | Cytofix/Cytoperm Plus Kit (with BD GolgiStop) | BD Bioscience | Cat. #: 554715 | |
| Software, algorithm | FlowJo software version 10.2 | Tree Star Inc | flowjo.com | |
| Software, algorithm | Prism GraphPad Software version 8 | GraphPad | Imaris.oxinst.com | |
| Software, algorithm | Leica Application Suite (LAS) X software version 3.3.0.16794 | Leica Microsystems | Leica-microsystems.com | |
| Software, algorithm | FLUOstaromega software version 5.10 R2 | BMG Labtech GmbH | Bmglabtech.com | |
| Software, algorithm | CFX Manager Software | Bio-Rad | Bio-rad.com | |
| Software, algorithm | BioStation IM software | Nikon | nikon.com | |
| Software, algorithm | ImageJ/FIJI | US National Institutes of Health | Imagej.net | |
| Software, algorithm | Matlab | Mathworks | Mathworks.com | |
| Software, algorithm | R | R Core Team | r-project.org | |
| Software, algorithm | Plot2 for Mac 2.6.1 | Mike Wesemann | apps.micw.org | |
| Software, algorithm | motilisim | Read et al., 2016 | https://github.com/marknormanread/TcellSwarming | |
| Software, algorithm | FastQC (version 0.11.5) | Babraham Institute | bioinformatics.babraham.ac.uk | |
| Software, algorithm | Trimmomatic (version 0.36) | Bolger, A. M., Lohse, M., and Usadel, B. | usadellab.org | |
| Software, algorithm | FeatureCounts (version 1.5.1) | Bioconductor | bioconductor.org | |
| Software, algorithm | STRING DB | ELIXIR | string-db.org | |
| Software, algorithm | MaxQuant (version 1.5.8.3) | Max Plank Insitute of Biochemistry | maxquant.org | |
| Software, algorithm | LFQ Analyst | Monash University | bioinformatics.erc.monash.edu/apps/LFQ-Analyst | |
| Software, algorithm | Limma | Bioconductor | bioconductor.org | |
| Software, algorithm | Motility_analysis package | Python Software Foundation | https://github.com/marknormanread/TcellSwarming | |
| Other | Streptavidin-coated polystyrene particles | Spherotech Inc | Cat. #: SVP-60–5 | 6.0–8.06 µm diameter |
| Other | SPHERO AccuCount blank particles | Spherotech Inc | Cat. #: QACBP-70–10 | |
| Other | Sera-Mag Speed beads | ThermoFisher Scientific | Cat. #: 65152105050250 | |
| Other | Sera-Mag Speed beads | ThermoFisher Scientific | Cat. #: 45152105050250 | |
| Other | Trypsin-gold | Promega | Cat. #: V5280 | |
| Other | Dimethyl sulfoxide (DMSO) | Sigma-Aldrich | Cat. #: D2650-100ml | |
| Other | Collagenase IV | Sigma-Aldrich | Cat. #: C5138-1G | |
| Other | 4’, 6-Diamidino-2-phenylindole (DAPI) | ThermoFisher Scientific | Cat. #: D3571 | (0.5 µg/ml) |
| Other | 10 kDA Dextran labelled with AlexaFluor647 (Dextran-AF647) | ThermoFisher Scientific | Cat. #: D22914 | (10 µg/ml) |
| Other | Fmoc-Asp-Wand resin | GL Biochem | Cat. #: 40501 | |
| Other | 1-hydroxybenzotriazole (HOBt) | GL Biochem | Cat. #: 2592-95-2 | |
| Other | 2-(1H-Benzotriazole-1-yl)−1,1,3,3-Tetramethyluronium hexafluorophosphate (HBTU) | GL Biochem | Cat. #: 94790-37-1 |
Additional files
-
Supplementary file 1
Transcriptomics.
Transcriptomics data of CTLs alone, in indicated conjugations or exposed to indicated supernatants from conjugations with tumour cells. Values are read counts obtained from featureCounts after alignment with TopHat2 to the GRCm38 reference genome.
- https://cdn.elifesciences.org/articles/56554/elife-56554-supp1-v3.xlsx
-
Supplementary file 2
Secretomics.
Tables detailing secreted proteins identified by quantitative mass spectrometry analysis, including the proteins exhibiting significant differences between the cognate versus non-cognate cells and beads.
- https://cdn.elifesciences.org/articles/56554/elife-56554-supp2-v3.xlsx
-
Transparent reporting form
- https://cdn.elifesciences.org/articles/56554/elife-56554-transrepform-v3.pdf
Download links
A two-part list of links to download the article, or parts of the article, in various formats.
Downloads (link to download the article as PDF)
Open citations (links to open the citations from this article in various online reference manager services)
Cite this article (links to download the citations from this article in formats compatible with various reference manager tools)
Cytotoxic T cells swarm by homotypic chemokine signalling
eLife 9:e56554.
https://doi.org/10.7554/eLife.56554


