Parkin contributes to synaptic vesicle autophagy in Bassoon-deficient mice
- German Center for Neurodegenerative Diseases (DZNE), Germany
- Charité – Universitätsmedizin Berlin, Institute of Neurobiology, Germany
- NeuroCure Cluster of Excellence, Charité – Universitätsmedizin Berlin, Germany
- Leibniz Institute for Neurobiology, Germany
- Center for Behavioral Brain Sciences (CBBS), Germany
- Institute of Biology (IBIO), Otto von Guericke University Magdeburg, Germany
- Einstein Center for Neurosciences Berlin, Germany
- Charité – Universitätsmedizin Berlin, Institute of Biochemistry, Core Facility High Throughput Mass Spectrometry, Germany
- Molecular Neurobiology, Medical Faculty, Otto von Guericke University, Germany
- Institute for Pharmacology and Toxicology, Medical Faculty, Otto von Guericke University, Germany
Figures
Figure 1 with 2 supplements

Expression of the Bsn fragment 1–609 (Bsn609) spanning both ZnF domains is sufficient to block autophagy induction in Bassoon KO neurons.
(A–B) Representative images of hippocampal neurons from WT and Bsn KO mice expressing FU-RFP-LC3 only (A) or FU-RFP-LC3 and FU-Bsn609-eGFP (B) that were fixed and stained with antibodies against Synaptophysin1 (Syp). (C–E) Quantification of the number of RFP-LC3 puncta per 10 μm axon (C) (WT = 0.53 ± 0.067, n = 42 axons, 3 independent experiments; Bsn KO = 0.92 ± 0.066, n = 43 axons, 3 independent experiments; WT + Bsn609 = 0.53 ± 0.071, n = 26 axons, 3 independent experiments; Bsn KO + Bsn609 = 0.55 ± 0.069, n = 29 axons, 3 independent experiments; p***=0.0001, p**=0,001, p**=0.0011), the number of Syp1 puncta per 10 μm axon (D) (WT = 2.02 ± 0.148, n = 42 axons, 3 independent experiments; Bsn KO = 1.69 ± 0.088, n = 43 axons, 3 independent experiments; WT + Bsn609 = 2.28 ± 0.138, n = 26 axons, 3 independent experiments; Bsn KO + Bsn609 = 2.24 ± 0.210, n = 29 axons, 3 independent experiments; p*=0.0292, p*=0.0431) and the colocalization of RFP-LC3 and Syp1 (E) (WT = 7.45 ± 1.724, n = 42 axons, 3 independent experiments; Bsn KO = 23.71 ± 2.679, n = 43 axons, 3 independent experiments; WT + Bsn609 = 14.35 ± 2.796, n = 26 axons, 3 independent experiments; Bsn KO + Bsn609 = 14.74 ± 4.095, n = 29 axons, 3 independent experiments; p****<0.0001). Scale bars: 5 μm. Error bars represent SEM. Data points represent axons. ANOVA Tukey’s multiple comparisons test was used to evaluate statistical significance.
Figure 1—figure supplement 1
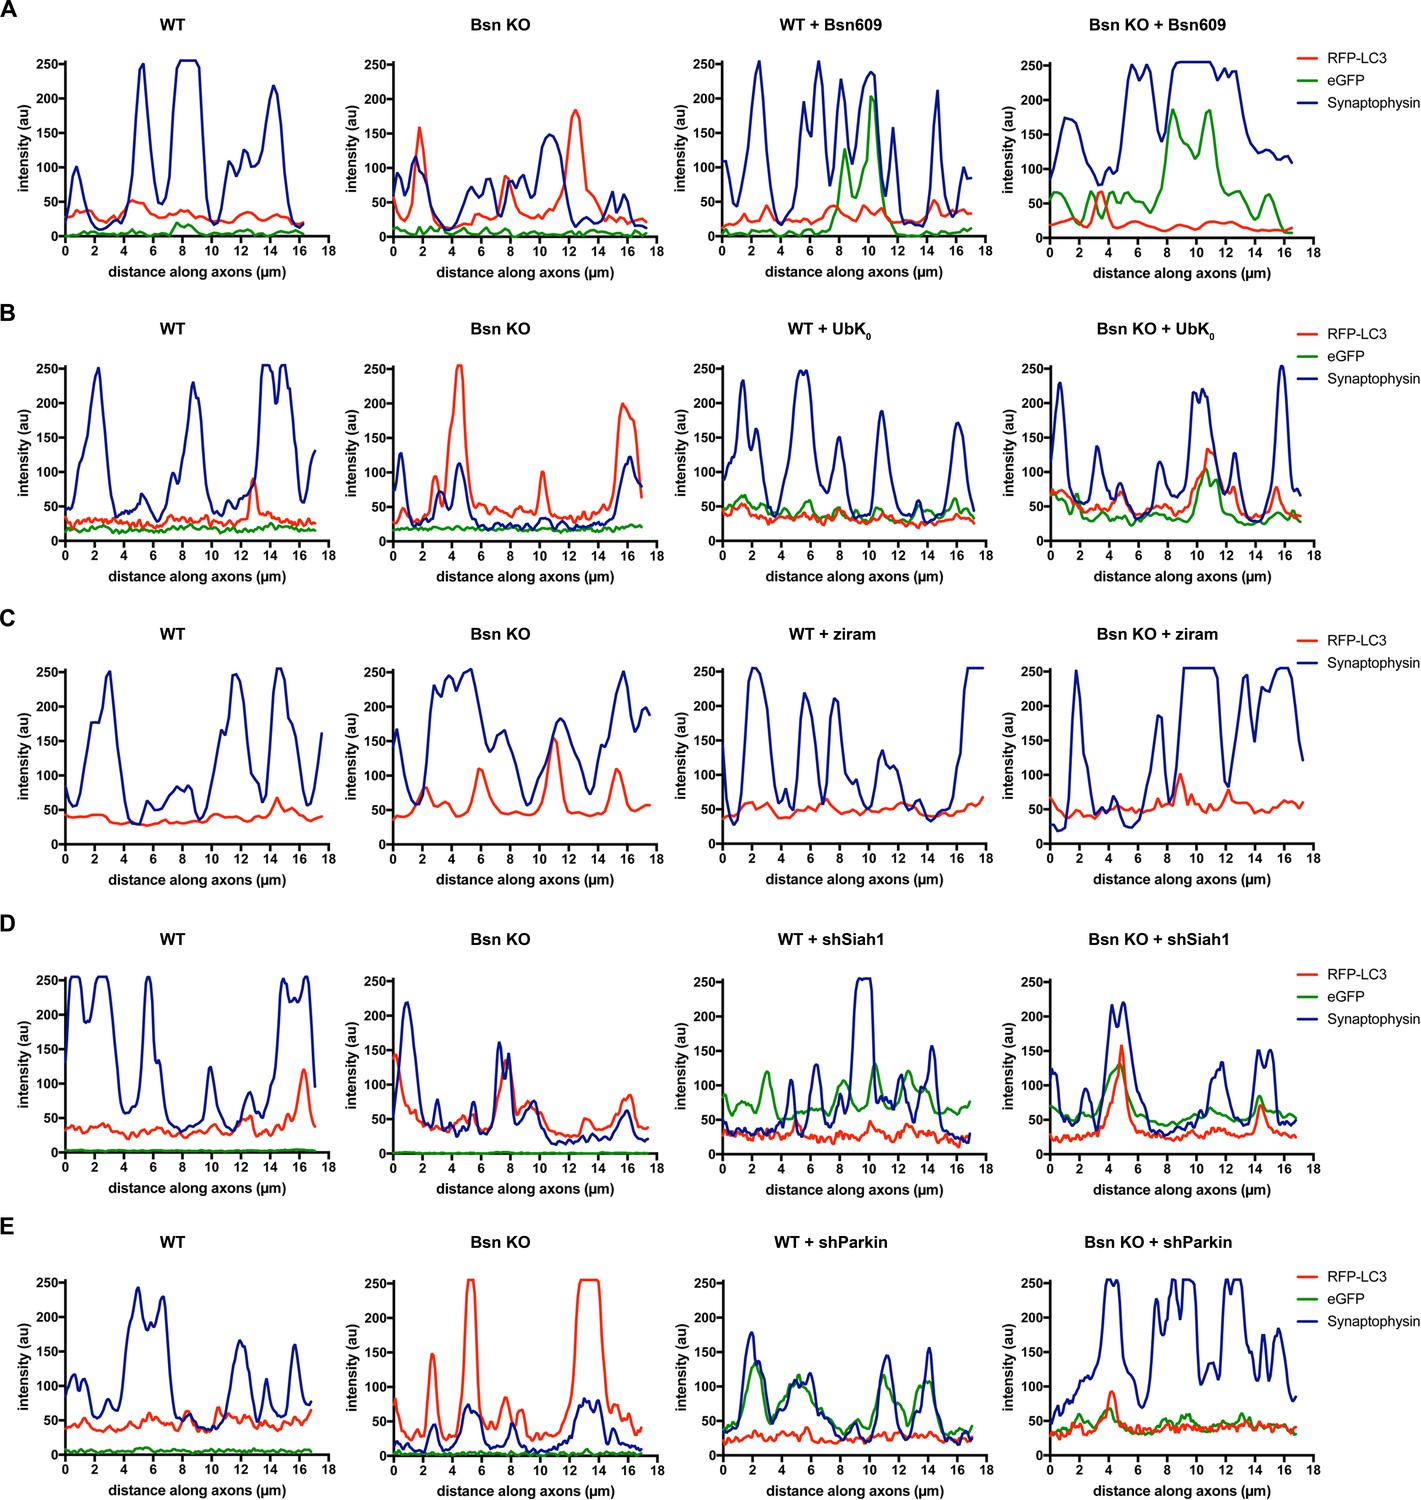
Line scans of example images to illustrate colocalization of RFP-LC3 and Synaptophysin1.
(A) Line scans of representative images of hippocampal neurons from WT and Bsn KO mice expressing FU-RFP-LC3 only or FU-RFP-LC3 and FU-Bsn609-eGFP that were fixed and stained with antibodies against Synaptophysin1 (Syp) from Figure 1. (B) Line scans of representative images of hippocampal neurons from WT and Bsn KO mice expressing FU-RFP-LC3 only or FU-RFP-LC3 and FU-UbK0 that were fixed and stained with antibodies against Synaptophysin1 (Syp) from Figure 2. (C) Line scans of representative images of hippocampal neurons from WT and Bsn KO mice expressing FU-RFP-LC3, either left untreated or treated with 1 μM ziram for 16 hr, that were fixed and stained with antibodies against Synaptophysin1 (Syp) from Figure 2—figure supplement 1. (D) Line scans of representative images of hippocampal neurons from WT and Bsn KO mice expressing FU-RFP-LC3 only or FU-RFP-LC3 and shRNA against Siah1 (FU-shSiah1) that were fixed and stained with antibodies against Synaptophysin1 (Syp) from Figure 7. (E) Line scans of representative images of hippocampal neurons from WT and Bsn KO mice expressing FU-RFP-LC3 only or FU-RFP-LC3 and shRNA against Parkin (FU-shParkin) that were fixed and stained with antibodies against Synaptophysin1 (Syp) from Figure 8.
Figure 1—figure supplement 2
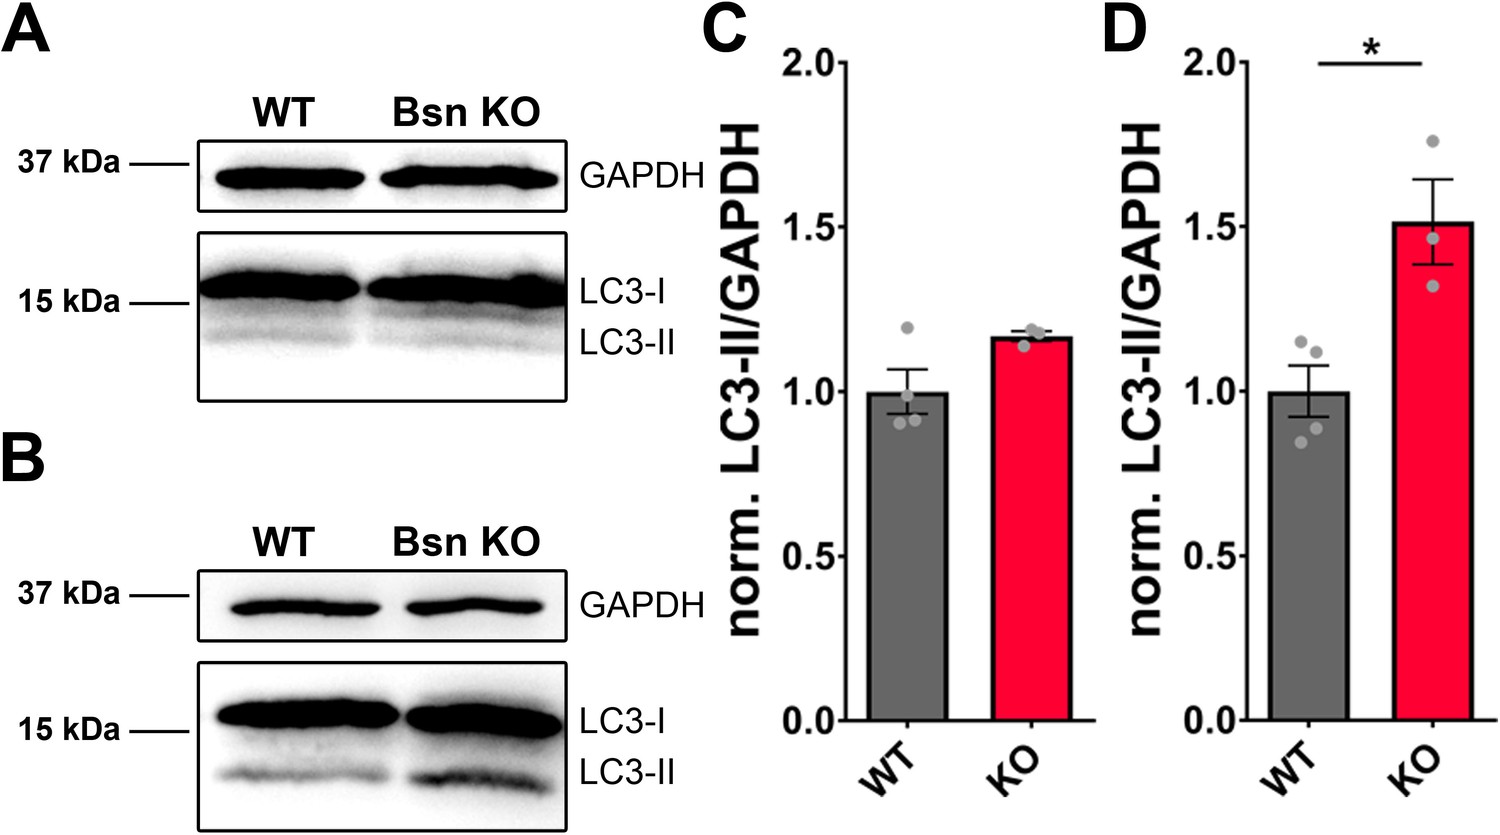
LC3-II levels are specifically increased in synaptosomal preparations from Bassoon KO mice.
(A–B) Western blot of homogenates (A) and synaptosomal preparations (B) from WT and Bsn KO mice stained with antibodies against LC3 and GAPDH. (C–D) Quantification of normalized LC3-II/GAPDH from homogenates (C) (WT = 1 ± 0.067, n = 4 animals; Bsn KO = 1.17 ± 0.015, n = 3 animals) and synaptosomal preparations (D) (WT = 1 ± 0.078, n = 4 animals; Bsn KO = 1.52 ± 0.130, n = 3 animals; p*=0.0154). Error bars represent SEM. Data points represent animals. Unpaired t test was used to evaluate statistical significance.
Figure 2 with 1 supplement
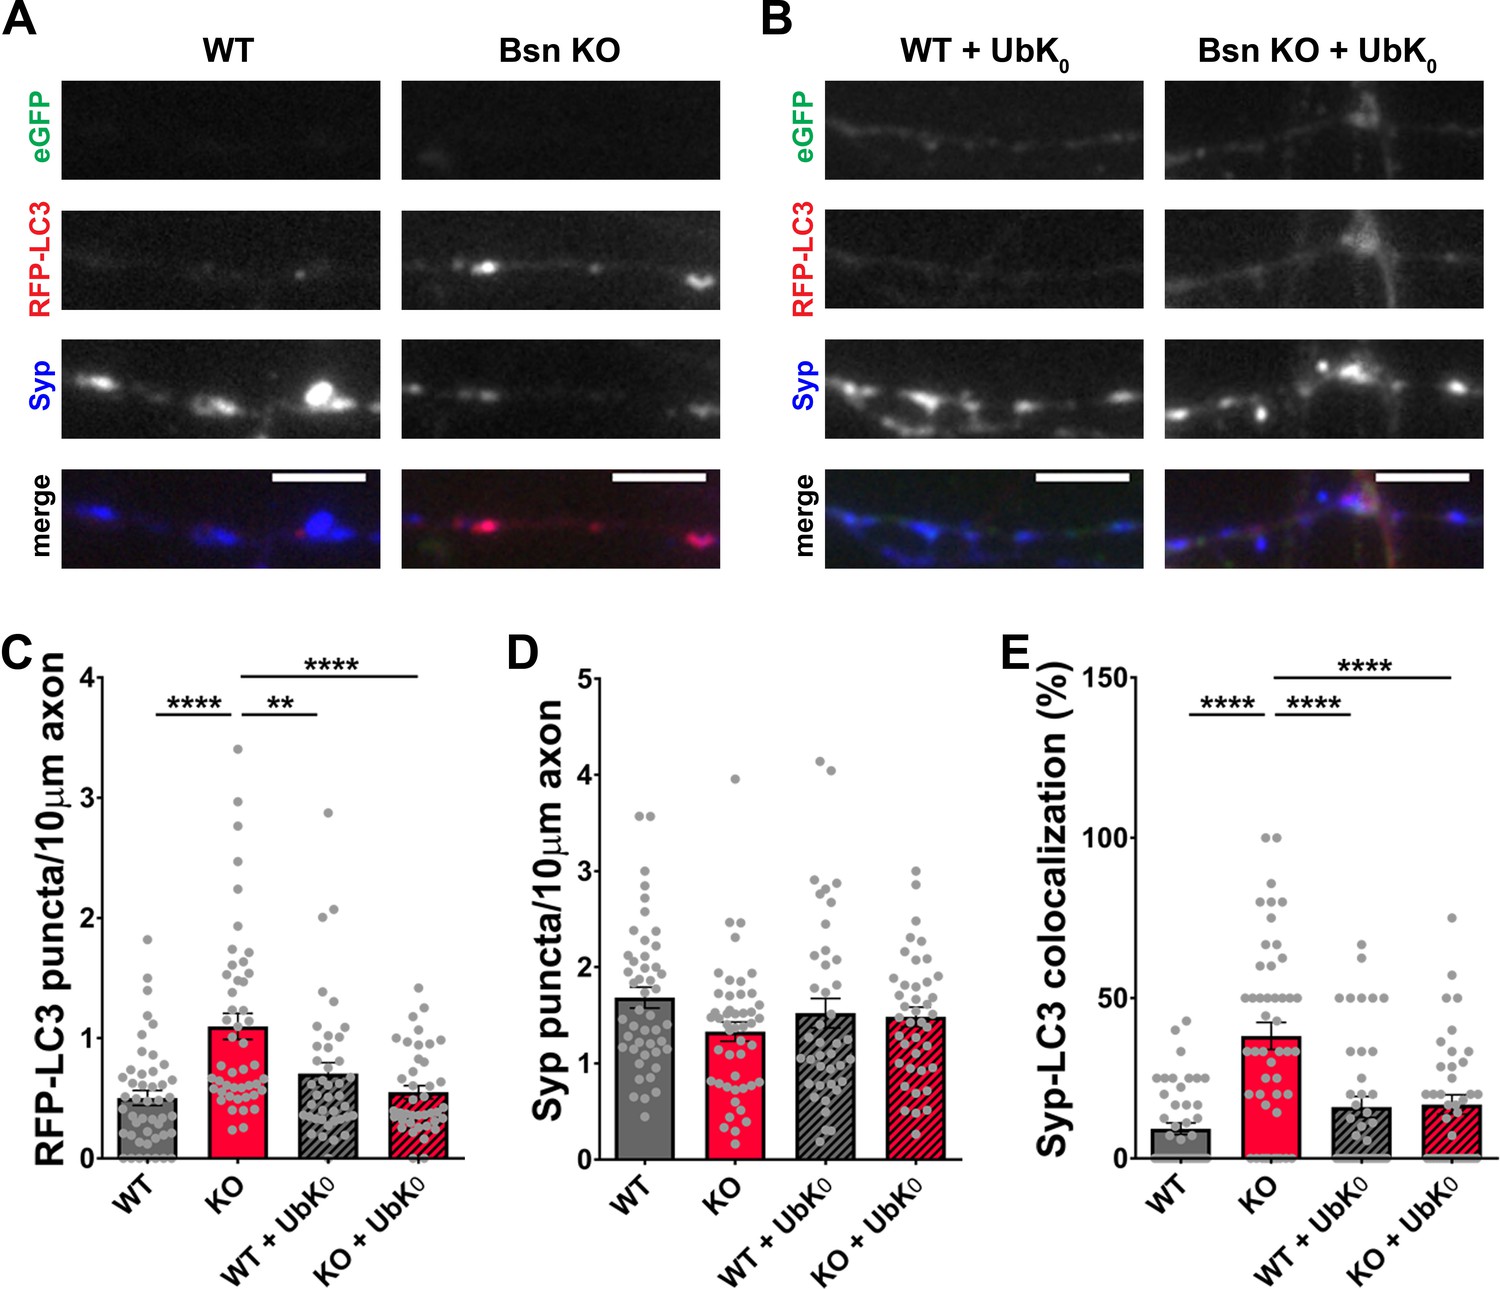
Poly-ubiquitination is required for increased autophagy in Bassoon KO neurons.
(A–B) Representative images of hippocampal neurons from WT and Bsn KO mice expressing FU-RFP-LC3 only (A) or FU-RFP-LC3 and FU-UbK0 (B) that were fixed and stained with antibodies against Synaptophysin1 (Syp). FU-UbK0 vector co-expresses a soluble eGFP that enables the identification and quantification of axons from infected neurons only. (C–E) Quantification of the number of RFP-LC3 puncta per 10 μm axon (C) (WT = 0.50 ± 0.063, n = 46 axons, 3 independent experiments; Bsn KO = 1.10 ± 0.108, n = 47 axons, 3 independent experiments; WT + UbK0 = 0.70 ± 0.091, n = 40 axons, 3 independent experiments; Bsn KO + UbK0 = 0.55 ± 0.055, n = 40 axons, 3 independent experiments; p****<0.0001, p**=0.0060, p****<0.0001), the number of Syp1 puncta per 10 μm axon (D) (WT = 1.68 ± 0.109, n = 46 axons, 3 independent experiments; Bsn KO = 1.33 ± 0.100, n = 47 axons, 3 independent experiments; WT + UbK0 = 1.52 ± 0.153, n = 40 axons, 3 independent experiments; Bsn KO + UbK0 = 1.48 ± 0.102, n = 40 axons, 3 independent experiments) and the colocalization of RFP-LC3 and Syp1 (E) (WT = 9.23 ± 1.809, n = 46 axons, 3 independent experiments; Bsn KO = 38.19 ± 4.211, n = 47 axons, 3 independent experiments; WT + UbK0 = 16.04 ± 3.269, n = 40 axons, 3 independent experiments; Bsn KO + UbK0 = 16.82 ± 3.014, n = 40 axons, 3 independent experiments; p****<0.0001, p****<0.0001, p****<0.0001). Scale bars: 5 μm. Error bars represent SEM. Data points represent axons. ANOVA Tukey’s multiple comparisons test was used to evaluate statistical significance.
Figure 2—figure supplement 1

Inhibition of E1 enzyme by ziram blocks autophagy induction in Bassoon KO neurons.
(A–B) Representative images of hippocampal neurons from WT and Bsn KO mice expressing FU-RFP-LC3, either left untreated or treated with 1 μM ziram for 16 hr, that were fixed and stained with antibodies against Synaptophysin1 (Syp). (C–E) Quantification of the number of RFP-LC3 puncta per 10 μm axon (C) (WT = 0.18 ± 0.034, n = 33 axons, 2 independent experiments; Bsn KO = 0.53 ± 0.085, n = 31 axons, 2 independent experiments; WT + ziram = 0.22 ± 0.058, n = 26 axons, 2 independent experiments; Bsn KO + ziram = 0.26 ± 0.057, n = 25 axons, 2 independent experiments; p***=0.0002, p**=0.0026, p*=0.0149), the number of Syp1 puncta per 10 μm axon (D) (WT = 2.61 ± 0.141, n = 33 axons, 2 independent experiments; Bsn KO = 2.51 ± 0.184, n = 31 axons, 2 independent experiments; WT + ziram = 2.40 ± 0.165, n = 26 axons, 2 independent experiments; Bsn KO + ziram = 2.63 ± 0.156, n = 25 axons, 2 independent experiments) and the colocalization of RFP-LC3 and Syp1 (E) (WT = 5.01 ± 1.541, n = 33 axons, 2 independent experiments; Bsn KO = 13.71 ± 2.708, n = 31 axons, 2 independent experiments; WT + ziram = 3.19 ± 1.484, n = 26 axons, 2 independent experiments; Bsn KO + ziram = 3.64 ± 1.386, n = 25 axons, 2 independent experiments; p**=0.0058, p**=0.0012, p**=0.0025). Scale bars: 5 μm. Error bars represent SEM. Data points represent axons. ANOVA Tukey’s multiple comparisons test was used to evaluate statistical significance.
Figure 3
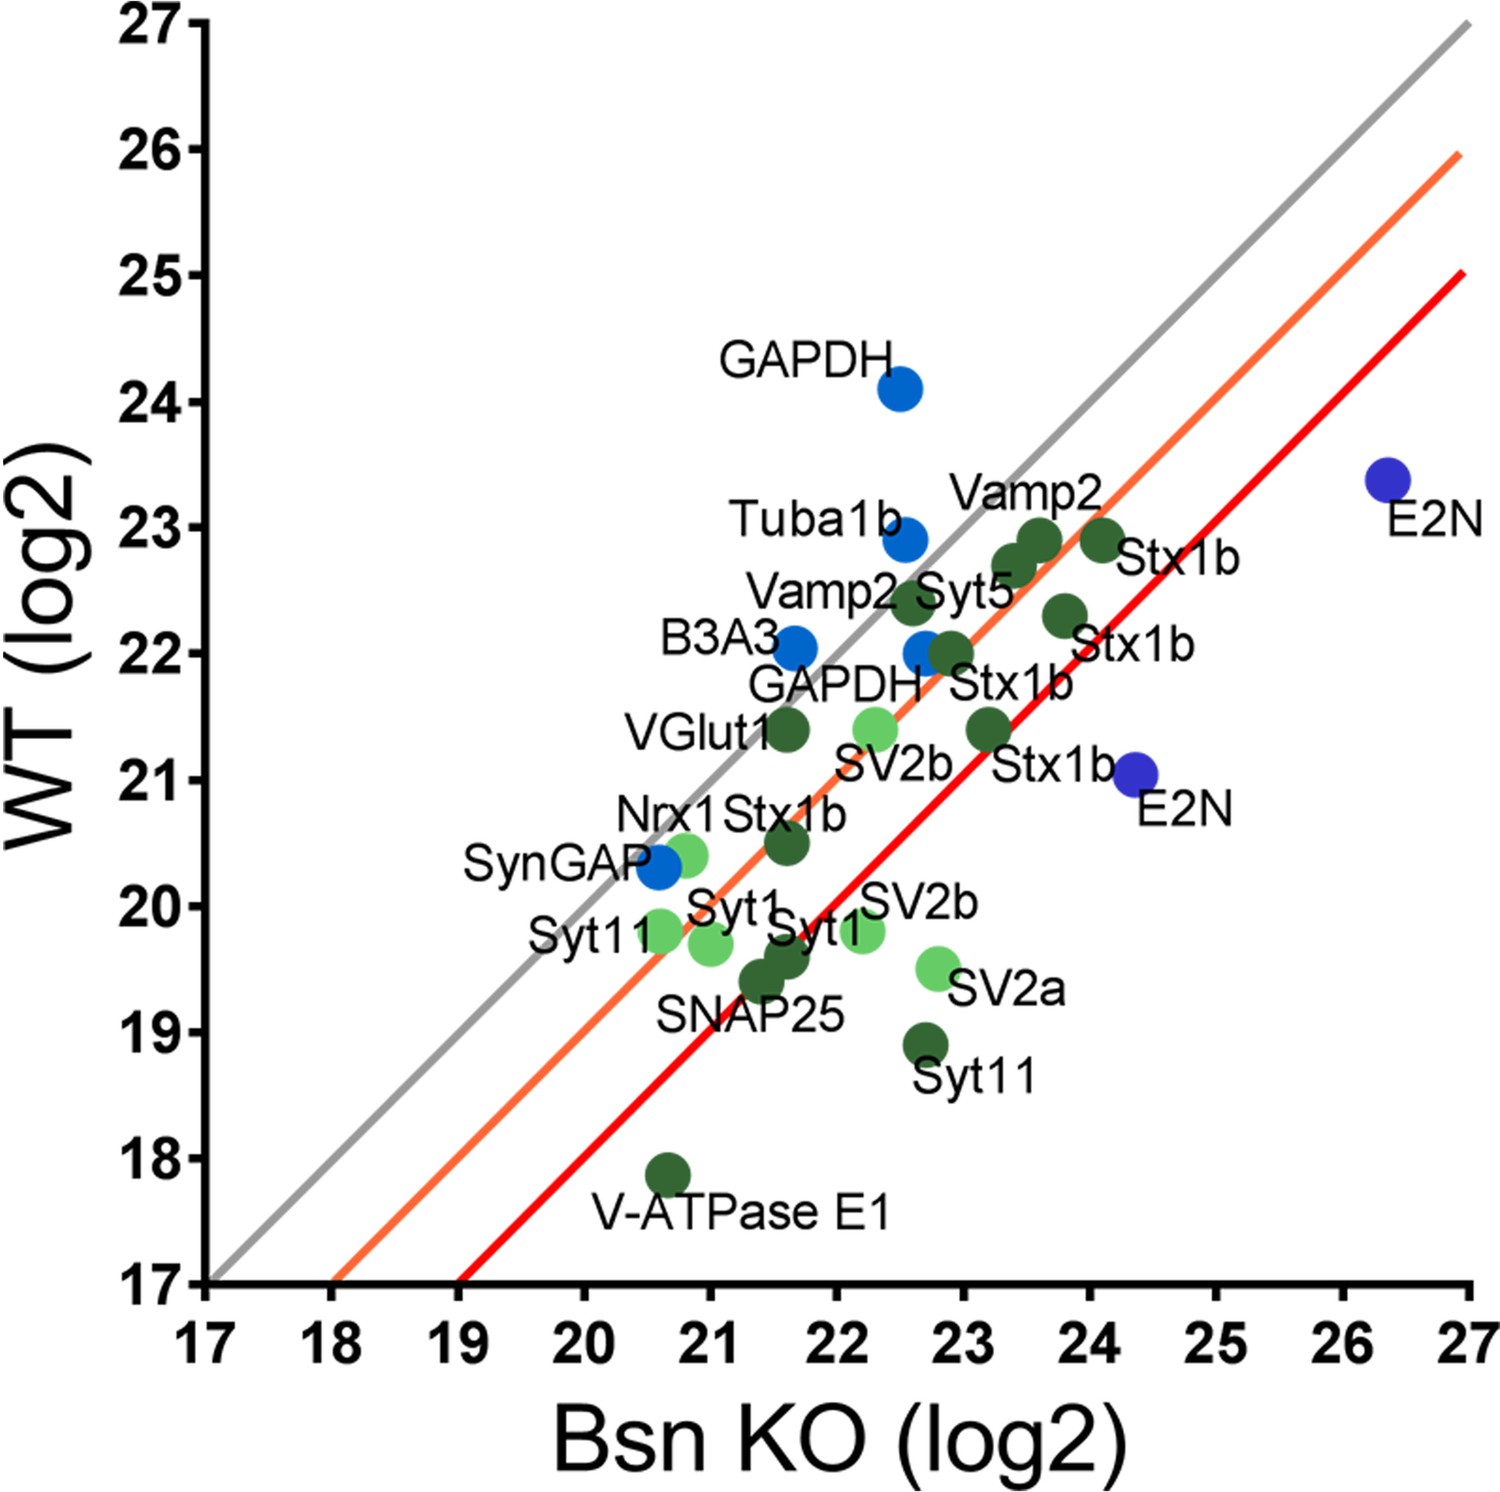
Mass spectrometry analyses reveal high levels of ubiquitinated SV-associated proteins in synaptosomal preparations from Bassoon KO mice.
Before LC-MS/MS measurements, ubiquitinated peptides were immunoprecipitated with ubiquitin remnant motif antibody K-ε-GG. Scatterplot showing log2 intensities of detected ubiquitinated peptides (enriched for remnant GlyGly (K) sites) from synaptosomes prepared from cortices of 15-week-old WT and Bsn KO mice. Lysine-containing peptides can be ubiquitinated in more than one position (e.g. 5x Stx1b). Log2 intensities of IP enriched peptides from ubiquitously expressed and postsynaptic proteins in blue and presynaptic proteins in green (dark green = unambiguously identified, light green = ambiguously identified). Unambiguous identification equals Mascot score >40, ppep <0.001, ambiguous identification equals Mascot score <40 and ppep >0.001. The orange line describes a 2-fold and the red line a 4-fold increase. Data points represent ubiquitinated peptides. Three animals were used per genotype.
-
Figure 3—source data 1
Mass spectrometry analyses.
Detailed mass spectrometry information on ubiquitinated peptides depicted in Figure 3. This table includes the full name of the protein, the ubiquitination site(s) within the peptide (in amino acids), the quantification of the peptides (log2) for both WT and Bsn KO neurons, the fold increase in ubiquitinated peptides and the Mascot and Andromeda scores.
- https://cdn.elifesciences.org/articles/56590/elife-56590-fig3-data1-v2.docx
Figure 4 with 2 supplements
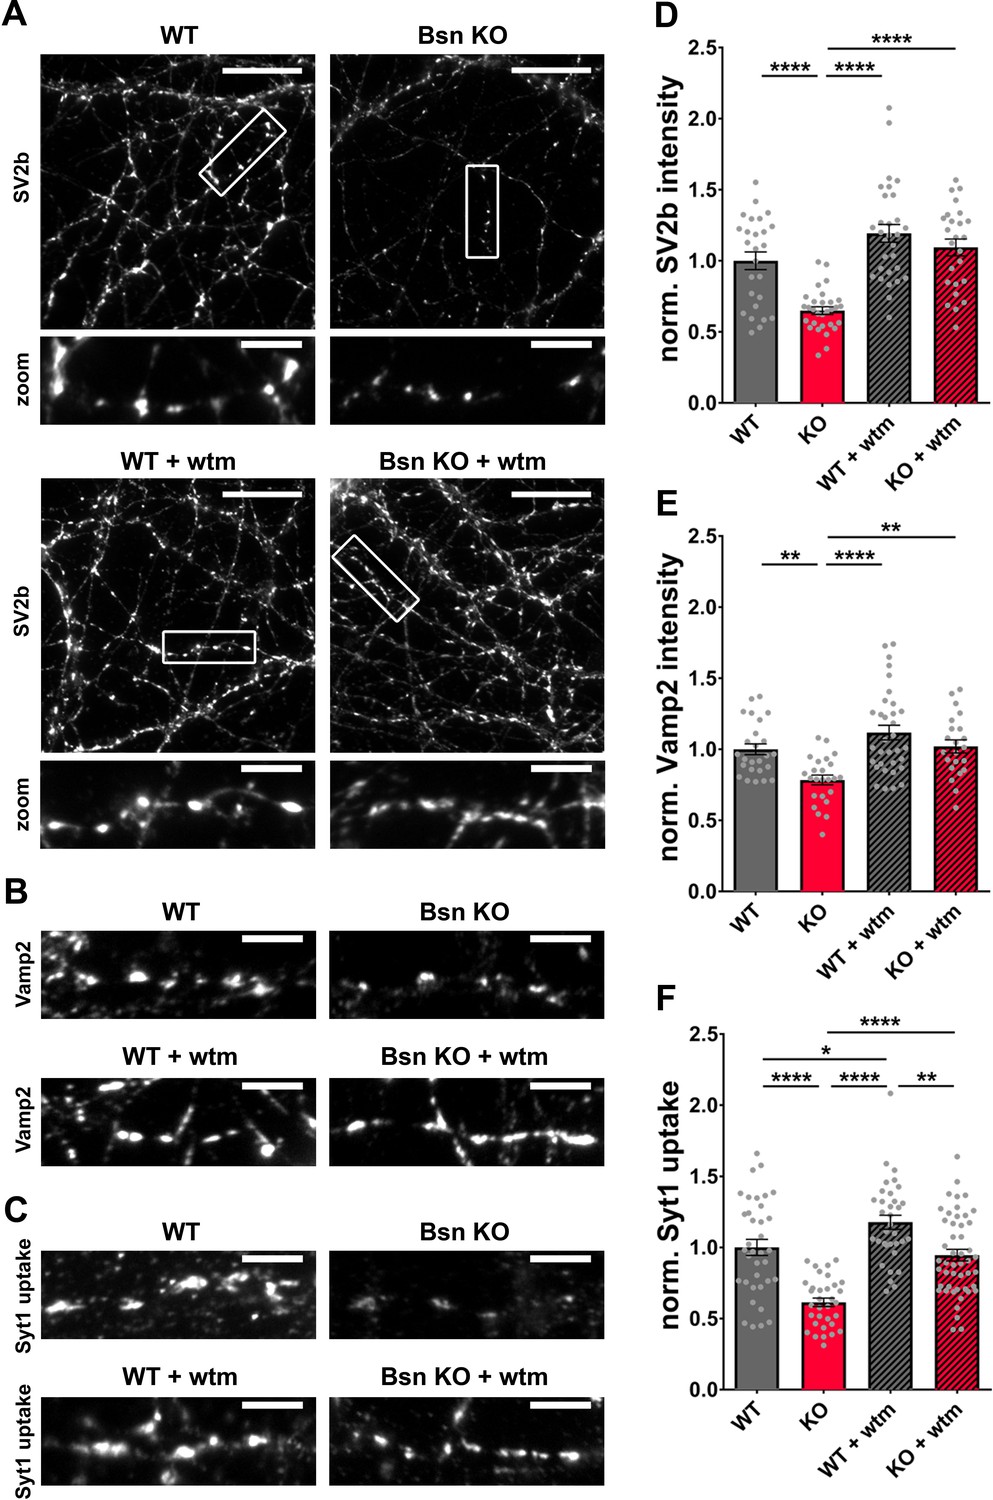
Bassoon KO neurons display a loss of SV2b and Vamp2 as well as a reduced uptake of Synaptotagmin1 antibody in an autophagy-dependent manner.
(A–C) Representative images of hippocampal neurons from WT and Bsn KO mice, either left untreated or treated with 1 μM wortmannin (wtm) for 16 hr, stained with antibodies against SV2b (A) and Vamp2 (B) or live labeled with Synaptotagmin1 antibody (Syt1 uptake) (C). (D–F) Quantification of the normalized fluorescence intensities of SV2b (D) (WT = 1.00 ± 0.062, n = 26 images, 3 independent experiments; Bsn KO = 0.65 ± 0.027, n = 30 images, 3 independent experiments; WT + wtm = 1.19 ± 0.063, n = 30 images, 3 independent experiments; Bsn KO + wtm = 1.09 ± 0.059, n = 25 images, 3 independent experiments; p****<0.0001, p****<0.0001, p****<0.0001), Vamp2 (E) (WT = 1.00 ± 0.038, n = 25 images, 3 independent experiments; Bsn KO = 0.79 ± 0.034, n = 24 images, 3 independent experiments; WT + wtm = 1.12 ± 0.052, n = 33 images, 3 independent experiments; Bsn KO + wtm = 1.02 ± 0.046, n = 22 images, 3 independent experiments; p**=0.0077, p****<0.0001, p**=0.0042) and Syt1 uptake (F) (WT = 1.00 ± 0.056, n = 36 images, 4 independent experiments; Bsn KO = 0.61 ± 0.030, n = 33 images, 4 independent experiments; WT + wtm = 1.18 ± 0.049, n = 34 images, 4 independent experiments; Bsn KO + wtm = 0.95 ± 0.041, n = 48 images, 4 independent experiments; p****<0.0001, p*=0.0429, p****<0.0001, p****<0.0001, p**=0.0017). Scale bars: 20 μm (A), 5 μm (A zoom, B and C). Error bars represent SEM. Data points represent images. ANOVA Tukey’s multiple comparisons test was used to evaluate statistical significance.
Figure 4—figure supplement 1
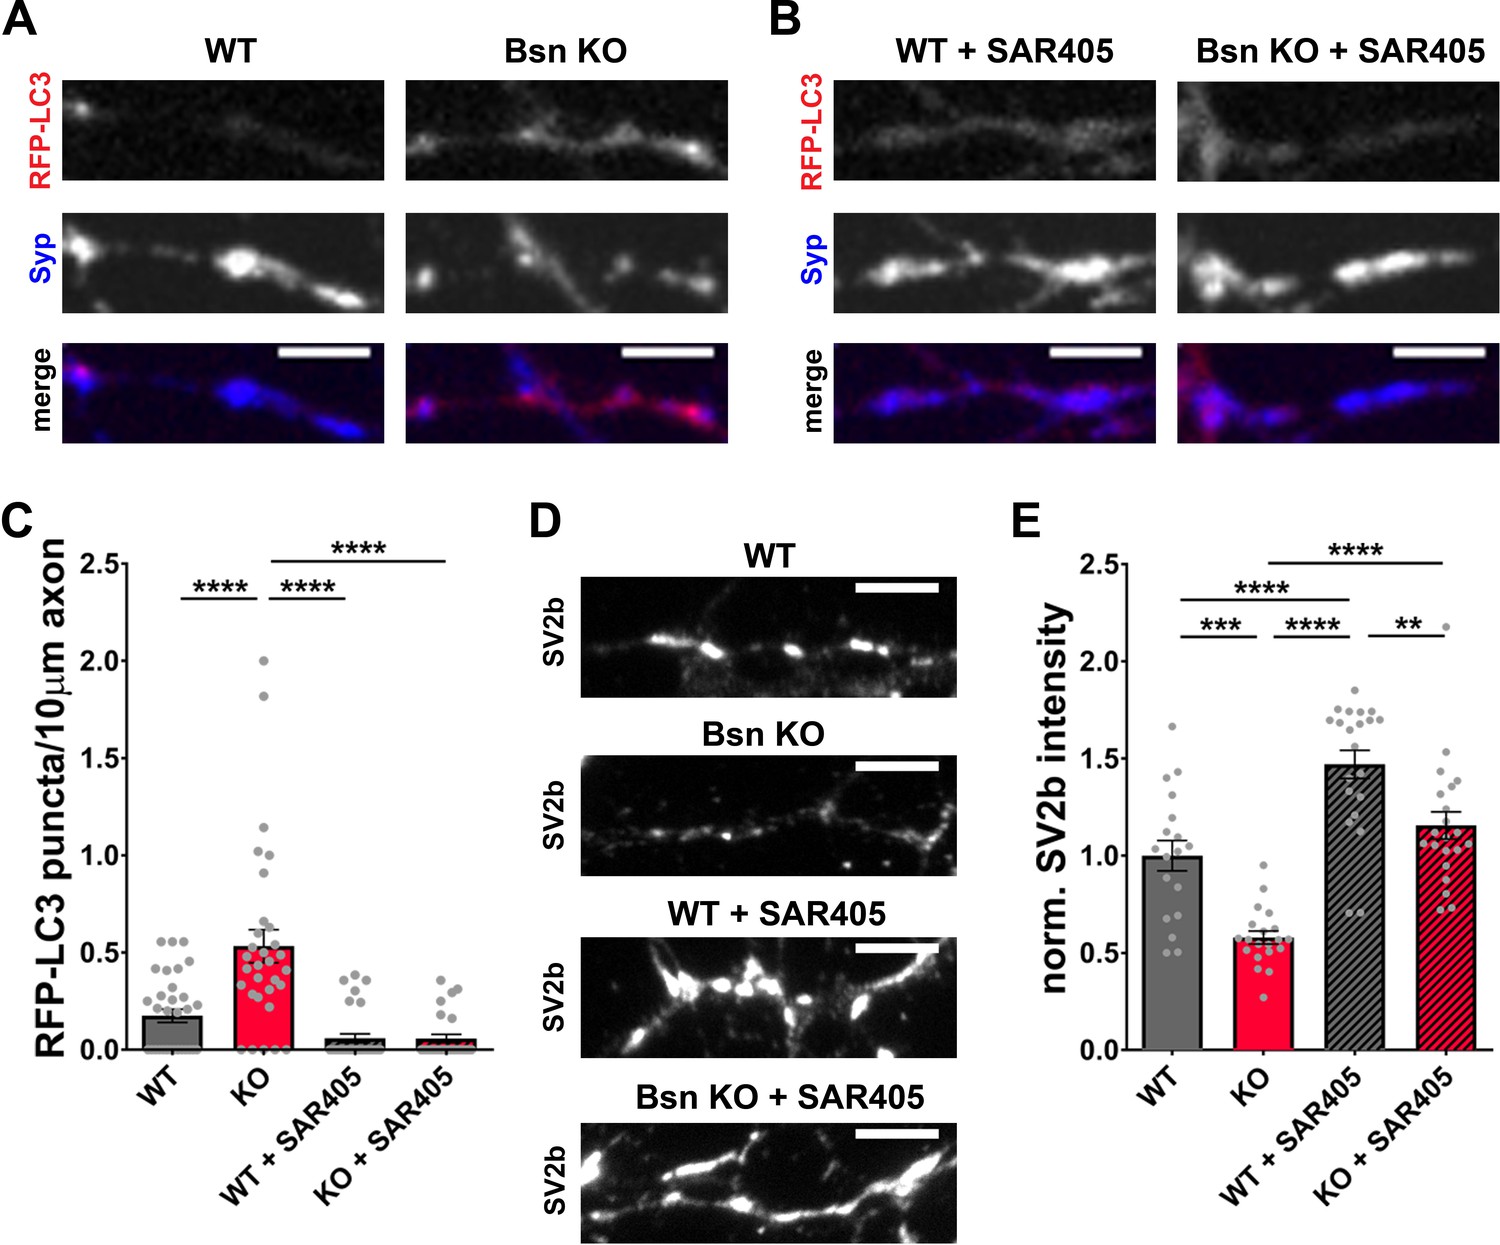
SAR405 blocks autophagy induction in Bassoon KO neurons and rescues SV2b levels.
(A–B) Representative images of hippocampal neurons from WT and Bsn KO mice expressing FU-RFP-LC3, either left untreated or treated with 1 μM SAR405 for 16 hr. (C) Quantification of the number of RFP-LC3 puncta per 10 μm axon (WT = 0.18 ± 0.034, n = 33 axons, 2 independent experiments; Bsn KO = 0.53 ± 0.085, n = 31 axons, 2 independent experiments; WT + SAR405 = 0.06 ± 0.023, n = 32 axons, 2 independent experiments; Bsn KO + SAR405 = 0.06 ± 0.022, n = 27 axons, 2 independent experiments; p****<0.0001, p****<0.0001, p****<0.0001). (D) Representative images of hippocampal neurons from WT and Bsn KO mice, either left untreated or treated with 1 μM SAR405 for 16 hr, stained with antibodies against SV2b. (E) Quantification of the normalized fluorescence intensities of SV2b (D) (WT = 1.00 ± 0.078, n = 18 images, 2 independent experiments; Bsn KO = 0.58 ± 0.033, n = 20 images, 2 independent experiments; WT + SAR405 = 1.47 ± 0.073, n = 21 images, 2 independent experiments; Bsn KO + SAR405 = 1.16 ± 0.070, n = 21 images, 2 independent experiments; p***=0.0002, p****<0.0001, p****<0.0001, p****<0.0001, p**=0.0049). Scale bars: 5 μm. Error bars represent SEM. Data points represent axons. ANOVA Tukey’s multiple comparisons test was used to evaluate statistical significance.
Figure 4—figure supplement 2
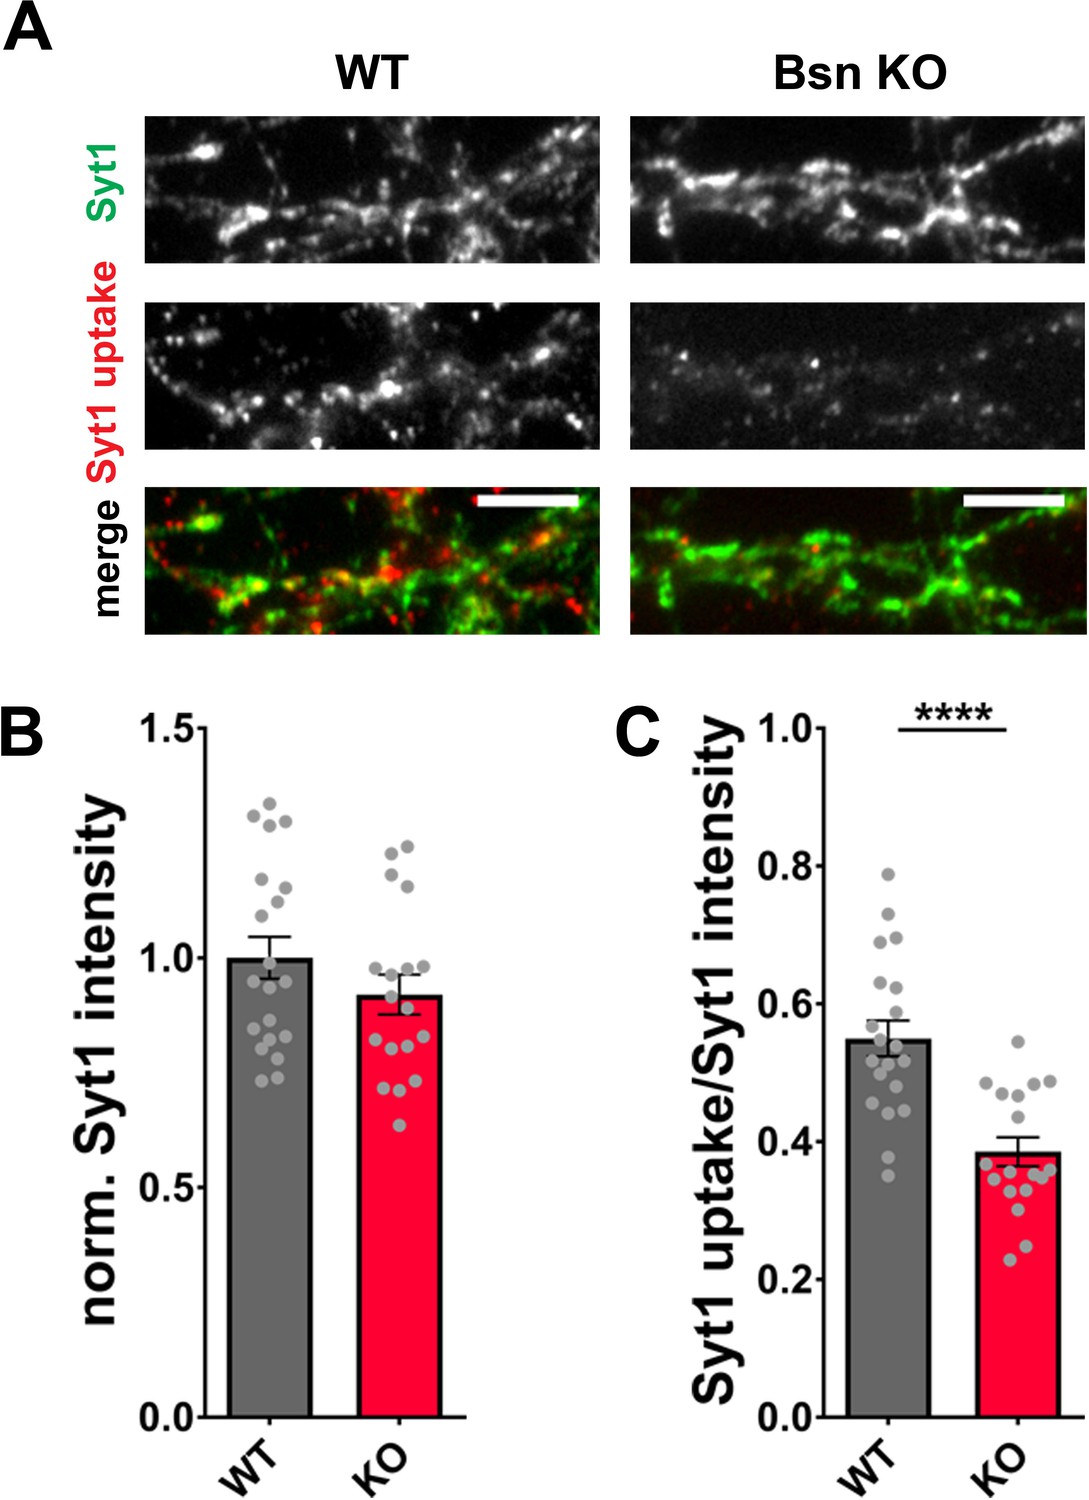
Synaptotagmin1 levels are not decreased in Bassoon KO neurons.
(A) Representative images of hippocampal neurons from WT and Bsn KO mice live labeled with Synaptotagmin1 antibody (Syt1 uptake) and post-hoc stained with antibodies against Synaptotagmin1 to control for total Synaptotagmin1 levels (Syt1, total). (B) Quantification of the normalized fluorescence intensities of Synaptotagmin1 (Syt1, total) (WT = 1.00 ± 0.046, n = 20 images, 2 independent experiments; Bsn KO = 0.92 ± 0.044, n = 18 images, 2 independent experiments). (C) Quantification of the ratio Syt1 uptake/Syt1 total (fluorescence intensities) (WT = 0.55 ± 0.026, n = 20 images, 2 independent experiments; Bsn KO = 0.39 ± 0.021, n = 18 images, 22 independent experiments; p****<0.0001). Scale bars: 5 μm. Error bars represent SEM. Data points represent images. Unpaired t test was used to evaluate statistical significance.
Figure 5
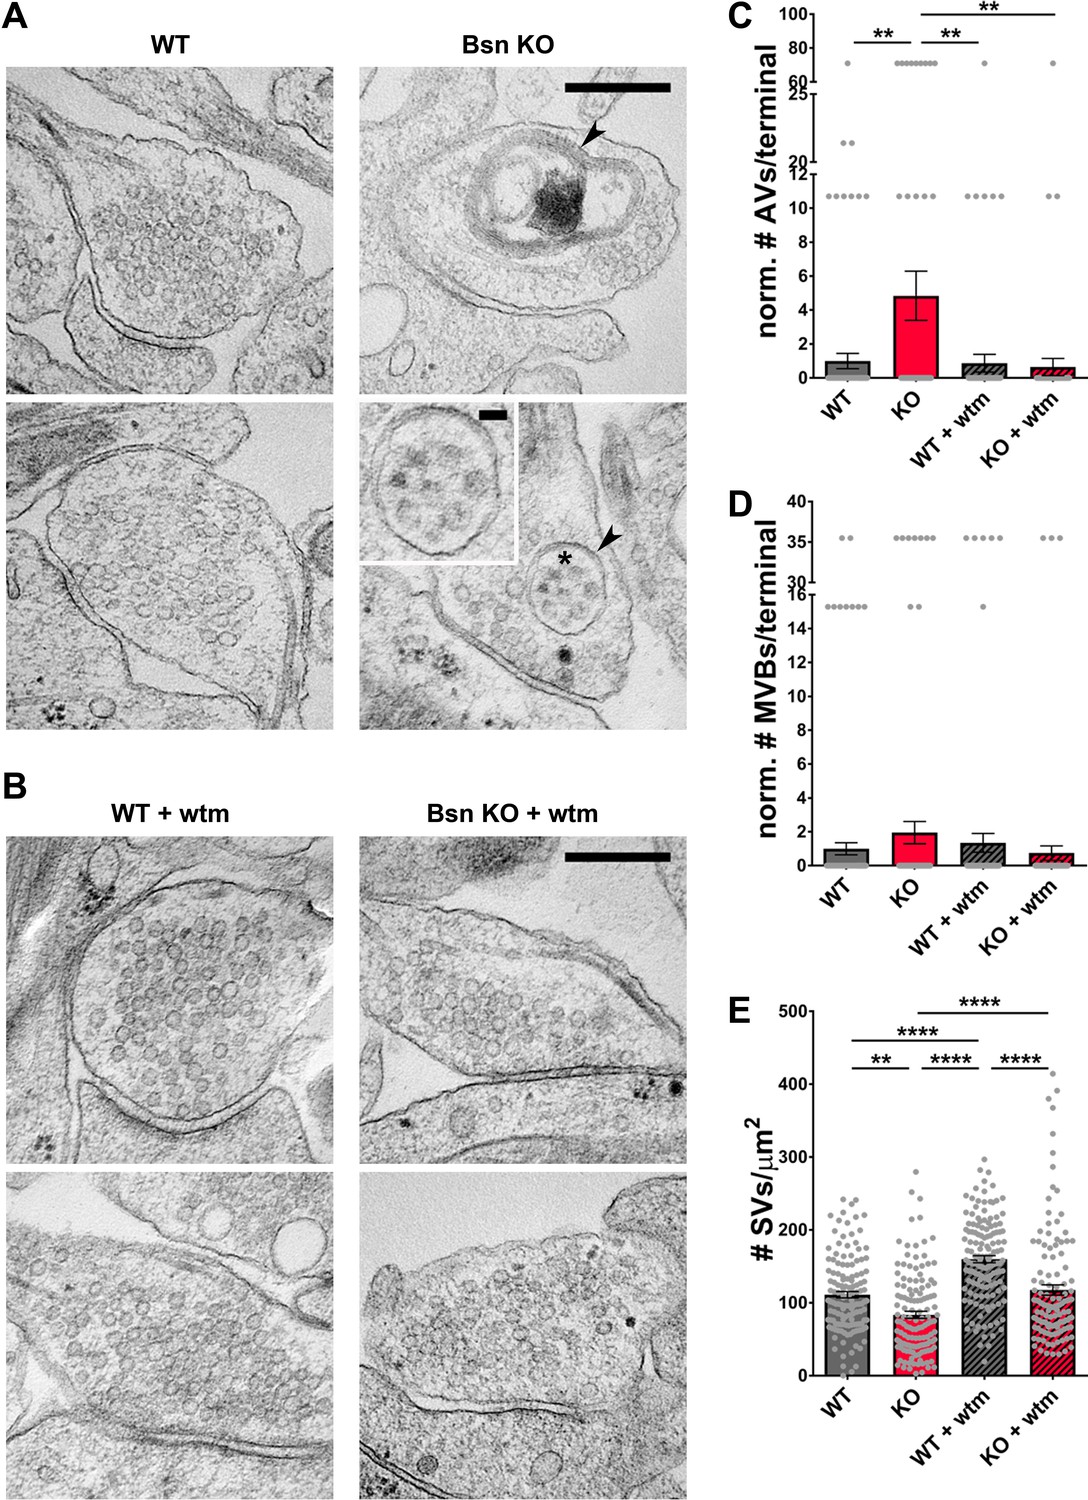
Loss of Bassoon leads to the accumulation of autophagic vacuoles and the autophagy-dependent decrease in SV pool size.
(A–B) Representative EM micrographs from WT and Bsn KO neurons, either left untreated (A) or treated with 1 μM wortmannin (wtm) for 16 hr (B). Arrowheads indicate double-membraned AVs and asterisk indicates ~50 nm vesicles within AV, the latter are also depicted in the zoom. (C–E) Quantification of the normalized number of autophagic vacuoles (AVs) (C) (WT = 1.00 ± 0.453, n = 178 synapses, 2 independent experiments; Bsn KO = 4.84 ± 1.448, n = 143 synapses, 2 independent experiments; WT + wtm = 0.87 ± 0.521, n = 143 synapses, 2 independent experiments; Bsn KO + wtm = 0.65 ± 0.507, n = 143 synapses, 2 independent experiments; p**=0.0035, p**=0.0044, p**=0.0022) and multi-vesicular bodies (MVBs) per presynaptic terminal (D) (WT = 1.00 ± 0.355, n = 178 synapses, 2 independent experiments; Bsn KO = 1.95 ± 0.656, n = 143 synapses, 2 independent experiments; WT + wtm = 1.35 ± 0.556, n = 143 synapses, 2 independent experiments; Bsn KO + wtm = 0.75 ± 0.427, n = 143 synapses, 2 independent experiments) and synaptic vesicles (SVs) per terminal area (E) (WT = 111.20 ± 4.416, n = 137 synapses, 2 independent experiments; Bsn KO = 83.63 ± 4.913, n = 132 synapses, 2 independent experiments; WT + wtm = 160.00 ± 4.828, n = 139 synapses, 2 independent experiments; Bsn KO + wtm = 117.70 ± 7.042, n = 124 synapses, 2 independent experiments; p**=0.0014, p****<0.0001, p****<0.0001, p****<0.0001, p****<0.0001). Scale bars: 300 nm, 50 nm (A zoom). Error bars represent SEM. Data points represent synapses. ANOVA Tukey’s multiple comparisons test was used to evaluate statistical significance.
Figure 6
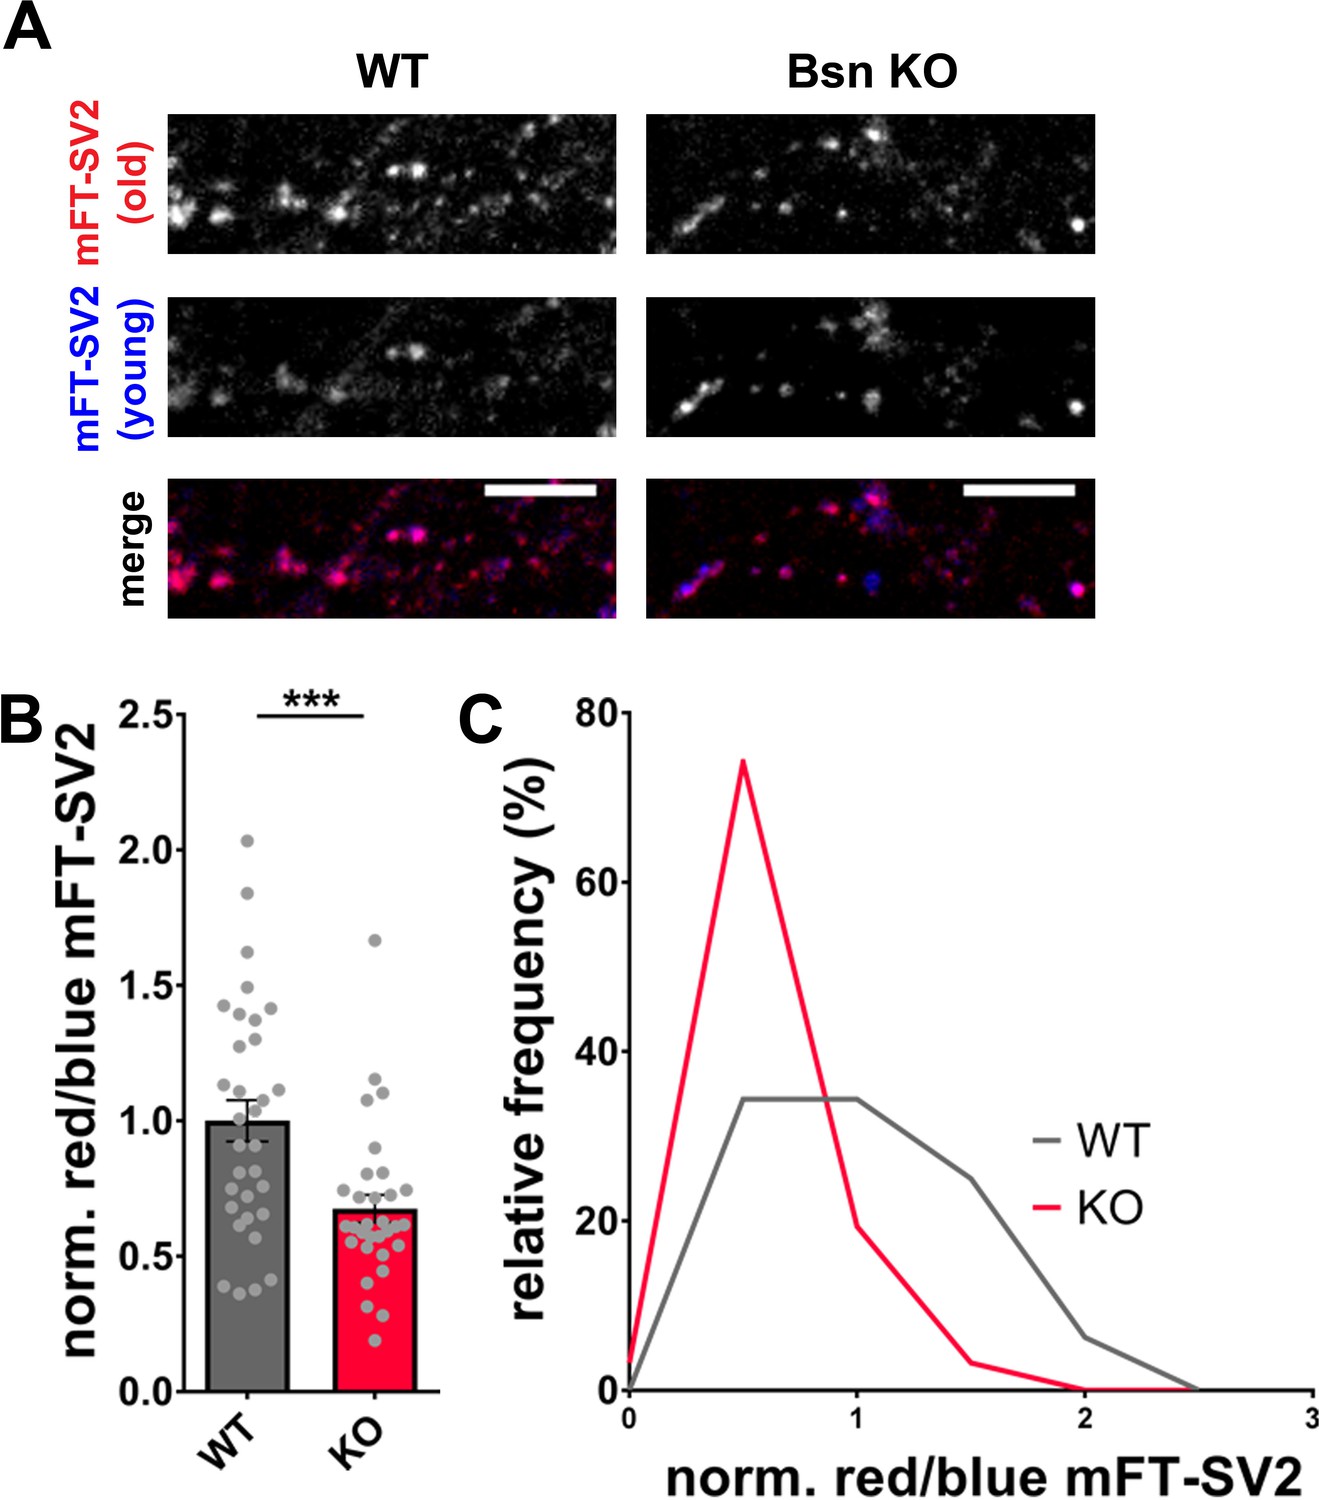
Increased autophagy in Bassoon KO neurons leads to a younger SV2 protein pool.
(A) Representative images of hippocampal neurons from WT and Bsn KO mice expressing medium fluorescent timer (mFT)-tagged SV2 protein (FU-mFT-SV2). The mFT changes its color from blue to red over time. (B–C) Quantification of the normalized red/blue ratio (fluorescence intensities), depicted in a bar graph (B) (WT = 1.00 ± 0.076, n = 32 images, 3 independent experiments; Bsn KO = 0.68 ± 0.051, n = 31 images, 3 independent experiments, p***=0.0008) and as a histogram (C). Note that Bsn KO neurons have significantly more blue, thus younger SV2 pools. Scale bars: 10 μm. Error bars represent SEM. Data points represent images. Unpaired t test was used to evaluate statistical significance.
Figure 7 with 1 supplement
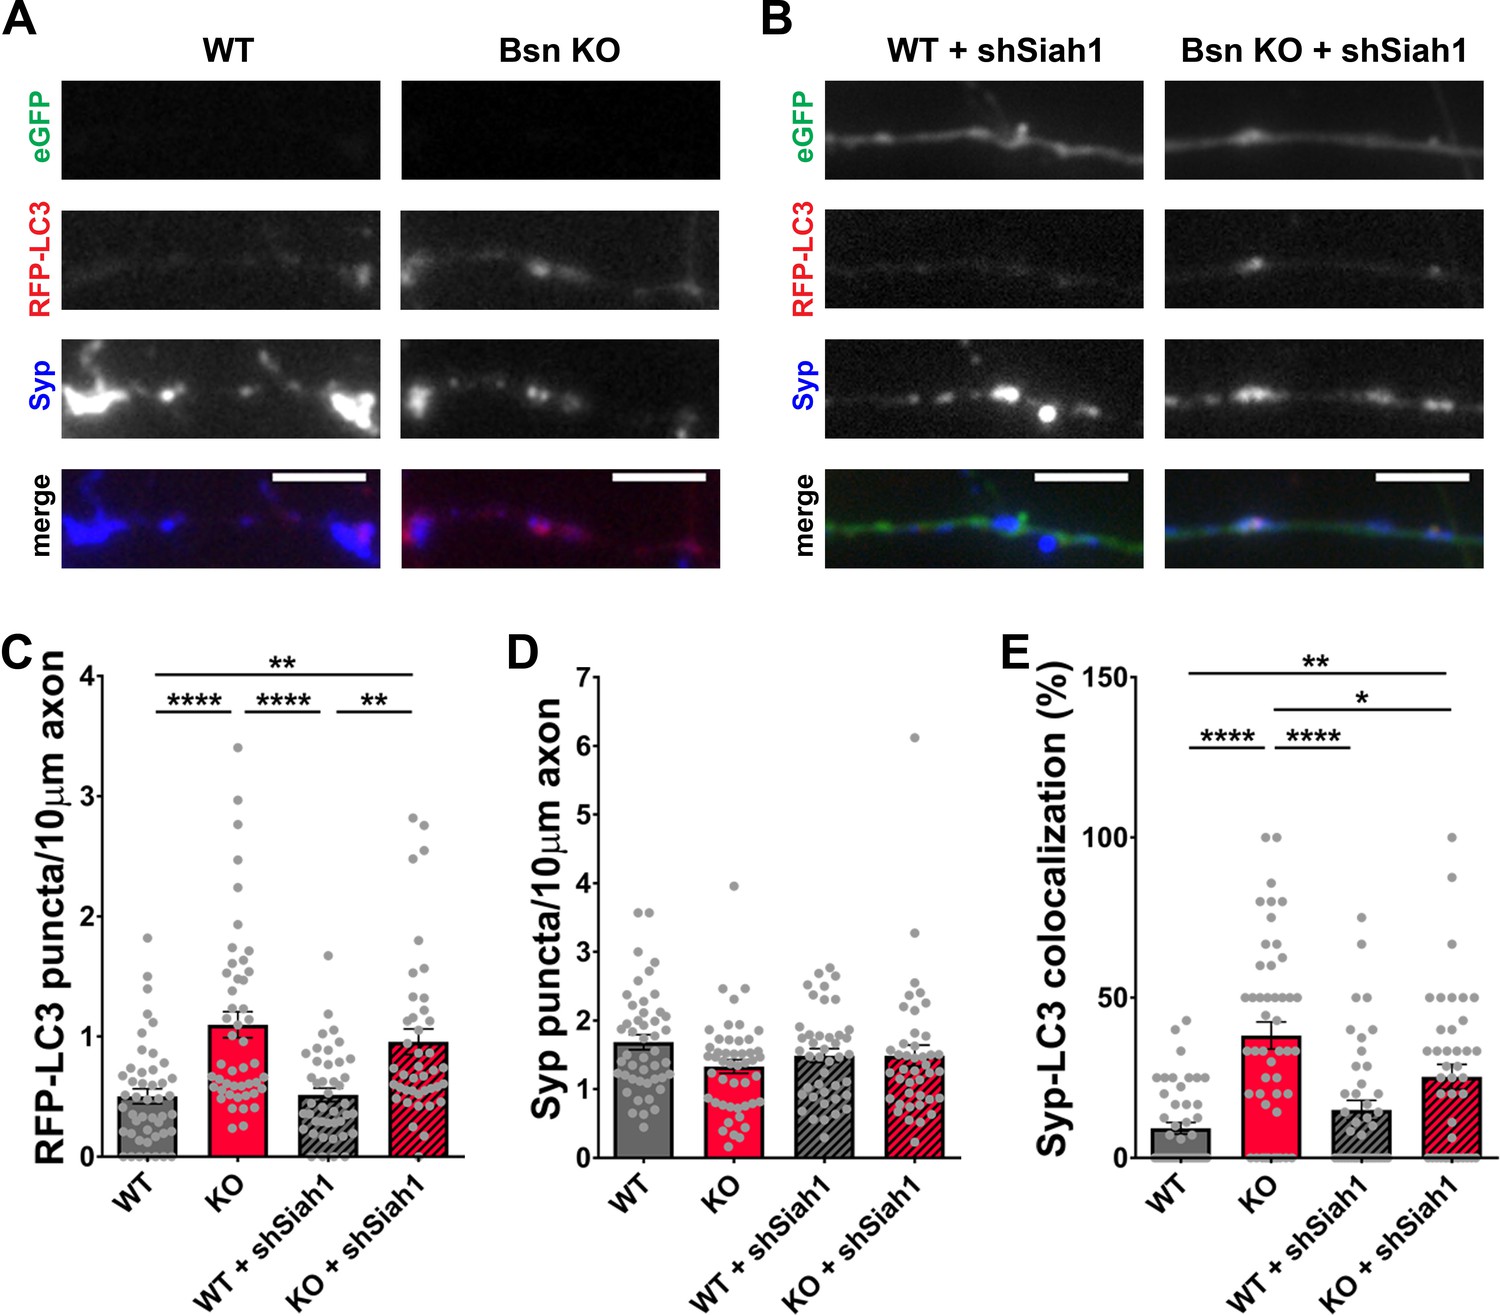
Siah1-ubiquitination contributes to increased presynaptic autophagy in Bassoon KO neurons.
(A–B) Representative images of hippocampal neurons from WT and Bsn KO mice expressing FU-RFP-LC3 only (A) or FU-RFP-LC3 and shRNA against Siah1 (FU-shSiah1) (B) that were fixed and stained with antibodies against Synaptophysin1 (Syp). FU-shSiah1 vector co-expresses a soluble eGFP that enables the identification and quantification of axons from infected neurons only. (C–E) Quantification of the number of RFP-LC3 puncta per 10 μm axon (C) (WT = 0.50 ± 0.063, n = 46 axons, 3 independent experiments; Bsn KO = 1.10 ± 0.108, n = 47 axons, 3 independent experiments; WT + shSiah1 = 0.52 ± 0.056, n = 42 axons, 3 independent experiments; Bsn KO + shSiah1 = 0.96 ± 0.106, n = 41 axons, 3 independent experiments; p****<0.0001, p**=0.0019, p****<0.0001, p**=0.0035), the number of Syp1 puncta per 10 μm axon (D) (WT = 1.68 ± 0.109, n = 46 axons, 3 independent experiments; Bsn KO = 1.33 ± 0.100, n = 47 axons, 3 independent experiments; WT + shSiah1 = 1.49 ± 0.101, n = 42 axons, 3 independent experiments; Bsn KO + shSiah1 = 1.49 ± 0.152, n = 41 axons, 3 independent experiments) and the colocalization of RFP-LC3 and Syp1 (E) (WT = 9.23 ± 1.809, n = 46 axons, 3 independent experiments; Bsn KO = 38.19 ± 4.211, n = 47 axons, 3 independent experiments; WT + shSiah1 = 14.93 ± 3.046, n = 42 axons, 3 independent experiments; Bsn KO + shSiah1 = 25.28 ± 3.902, n = 41 axons, 3 independent experiments; p****<0.0001, p**=0.0056, p****<0.0001, p*=0.0379). Scale bars: 5 μm. Error bars represent SEM. Data points represent axons. ANOVA Tukey’s multiple comparisons test was used to evaluate statistical significance.
Figure 7—figure supplement 1
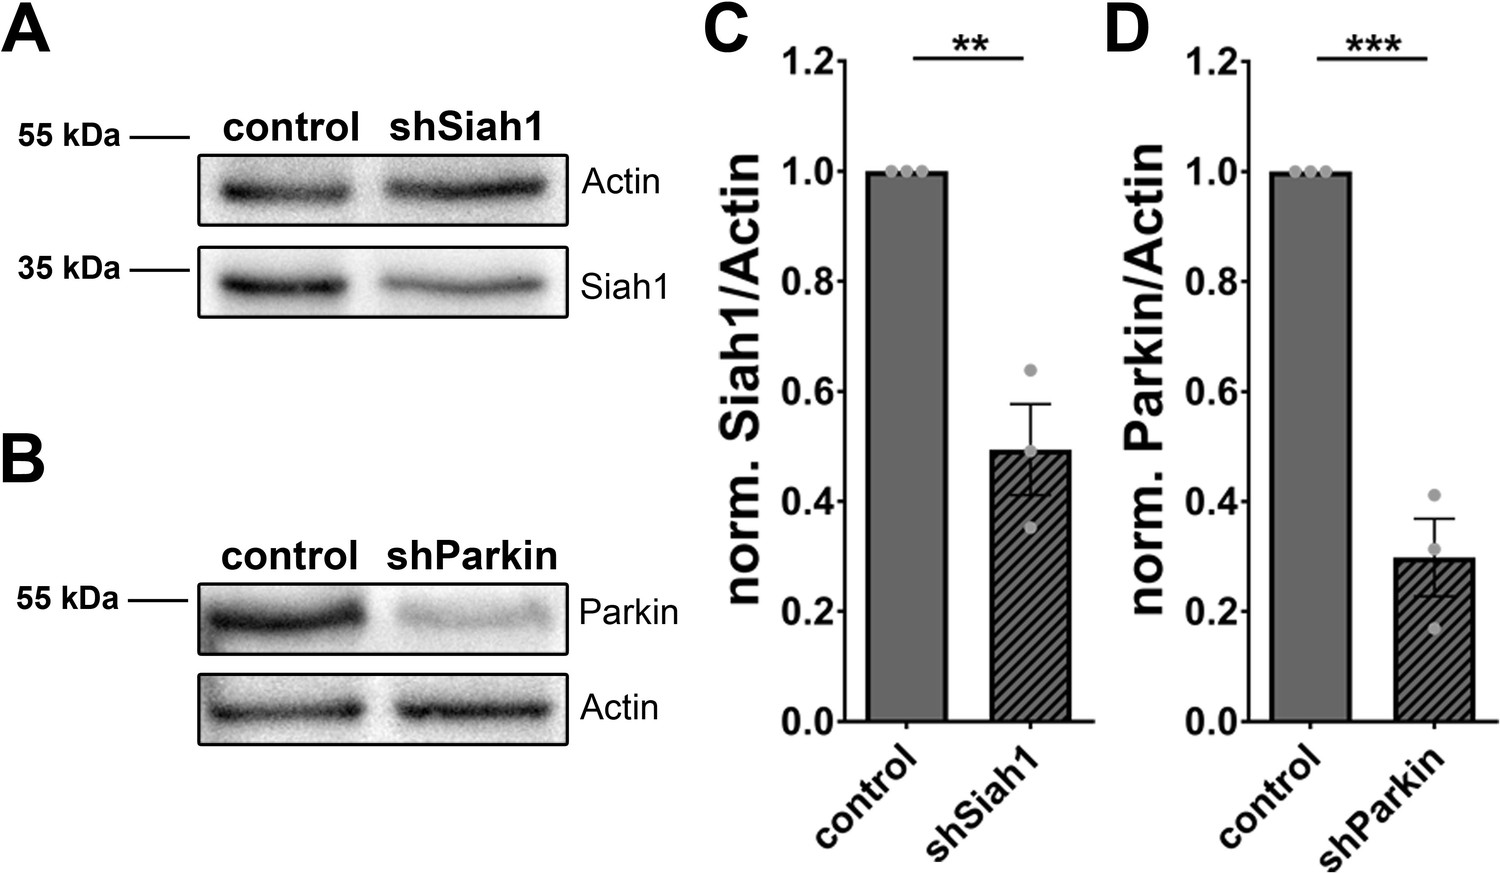
Knockdown efficiency of shSiah1 and shParkin.
(A–B) Western blot of lysates from hippocampal neurons expressing FU-shSiah1 (A) and FU-shParkin (B) stained with antibodies against Siah1 and Actin (A) and Parkin and Actin (B). (C–D) Quantification of normalized Siah1/Actin (C) (control = 1 ± 0, n = 3 independent experiments; shSiah1 = 0.49 ± 0.083, n = 3 independent experiments; p**=0.0036) and Parkin/Actin (D) (control = 1 ± 0, n = 3 independent experiments; shParkin = 0.30 ± 0.070, n = 3 independent experiments; p***=0.0006). Error bars represent SEM. Data points represent independent experiments/cultures. Unpaired t test was used to evaluate statistical significance.
Figure 8
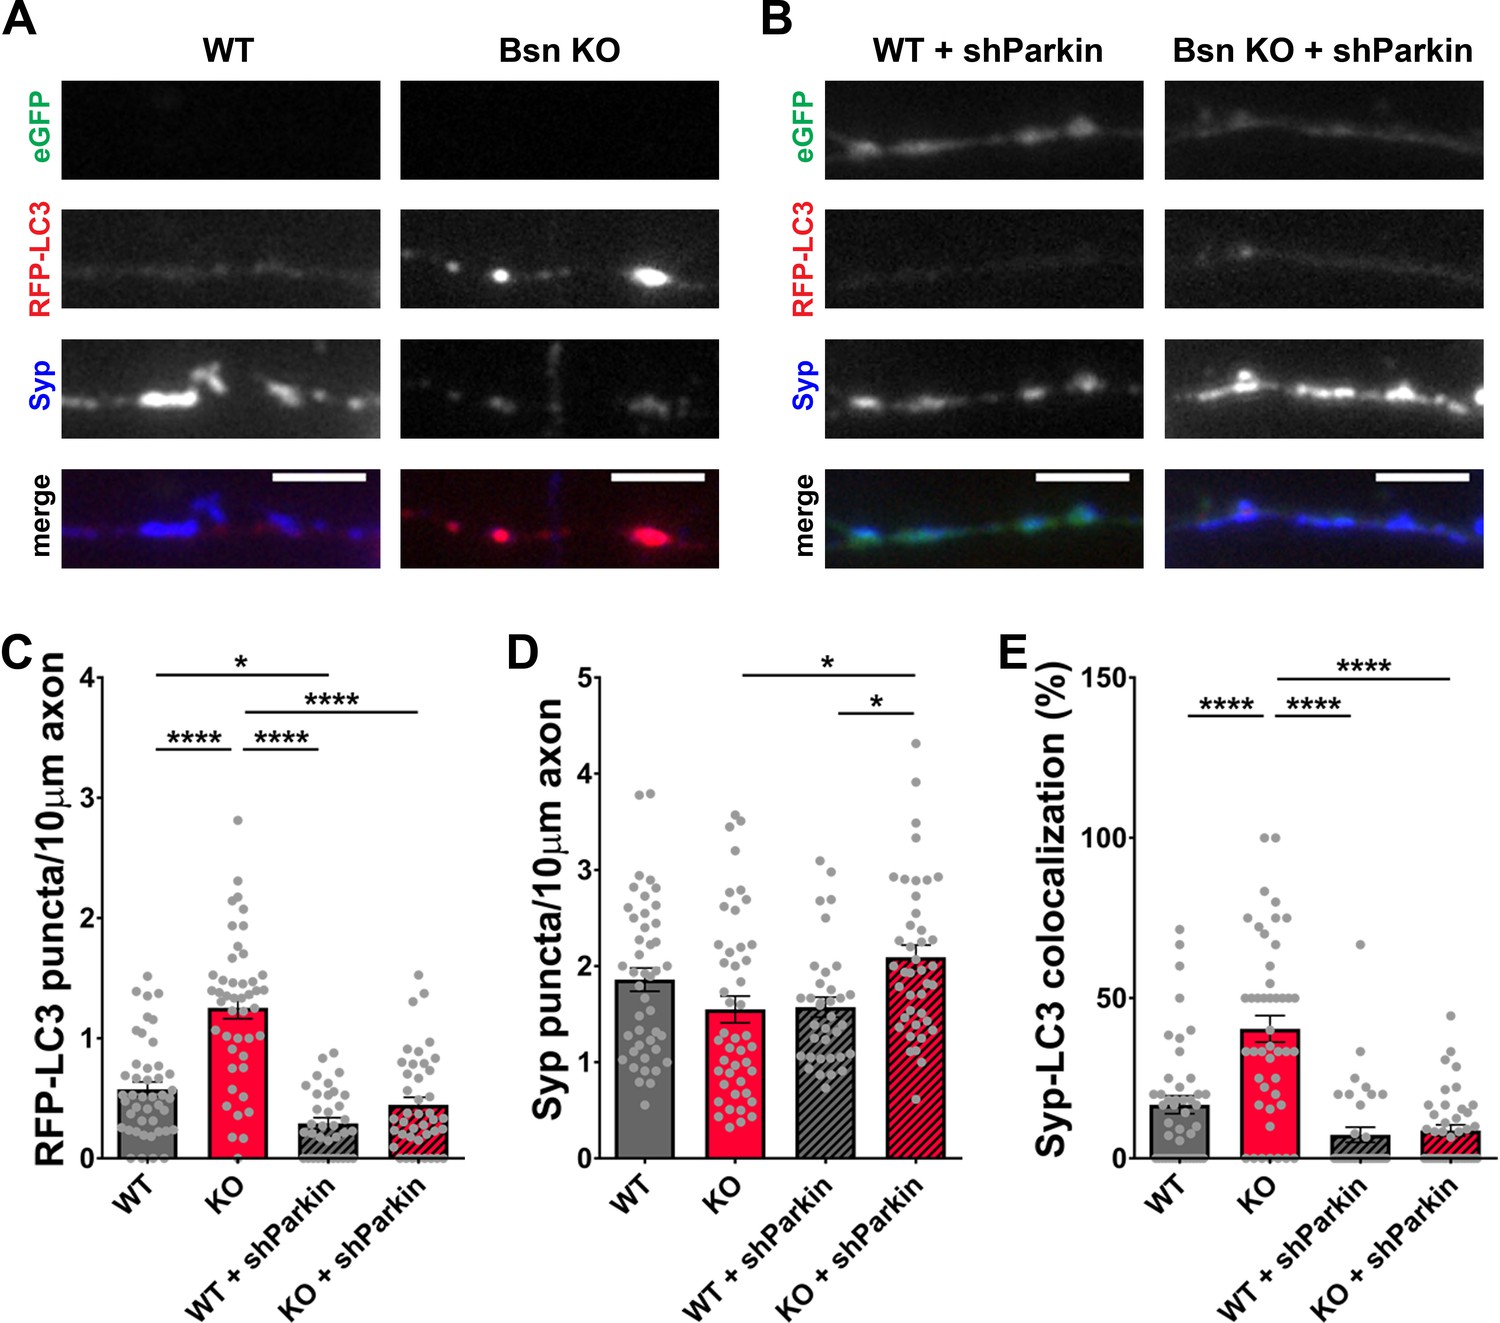
Knockdown of Parkin rescues the autophagy phenotype in Bassoon KO neurons.
(A–B) Representative images of hippocampal neurons from WT and Bsn KO mice expressing FU-RFP-LC3 only (A) or FU-RFP-LC3 and shRNA against Parkin (FU-shParkin) (B) that were fixed and stained with antibodies against Synaptophysin1 (Syp). FU-shParkin vector co-expresses a soluble eGFP that enables the identification and quantification of axons from infected neurons only. (C–E) Quantification of the number of RFP-LC3 puncta per 10 μm axon (C) (WT = 0.58 ± 0.060, n = 44 axons, 3 independent experiments; Bsn KO = 1.25 ± 0.090, n = 45 axons, 3 independent experiments; WT + shParkin = 0.29 ± 0.046, n = 35 axons, 3 independent experiments; Bsn KO + shParkin = 0.45 ± 0.063, n = 41 axons, 3 independent experiments; p****<0.0001, p*=0.0285, p****<0.0001, p****<0.0001), the number of Syp1 puncta per 10 μm axon (D) (WT = 1.86 ± 0.121, n = 44 axons, 3 independent experiments; Bsn KO = 1.55 ± 0.139, n = 45 axons, 3 independent experiments; WT + shParkin = 1.57 ± 0.104, n = 35 axons, 3 independent experiments; Bsn KO + shParkin = 2.09 ± 0.127, n = 41 axons, 3 independent experiments; p*=0.0119, p*=0.0302) and the colocalization of RFP-LC3 and Syp1 (E) (WT = 16.75 ± 2.82, n = 44 axons, 3 independent experiments; Bsn KO = 40.42 ± 4.134, n = 45 axons, 3 independent experiments; WT + shParkin = 7.38 ± 2.382, n = 35 axons, 3 independent experiments; Bsn KO + shParkin = 8.72 ± 1.736, n = 41 axons, 3 independent experiments; p****<0.0001, p****<0.0001, p****<0.0001). Scale bars: 5 μm. Error bars represent SEM. Data points represent axons. ANOVA Tukey’s multiple comparisons test was used to evaluate statistical significance.
Figure 9
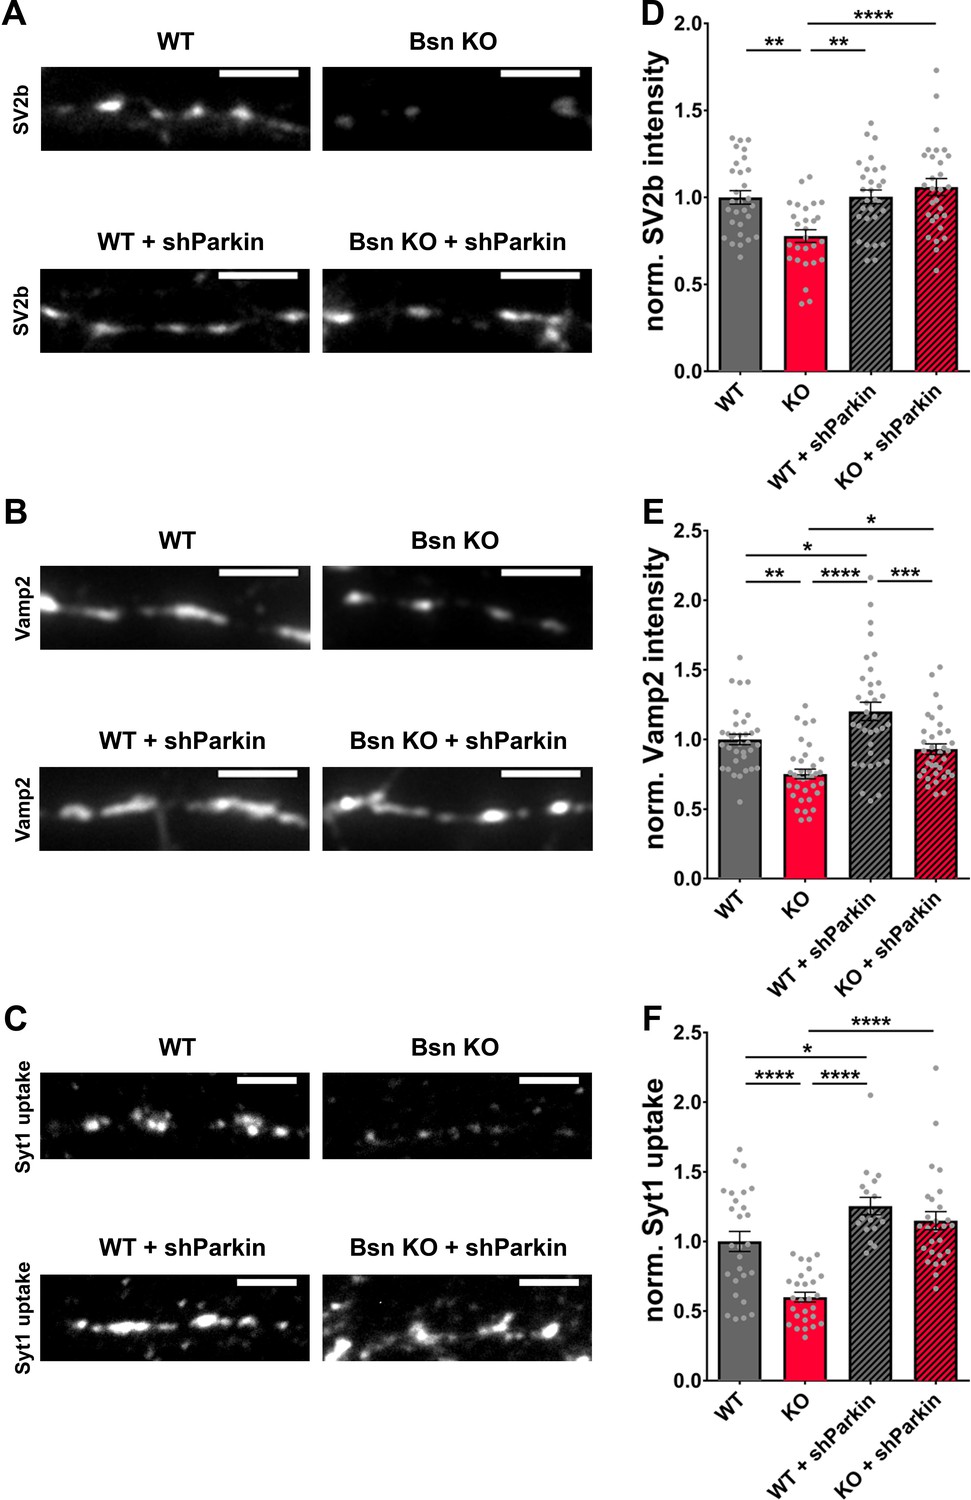
Decreased SV2b, Vamp2 and Synaptotagmin1 antibody uptake in Bassoon KO neurons are rescued by the downregulation of Parkin.
(A–C) Representative images of hippocampal neurons from WT and Bsn KO mice, either uninfected or expressing shRNA against Parkin (FU-shParkin) that were fixed and stained with antibodies against SV2b (A) and Vamp2 (B) or live labeled with Synaptotagmin1 antibody (Syt1 uptake) (C). (D–F) Quantification of the normalized fluorescence intensities of SV2b (D) (WT = 1.00 ± 0.039, n = 29 images, 3 independent experiments; Bsn KO = 0.78 ± 0.037, n = 27 images, 3 independent experiments; WT + shParkin = 1.00 ± 0.039, n = 29 images, 3 independent experiments; Bsn KO + shParkin = 1.06 ± 0.049, n = 29 images, 3 independent experiments; p**=0.0014, p**=0.0012, p****<0.0001), Vamp2 (E) (WT = 1.00 ± 0.038, n = 34 images, 3 independent experiments; Bsn KO = 0.75 ± 0.035, n = 35 images, 3 independent experiments; WT + shParkin = 1.20 ± 0.066, n = 34 images, 3 independent experiments; Bsn KO + shParkin = 0.93 ± 0.038, n = 35 images, 3 independent experiments; p**=0.0011, p*=0.0126, p****<0.0001, p*=0.0319, p***=0.0003) and Syt1 uptake (F) (WT = 1.00 ± 0.072, n = 27 images, 3 independent experiments; Bsn KO = 0.60 ± 0.035, n = 27 images, 3 independent experiments; WT + shParkin = 1.25 ± 0.062, n = 18 images, 3 independent experiments; Bsn KO + shParkin = 1.15 ± 0.065, n = 27 images, 3 independent experiments; p****<0.0001, p*=0.0343, p****<0.0001, p****<0.0001). Scale bars: 5 μm. Error bars represent SEM. Data points represent images. ANOVA Tukey’s multiple comparisons test was used to evaluate statistical significance.
Tables
Key resources table
| Reagent type (species) or resource | Designation | Source or reference | Identifiers | Additional information |
|---|---|---|---|---|
| Strain, strain background Mus musculus both sexes) | Bassoon knockout mice | Leibniz Institute for Neurobiology, laboratory of Eckart Gundelfinger; Hallermann et al., 2010; Davydova et al., 2014 | Omnibank ES cell line OST486029 by Lexicon Pharmaceuticals (The Woodlands, TX; USA) | Bsn/Bassoon KO mice created by gene trap |
| Strain, strain background Mus musculus both sexes) | WT mice (C57BL/6J) | Research Institutes for experimental Medicine (FEM), Charité Berlin | RRID:IMSR_JAX:000664 | |
| Transfected construct (Rattus norvegicus) | FU-RFP-LC3 | Waites et al., 2013; Okerlund et al., 2017 | Lentiviral construct to infect and express autophagy reporter | |
| Transfected construct (Rattus norvegicus) | FU-UbK0 | Waites et al., 2013; Okerlund et al., 2017 | Lentiviral construct to infect and express recombinant ubiquitin | |
| Transfected construct Mus musculus | FU-shSiah1 | Waites et al., 2013; Okerlund et al., 2017 | Lentiviral construct to infect and express shRNA against Siah1 | |
| Transfected construct Mus musculus | FU-shParkin | This paper; Viral Core Facility (VCF), Charité Berlin | Lentiviral construct to infect and express shRNA against Parkin ‘gcaaCgtgccAattgaaaattcaagagattttcaatTggcacGttgc’ | |
| Transfected construct Mus musculus | FU-mFT-SV2 | This paper; Viral Core Facility (VCF), Charité Berlin | medium fluorescent timer from Subach et al., 2009 | |
| tTransfected construct Mus musculus | FU-Bsn609-eGFP | This paper; Viral Core Facility (VCF), Charité Berlin | Lentiviral construct to infect and express Bsn609 | |
| Antibody | anti-Synaptophysin (mouse monoclonal) | Synaptic Systems | Cat# 101011; RRID:AB_887824 | 1:1000 |
| Antibody | anti-Vamp2 (rabbit polyclonal) | Synaptic Systems | Cat# 104202; RRID:AB_887810 | 1:1000 |
| Antibody | anti-SV2b (rabbit polyclonal) | Synaptic Systems | Cat# 119102; RRID:AB_887803 | 1:1000 |
| Antibody | anti-Synaptotagmin1 (mouse monoclonal) | Synaptic Systems | Cat# 105011; RRID:AB_887832 | 1:1000 |
| Antibody | anti-Synaptotagmin1 lumenal (rabbit polyclonal) | Synaptic Systems | Cat# 105103C3; RRID:AB_887829 | 1:70 (Cy3-labeled for live labeling) |
| Antibody | anti-Parkin (mouse monoclonal) | abcam | Cat# ab77924; RRID:AB_1566559 | 1:500 |
| Antibody | anti-Siah1 (rabbit polyclonal) | abcam | Cat# ab203198; RRID:AB_2833241 | 1:500 |
| Antibody | anti-LC3 (rabbit monoclonal) | Cell Signaling Technology | Cat# 12741; RRID:AB_2617131*Updated | 1:1000 |
| Antibody | anti-GAPDH (rabbit monoclonal) | Cell Signaling Technology | Cat# 2118; RRID:AB_561053*Updated | 1:1000 |
| Antibody | anti-Actin (rabbit polyclonal) | Sigma-Aldrich | Cat# A2066; RRID:AB_476693 | 1:1000 |
| Antibody | Alexa Fluor 647 goat anti-mouse secondary antibody | ThermoFisher Scientific | Cat# A21236; RRID:AB_2535805 | 1:1000 |
| Antibody | Alexa Fluor 647 goat anti-rabbit secondary antibody | ThermoFisher Scientific | Cat# A21245; RRID:AB_2535813 | 1:1000 |
| Antibody | Alexa Fluor 568 goat anti-rabbit secondary antibody | ThermoFisher Scientific | Cat# A11036; RRID:AB_10563566 | 1:2000 |
| Antibody | Cy3 donkey anti-rabbit secondary antibody | Dianova/Jackson ImmunoResearch | Cat# 711-165-152; RRID:AB_2307443 | 1:2000 |
| Chemical compound, drug | Wortmannin | InvivoGen | Cat# tlrl-wtm; CAS Number 19545-26-7 | 1 μM, 16 hr |
| Chemical compound, drug | Ziram PESTANAL | Sigma-Aldrich | Cat# 45708; CAS Number 137-30-4 | 1 μM, 16 hr |
| Chemical compound, drug | SAR405 | Hycultec | Cat# HY12481A; CAS Number 1946010–7902 | 1 μM, 16 hr |
| Commercial assay or kit | Ubiquitin Remnant Motif (K-ε-GG) Kit | Cell Signaling Technology | Cat# 5562 | |
| Commercial assay or kit | Syn-PER Synaptic Protein Extraction Reagent | Thermo Scientific | Cat# 87793 | |
| Software, algorithm | OpenView | Tsuriel et al., 2006 | N/A | Written by Prof. Noam Ziv |
| Software, algorithm | ImageJ | National Institute of Health | https://Imagej.nih.gov/ RRID:SCR_003070 | |
| Software, algorithm | Prism | GraphPad Software | https://www.graphpad.com/ RRID:SCR_002798 | |
| Software, algorithm | Mascot software version 2.6.1 | Matrix Science Ltd., London, UK | RRID:SCR_014322 | |
| Software, algorithm | MaxQuant software version 1.6.0.1 | Max-Planck-Institute of Biochemistry | RRID:SCR_014485 |
Additional files
Download links
A two-part list of links to download the article, or parts of the article, in various formats.
Downloads (link to download the article as PDF)
Open citations (links to open the citations from this article in various online reference manager services)
Cite this article (links to download the citations from this article in formats compatible with various reference manager tools)
Parkin contributes to synaptic vesicle autophagy in Bassoon-deficient mice
eLife 9:e56590.
https://doi.org/10.7554/eLife.56590


