Isoform-specific roles for AKT in affective behavior, spatial memory, and extinction related to psychiatric disorders
- Institute for Behavioral Genetics, University of Colorado, United States
- Linda Crnic Institute, Anschutz Medical Center, United States
- Department of Integrative Physiology, University of Colorado, United States
Figures
Figure 1 with 1 supplement
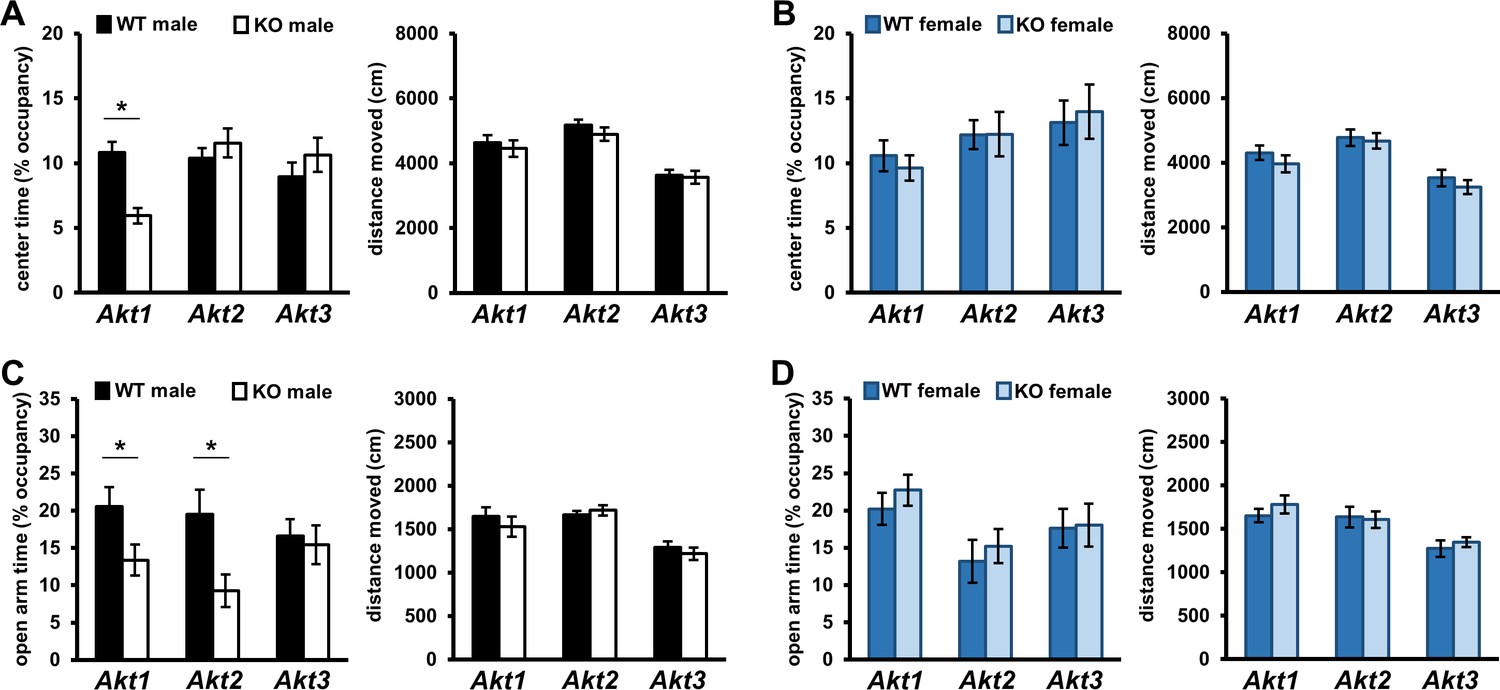
Akt deficiency affects the expression of anxiety-related behavior in an isoform- and sex-specific fashion.
Male and female mice with single-isoform deletions of Akt1, Akt2, or Akt3 were assessed for anxiety-related behaviors in the open field arena (OFA) and elevated plus maze (EPM) tests. (A–B) OFA activity shown as percent time spent exploring the center zone out of total arena time in Akt mutant (A) male and (B) female mice. Akt1 KO male mice show reduced center time compared to their WT controls. (C–D) EPM activity shown as percent time spent in the open arms out of total maze time in Akt mutant (C) male and (D) female mice. Akt1 KO and Akt2 KO male mice show reduced open arm time compared with their respective WT controls. Differences in OFA center or EPM open arm times are not explained by locomotor alterations between KO and WT mice. No differences between female KO and WT mice were observed. *p<0.05. N = Akt1 (WT-M = 22, KO-M = 22, WT-F = 16, KO-F = 13); Akt2 (WT-M = 13–14, KO-M = 15–16, WT-F = 12–13, KO-F = 11); Akt3 (WT-M = 19, KO-M = 23, WT-F = 17–18, KO-F = 18).
-
Figure 1—source data 1
Figure 1 source data.
- https://cdn.elifesciences.org/articles/56630/elife-56630-fig1-data1-v2.xlsx
Figure 1—figure supplement 1
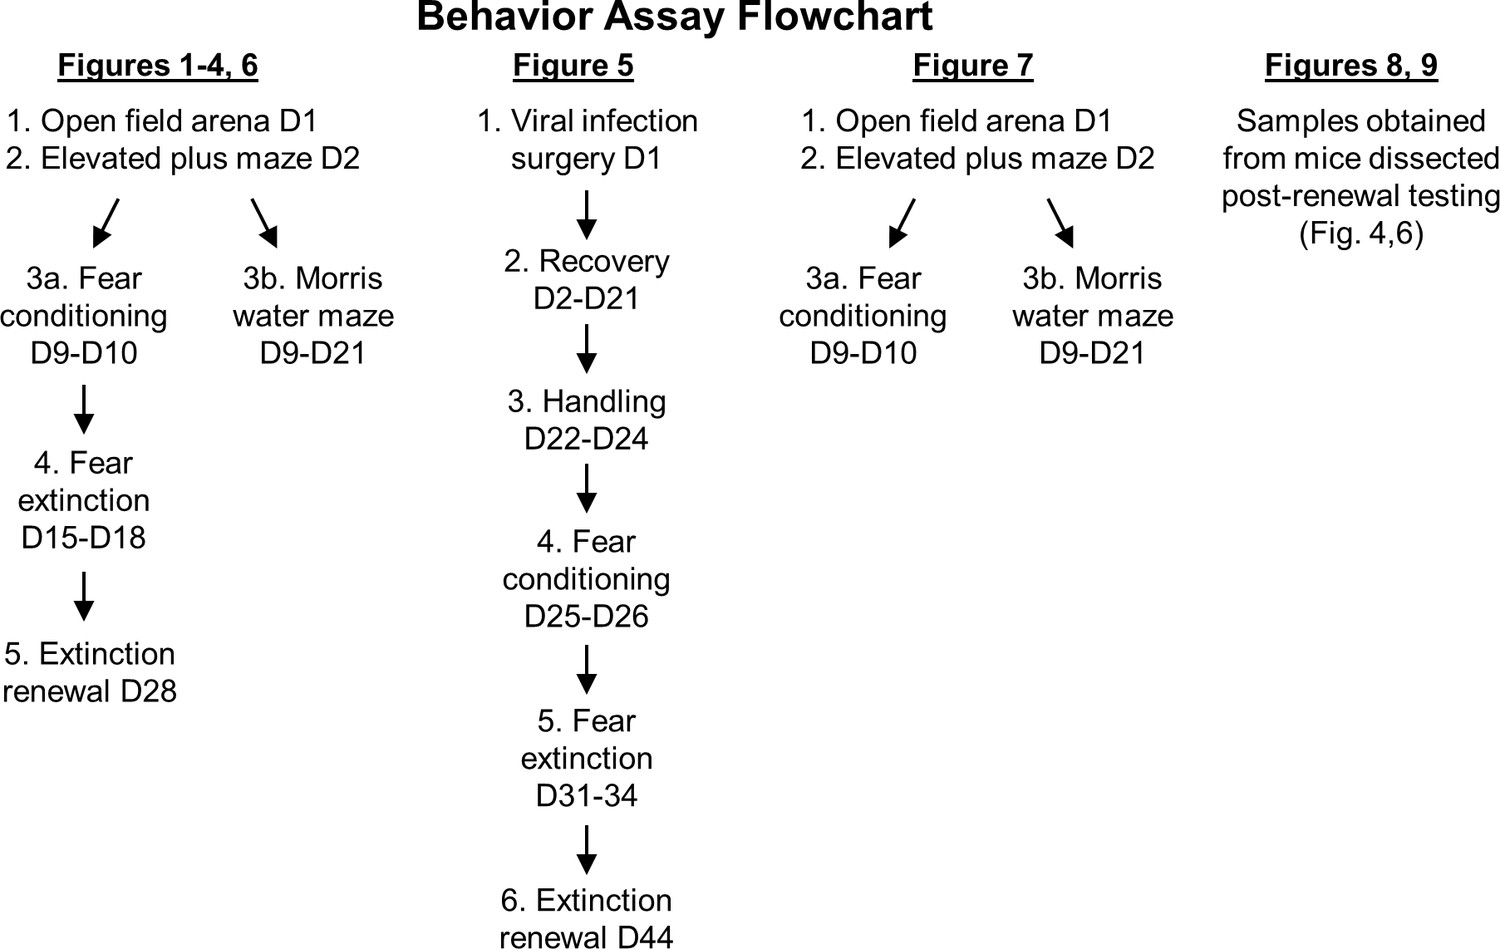
Schematic representation of the experimental timeline.
Figure 2

Akt deficiency affects spatial memory formation in an isoform- and sex-specific fashion.
Spatial learning and memory were assessed using the Morris Water Maze (MWM) in male and female mice with single-isoform deletions of Akt1, Akt2, or Akt3. Left graph: Learning measured by latency of mice to escape the MWM during training to locate a hidden escape platform (days 1–8), reversal training to locate the hidden escape platform moved to the opposite quadrant (days 9–11), and visible platform training to locate the escape platform marked by a visual cue (days 12–13). Memory measured by percent time spent in the target quadrant where mice were trained to locate the hidden escape (left bar graph) and number of platform location crossings in the target quadrant (right bar graph) during a probe test. MWM performance in (A) Akt1 KO male, (B) Akt1 KO female, (C) Akt2 KO male, (D) Akt2 KO female, (E) Akt3 KO male, and (F) Akt3 KO female mice. Akt1 KO male mice showed a significant reduction in platform crossings compared with WT controls during the probe test. No other differences were detected between Akt isoform KO and WT mice. *p<0.05. N = Akt1 (WT-M = 9 KO-M = 9, WT-F = 9, KO-F = 9); Akt2 (WT-M = 9, KO-M = 11, WT-F = 11, KO-F = 9); Akt3 (WT-M = 10, KO-M = 11, WT-F = 10, KO-F = 9).
-
Figure 2—source data 1
Figure 2 source data.
- https://cdn.elifesciences.org/articles/56630/elife-56630-fig2-data1-v2.xlsx
Figure 3
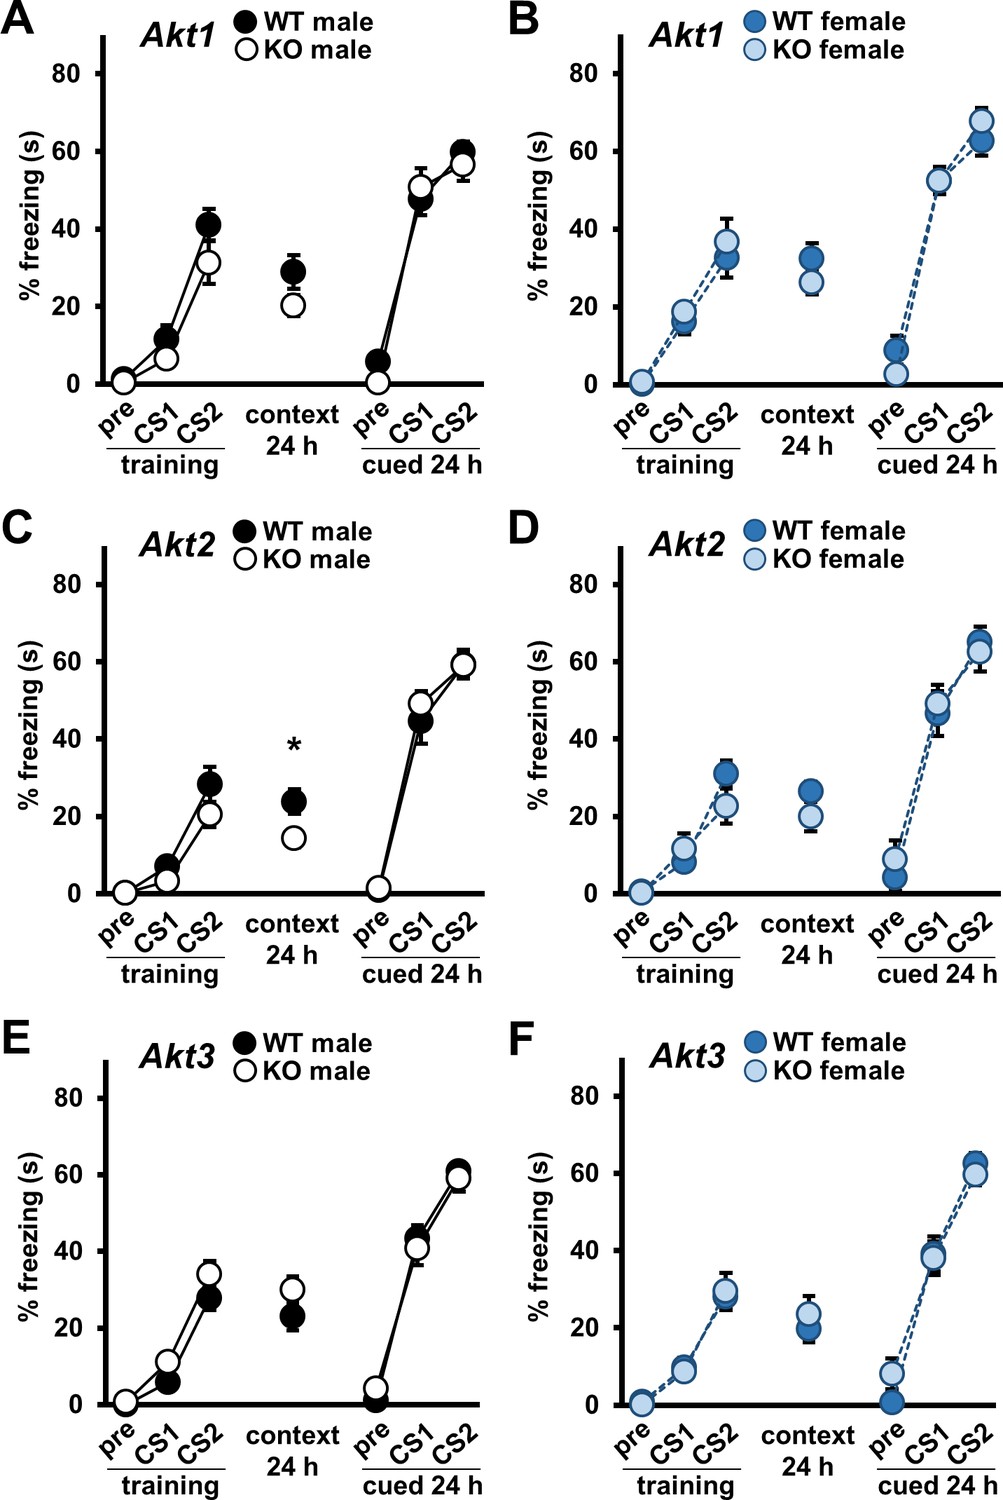
Single Akt isoform deficiency does not impact cued fear LTM but Akt2 deficiency affects contextual fear LTM in males.
Associative fear conditioning acquisition and long-term memory (LTM) in Akt isoform mutant male and female mice shown as percent time spent freezing. In training, freezing behavior was assessed during the baseline (pre) and 30 s after the first (CS1) and second (CS2) CS-US presentations. Contextual and cued LTM were assessed 24–25 hr after training by measuring freezing behavior during the entire test for contextual LTM and during the baseline (pre) and CS presentations (CS1, CS2) in the cued LTM test. Performance of (A) Akt1 KO male, (B) Akt1 KO female, (C) Akt2 KO male, (D) Akt2 KO female, (E) Akt3 KO male, and (F) Akt3 KO female mice. Akt2 KO male mice showed impaired contextual LTM compared with WT controls. No other significant differences were detected between Akt isoform KO and WT mice. *p<0.05. N = Akt1 (WT-M = 16–17, KO-M = 13–15, WT-F = 10, KO-F = 10); Akt2 (WT-M = 14, KO-M = 14–16, WT-F = 10–11, KO-F = 10); Akt3 (WT-M = 18, KO-M = 18–20, WT-F = 17, KO-F = 16–17).
-
Figure 3—source data 1
Figure 3 source data.
- https://cdn.elifesciences.org/articles/56630/elife-56630-fig3-data1-v2.xlsx
Figure 4
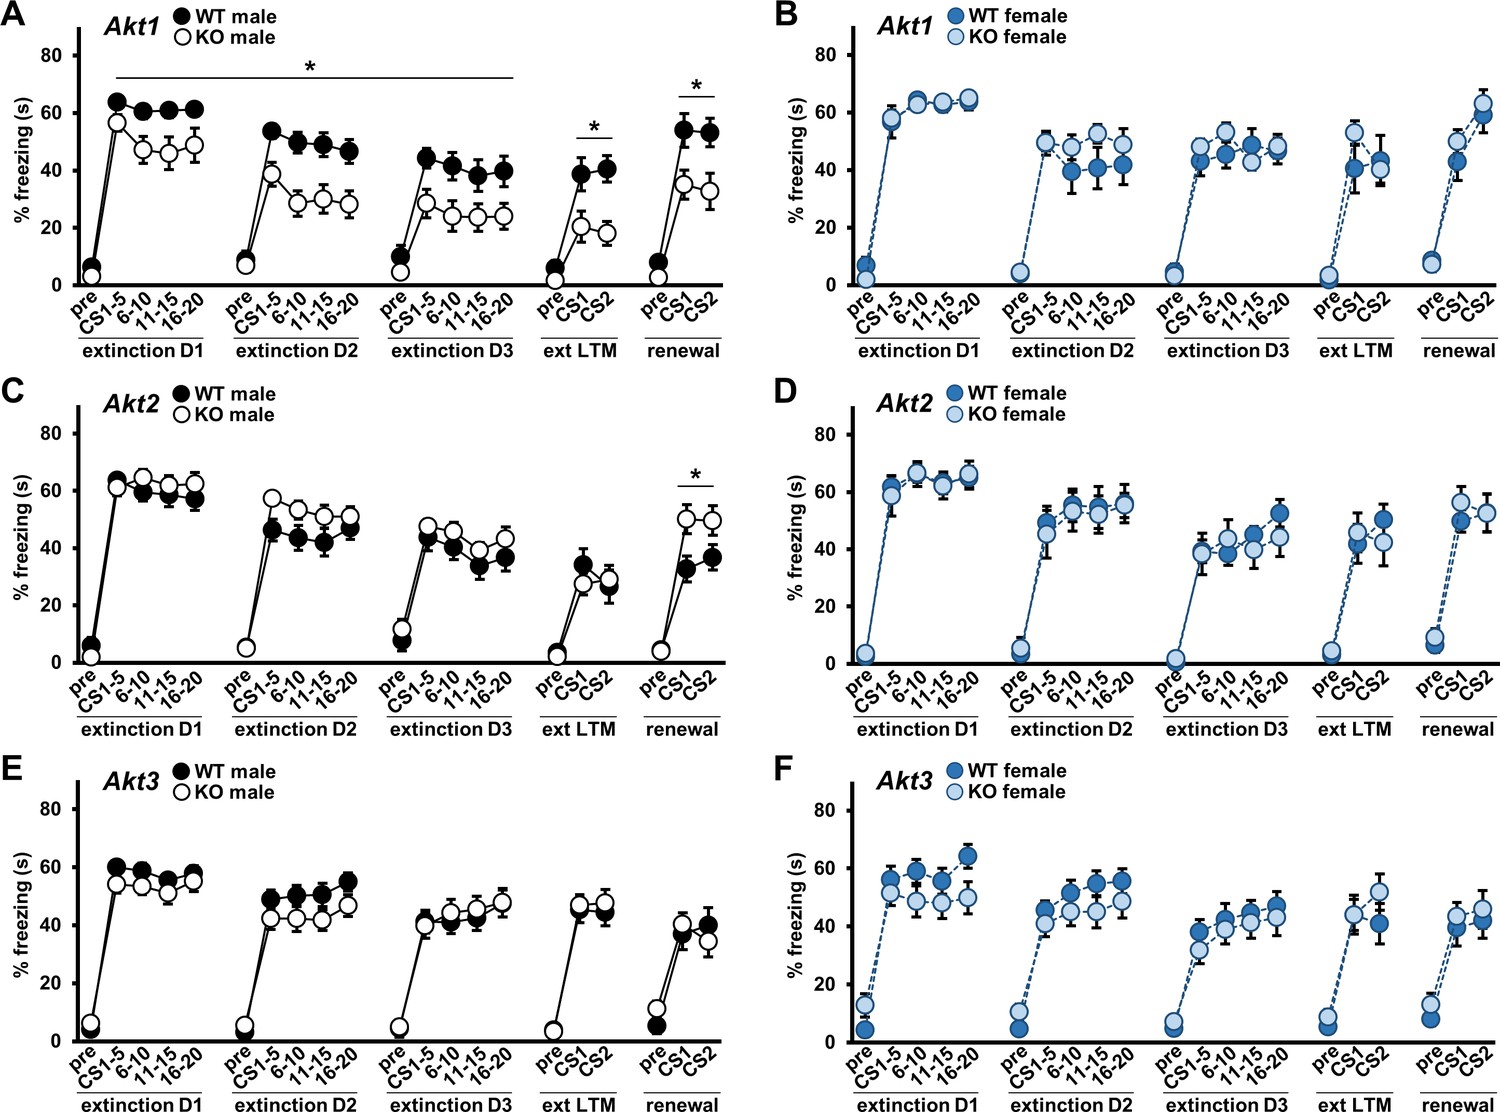
AKT1 deficiency enhances fear extinction learning and AKT2 removal enhances fear renewal.
Extinction training to the CS was performed over three days (D1–D3) with 20 CS presentations each day. Extinction learning in mice measured as percent freezing during the baseline period prior to the first CS (pre) and during each CS presentation shown as average percent freezing in 4 blocks of 5 CS presentations each for every day of training. Efficacy of extinction learning assessed by testing extinction LTM (ext LTM) and renewal of extinguished cued LTM. Ext LTM measured as percent freezing to 2 CS presentations in a novel context 24 hr after completion of extinction training. Renewal measured as percent freezing to 2 CS presentations in the original training context 10 d after ext LTM testing. Performance of (A) Akt1 KO male, (B) Akt1 KO female, (C) Akt2 KO male, (D) Akt2 KO female, (E) Akt3 KO male, and (F) Akt3 KO female. Akt1 KO males showed faster rates of extinction compared with controls while Akt2 KO males showed increased renewal freezing compared with controls. No other significant differences were detected between Akt isoform KO and WT mice. *p<0.05. N = Akt1 (WT-M = 17, KO-M = 15, WT-F = 10, KO-F = 10); Akt2 (WT-M = 13–14, KO-M = 15–16, WT-F = 9, KO-F = 9); Akt3 (WT-M = 18, KO-M = 20, WT-F = 15–17, KO-F = 15–16).
-
Figure 4—source data 1
Figure 4 source data.
- https://cdn.elifesciences.org/articles/56630/elife-56630-fig4-data1-v2.xlsx
Figure 5 with 1 supplement
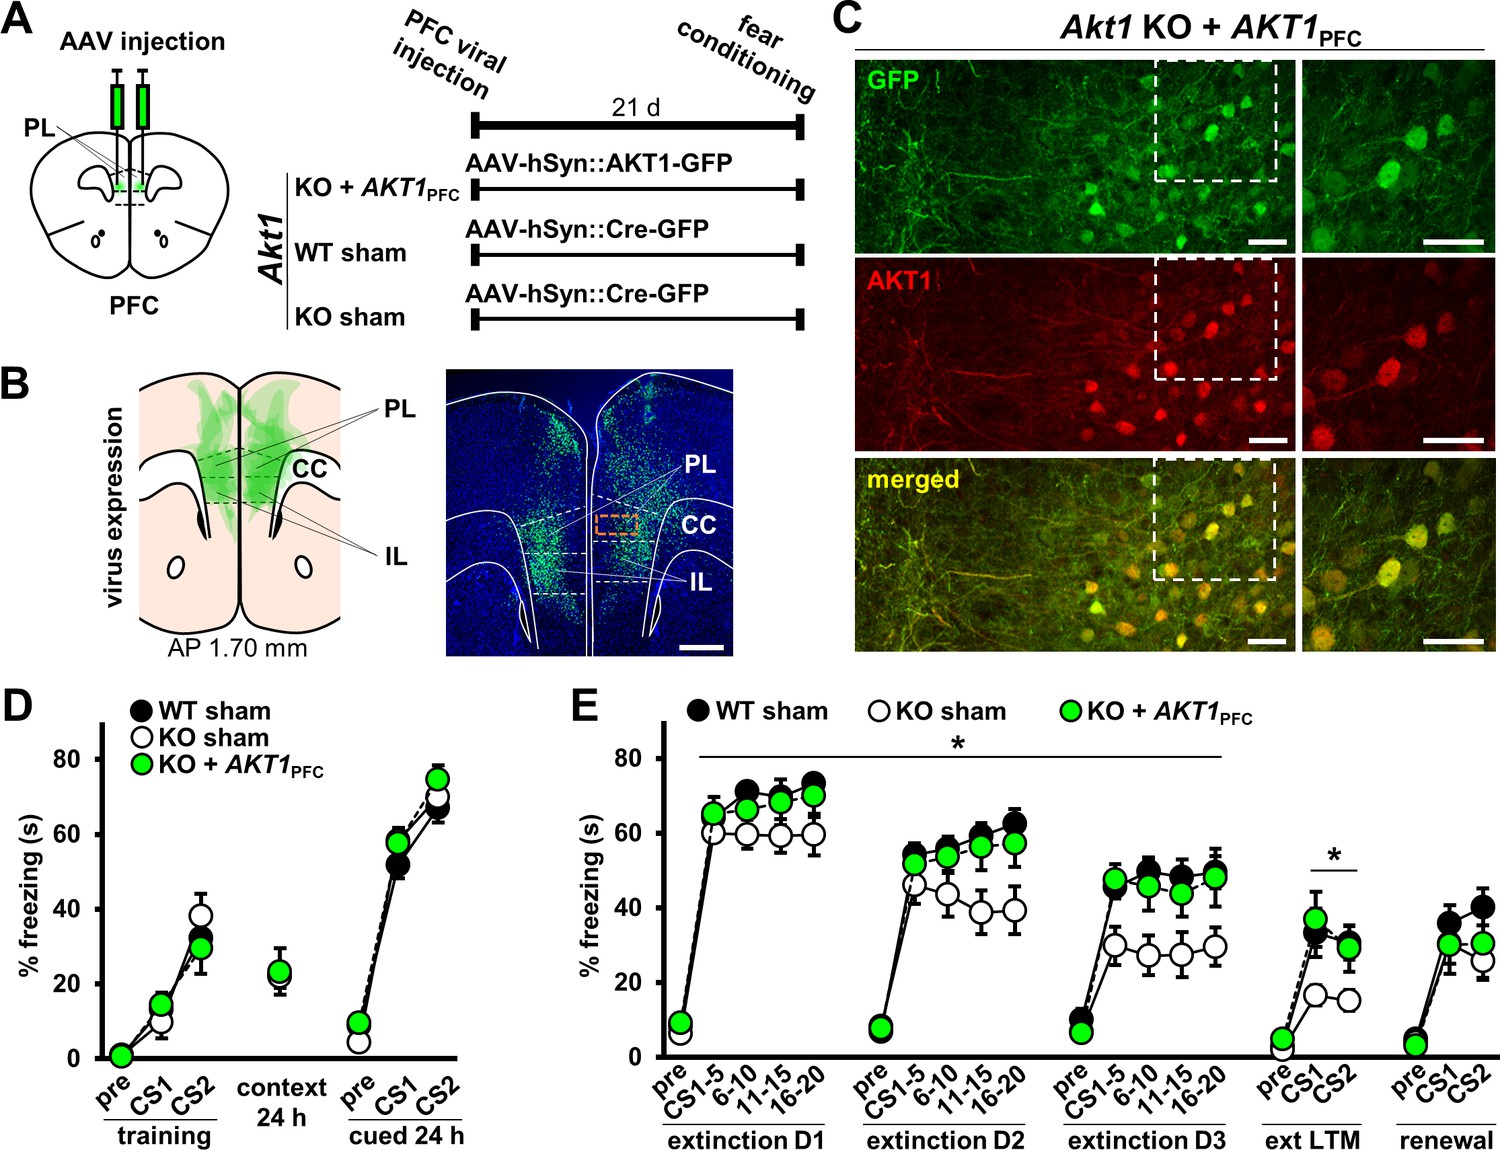
Restoration of AKT1 expression in the PFC normalizes extinction learning and LTM in Akt1 KO males.
(A) Experimental design to test the function of AKT1 in the PFC. AKT1 expression was restored using AAV-mediated pan-neuronal (hSyn) co-expression of AKT1 and green fluorescent protein (GFP) in the PFC of Akt1 KO male mice (KO+AKT1PFC). Sham surgeries were performed on Akt1 KO and WT males using hSyn-driven expression of GFP-tagged Cre recombinase (Cre-GFP) to generate control groups (WT-sham, KO-sham). Mice were injected with AAV in the PL at 1.98 mm AP and then tested on associative fear conditioning and extinction beginning 21 days post-injection. (B) Left: Schematic of AAV expression spread (green areas) in the mouse PFC at 1.70 mm AP overlaid for six subjects (N = 2/group). Right: Representative image of AAV expression. Green, GFP; blue, Hoechst. Scale bar, 500 µm. (C) Higher magnification of PFC corresponding to orange boxed area in (B) right image. Staining for AKT1 (red) in the PFC of KO+AKT1PFC mice confirms that AKT1 expression is restored in neurons and colocalizes with GFP (AAV-infected cells). Scale bars, 40 µm. (D) Sham surgery and AKT1 restoration in Akt1 KO mice did not affect fear acquisition or 24 hr contextual and cued LTM. (E) Extinction learning and LTM were restored to WT levels in KO+AKT1PFC mice but not renewal. KO-sham mice displayed reduced freezing compared with either WT-sham or KO+AKT1PFC groups. *p<0.05. N(WT-sham, KO-sham, KO+AKT1PFC)=15,11,11 except for renewal, due to loss of animals between extinction and renewal test phases: N = 13,11,8. Schematics of the mouse brain are guided by Franklin and Paxinos, 2007. PFC, prefrontal cortex; PL, prelimbic cortex; IL, infralimbic cortex; CC, corpus callosum.
-
Figure 5—source data 1
Figure 5 source data.
- https://cdn.elifesciences.org/articles/56630/elife-56630-fig5-data1-v2.xlsx
Figure 5—figure supplement 1
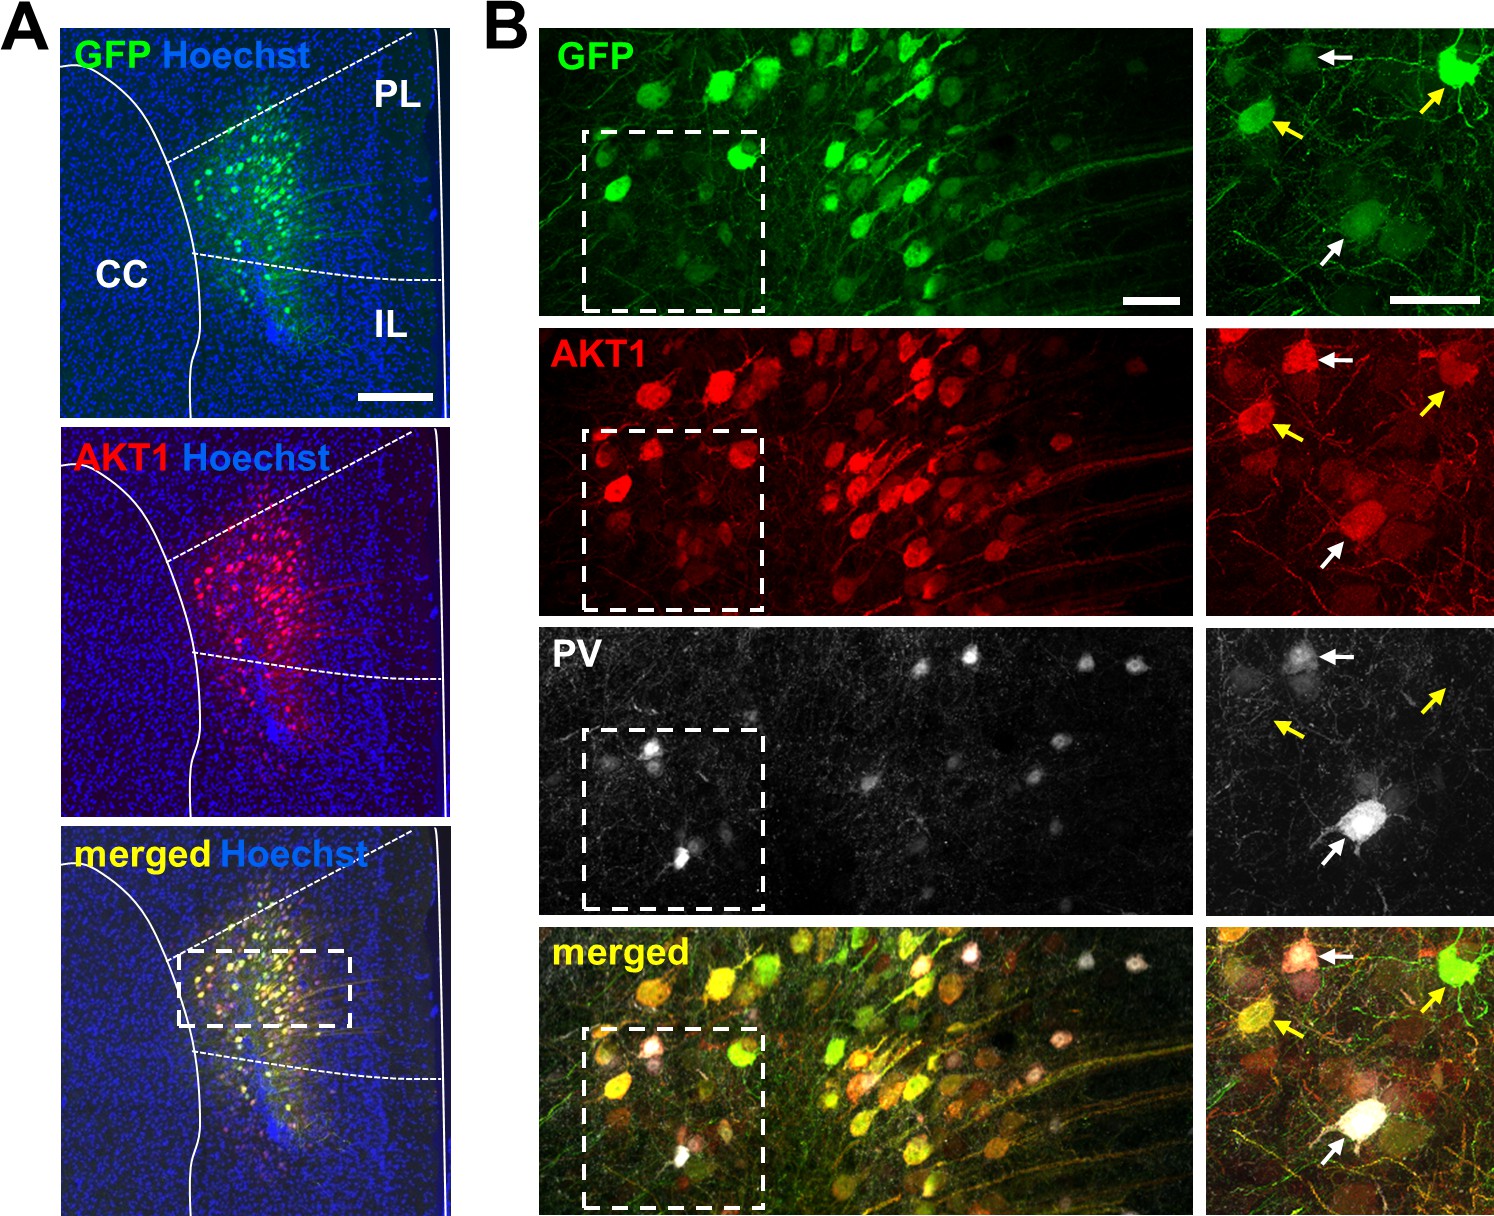
Restoration of neuronal AKT1 expression in the PFC of Akt1 KO male mice.
(A) Representative image of AKT1 and green fluorescent protein (GFP) co-expression in the PFC of Akt1 KO male mice injected with AAV-hSyn::AKT1-GFP. Staining for AKT1 (red) confirms AKT1 expression that colocalizes with GFP (green). Scale bar, 200 µm. (B) Higher magnification images of the white boxed area in (A) shows AAV expression in neurons. The pan-neuronal human synapsin I (hSyn) promoter in the AAV construct drives AKT1 and GFP expression in both excitatory and inhibitory neurons. Co-staining for the interneuronal marker parvalbumin (PV, white) confirms AAV expression in inhibitory neurons (white arrows). Yellow arrows, putative excitatory neurons (PV-negative). Scale bars, 40 µm. PFC, prefrontal cortex; PL, prelimbic cortex; IL, infralimbic cortex; CC, corpus callosum.
Figure 6 with 1 supplement
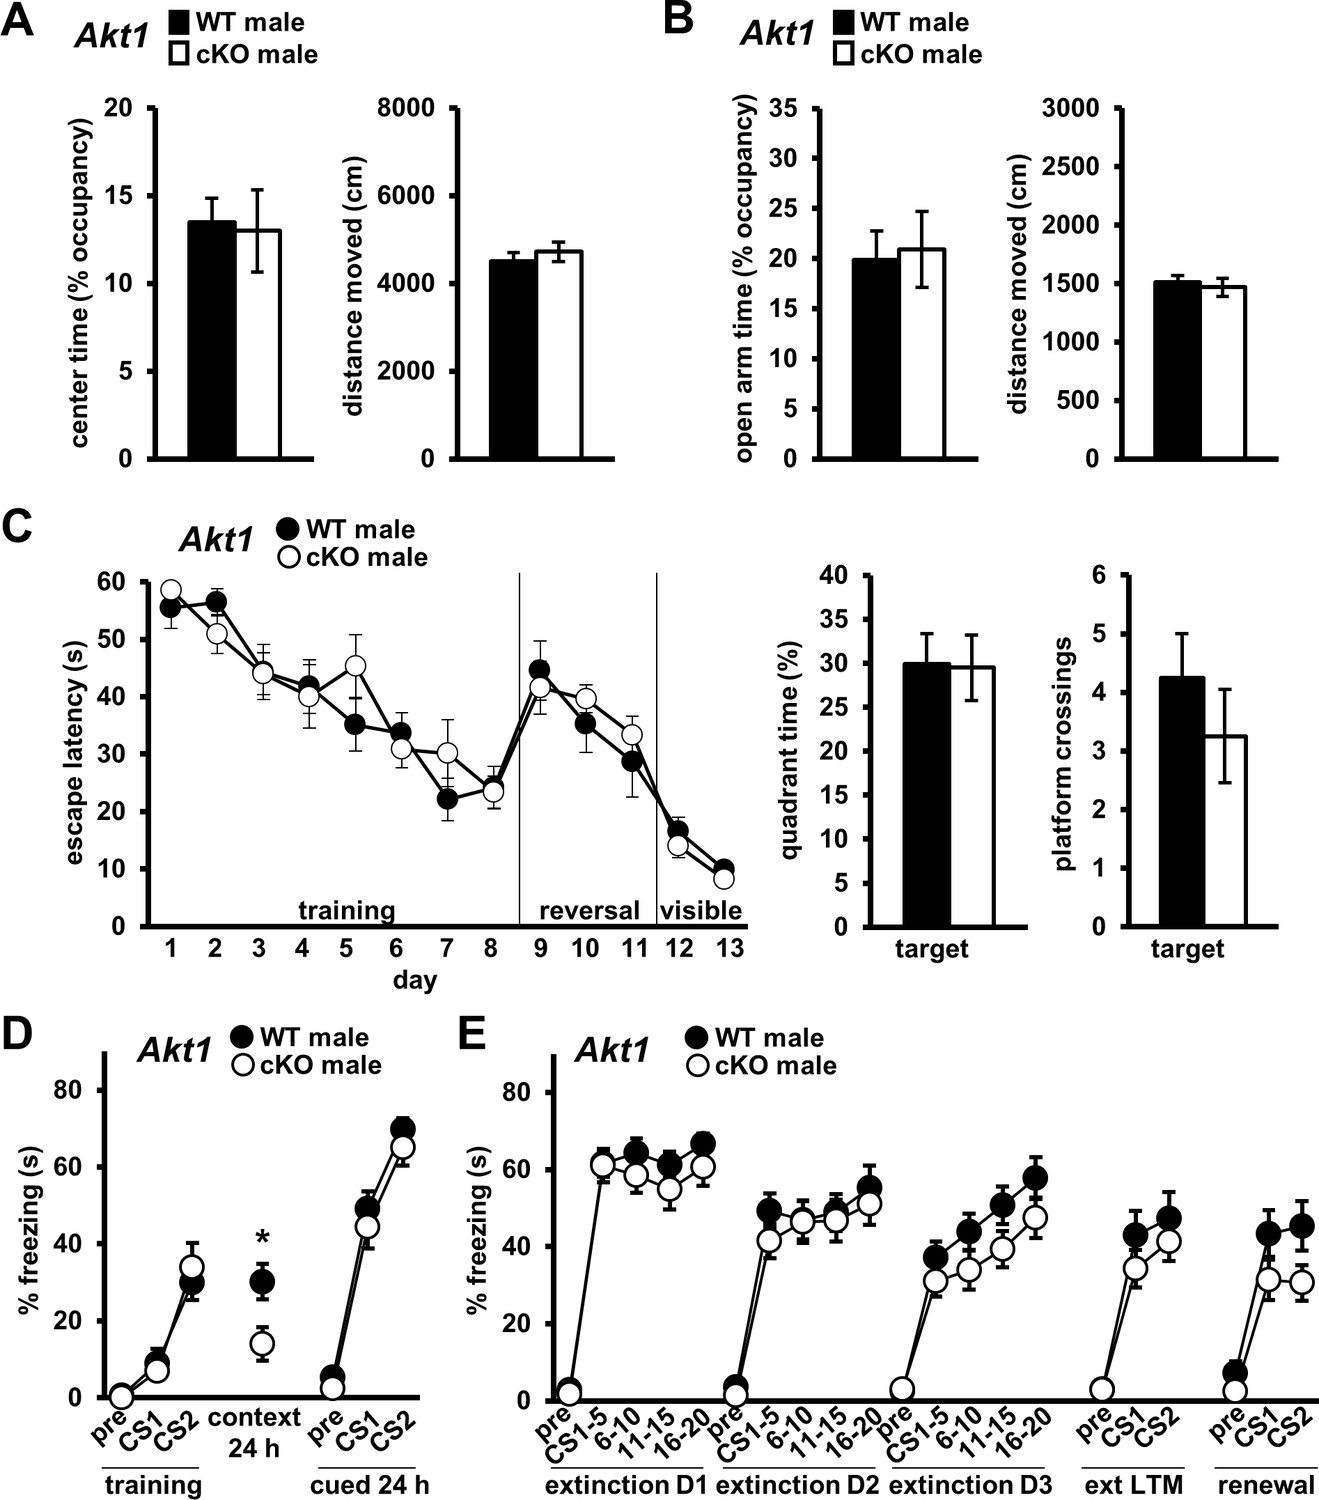
Conditional Akt1 deficiency in excitatory neurons impairs contextual fear LTM but does affect anxiety-related behaviors or fear extinction processes.
Behavior of conditional Akt1 KO (Akt1 cKO) male mice generated by removal of Akt1 with a forebrain excitatory neuron-specific Cre driver in floxed Akt1 mice. (A) OFA activity, measured as percent time spent exploring the center zone, and (B) EPM activity, measured as percent time spent in the open arms, were similar between Akt1 cKO and WT mice. Distance moved during OFA or EPM assays also were similar between genotypes. N = 14 WT, 20 cKO. (C) Akt1 cKO mice and WT controls showed similar latencies to escape the MWM during training, reversal, and visible platform phases and similar probe test performance measured as percent time spent and number of platform location crossings in the target quadrant. N = 8 WT, 8 cKO. (D) Akt1 cKO mice showed impaired contextual fear LTM but no difference in fear learning or cued LTM compared with WT controls. N = 11 WT, 13 cKO. (E) No significant difference in extinction learning, extinction LTM (ext LTM) or renewal was seen between Akt1 cKO and WT mice. N = 11 WT, 13 cKO. *p<0.05.
-
Figure 6—source data 1
Figure 6 source data.
- https://cdn.elifesciences.org/articles/56630/elife-56630-fig6-data1-v2.xlsx
Figure 6—figure supplement 1
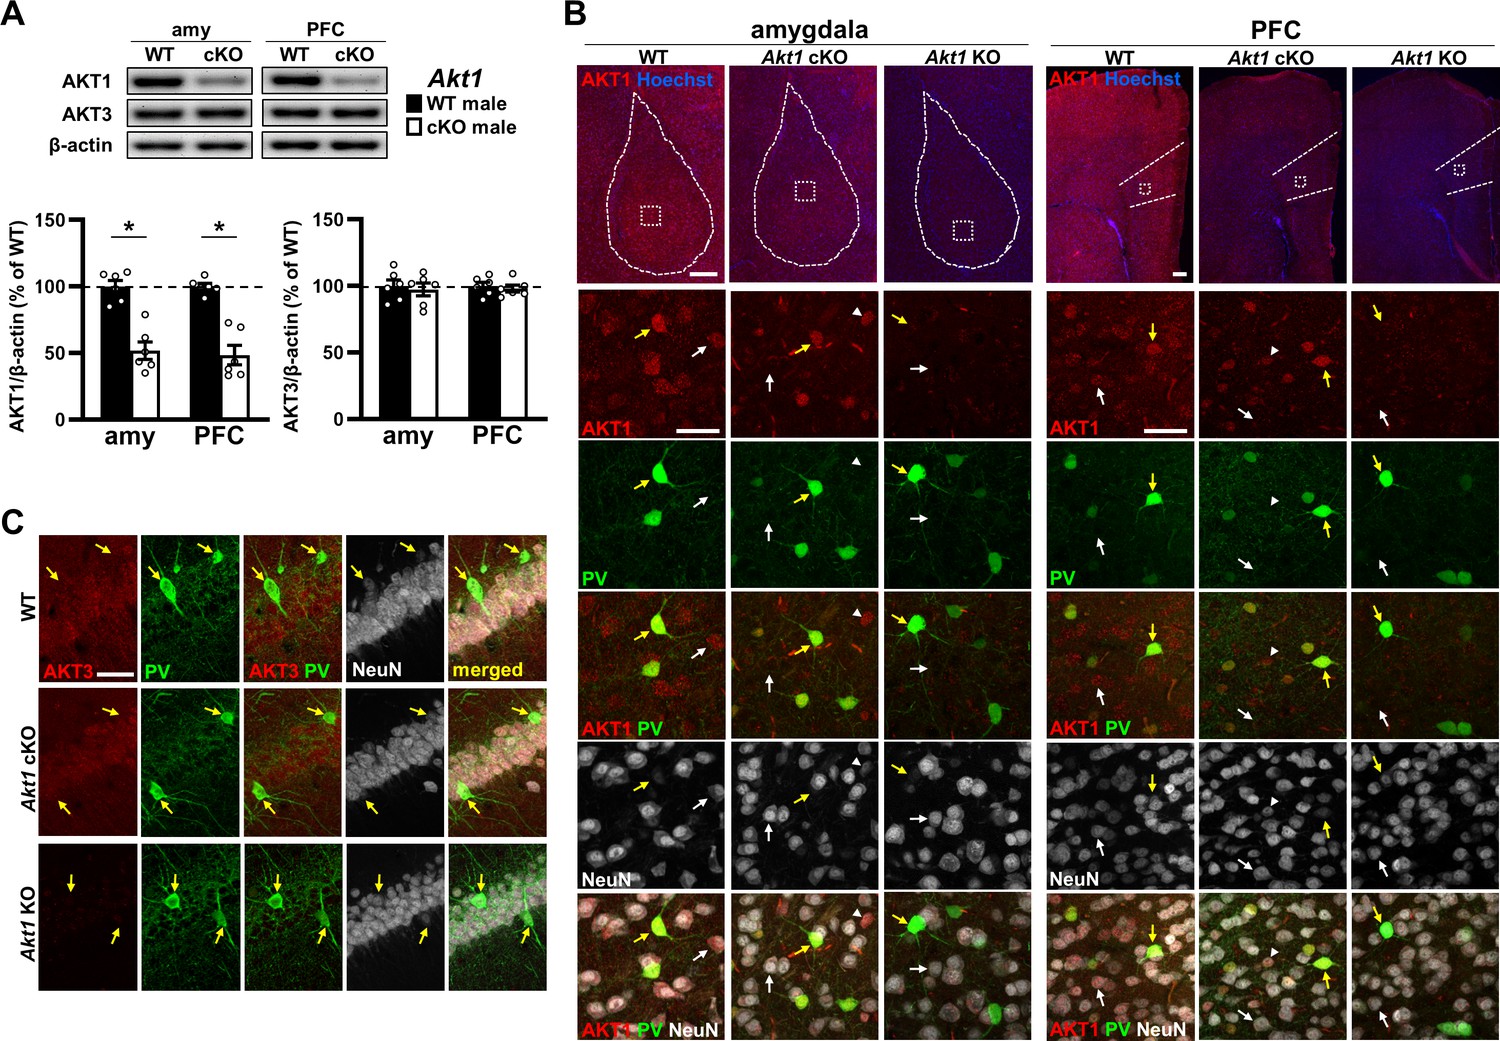
AKT1 expression in conditional Akt1 KO (Akt1 cKO) male mice under the excitatory neuron-specific T29-1 Camk2α-Cre driver.
(A) Western blot analysis shows reduced AKT1 levels in the amygdala (amy) and prefrontal cortex (PFC) of Akt1 cKO mice compared with WT controls while AKT3 levels are not affected. β-actin, loading control. N = 6/genotype. *p<0.05. (B) Immunostaining shows AKT1 is normally expressed in both excitatory and inhibitory neurons, marked by NeuN, and confirms AKT1 removal in Akt1 cKO mice from most neurons, putatively excitatory neurons (white arrows), in the amy and PFC. Inhibitory neurons marked by parvalbumin (PV, yellow arrows) show intact AKT1 expression in Akt1 cKO mice. Arrowhead, putative inhibitory neuron of another subtype (PV-negative). Hoechst, nuclear stain. Scale bars: 200 μm (top row), 40 μm (below). (C) AKT3 is normally detected in excitatory neurons but not PV-positive neurons (yellow arrows) in hippocampal area CA1 and does not show a compensatory increase in expression in Akt1 cKO mice. Scale bar, 40 μm.
Figure 7
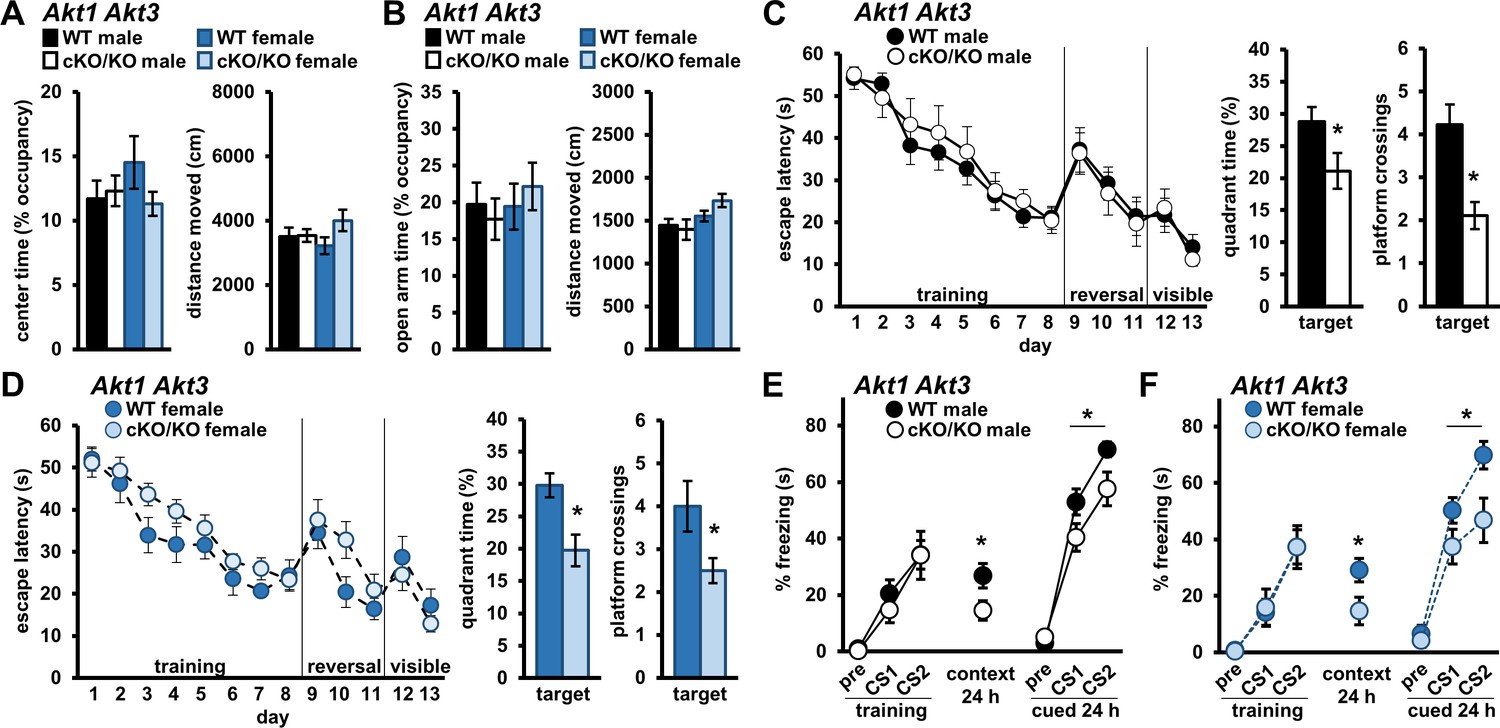
Simultaneous removal of AKT1 and AKT3 isoforms from the brain promotes memory deficits in both male and female mice.
Male and female mice with conditional Akt1 removal in the background of Akt3 deficiency (Akt1 cKO Akt3 KO) were assessed in anxiety-related behavior, spatial memory, and associative fear memory tests. No differences were detected between Akt1 cKO Akt3 KO mutant mice and WT controls for both sexes in (A) OFA activity, measured as percent time spent exploring the center zone, and (B) EPM activity, measured as percent time spent in the open arms. Distance moved during OFA or EPM assays were similar between genotypes for both sexes. N = 15 WT-M, 13 cKO/KO-M, 16 WT-F, 15 cKO/KO-F. (C) Male and (D) female Akt1 cKO Akt3 KO mice had similar latencies to escape the MWM during training, reversal, and visible platform phases compared to their respective WT controls but showed significantly reduced target quadrant time and platform crossings. N = 13 WT-M, 9 cKO/KO-M, 12 WT-F, 12 cKO/KO-F. (E) Male and (F) female Akt1 cKO Akt3 KO mice displayed normal fear learning but impaired contextual and cued LTM compared with their respective WT controls. N = 11 WT-M, 11 cKO/KO-M, 14 WT-F, 10–11 cKO/KO-F. *p<0.05.
-
Figure 7—source data 1
Figure 7 source data.
- https://cdn.elifesciences.org/articles/56630/elife-56630-fig7-data1-v2.xlsx
Figure 8

AKT expression under normal and deficiency conditions are regulated similarly between sexes.
(A) Western blot analysis of AKT isoforms individually, detected with isoform-specific AKT antibodies, and all together, detected with pan-AKT antibodies, in the hippocampus of male versus female WT mice. Left: Representative blots. Middle: Total levels of each AKT isoform and pan-AKT normalized by GAPDH levels and shown as percent of immunoreactivity in WT males. Right: Phosphorylated (p) levels of individual and all (pan) AKT isoforms normalized by their respective total levels and shown as percent of immunoreactivity in WT males. No differences between the sexes were detected except higher AKT2 levels in female WT mice compared with males. N = AKT1,2, pan-AKT: 10 WT-M, 11 WT-F; AKT3: 9 WT-M, 10 WT-F. (B–C) Western blot analysis of total (pan-AKT) and phosphorylated (pan-pAKT) AKT levels in the hippocampus of (B) male and (C) female mice with single-isoform deletions of Akt1, Akt2, or Akt3 compared with their respective WT controls. Top: Representative blots. Left: Total AKT levels normalized by GAPDH levels and shown as percent of immunoreactivity in WT controls. Right: Pan-pAKT levels normalized by pan-AKT levels and shown as percent of immunoreactivity in WT controls. Both sexes showed reduced total AKT levels with single Akt isoform deletions and an upregulation of pAKT levels with Akt1 deficiency. N = Akt1: 7 WT-M, 7 KO-M, 8 WT-F, 8 KO-F; Akt2: 7 WT-M, 7 KO-M, 6 WT-F, 6 KO-F; Akt3: 5 WT-M, 5 KO-M, 4 WT-F, 5 KO-F. (D) Western blot analysis of pAKT2 levels normalized by total AKT2 levels in the hippocampus of Akt1 KO male (left graph) and female (right graph) mice compared with their respective WT controls and shown as percent of immunoreactivity in WT controls. Left: Representative blots. Both sexes showed increased pAKT2 levels in response to Akt1 deficiency. N = 7 WT-M, 7 KO-M, 8 WT-F, 8 KO-F. (E) Western blot analysis of pAKT1 levels normalized by total AKT1 levels in the hippocampus of Akt3 KO male (left graph) and female (right graph) mice compared with their respective WT controls and shown as percent of immunoreactivity in WT controls. Left: Representative blots. Both sexes showed increased pAKT1 levels in response to Akt3 deficiency. N = 5 WT-M, 5 KO-M, 8 WT-F, 9 KO-F. *p<0.05.
-
Figure 8—source data 1
Figure 8 source data.
- https://cdn.elifesciences.org/articles/56630/elife-56630-fig8-data1-v2.xlsx
Figure 9 with 3 supplements
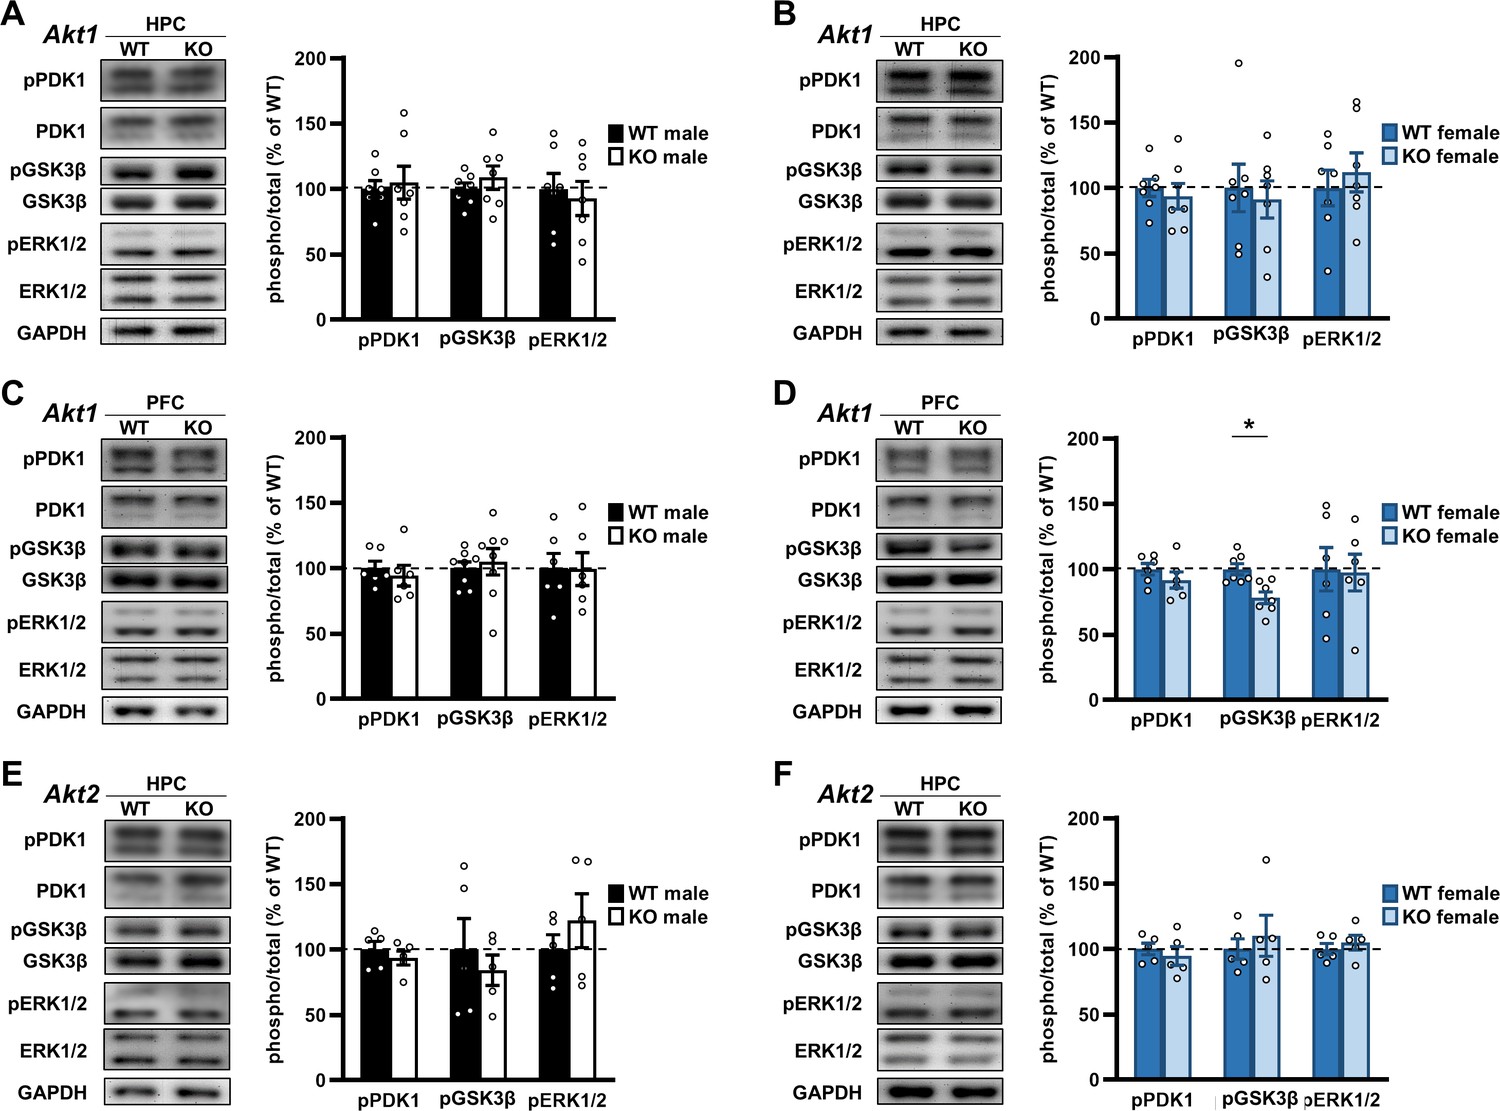
Examination of Akt isoform deficiency effects on neuromolecular signaling pathways.
Upstream signaling of AKT was assessed by measuring phosphorylation levels of phosphoinositide-dependent protein kinase 1 (PDK1) at serine 241. Downstream signaling of AKT was assessed by measuring phosphorylation levels of glycogen synthase kinase three beta (GSK3β) at serine 9. Crosstalk between AKT and the extracellular regulated kinase (ERK) pathway was assessed by measuring ERK1 and ERK2 phosphorylation levels at threonine 204/tyrosine 202 and threonine 185/tyrosine 187, respectively. See Figure 9—figure supplement 1 for schematic of pathways. (A) Western blot analysis of phosphorylated (p) proteins normalized by their respective total levels in the hippocampus (HPC) of Akt1 KO males and shown as percent of immunoreactivity in WT controls. Left: Representative blots. N = 7 WT, 7 KO. (B) Western blot analysis of signaling in the HPC of Akt1 KO females. N = 7 WT, 7 KO. (C) Western blot analysis of signaling in the prefrontal cortex (PFC) of Akt1 KO males. pPDK1, pERK1/2: N = 6 WT, 6 KO; pGSK3β N = 8 WT, 8 KO. (D) Western blot analysis of signaling in the PFC of Akt1 KO females showed reduced pGSK3β levels compared with WT controls. pPDK1, pERK1/2: N = 6 WT, 6 KO; pGSK3β N = 7 WT, 7 KO. (E) Western blot analyses of signaling in the HPC of Akt2 KO males and (F) females compared to their respective WT controls. N = 5 WT-M, 5 KO-M, 5 WT-F, 5 KO-F. *p<0.05.
-
Figure 9—source data 1
Figure 9 source data.
- https://cdn.elifesciences.org/articles/56630/elife-56630-fig9-data1-v2.xlsx
Figure 9—figure supplement 1
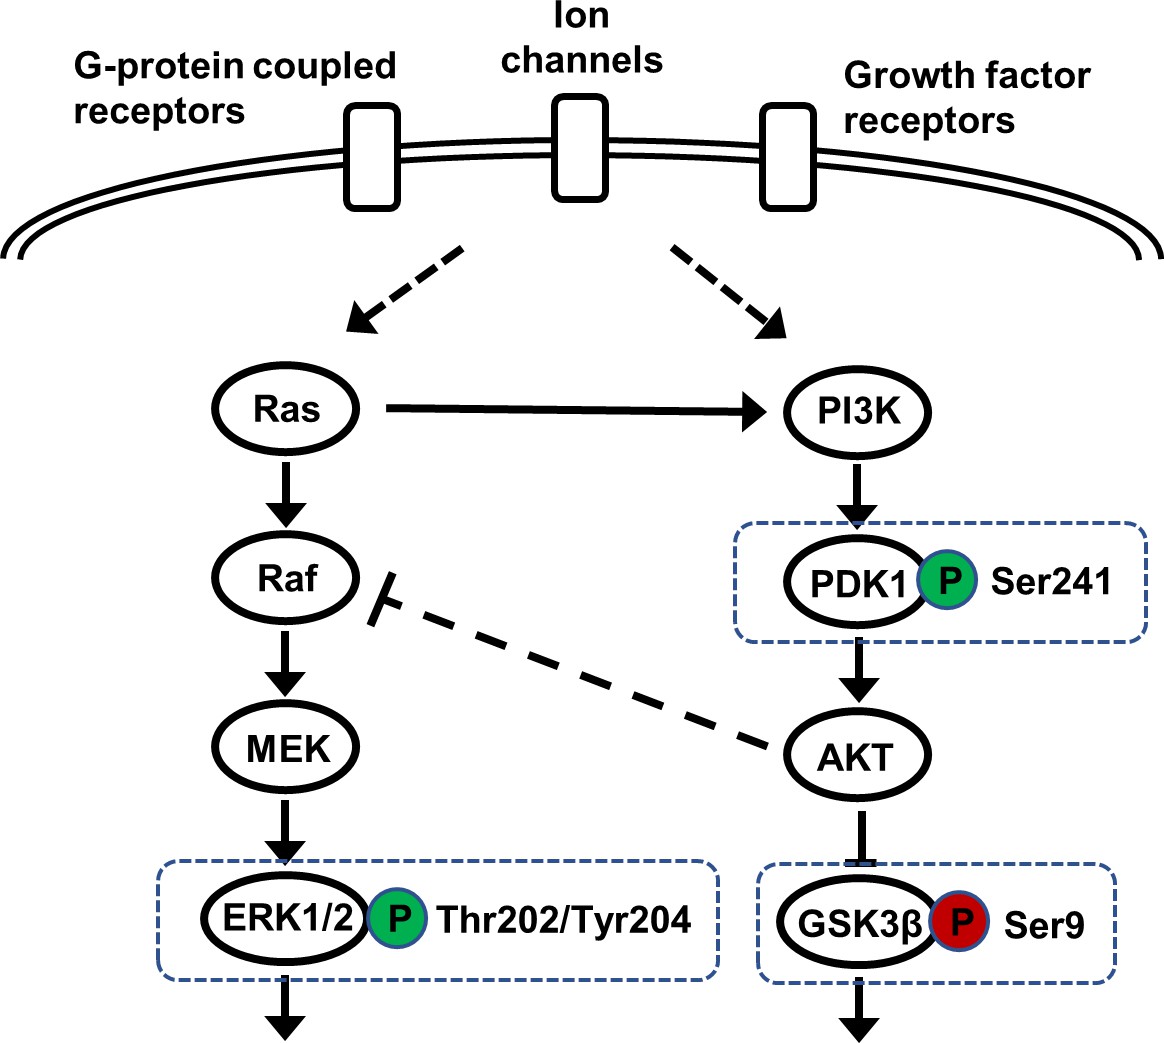
Schematic of AKT-dependent and interacting signaling pathways.
Candidate pathways (boxed) upstream (PDK1), downstream (GSK3β), and parallel (ERK) to AKT were examined by western blot analysis to assess the impact of Akt isoform deficiency on signaling in the brain.
Figure 9—figure supplement 2
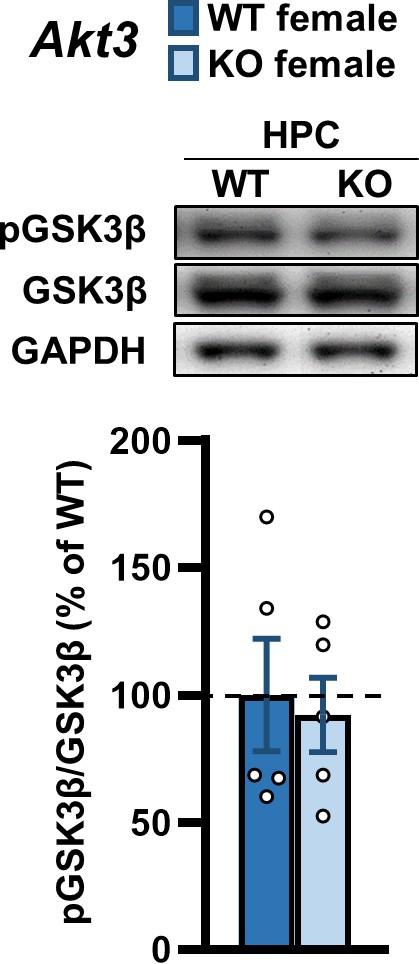
Akt3 deficiency does not alter GSK3β activation in the hippocampus of female mice.
Western blot analysis of GSK3β phosphorylation at serine 9 (pGSK3β) normalized by total GSK3β levels reveals no difference in the hippocampus between female Akt3 KO and WT mice. GAPDH, loading control. N = 5/group.
Figure 9—figure supplement 3
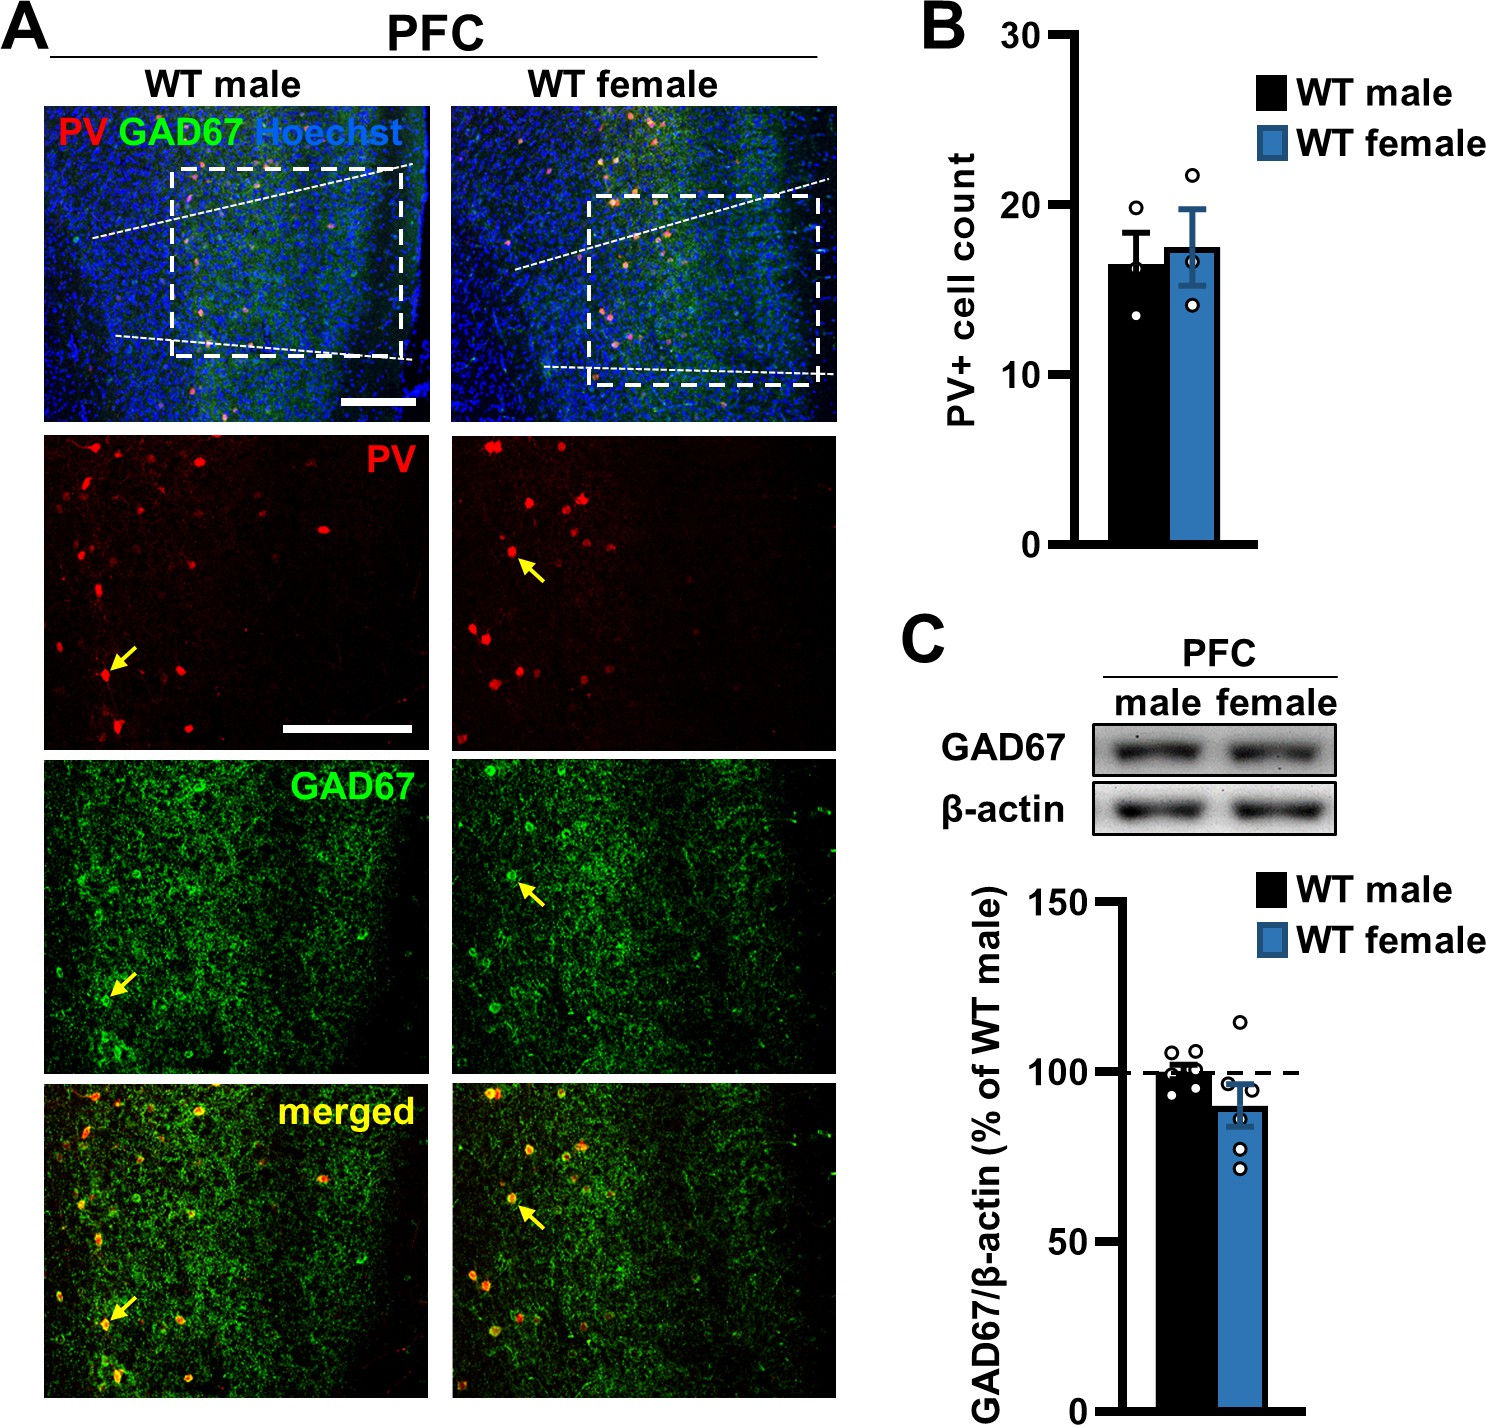
Interneuron expression in the PFC of male and female WT mice.
(A) Representative immunostaining for the interneuronal markers parvalbumin (PV, red) and glutamate decarboxylase 67 (GAD67, green) in the prelimbic region of the PFC of male and female WT mice. Yellow arrows, interneuronal cell bodies co-expressing PV and GAD67. Hoechst (blue), nuclear stain. Scale bars, 200 µm. (B) Quantification of the average number of PV-positive cells in the PFC corresponding to the white box in (A) shows no difference between male and female WT mice. N = 3 mice/sex. Cell counts were averaged from five coronal sections of the PFC between 1.98 and 1.70 mm AP in one hemisphere for each mouse and from two observers blind to the experimental groups. (C) Western blot analysis of PFC lysates from WT mice shows no significant difference in GAD67 levels between sexes. β-actin, loading control N = 6/sex.
Tables
Table 1
Summary of behavioral impacts of Akt isoform deficiency.
| Behavioral assay | Genotype and/or viral expression manipulation | |||||
|---|---|---|---|---|---|---|
| Akt1 KO | Akt2 KO | Akt3 KO | Akt1 KO + virally expressed PFC AKT1 (male only) | Akt1 cKO (male only) | Akt1 cKO Akt3 KO | |
| OFA | reduced center time in males | no effect | no effect | n/a | no effect | no effect |
| EPM | reduced open arm time in males | reduced open arm time in males | no effect | n/a | no effect | no effect |
| MWM | reduced platform crossings during probe test in males | no effect | no effect | n/a | no effect | reduced quadrant time and platform crossings during probe test in males and females |
| Contextual fear LTM | no effect | impaired in males | no effect | no effect | impaired | impaired in males and females |
| Cued fear LTM | no effect | no effect | no effect | no effect | no effect | impaired in males and females |
| Fear extinction learning | enhanced | no effect | no effect | restored to WT levels | no effect | n/a |
| Fear extinction LTM | reduced in males | no effect | no effect | restored to WT levels | no effect | n/a |
| Fear extinction renewal | reduced in males | enhanced in males | no effect | no statistical difference from WT | no effect | n/a |
Key resources table
| Reagent type (species) or resource | Designation | Source or reference | Identifiers | Additional information |
|---|---|---|---|---|
| Antibody | anti-AKT1 (Rabbit monoclonal) | Cell Signaling | Cat# 2938; RRID:AB_915788 | WB (1:2000) |
| Antibody | anti-AKT1 (Rabbit monoclonal) | Cell Signaling | Cat# 75692; RRID:AB_2716309 | IHC (1:100) |
| Antibody | anti-AKT1 phospho-S473 (Rabbit monoclonal) | Cell Signaling | Cat# 9081; RRID:AB_11178946 | WB (1:1000) |
| Antibody | anti-AKT2 (Rabbit monoclonal) | Cell Signaling | Cat# 2964; RRID:AB_331162 | WB (1:1000); IHC (1:100) |
| Antibody | anti-AKT2 phospho-S474 (Rabbit monoclonal) | Cell Signaling | Cat# 8599; RRID:AB_2630347 | (1:1000) |
| Antibody | anti-AKT3 (Mouse monoclonal) | Cell Signaling | Cat# 8018; RRID:AB_10859371 | WB (1:2000) |
| Antibody | anti-AKT3 (Rabbit monoclonal) | Cell Signaling | Cat# 14982; RRID:AB_2716311 | IHC (1:100) |
| Antibody | anti-pan-AKT (Rabbit monoclonal) | Cell Signaling | Cat# 4685; RRID:AB_2225340 | WB (1:5000) |
| Antibody | anti-pan-AKT phospho-S473 (Rabbit monoclonal) | Cell Signaling | Cat# 4058; RRID:AB_331168 | WB (1:2000) |
| Antibody | anti-GAPDH (Rabbit monoclonal) | Cell Signaling | Cat# 5174; RRID:AB_10622025 | WB (1:20000) |
| Antibody | anti-β-actin (Mouse monoclonal) | Cell Signaling | Cat# 3700; RRID:AB_2242334 | WB (1:20000) |
| Antibody | anti-PDK1 phospho-S241 (Rabbit polyclonal) | Cell Signaling | Cat# 3061; RRID:AB_2161919 | WB (1:5000) |
| Antibody | anti-PDK1 (Rabbit polyclonal) | Cell Signaling | Cat# 3062; RRID:AB_2236832 | WB (1:1000) |
| Antibody | anti-GSK3β phospho-S9 (Rabbit monoclonal) | Cell Signaling | Cat# 5558; RRID:AB_10013750 | WB (1:5000) |
| Antibody | anti-GSK3β (Rabbit monoclonal) | Cell Signaling | Cat# 9315; RRID:AB_490890 | WB (1:5000) |
| Antibody | anti-ERK1/2 phospho-T202/Y204 (Rabbit polyclonal) | Cell Signaling | Cat# 9101; RRID:AB_331646 | WB (1:2000) |
| Antibody | anti-ERK1/2 (Rabbit polyclonal) | Cell Signaling | Cat# 9102; RRID:AB_330744 | WB (1:7500) |
| Antibody | anti-NeuN (Mouse monoclonal) | Novus | Cat# NBP1-92693; RRID:AB_11036146 | IHC (1:1000) |
| Antibody | anti-GAD67 (Mouse monoclonal) | Millipore | Cat# MAB5406 RRID:AB_2278725 | IHC (1:1500) WB (1:10000) |
| Antibody | anti-paravalbumin (Mouse monoclonal) | Millipore | Cat# MAB1572; RRID:AB_2174013 | IHC (1:1000) |
| Antibody | anti-rabbit Cy3 (Donkey polyclonal) | Jackson ImmunoResearch | Cat# 711-165-152; RRID:AB_2307443 | (1:250) |
| Antibody | anti-mouse IgG2b Alexa 647 (Goat polyclonal) | Invitrogen | Cat# A-21242; RRID:AB_2535811 | (1:500) |
| Antibody | anti-mouse IgG1 Alexa 488 (Goat polyclonal) | Invitrogen | Cat# A-21121; RRID:AB_2535764 | (1:500) |
| Antibody | anti-mouse HRP (Goat polyclonal) | Promega | Cat# W4021; RRID:AB_430834 | (1:5000–20000) |
| Antibody | anti-rabbit HRP (Goat polyclonal) | Promega | Cat# W4011; RRID:AB_430833 | (1:5000–20000) |
| Other | Hoechst | Thermo Fisher Scientific | Cat# H3569; RRID:AB_2651133 | (1:3000) |
| Genetic reagent (Mus musculus), both sexes | Akt1tm1Mbb, C57BL/6 (Akt1 KO) | Jackson Laboratory | Stock # 004912; RRID:IMSR_JAX:004912 | |
| Genetic reagent (Mus musculus), both sexes | Akt2tm1.1Mbb, C57BL/6 (Akt2 KO) | Jackson Laboratory | Stock # 006966; RRID:IMSR_JAX:006966 | |
| Genetic reagent (Mus musculus), both sexes | Akt3tm1.3Mbb, C57BL/6 (Akt3 KO) | Easton et al., 2005; PMCID:PMC549378 | MGI Cat# 3804003, RRID:MGI:3804003 | Obtained from Birnbaum lab (UPenn) |
| Genetic reagent (Mus musculus), both sexes | Akt1tm2.2Mbb,C57BL/6 (Akt1fl/fl) | Jackson Laboratory | Stock #026474; RRID:IMSR_JAX:026474 | |
| Genetic reagent (Mus musculus), females only | Tg(CamkIIa-Cre)T29Stl, C57BL/6 (Camk2a-Cre) | Hoeffer et al., 2008; PMCID:PMC2630531 | MGI Cat# 6273652, RRID:MGI:6273652 | Obtained from Kelleher lab (MIT) before the Tonegawa lab submitted a strain to Jax with same name; not same strain as listed at JAX. Expression properties for this line in Hoeffer et al., 2008. |
| Recombinant DNA reagent | hSyn-hAKT1-hSyn-eGFP (AAV) | Vector Biolabs | RRID:SCR_011010 AKT1:Genbank RefSeq# BC000479.2 | Commercially produced custom construct |
| Recombinant DNA reagent | hSyn-eGFP-Cre (AAV) | Penn Vector Core | RRID:Addgene 105540 | |
| Software, algorithm | IBM SPSS Statistics | IBM Analytics | RRID:SCR_002865 | |
| Software, algorithm | Prism | GraphPad | RRID:SCR_002798 | |
| Software, algorithm | ImageQuant TL | GE Healthcare | RRID:SCR_014246 | |
| Software, algorithm | Icy | Institut Pasteur and France-BioImaging | RRID:SCR_010587 | Open source image processing |
Additional files
-
Supplementary file 1
Statistical analysis using t-tests.
- https://cdn.elifesciences.org/articles/56630/elife-56630-supp1-v2.docx
-
Supplementary file 2
Outliers and justification.
- https://cdn.elifesciences.org/articles/56630/elife-56630-supp2-v2.docx
-
Supplementary file 3
Statistical analysis using ANOVAs.
- https://cdn.elifesciences.org/articles/56630/elife-56630-supp3-v2.docx
-
Transparent reporting form
- https://cdn.elifesciences.org/articles/56630/elife-56630-transrepform-v2.docx
Download links
A two-part list of links to download the article, or parts of the article, in various formats.
Downloads (link to download the article as PDF)
Open citations (links to open the citations from this article in various online reference manager services)
Cite this article (links to download the citations from this article in formats compatible with various reference manager tools)
Isoform-specific roles for AKT in affective behavior, spatial memory, and extinction related to psychiatric disorders
eLife 9:e56630.
https://doi.org/10.7554/eLife.56630


