Atomic structure of a mitochondrial complex I intermediate from vascular plants
- Department of Molecular and Cellular Biology, University of California Davis, United States
- BIOEM Facility, University of California Davis, United States
Figures
Figure 1 with 4 supplements
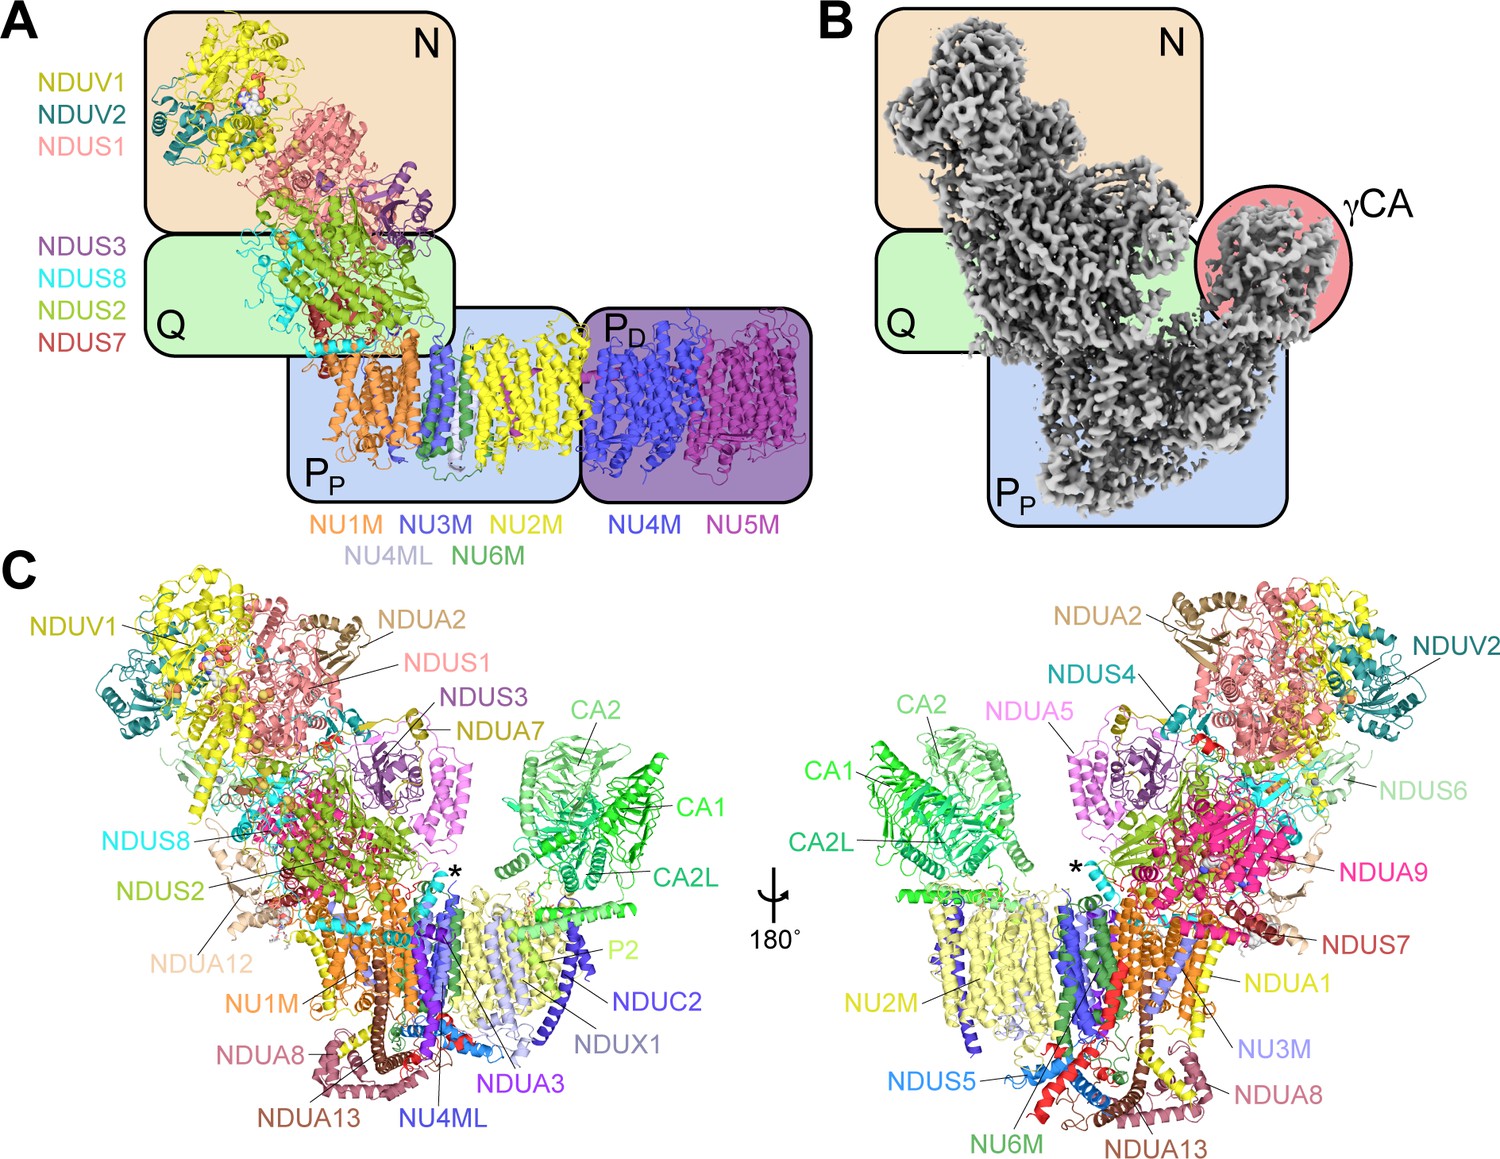
The structure of CI* from Vigna radiata.
(A) An overview of the conserved modular structure of CI using the Thermus thermophilus bacterial core subunits as a simple model (PDB: 4HEA) (Baradaran et al., 2013). (B) CryoEM density map of CI* from V. radiata highlighting its modular architecture. N, NADH-binding module; Q, quinone-binding module; PP, proximal-pump module; PD, distal-pump module; γCA, carbonic anhydrase domain, see also Video 1). (C) Atomic model of V. radiata CI* with all 30 assigned subunits labeled. The additional N-terminal helix of NDUS8 is indicated with an asterisk (*).
Figure 1—figure supplement 1
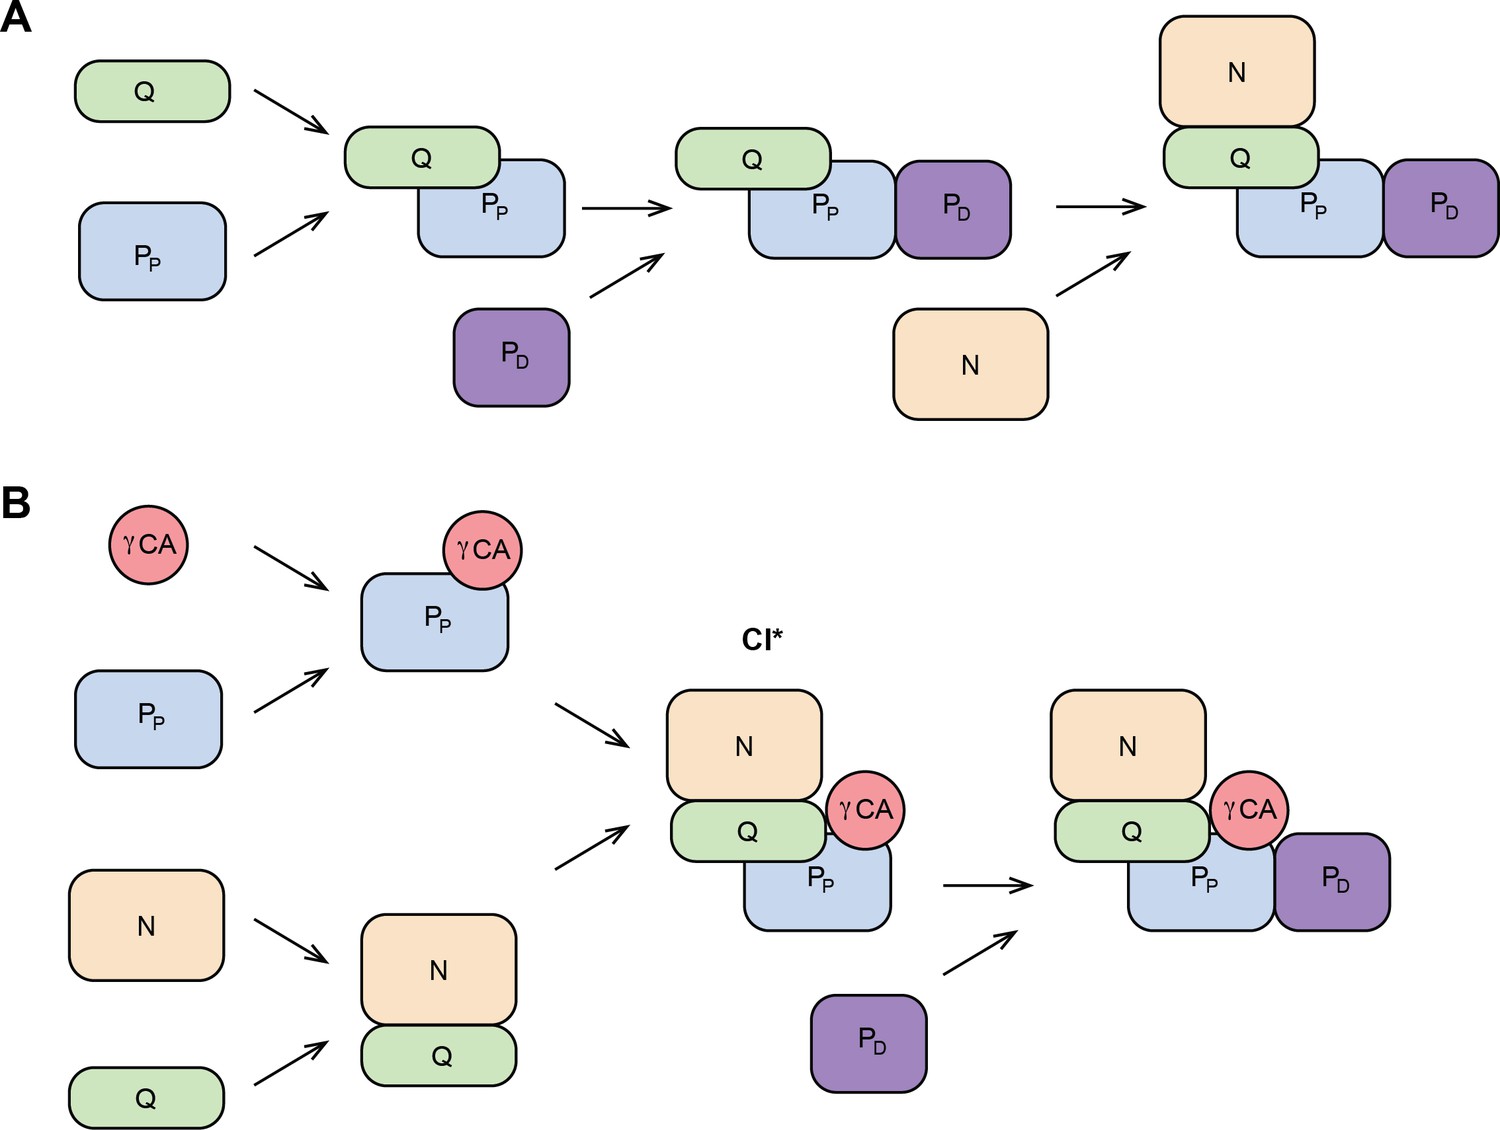
Schematic CI assembly pathways in metazoans and plants.
(A) CI assembly in metazoans. N-module is added at the last step of assembly. (B) CI assembly in plants. CI* intermediate is assembled before the PD domain is added last. N, NADH-binding module; Q, quinone-binding module; PP, proximal-pumps module; PD, distal-pumps module; γCA, carbonic anhydrase domain. Based on Formosa et al., 2018; Guerrero-Castillo et al., 2017; Garcia et al., 2017; Stroud et al., 2016; Ligas et al., 2019.
Figure 1—figure supplement 2
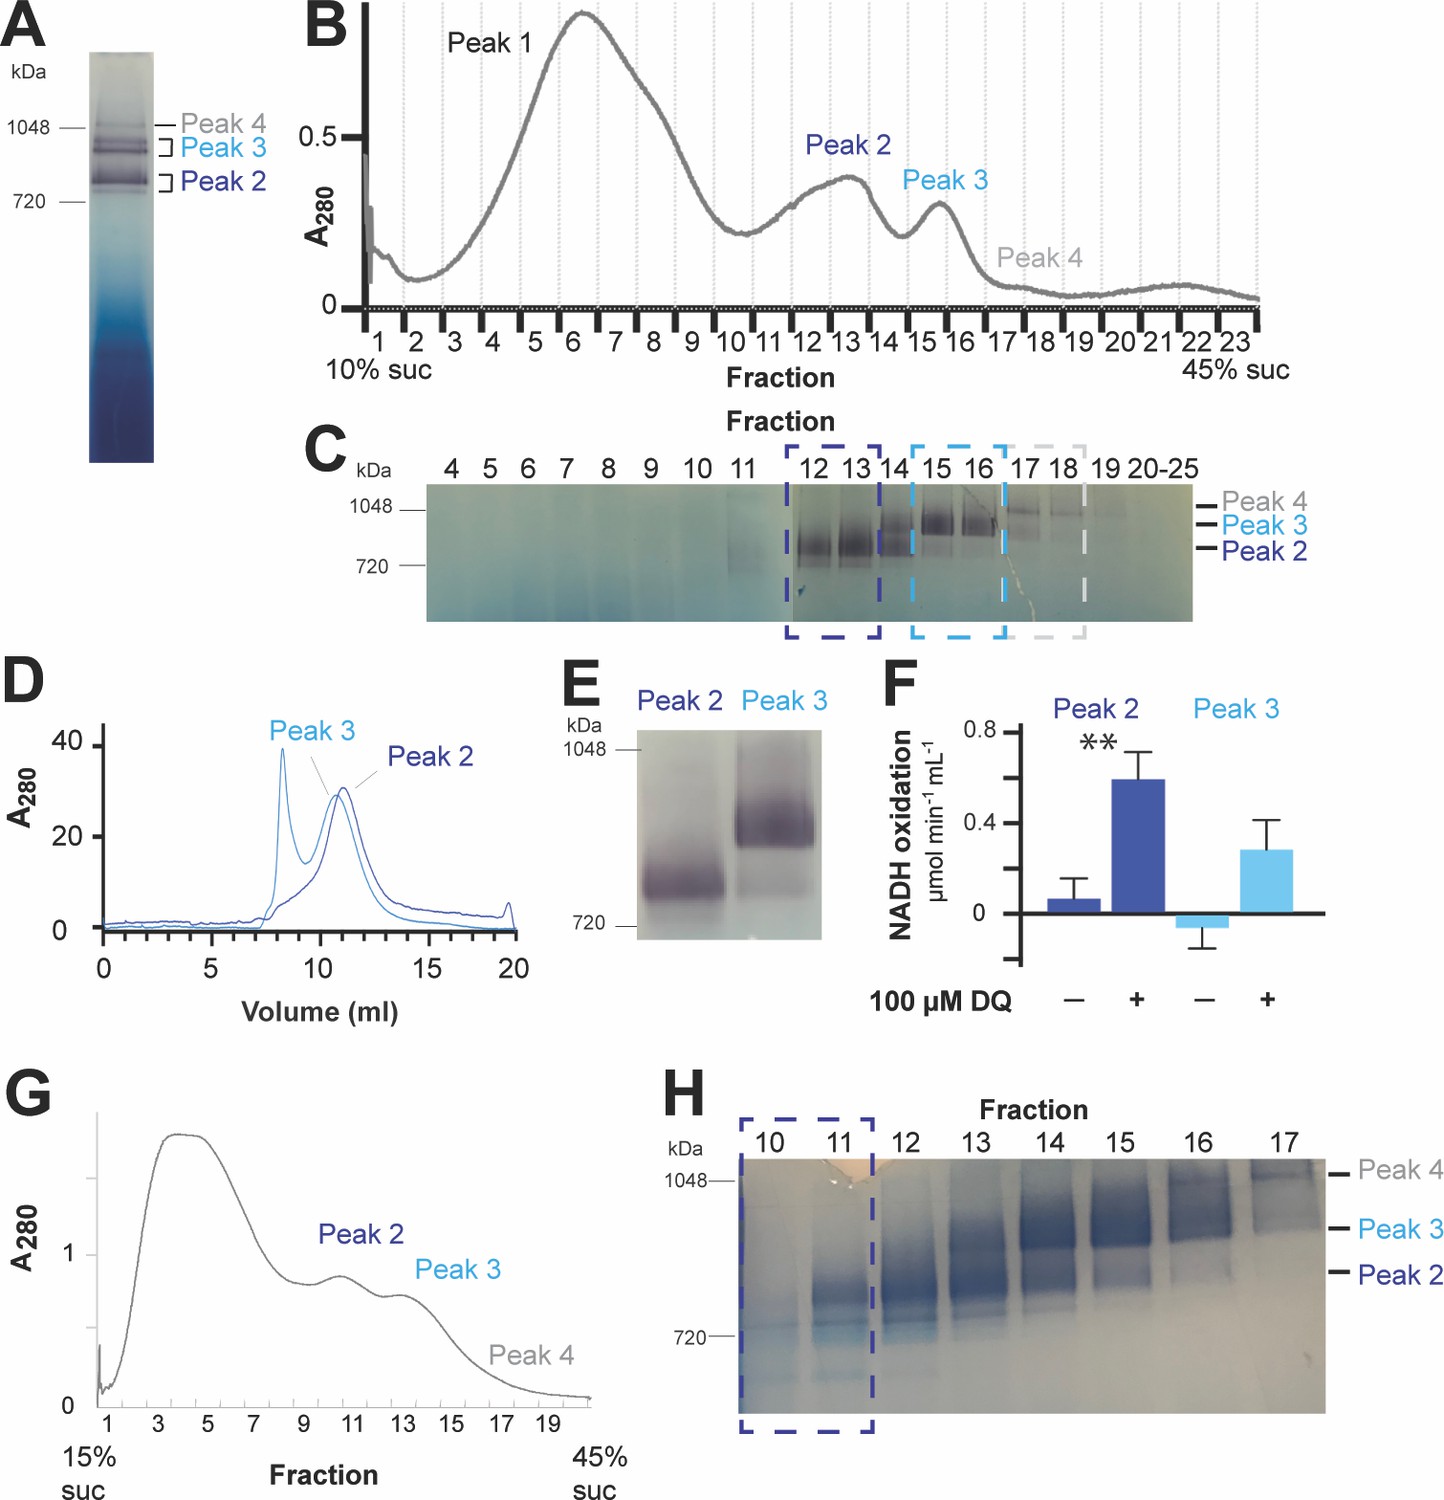
Purification and characterization of CI*.
(A-F) Representative preparation of CI* sample. (A) Digitonin-extracted, amphipol-stabilized mitochondrial membrane complexes were run on a 3–12% blue-native polyacrylamide gel electrophoresis (BN-PAGE) and subjected to in-gel NADH dehydrogenase activity assay to detect CI activity (purple bands). The band labeled Peak 2 corresponds to CI*. (B) The digitonin-extracted, amphipol-stabilized sample was separated by a 10–45% (w:v) linear sucrose (suc) gradient and fractionated. (C) Samples of the sucrose gradient fractions from (B) were run on BN-PAGE gels and subjected to in-gel NADH-dehydrogenase activity assay. Relevant fractions as indicated by the dashed boxes were separately pooled and concentrated. (D) The pooled fractions from (C) were furthered purified using size-exclusion chromatography. The trace for the absorbance at 280 nm is shown. Relevant peak fractions were pooled and concentrated. (E) The activity of the purified fractions from (D) was re-tested with an NADH-dehydrogenase in-gel activity assay. (F) The activity of the purified samples from (D) was further tested with a spectroscopic NADH-decylubiquinone (DQ) activity assay in the presence or absence of 100 µM DQ. Four independent repeat measurements were done for each sample. The background-corrected average of the repeats is shown, together with the standard deviation (error bars). Significance (**, p<0.01) was tested with a two-tailed t-test. p-values: 0.0005 (peak 2) and 0.0063 (peak 3). (G-H) Preparation of CI* for the cryoEM dataset presented in this paper. (G) The digitonin-extracted, amphipol-stabilized mitochondrial membrane complexes were separated by a 15–45% (w:v) linear sucrose gradient and fractionated. (H) Sucrose gradient fractions from (G) were subjected to in-gel NADH-dehydrogenase activity assay. Fractions 10–11 were pooled, concentrated, buffer-exchanged and used as the sample for the cryoEM grid used in the determination of the structure of CI* presented here.
Figure 1—figure supplement 3
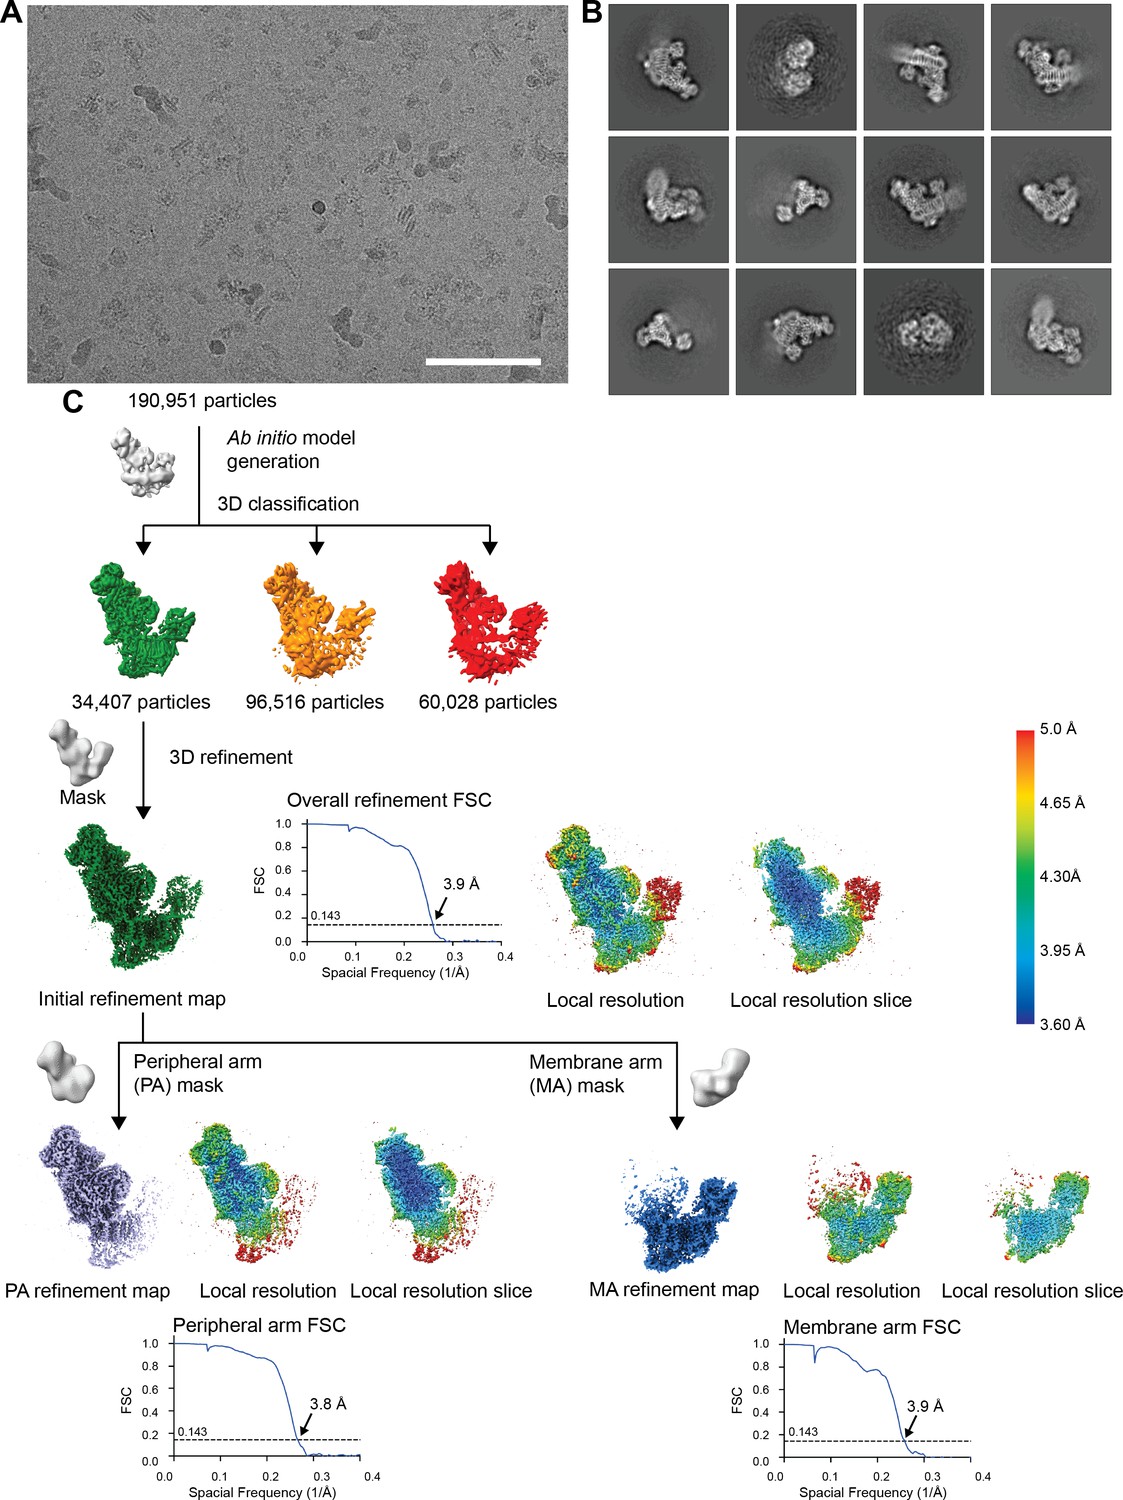
CryoEM processing steps.
(A) A representative micrograph of the 8541 used for further processing (9816 collected). Scale bar, 100 nm. (B) Representative 2D class averages from reference-free classification in Relion. (C) Classification and refinement procedures used. The local refinement map, a local refinement slice and the gold-standard FSC curves are shown next to their respective final reconstructions.
Figure 1—figure supplement 4
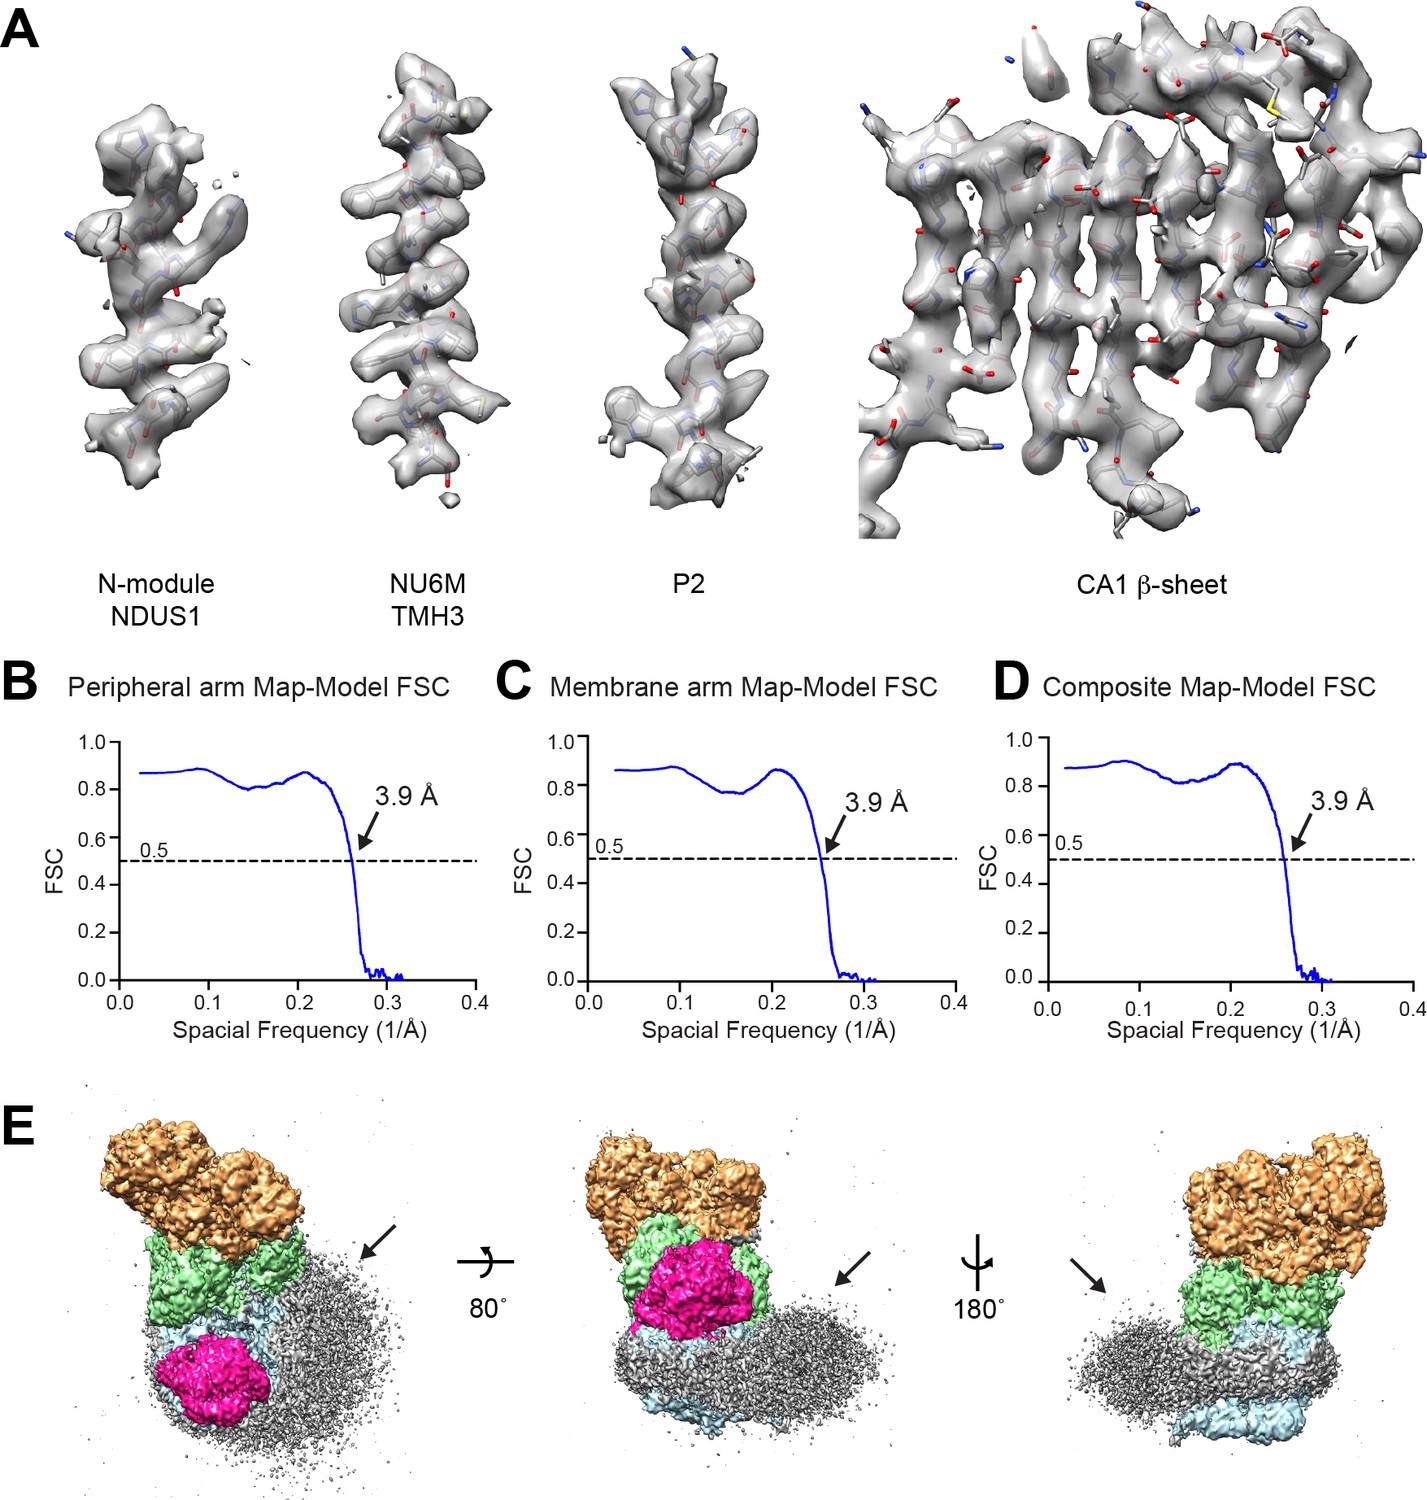
CryoEM model-to-map correlation.
(A) Representative density from the composite map showing the fit between the model and thee map for elements of secondary structure from the peripheral and membrane arms of CI*. (B–D) Map-Model FSC curves are shown for the peripheral arm focused refinement (B), the membrane arm focused refinement (C) and the composite map (D). (E) Low contour of filtered cryoEM density for CI* colored by module (N, tan; Q, green; PP blue; and γCA pink). The lipid membrane density is shown in grey.
Figure 2
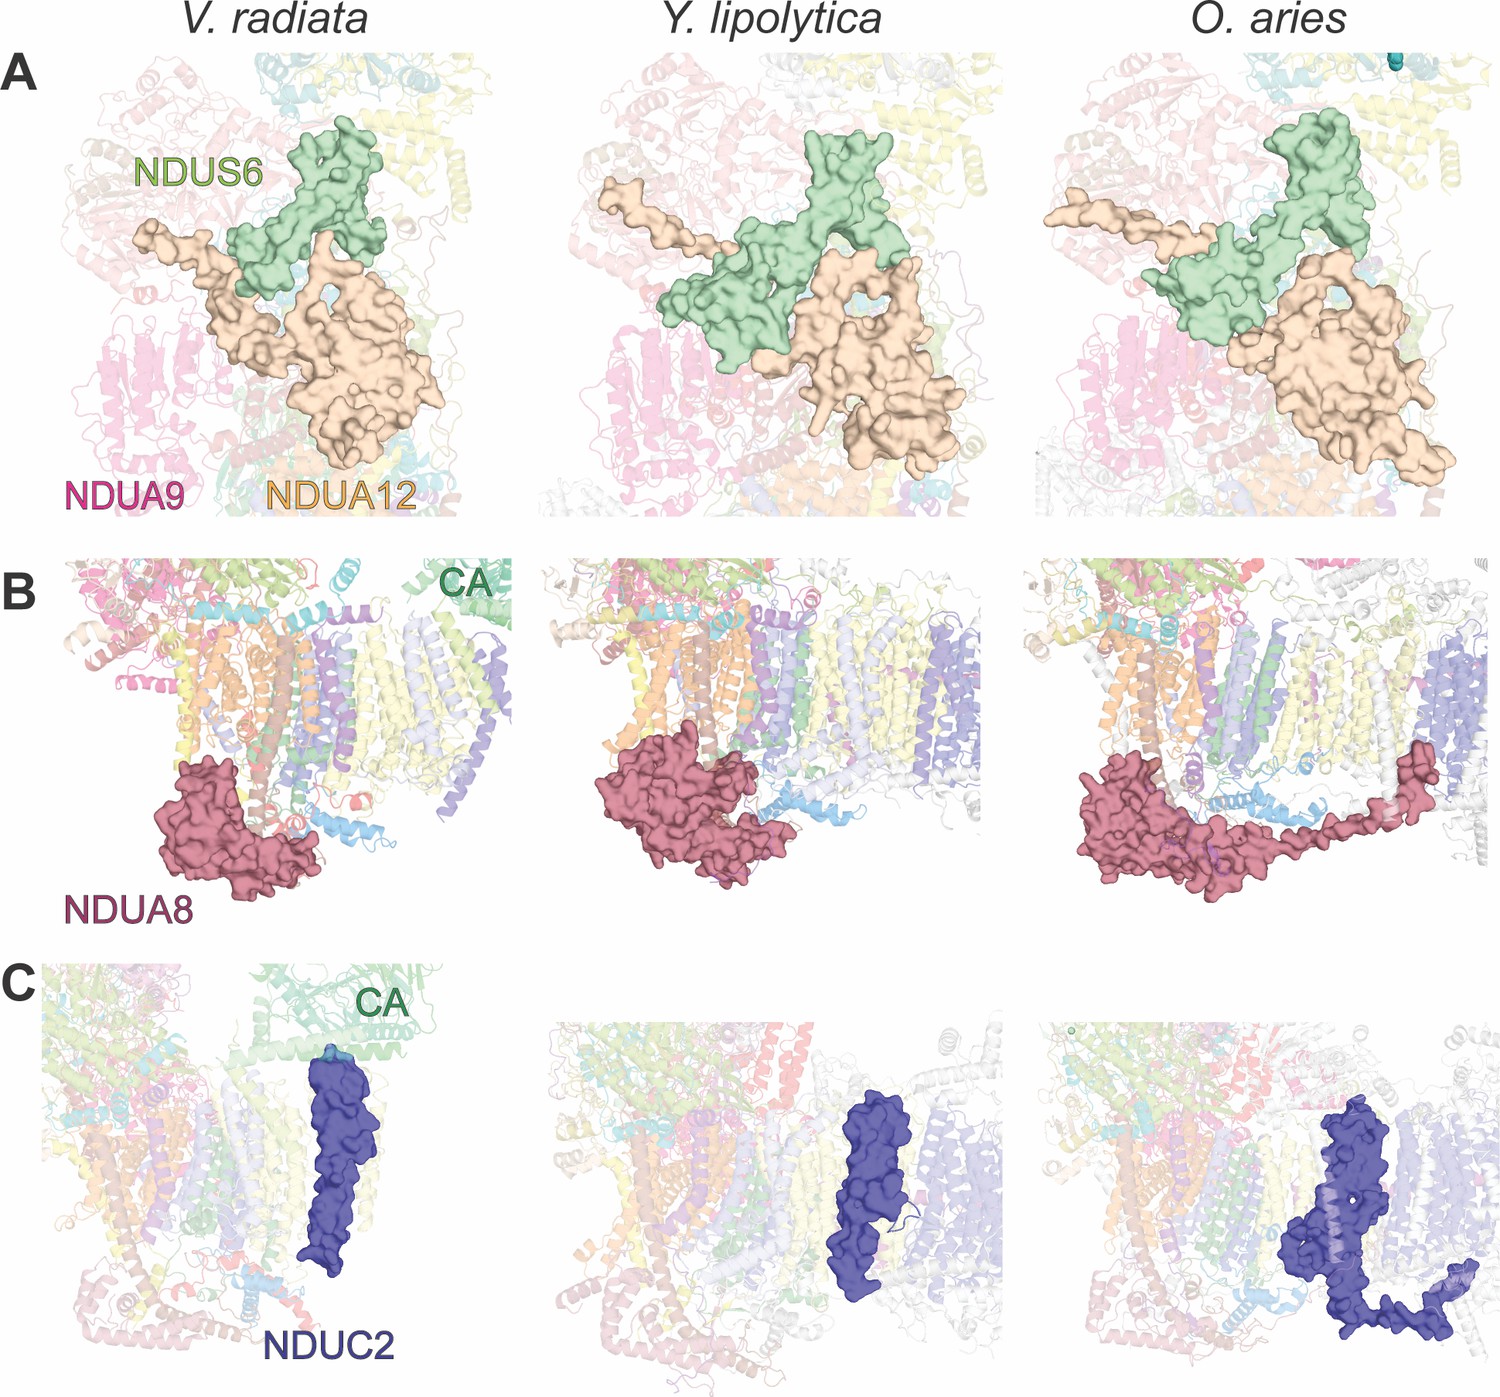
Key differences in CI accessory subunits between V. radiata and opisthokonts.
Accessory subunits NDUS6 and NDUA12, NDUA8 and NDUC2 of V. radiata (this study), Y. lipolytica (PDB:6RFR) and O. aries (PDB: 6QA9) are shown as surface for comparison. (A) NDUS6 (green) and NDUA12 (orange), with an additional label for NDUA9. (B) NDUA8 (maroon), with additional label for the V. radiata’s carbonic anhydrase domain (CA). (C) NDUC2 (blue), with additional label for the V. radiata’s CA.
Figure 3 with 1 supplement
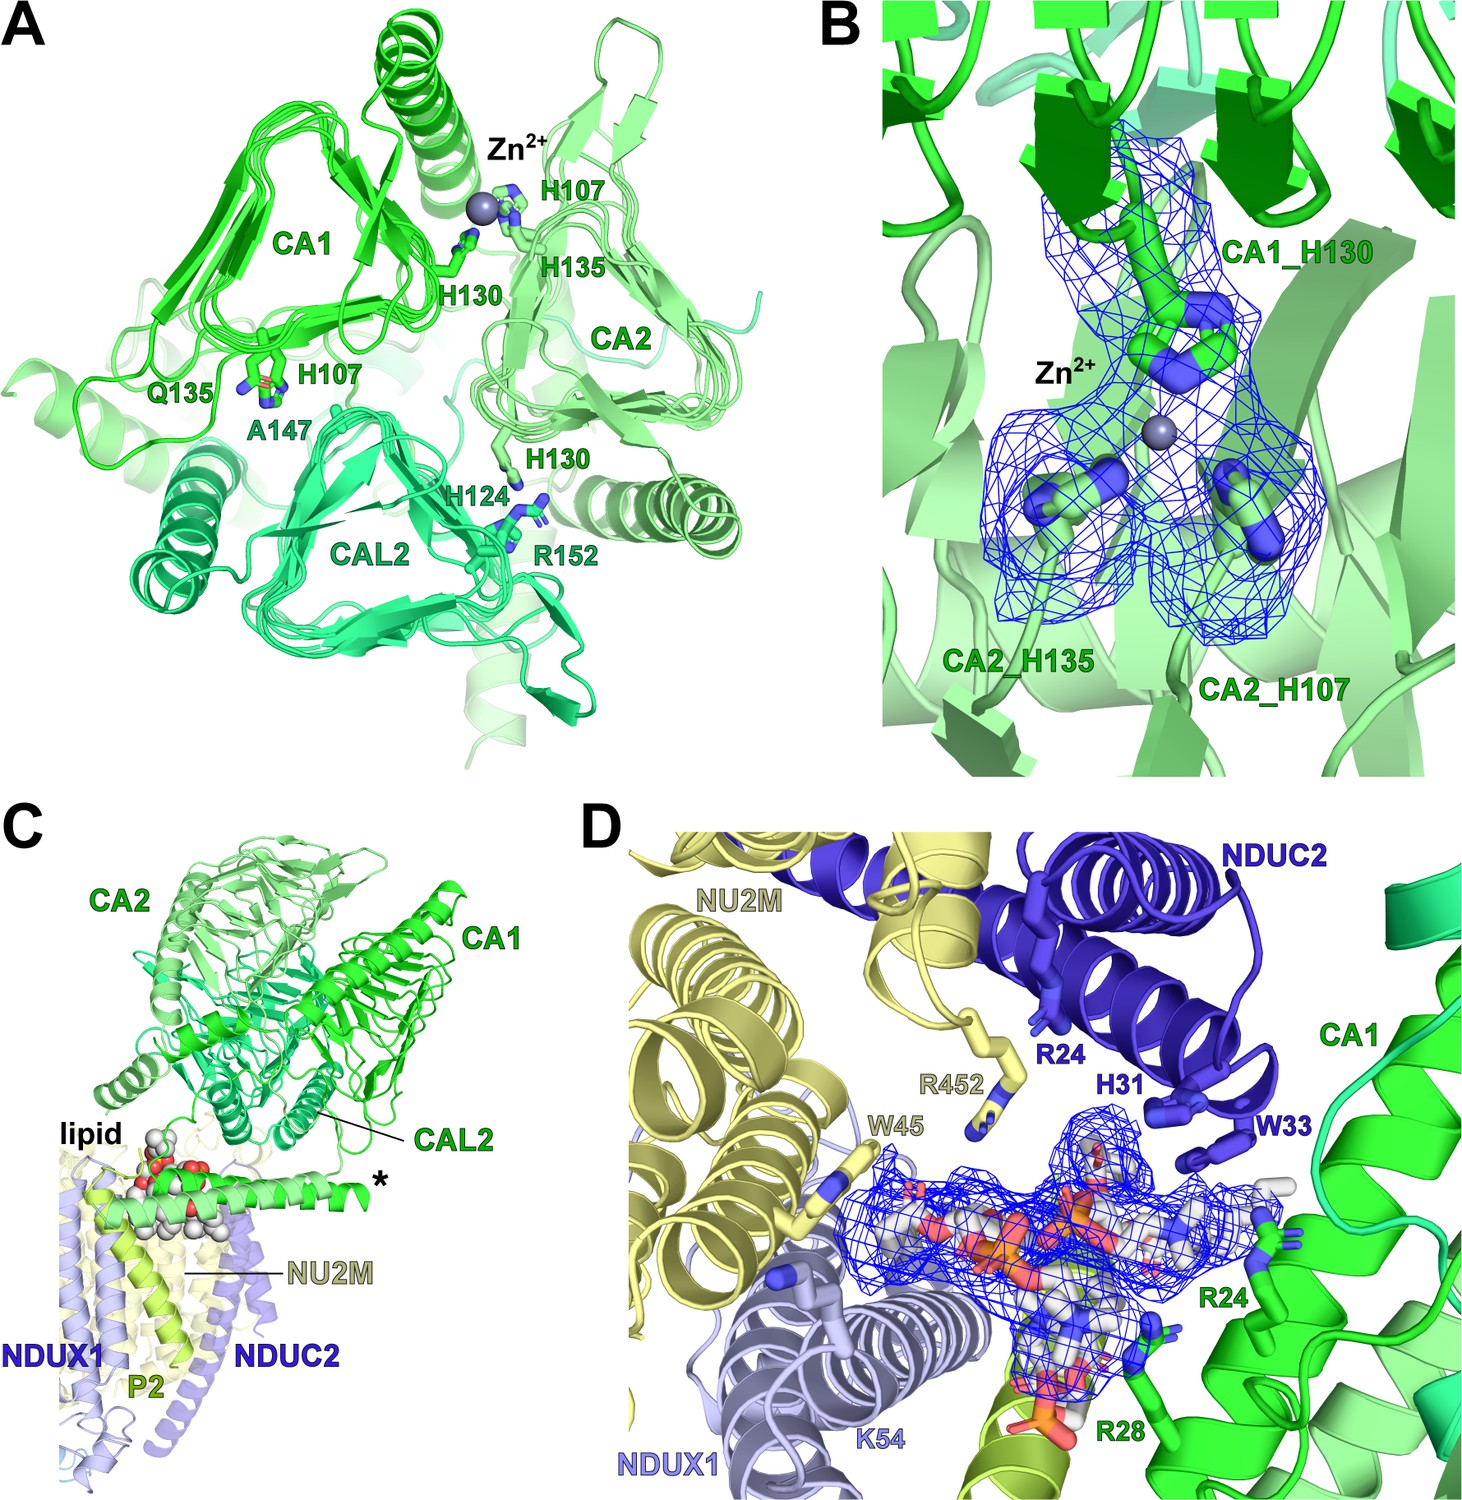
V. radiata γ-carbonic-anhydrase (γCA) domain, Zn2+ coordination and associated lipid cavity.
(A) Top view of the carbonic anhydrase domain with its CA1 (green), CA2 (lime) and CAL2 (lime green). Key residues at subunit interfaces for Zn2+ coordination shown as sticks; Zn2+ shown as grey sphere. Only the CA1-CA2 interface has all three key Zn2+ coordinating histidines in place. (B) Zoom-in of Zn2+ coordination site in (A), with map density for the three histidines and Zn2+ shown as blue meshes. (C) Two phosphatidylcholines (spheres) are placed in the lipid cavity between the γCA and the PP-module. Asterisk indicates the N-terminal amphipathic helices of CA1 and CA2. (D Zoom-in of the lipid cavity in C), with lipid density shown as blue mesh and key interacting residues shown as sticks.
Figure 3—figure supplement 1
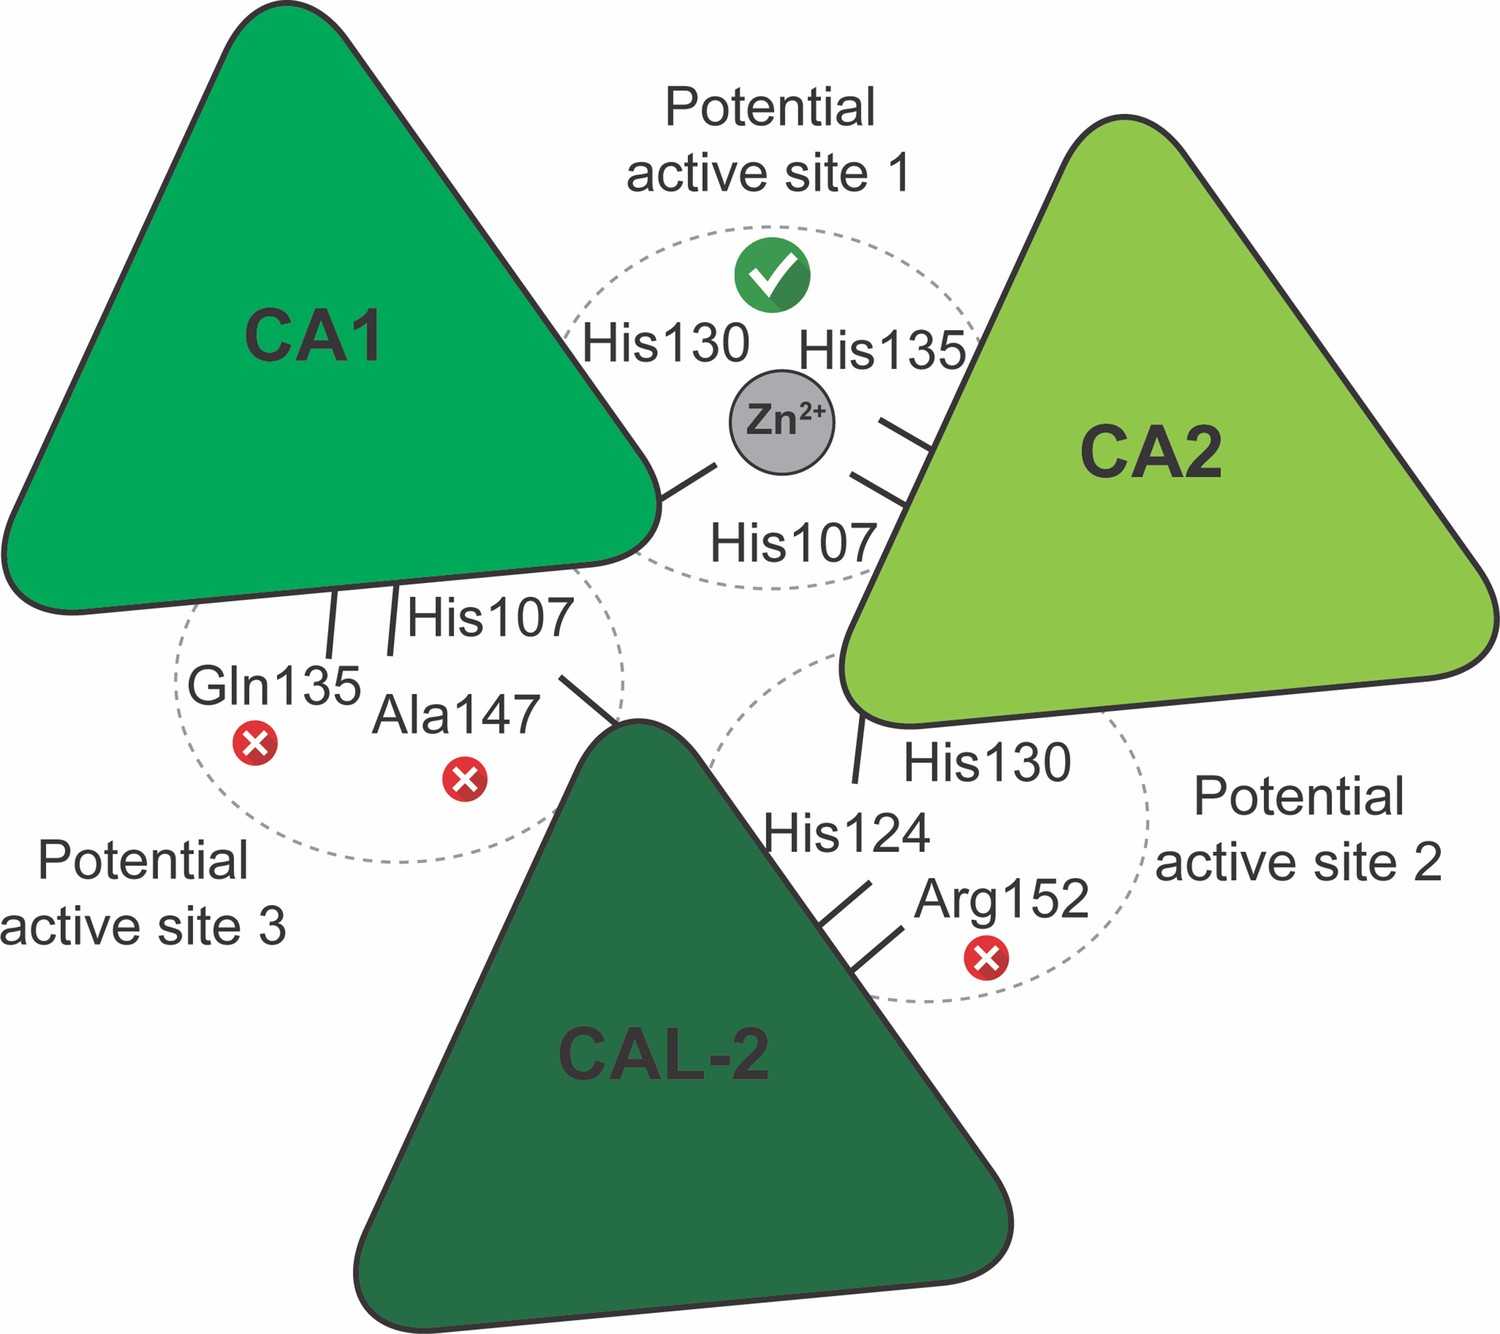
Schematic representation of the γ-carbonic-anhydrase (γCA) domain interfaces and potential active sites in V. radiata.
The Zn2+-adjacent amino acids, as per sequence alignment with CamH γCA homologue subunits, are shown. A red cross indicates amino acids that are incapable of coordinating Zn2+. A green tick indicates the potential active sites that are capable of coordinating Zn2+. CA1, carbonic-anhydrase-1 subunit; CA2, carbonic-anhydrase-2 subunit; CAL-2, carbonic-anhydrase-like-2 subunit.
Figure 4
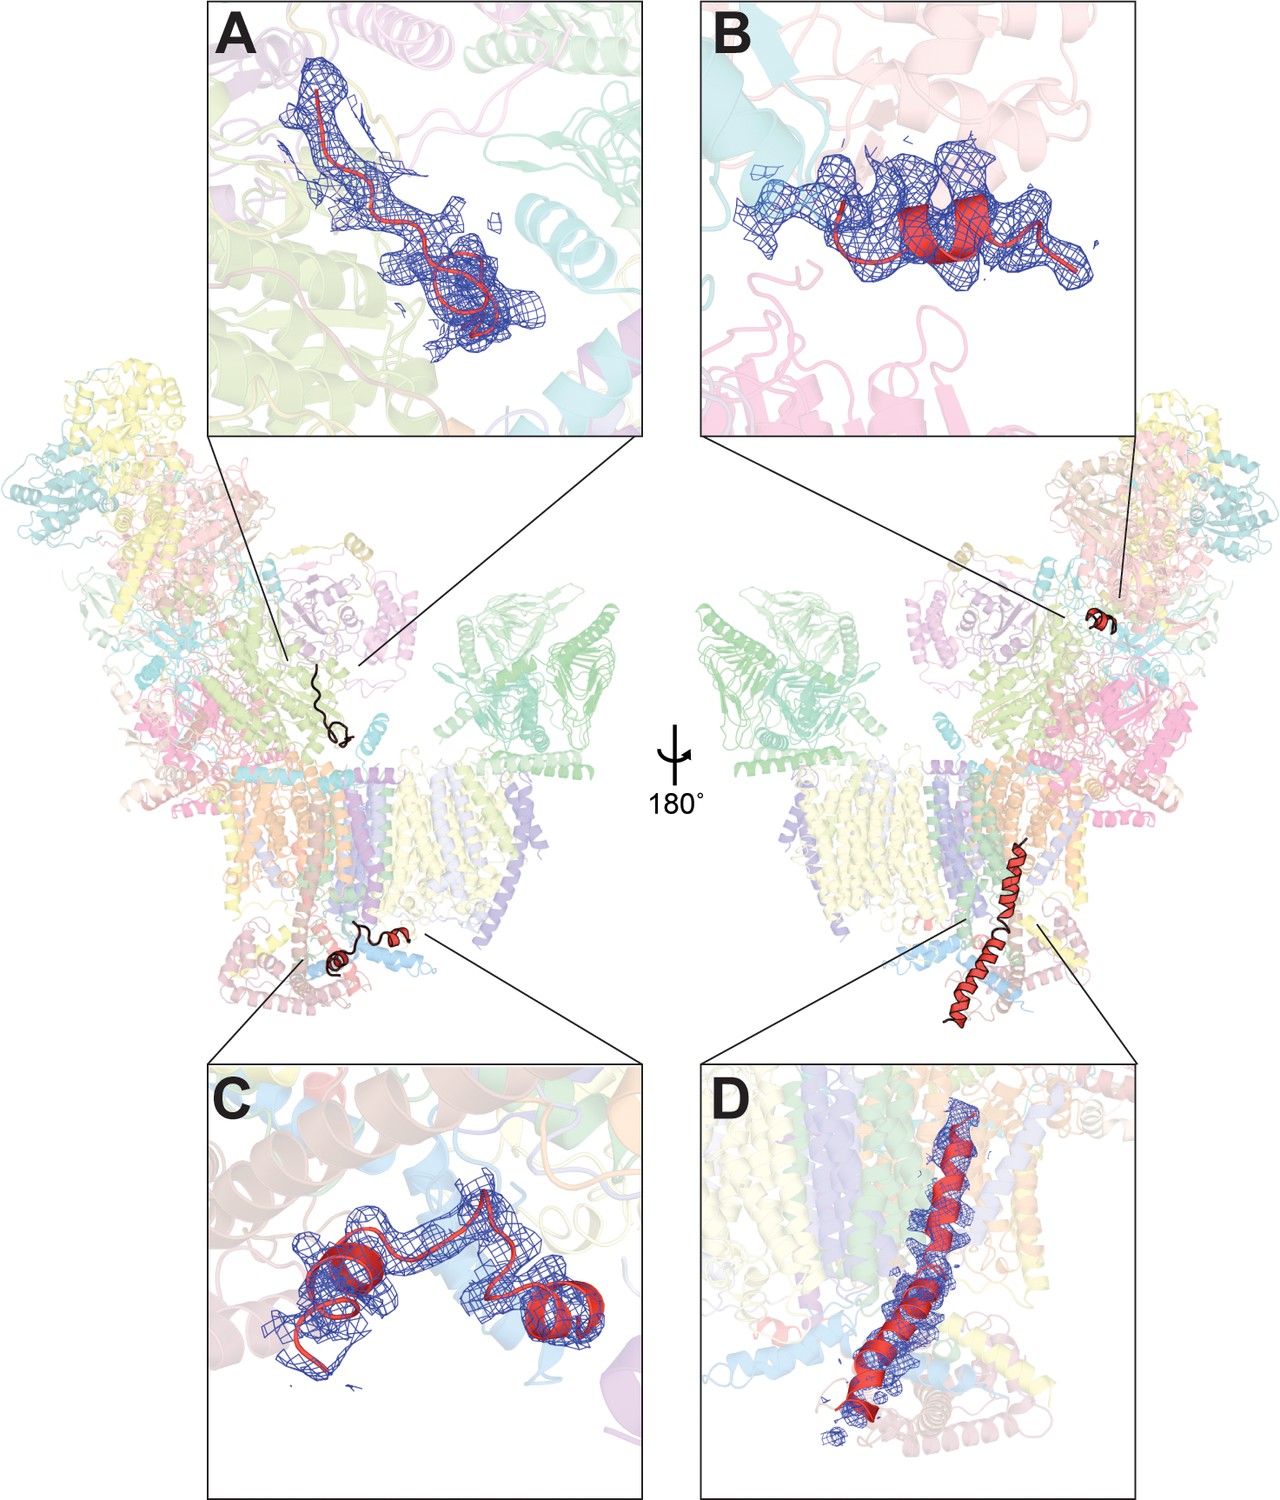
Unassigned density in V. radiata CI* map.
Four stretches of unassigned, continuous densities in the map are shown with their positions on CI* indicated. Insets (A-D) show the density (blue mesh) and the poly-alanine chains (red) (A, C, D) or the putative NDUS6 C-terminal residues (B).
Figure 5
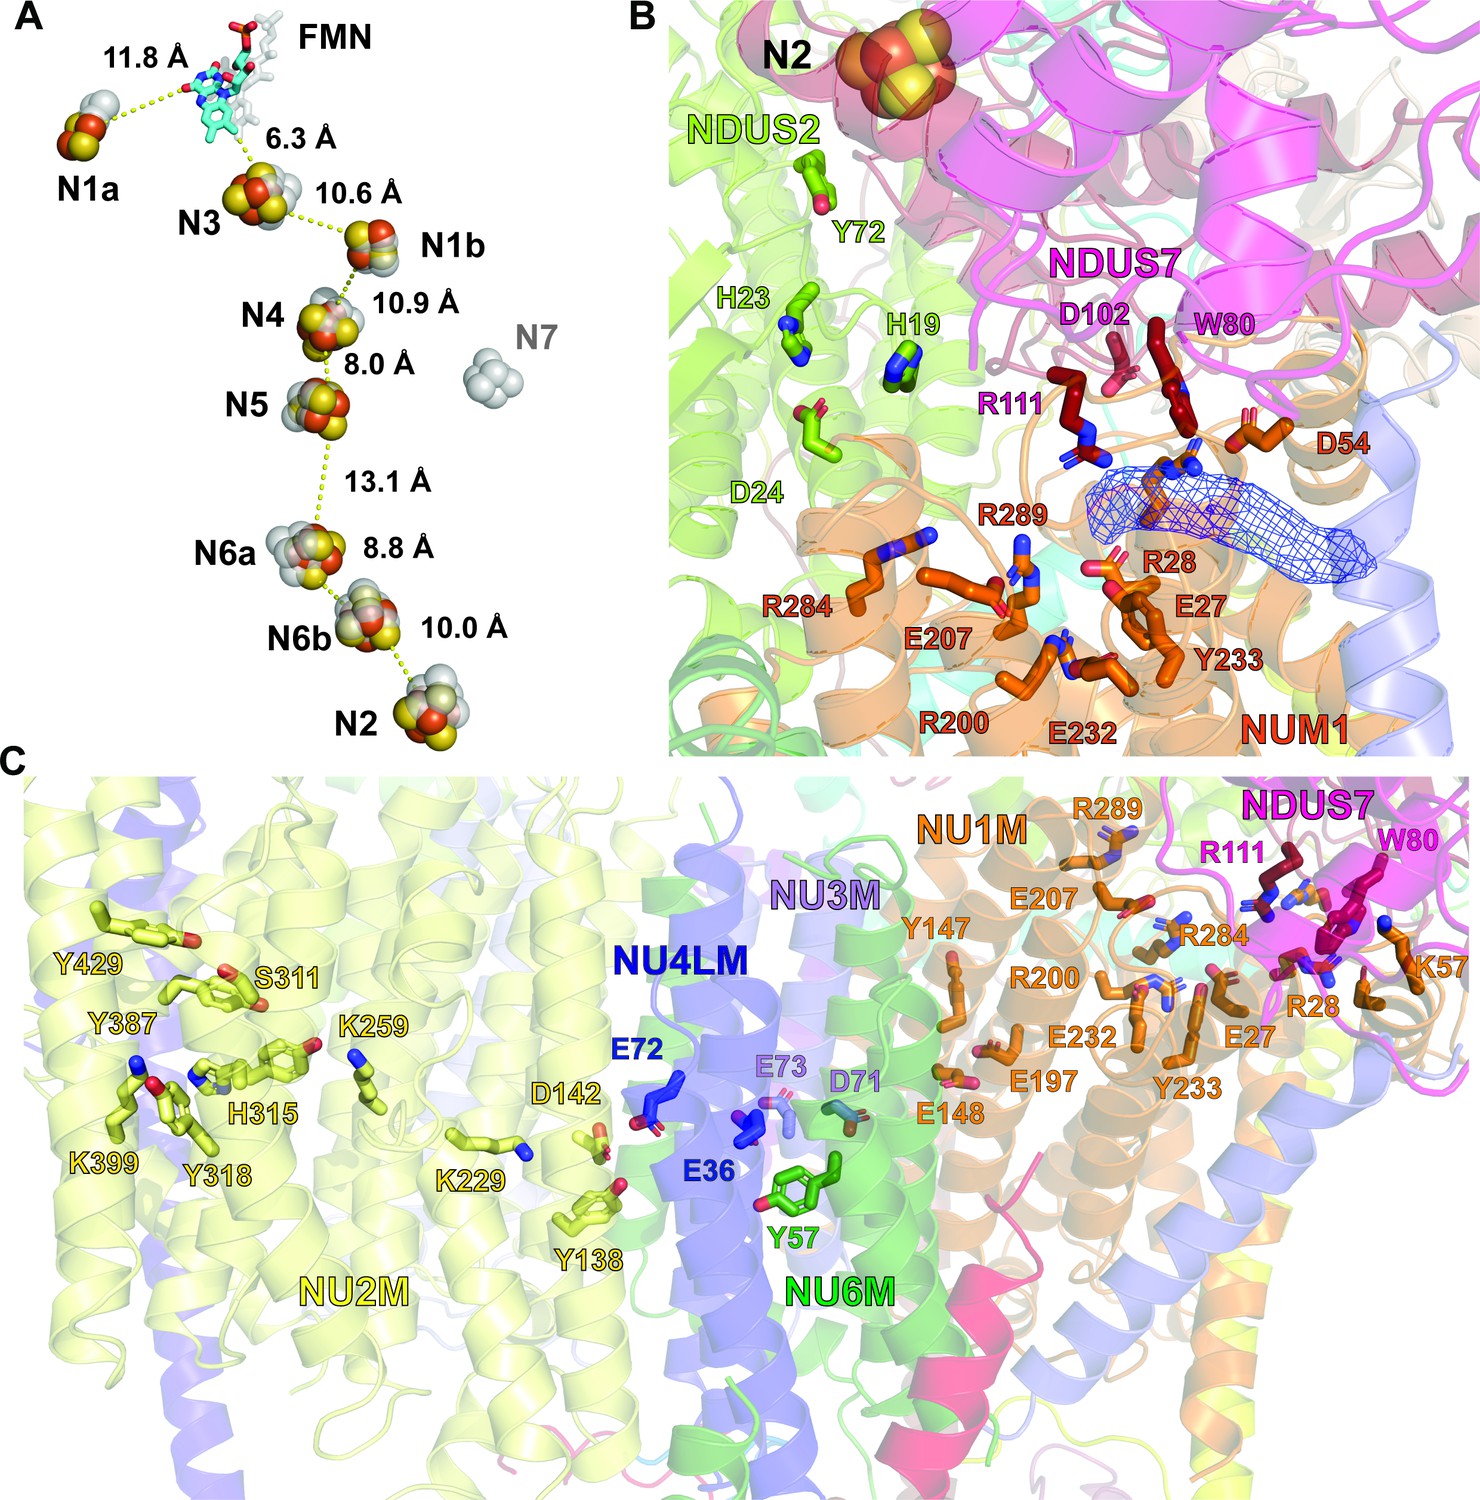
Structure of the redox centers, Q cavity and the hydrophilic axis of V. radiata CI*.
(A) V. radiata’s FMN (stick) and iron-sulfur clusters (spheres) are labeled by nearest-atom center-to-center distances, overlaid with those from T. thermophilus (transparent grey). (B) Key residues (stick) delineating the Q cavity and the nearby N2 iron-sulfur cluster (spheres). Unassigned density in the Q cavity, potentially corresponding to quinone, shown as blue mesh. (C) Key CI* residues constituting the hydrophilic axis within the membrane domain shown as sticks.
Appendix 1—figure 1
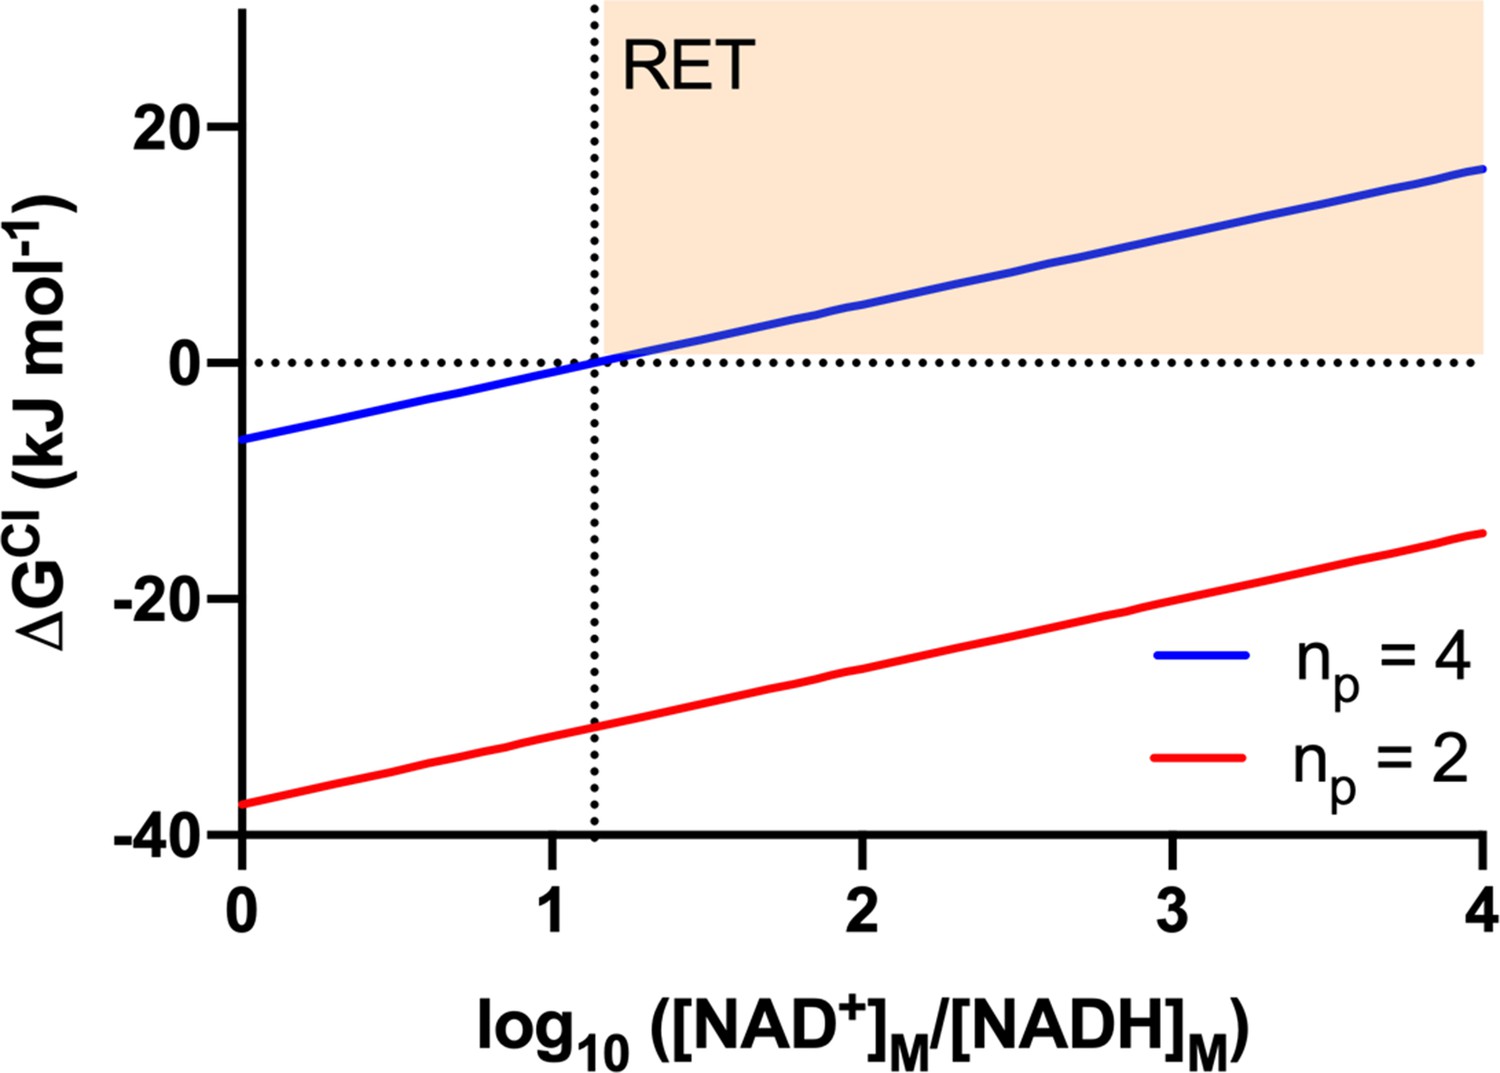
The Gibbs energy change of the CI reaction (ΔGCI) as a function of the redox poise of the mitochondrial NADH pool.
The Gibbs energy change was calculated using equation 10 and the values presented in Table A1, for reactions in which CI pumps 4 H+ (blue; representative of the standard, full-length CI pumping with a 4H+:2e- ratio) or 2 H+ (red; representative of a putative CI* pumping with a 2H+/2e- ratio). The horizontal dashed line indicates equilibrium state (ΔGCI = 0) for the different [NAD+]/[NADH] ratios. The vertical dashed line indicates the [NAD+]/[NADH] ratio at which full-length CI (blue) attains equilibrium ( = 1). The highlighted orange region corresponds to conditions in which thermodynamics would favor reverse electron transport (RET) by full-length CI ( > 1).
Videos
Video 1
CryoEM density for the CI* composite map.
Tables
Table 1
Cryo-EM data collection, refinement and validation statistics.
| Data Collection and processing | |||
|---|---|---|---|
| Microscope | Titan krios, (UCSF) | ||
| Camera | K3 | ||
| Magnification | 60,010 | ||
| Voltage (kV) | 300 kV | ||
| Electron exposure (e-/Å2) | 86.4 | ||
| Defocus range (µm) | −0.5 to −2.0 | ||
| Pixel size (Å) | 0.8332 | ||
| Software | SerialEM | ||
| Reconstruction | CI* Peripheral Arm | CI* Membrane Arm | CI* Composite Map |
| Number of particles | 34,407 | 34,407 | The CI* Peripheral Arm and Membrane Arm Maps were combined in Phenix to generate this composite map |
| Accuracy of rotations (°) | 0.68 | 1.489 | |
| Accuracy of translations (pixels) | 0.655 | 0.881 | |
| Box size (pixels) | 512 | 512 | |
| Final resolution (Å) | 3.8 | 3.9 | |
| Map sharpening B factor (Å2) | −90 | −96 | |
| EMDB ID | 22093 | 22092 | 22090 |
| Refinement | |||
| Software | Phenix | ||
| Initial model (PDB code) | 6Q9D | 6Q9B and 1QRG | 6Q9D, 6Q9B and 1QRG |
| Map/model correlation | |||
| Model resolution (Å) | 3.9 | 4.0 | 3.9 |
| d99 (Å) | 3.9 | 4.0 | 4.0 |
| FSC model 0.5 (Å) | 3.9 | 3.9 | 3.9 |
| Map CC (around atoms) | 0.82 | 0.86 | 0.87 |
| Model composition | |||
| Non-hydrogen atoms | 26,001 | 19,052 | 45047 |
| Protein residues | 3284 | 2453 | 5736 |
| Number of chains | 17 | 18 | 34 |
| Number of ligands and cofactors | 11 | 1 | 12 |
| Number of lipids | 0 | 6 | 6 |
| Atomic Displacement Parameters (ADP) | |||
| Protein average (Å2) | 68.78 | 58.40 | 64.39 |
| Ligand average (Å2) | 48.59 | 48.59 | 48.59 |
| R.m.s. deviations | |||
| Bond lengths (Å) | 0.007 | 0.007 | 0.007 |
| Bond angles (°) | 1.187 | 1.122 | 0.845 |
| Ramachandran Plot | |||
| Favored (%) | 82.90 | 88.03 | 84.98 |
| Allowed (%) | 16.76 | 11.88 | 14.79 |
| Disallowed (%) | 0.34 | 0.08 | 0.23 |
| Validation | |||
| MolProbity score | 2.41 | 2.31 | 2.38 |
| Clash score | 16.79 | 16.21 | 16.42 |
| Rotamer outliers (%) | 0.25 | 0.20 | 0.23 |
| EMRinger score | 1.47 | 2.09 | 2.17 |
| PDB ID | --- | --- | 6X89 |
Table 2
Model building statistics by subunit.
| Subunit name | Uniprot ID | Chain ID | Total residues | Atomic residues | Poly-Ala | Un-modeled residues | % atomic | TMH | Identified RNA editing sites* | Ligands, lipids |
|---|---|---|---|---|---|---|---|---|---|---|
| Peripheral arm core subunits | ||||||||||
| NDUS1 | A0A1S3TQ85 | S1 | 746 | 57–744 | 57 | 1–56, 745–746 | 92.1% | 4Fe4S×2, 2Fe2S | ||
| NDUS2 | E9KZN6 | S2 | 394 | 9–17,21-394 | 1–8, 18–20 | 98.0% | S26L, 246L, S67F, H82Y, S84L, R106C, S112L, S193L, S233L, H242Y, S245L, P247F, R257C, R353C, S360F, S363L, S368F, P375L | |||
| NDUS3 | E9KZM7 | S3 | 190 | 1–184 | 185–190 | 96.8% | S31F, S56L, P100S, R110W, S133L, L147F | |||
| NDS7 | A0A1S3U8J5 | S7 | 213 | 56–213 | 1–55 | 74.2% | 4Fe4S, PC | |||
| NDS8 | A0A1S3VGS8 | S8 | 222 | 42–222 | 1–41 | 81.5% | 4Fe4S×2 | |||
| NDUV1 | A0A1S3V7V2 | V1 | 491 | 59–491 | 1–58 | 88.2% | 4Fe4S, FMN | |||
| NDUV2 | A0A1S3U769 | V2 | 251 | 28–243 | 1–27, 244–251 | 86.1% | 2Fe2S | |||
| Peripheral arm accessory subunits | ||||||||||
| NDUA2 | A0A1S3TVC7 | A2 | 98 | 2–93 | 1, 94–98 | 93.9% | ||||
| NDUA5 | A0A1S3U023 | A5 | 169 | 12–137 | 1–11, 138–169 | 74.6% | ||||
| NDUA6 | A0A1S3W1K8 | A6 | 132 | 118–131 | 1–117, 132 | 11.4% | ||||
| NDUA7 | A0A1S3UVC7 | A7 | 127 | 19–127 | 1–18 | 85.8% | ||||
| NDUA9 | A0A1S3V8W7 | A9 | 396 | 47–381 | 1–46, 382–396 | 84.6% | NADPH | |||
| NDUA12 | A0A1S3VNK7 | AL | 156 | 21–155 | 1–20, 156 | 86.5% | ||||
| NDUS4 | A0A1S3UIW7 | S4 | 146 | 42–142 | 142 | 1–41, 143–146 | 69.2% | |||
| NDUS6 | A0A1S3VYF3 | S6 | 103 | 31–102 | 1–30, 103 | 69.9% | Zn2+ | |||
| Membrane arm core subunits | ||||||||||
| NU1M | A0A1S4ETV6/E9KZL0 | 1M | 325 | 2–213, 220–325 | 1, 214–219 | 97.8% | 8 | R89W, P164S, R165C, S167L, S179F, R225C, P242L, P248L, P252L, R300W, R310W | ||
| NU2M | E9KZK9 | 2M | 488 | 1–487 | 488 | 99.8% | 14 | S19F, S103F, S104F, P119L, P121S, R123C, H132Y, P143L, S166LL, S221F, P307L, H310Y, R320C, S376L, S467L, S468F, S486L | PC×2 | |
| NU3M | Q9XPB4 | 3M | 118 | 1–28, 56–118 | 29–55 | 77.1% | 3 | P70F, P83S, P84L, S115L, R117W | ||
| NU4LM | A0A1S4ETY3/E9KZN8 | 4L | 100 | 1–86 | 87–100 | 86.0% | 3 | S14F, P29L, S32L, P34S, S37L, S53L, S63L, S66L | ||
| NU6M | E9KZM5 | 6M | 205 | 1–72, 111–172 | 73–110 | 173–205 | 65.4% | 5 | P9L, A18V, P30F, P32L, R35C, P54L, H57Y | |
| Membrane arm accessory subunits | ||||||||||
| CA1 | A0A1S3VT00 | G1 | 270 | 3–222 | 223–233 | 1–2, 234–270 | 81.5% | |||
| CA2 | A0A1S3U544 | G2 | 273 | 2–237 | 1, 238–273 | 86.4% | ||||
| CAL2 | A0A1S3UI49 | L2 | 256 | 49–129, 134–254 | 1–48, 130–133, 255–256 | 80.5% | ||||
| NDUX1 | A0A1S3VI15 | X1 | 101 | 1–100 | 101 | 99.0% | 2 | |||
| NDUC2 | A0A1S3UPL8 | C2 | 81 | 5–68 | 1–4, 69–81 | 79.0% | 2 | |||
| NDUA8 | A0A1S3VVN6 | A8 | 106 | 2–106 | 1 | 99.1% | ||||
| NDUA13 | A0A1S3UYW0 | AM | 143 | 2–143 | 1 | 99.3% | 1 | |||
| NDUA1 | A0A1S3TU57 | A1 | 65 | 2–63 | 1, 64–65 | 95.4% | 1 | PC | ||
| NDS5 | A0A1S3TQ33 | S5 | 399 | 2–70 | 1, 71–399 | 17.3% | ||||
| NDUA3 | A0A1S3TCK0 | A3 | 63 | 2–45 | 1, 46–63 | 69.8% | 1 | |||
| P2 | A0A1S3TGE7 | P2 | 115 | 83–106 | 77–82 | 1–76, 107–115 | 20.9% | |||
| Unassigned density | ||||||||||
| A | 1–18 | |||||||||
| B | 1–24 | |||||||||
| C | 1–43 | 1 | ||||||||
-
*RNA editing of mitochondrially encoded subunits: amino acids were changed at the listed positions as detailed. The changes were based on the reported equivalent A. thaliana RNA edits (Giegé and Brennicke, 1999; Bentolila et al., 2008) and were only made when density was unambiguously correct for the edited V. radiata amino acid in the cryoEM map.
Table 3
Complex I subunit homologues in plants, mammals, yeast and bacteria.
V. radiata homologues were obtained by performing BLASTp searches of the Arabidopsis thaliana genes (Meyer et al., 2019; Braun et al., 2014). Mammalian, yeast and bacterial homologues were obtained from Letts and Sazanov, 2015. Additional BLASTp searches were performed wherever necessary. Given the high sequence similarity between the carbonic anhydrase (CA) paralogues, the names of the V. radiata CA proteins appear to have been mis-assigned in the genetic databases relative to their A. thaliana homologues. The CA1, CA2, CA2-like nomenclature used in the table is the one that, based on our sequence alignments, best represents homology to the A. thaliana CA proteins. N, NADH-binding module; Q, quinone-binding module; PP, proximal-pumps module; PD, distal-pumps module; CA, carbonic anhydrase domain.
| Module | Vigna radiata protein name | Vigna radiata gene | Vigna radiata uniprot identifier | Arabidopsis thaliana protein name | Arabidopsis thaliana gene | Homo sapiens name | Ovis aries name | Mus musculus name | Yarrowia lipolytica name | Thermus thermophilus name |
|---|---|---|---|---|---|---|---|---|---|---|
| CORE peripheral arm | ||||||||||
| N | NDUS1 | LOC106757688 | A0A1S3TQ85 | 75 kDa | At5g37510 | NDUFS1 | NDUFS1 | NDUFS1 | NUAM | Nqo3 |
| N | NDUV1 | LOC106772405 | A0A1S3V7V2 | 51 kDa | At5g08530 | NDUFV1 | NDUFV1 | NDUFV1 | NUBM | Nqo1 |
| N | NDUV2 | LOC106762461 | A0A1S3U769 | 24 kDa | At4g02580 | NDUFV2 | NDUFV2 | NDUFV2 | NUHM | Nqo2 |
| Q | NDUS2 | nad7 | E9KZN6 | Nad7 | AtMg00510 | NDUFS2 | NDUFS2 | NDUFS2 | NUCM | Nqo4 |
| Q | NDUS3 | nad9 | E9KZM7 | Nad9 | AtMg00070 | NDUFS3 | NDUFS3 | NDUFS3 | NUGM | Nqo5 |
| Q | NDS7 | LOC106762764 | A0A1S3U8J5 | PSST | At5g11770 | NDUFS7 | NDUFS7 | NDUFS7 | NUKM | Nqo6 |
| Q | NDS8 | LOC106775047 | A0A1S3VGS8 | TYKY | At1g79010, At1g16700 | NDUFS8 | NDUFS8 | NDUFS8 | NUIM | Nqo9 |
| CORE membrane arm | ||||||||||
| PP | NU1M | nad1 | A0A1S4ETV6 | Nad1 | AtMg00516, AtMg01120, AtMg01275 | MT-ND1 | MT-ND1 | MT-ND1 | NU1M | Nqo8 |
| PP | NU2M | nad2 | E9KZK9 | Nad2 | AtMg00285, AtMg01320 | MT-ND2 | MT-ND2 | MT-ND2 | NU2M | Nqo14 |
| PP | NU3M | nad3 | Q9XPB4 | Nad3 | AtMg00990 | MT-ND3 | MT-ND3 | MT-ND3 | NU3M | Nqo7 |
| PP | NU4LM | nad4L | A0A1S4ETY3 | Nad4L | AtMg00650 | MT-ND4L | MT-ND4L | MT-ND4L | NULM | Nqo11 |
| PP | NU6M | nad6 | E9KZM5 | Nad6 | AtMg00270 | MT-ND6 | MT-ND6 | MT-ND6 | NU6M | Nqo10 |
| PD | NU4M* | nad4 | E9KZL8 | Nad4 | AtMg00580 | MT-ND4 | MT-ND4 | MT-ND4 | NU4M | Nqo13 |
| PD | NU5M* | nad5 | E9KZL1 | Nad5 | AtMg00060, AtMg00513, AtMg00665 | MT-ND5 | MT-ND5 | MT-ND5 | NU5M | Nqo12 |
| ACCESSORY membrane arm | ||||||||||
| PP | NDUA1 | LOC106758834 | A0A1S3TU57 | MWFE | At3g08610 | NDUFA1 | NDUFA1 | NDUFA1 | NIMM | - |
| PP | NDUA3 | LOC106754061 | A0A1S3TCK0 | B9 | At2g46540 | NDUFA3 | NDUFA3 | NDUFA3 | NI9M | - |
| PP | NDUA8-B | LOC106778955 | A0A1S3VVN6 | PGIV | At3g06310, At5g18800 | NDUFA8 | NDUFA8 | NDUFA8 | NUPM | - |
| PP | NDUA13-A | LOC106769964 | A0A1S3UYW0 | B16.6 | At2g33220, At1g04630 | NDUFA13 | NDUFA13 | NDUFA13 | NB6M | - |
| PP | NDUC1 | LOC106771273 | A0A1S3V2Z3 | - | - | NDUFC1 | NDUFC1 | NDUFC1 | - | - |
| PP | NDUS5 | LOC106757655 | A0A1S3TQ33 | 15 kDa | At3g62790, At2g47690 | NDUFS5 | NDUFS5 | NDUFS5 | NIPM | - |
| PP | NDUB8 | LOC106765859 | A0A1S3UJ95 | ASHI | At5g47570 | NDUFB8 | NDUFB8 | NDUFB8 | NIAM | - |
| PP | NDUB10-B | LOC106774903 | A0A1S3VGT1 | PDSW | At1g49140, At3g18410 | NDUFB10 | NDUFB10 | NDUFB10 | NIDM | - |
| PP | NDUA11* | LOC106756741 | A0A1S3TLY8 | B14.7 | At2g42210 | NDUFA11 | NDUFA11 | NDUFA11 | NUJM | - |
| Module | Vigna radiata protein name | Vigna radiata gene | Vigna radiata Uniprot identifier | Arabidopsis thaliana protein name | Arabidopsis thaliana gene | Homo sapiens name | Ovis aries name | Mus musculus name | Yarrowia lipolytica name | Thermus thermophilus name |
| ACCESSORY membrane arm | ||||||||||
| PD | NDUB1* | LOC106775330 | A0A1S3VI15 | MNLL | At4g16450 | NDUFB1 | NDUFB1 | NDUFB1 | - | - |
| PD | NDUC2* | LOC106767534 | A0A1S3UPL8 | B14.5b | At4g20150 | NDUFC2 | NDUFC2 | NDUFC2 | NEBM | - |
| PD | NDUB2* | LOC106754955 | A0A1S3TFG6 | AGGG | At1g76200 | NDUFB2 | NDUFB2 | NDUFB2 | - | - |
| PD | NDUB3* | LOC106769121 | A0A1S3UVV0 | B12 | At2g02510, At1g14450 | NDUFB3 | NDUFB3 | NDUFB3 | NB2M | - |
| PD | NDUB4* | LOC106766640 | A0A1S3ULL3 | B15 | At2g31490 | NDUFB4 | NDUFB4 | NDUFB4 | NB5M | - |
| PD | NDUB5* | LOC106767179 | A0A1S3UND4 | - | - | NDUFB5 | NDUFB5 | NDUFB5 | NUNM | - |
| PD | NDUB7* | LOC106770979 | A0A1S3V2B8 | B18 | At2g02050 | NDUFB7 | NDUFB7 | NDUFB7 | NB8M | - |
| PD | NDUB9* | LOC106760947 | A0A1S3U1J6 | B22 | At4g34700 | NDUFB9 | NDUFB9 | NDUFB9 | NI2M | - |
| PD | NDUB11* | LOC106771273 | A0A1S3V2Z3 | ESSS | At2g42310, At3g57785 | NDUFB11 | NDUFB11 | NDUFB11 | NESM | - |
| ACCESSORY peripheral arm | ||||||||||
| N | NDUA2 | LOC106759195 | A0A1S3TVC7 | B8 | At5g47890 | NDUFA2 | NDUFA2 | NDUFA2 | NI8M | - |
| N | NDUA12 | LOC106776991 | A0A1S3VNK7 | B17.2 | At3g03100 | NDUFA12 | NDUFA12 | NDUFA12 | N7BM | - |
| N | NDUS4 | LOC106765762 | A0A1S3UIW7 | 18 kDa | At5g67590 | NDUFS4 | NDUFS4 | NDUFS4 | NUYM | - |
| N | NDUS6 | LOC106779709 | A0A1S3VYF3 | 13 kDa | At3g03070 | NDUFS6 | NDUFS6 | NDUFS6 | NUMM | - |
| Q | NDUA5 | LOC106760411 | A0A1S3U023 | B13 | At5g52840 | NDUFA5 | NDUFA5 | NDUFA5 | NUFM | - |
| Q | NDUA6† | LOC106780789 | A0A1S3W1K8 | B14 | At3g12260 | NDUFA6 | NDUFA6 | NDUFA6 | NB4N | - |
| Q | NDUA7 | LOC106768957 | A0A1S3UVC7 | B14.5a | At5g08060 | NDUFA7 | NDUFA7 | NDUFA7 | NUZM | - |
| Q | NDUA9 | LOC106772694 | A0A1S3V8W7 | 39 kDa | At2g20360 | NDUFA9 | NDUFA9 | NDUFA9 | NUEM | - |
| Plant-specific accessory | ||||||||||
| CA | CA1‡ | LOC106778103 | A0A1S3VT00 | Gamma-CA 1 | At1g19580 | - | - | - | - | - |
| CA | CA2§ | LOC106761992, LOC106761993 | A0A1S3U566, A0A1S3U544 | Gamma-CA 2 | At1g47260 | - | - | - | - | - |
| CA | CA2-L¶ | LOC106765552 | A0A1S3UI49 | Gamma CA-like 2 | At3g48680 | - | - | - | - | - |
| CA | CA3* | n.a.** | n.a.** | Gamma-CA 3 | At5g66510 | - | - | - | - | - |
| CA | CA1-L* | n.a.** | n.a.** | Gamma-CA-like 1 | At5g63510 | - | - | - | - | - |
| PP | NDUX1†† | LOC106775330 | A0A1S3VI15 | 20.9 kDa | At4g16450 | - | - | - | NUXM | - |
| PP | P2/16 kDA | LOC106755236 | A0A1S3TGE7 | P2 | At2g27730 | - | - | - | - | - |
| Plant-specific accessory | ||||||||||
| Unconfirmed plant CI subunits (not seen in CI*) | MICOS (DUF543) | LOC106779628 | A0A1S3VY06 | MICOS subunit Mic10 | At1g72165 | - | - | - | - | - |
| Uncharacterized protein LOC106758628 | LOC106758628 | A0A1S3TTD7 | NDU10 | At4g00585 | - | - | - | - | ||
| P1/11 kDA | LOC106761134 | A0A1S3U2B9 | P1 | At1g67350 | - | - | - | - | - | |
| P3 | LOC106755586 | A0A1S3THM0 | P3 | At5g14105 | - | - | - | - | - | |
| P4 | LOC106767179 | A0A1S3UND4 | P4 | At1g67785 | - | - | - | - | - | |
| TIM22−4 × 1 | LOC106779665 | A0A3Q0EN44 | TIM22-4 | At1g18320 | - | - | - | - | - | |
| TIM22−4 × 2 | LOC106779665 | A0A1S3VZ08 | TIM22-1 | At3g10110 | - | - | - | - | - | |
| TIM23-2 | LOC106761237 | A0A1S3U2K1 | TIM23-2 | At1g72750 | - | - | - | - | - | |
| Uncharacterized protein LOC106768488 isoform X4 | LOC106768488 | A0A1S3UST2 | SH3/FCH domain protein | At1g68680 | - | - | - | - | - | |
| UDP-galactose transporter 1 | LOC106762681 | A0A1S3U838 | TPT domain-containing protein | At1g72180 | - | - | - | - | - | |
| Gravitropic in the light 1 | LOC106779790 | A0A1S3VYR1 | DUF641 domain-containing protein | At2g28430 | - | - | - | - | - | |
-
*Not seen in CI*.
†Only the C-terminus seen in CI* (see Main body and Discussion).
-
‡Called gamma carbonic anhydrase one in Uniprot.
§Called gamma carbonic anhydrase 1, mitochondrial in Uniprot (mis-assigned in the database).
-
¶Called gamma carbonic anhydrase-like 2, mitochondrial in Uniprot (mis-assigned in the database).
**Homologue not found using BLASTp.
-
††New identified subunit.
Table 4
PP- and PD-module bridging subunits in mammalian, Y. lipolytica and V. radiata CI.
Subunits discussed in the manuscript are marked with two asterisks (**). Bridging interactions are shaded in green. Lack of interactions by existing subunits or lack of homologues are shaded in orange. Lack of the PD subunits in V. radiata CI* is shaded in yellow. PP, proximal pumping domain; PD, distal pumping domain.
| Location | Subunit | Mammals | Y. lipolytica | V. radiata |
|---|---|---|---|---|
| Inter-membrane space (IMS) | NDUA8** | Extends along membrane arm, bridges NU2M (PP) and NU4M (PD) | Does not extend to the PP/PD-module interface but has an additional helix interacts with NU1M | C-terminally truncated (does not bridge) |
| NDUC2** | C-terminus bridges NDUB10 (PP) and NDUB11 (PD) | C-terminally truncated, but bridging interaction replaced by extended loop on NU4M | C-terminally truncated (does not bridge) | |
| NDUB5 | Bridging interactions | Bridging interactions | N- and C-terminally truncated (subunit not present in CI*) | |
| NDUA11 | Does not bridge in the IMS | C-terminal extension binding to NU4M | Subunit not present in CI* | |
| Membrane | NDUA11 | Binds to the lateral helix of NU5M, connecting NU5M and NU2M | Binds to the lateral helix of NU5M, connecting NU5M and NU2M | Subunit not present in CI* |
| Matrix | NDUS2** | Bridging interactions | Does not bridge | N-terminally truncated (does not bridge) |
| NU5M | Lateral helix extends into PP | Lateral helix extends into PP | Subunit not present in CI* | |
| NDUA10 | Bridging interactions | No homologue present | No homologue present | |
| NDUB11 | Bridging interactions | Does not bridge | Subunit not present in CI* | |
| NDUB4 | Does not bridge | N-terminus extends along matrix arm and binds to NU2M | N-terminally truncated (subunit not present in CI*) |
Table 5
Quantification of interfaces within the γ-carbonic-anhydrase (γCA) domain and between γCA and the proximal pumping domain (PP) of CI*.
Interface residues, surface areas, solvation free energies and P-values were determined by uploading the molecular model of CI* into the the PDBePISA tool for the exploration of macromolecular interfaces (Krissinel and Henrick, 2007). The table with the full list of interaction surfaces for CI* was filtered for the interfaces involving CA1, CA2 or CAL2. Total values were obtained by adding the relevant two-way interactions, as per PDBePISA guidelines.
| Subunit 1 | Subunit 2 | Inter-subunit interface | ||||||
|---|---|---|---|---|---|---|---|---|
| Subunit | # Interfacing residues | Interfacing surface area (Å2) | Subunit | # Interfacing residues | Interfacing surface area (Å2) | Interface surface area (Å2) | Interface solvation free energy (kcal/mol) | Solvation free energy gain P-value |
| Within γCA domain | ||||||||
| CA1 | 88 | 20,989 | CA2 | 80 | 22,088 | 2581.4 | −45.6 | 0.000 |
| CA1 | 79 | 20,989 | CAL2 | 72 | 20,073 | 2637.8 | −38.2 | 0.001 |
| CA2 | 73 | 22,088 | CAL2 | 66 | 20,073 | 2148.1 | −33.2 | 0.000 |
| Total | 7367.3 | −117 | ||||||
| Between γCA domain and membrane arm (PP) | ||||||||
| NU2M | 16 | 7610 | CA1 | 16 | 20,989 | 259.2 | −17.1 | 0.001 |
| NU2M | 16 | 7610 | CA2 | 16 | 22,088 | 261.1 | −17.1 | 0.001 |
| NU2M | 16 | 7610 | CAL2 | 16 | 20,073 | 263.6 | −18.0 | 0.003 |
| NDUC2 | 21 | 13,708 | CA1 | 21 | 20,989 | 427.8 | −20.2 | 0.000 |
| NDUC2 | 16 | 13,708 | CA2 | 16 | 22,088 | 242.3 | −15.8 | 0.000 |
| NDUC2 | 21 | 13,708 | CAL2 | 22 | 20,073 | 416.2 | −18.7 | 0.000 |
| P2 | 21 | 10,433 | CA1 | 21 | 20,989 | 362.6 | −16.5 | 0.000 |
| P2 | 26 | 10,433 | CA2 | 22 | 22,088 | 512.7 | −21.5 | 0.001 |
| P2 | 17 | 10,433 | CAL2 | 17 | 20,073 | 244.6 | −16.8 | 0.001 |
| NDUX1 | 16 | 13,955 | CA1 | 16 | 20,989 | 236.5 | −15.9 | 0.000 |
| NDUX1 | 17 | 13,955 | CA2 | 17 | 22,088 | 268.1 | −15.0 | 0.000 |
| NDUX1 | 16 | 13,955 | CAL2 | 16 | 20,073 | 240.9 | −16.7 | 0.000 |
| Total | 3735.6 | −209.3 | ||||||
Key resources table
| Reagent type (species) or resource | Designation | Source or reference | Identifiers | Additional information |
|---|---|---|---|---|
| Biological sample (Vigna radiata) | V. radiata seeds | Todd’s Tactical Group | TS-229 | Lot SMU2-8HR; DOB 2/25/2019 |
| Commercial assay or kit | Pierce BCA assay kit | Thermo Fisher | 23225 | |
| Commercial assay or kit | 3–12% NativePAGE gels and buffers | Invitrogen | BN1001BOX; BN2001; BN2002 | |
| Chemical compound, drug | Digitonin, high purity | EMD Millipore | 300410 | |
| Chemical compound, drug | A8-35 | Anatrace | A835 | |
| Chemical compound, drug | Gamma-cyclodextrin | EMD Millipore | C4892 | |
| Chemical compound, drug | NADH | VWR Life Sciences | 97061–536 | |
| Chemical compound, drug | Nitrotetrazoleum | EMD Millipore | 74032 | |
| Software, algorithm | SerialEM | University of Colorado, Schorb et al., 2019 | RRID:SCR_017293 | |
| Software, algorithm | RELION 3.0 | Zivanov et al., 2018 | RRID:SCR_016274 | |
| Software, algorithm | Motioncor2 | Zheng et al., 2017 | ||
| Software, algorithm | Ctffind4 | Rohou and Grigorieff, 2015 | RRID:SCR_016732 | |
| Software, algorithm | crYOLO | Wagner et al., 2019; Wagner and Raunser, 2020 | RRID:SCR_016732 | |
| Software, algorithm | Phyre2 | Kelley et al., 2015 | ||
| Software, algorithm | Coot | Emsley and Cowtan, 2004 | RRID:SCR_014222 | |
| Software, algorithm | PHENIX | Liebschner et al., 2019; Goddard et al., 2018; Pettersen et al., 2004 | RRID:SCR_014224 | |
| Software, algorithm | UCSF Chimera | Resource for Biocomputing, Visualization, and Informatics at the University of California, San Francisco, Pettersen et al., 2004 | RRID:SCR_004097 | |
| Software, algorithm | PyMOL Molecular Graphics System, Version 2.0 Schrödinger, LLC. | Schrödinger, LLC | RRID:SCR_000305 | Version 2.0 |
| Other | Holey carbon grids | Quantifoil | Q310CR1.3 | 1.2/1.3 300 mesh |
Appendix 1—table 1
Values used in the calculations.
| Variable | Value | Source |
|---|---|---|
| 160 mV | Values of 140–190 mV have been reported from respiring cells (Ripple et al., 2013); a value of 200 mV was reported for isolated etiolated V. radiata mitochondria after addition of 1 mM NADH, which defines an upper limit for steady-state respiration (Moore and Bonner, 1981) | |
| R | 8.314 kJ K−1 mol−1 | Physical Constant |
| T | 300 K | Approximately 27 °C |
| F | 96,485 C mol−1 | Physical Constant |
| 4 mV | This value varies as a function of pH so should only be considered an estimate (Nicholls, 2013) | |
| 10 | Kim et al., 2012 | |
| 34 mV | Calculated from and using Equation 1 | |
| −320 mV | This value varies as a function of pH, so should only be considered an estimate (Nicholls, 2013) |
Additional files
Download links
A two-part list of links to download the article, or parts of the article, in various formats.
Downloads (link to download the article as PDF)
Open citations (links to open the citations from this article in various online reference manager services)
Cite this article (links to download the citations from this article in formats compatible with various reference manager tools)
Atomic structure of a mitochondrial complex I intermediate from vascular plants
eLife 9:e56664.
https://doi.org/10.7554/eLife.56664


