Trait-associated noncoding variant regions affect TBX3 regulation and cardiac conduction
- Department of Medical Biology, Amsterdam Cardiovascular Sciences, Amsterdam University Medical Centers, University of Amsterdam, Netherlands
- Department of Clinical and Experimental Cardiology, Amsterdam Cardiovascular Sciences, Amsterdam University Medical Centers, University of Amsterdam, Netherlands
Figures
Figure 1

Identification of AVCS-specific accessible chromatin within the Tbx3 locus harboring GWAS-associated variant regions.
(A) UCSC genome browser view depicts the genomic location of human TBX3 and neighboring genes. GWAS SNPs associated with PR interval (van Setten et al., 2018) and QRS duration (van der Harst et al., 2016) are plotted as –log10 of their p-values (lower cut-off 1.3 (p=0.05)) and depict two variant regions (VR1 and VR2) upstream of TBX3. CTCF ChIP-seq track shows binding sites for CTCF, corresponding to the boundaries of the topologically associating domains. The Hi-C map is derived from a human lymphoblastoid cell line (Rao et al., 2014) and reveals separated domains for TBX3 and neighboring MED13L and TBX5 (dark grey dashed lines). Within the TBX3/TBX5 TAD, the TBX3 and TBX5 loci form sub-TADs (light grey dashed lines). (B) Genome browser view depicting embryonic Tbx3+ AVCS-specific (ATAC_AVCS) and ventricular (ATAC Ventricle) accessible chromatin regions (van Duijvenboden et al., 2019) within the murine Tbx3 locus. AVCS and Ventricle RE candidates depict selected ATAC regions. (C) HOMER motif enrichment analysis on 67 AVCS and Ventricle ATAC regions (depicted in B) reveals binding motifs for Smad, Gata and Tcf factors are enriched in AV junction accessible regions compared to ventricular accessible regions. (D) Overlap of 67 ATAC_AVJ regions within Tbx3 locus with 67 ATAC-ventricle regions.
Figure 2 with 2 supplements
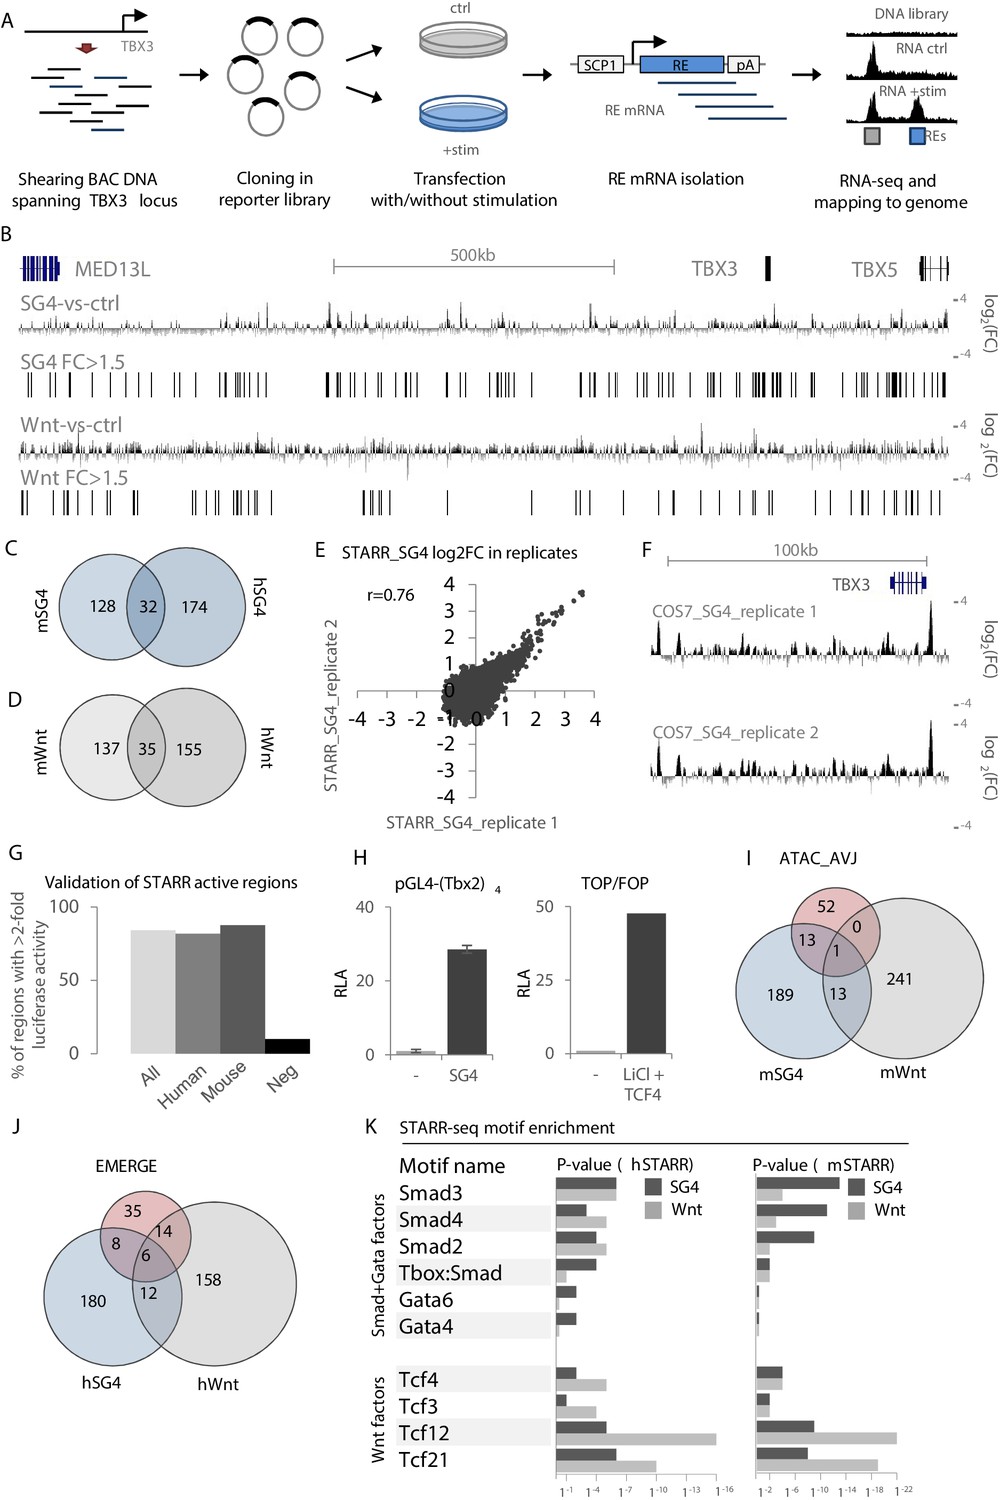
Validation and characterization of STARR-seq datasets.
(A) Overview of the STARR-seq procedure on the murine/human TBX3/TBX5 locus. BACs spanning the entire murine or human TBX3/TBX5 locus are sheared to fragments of approximately 500–1000 bp. Fragments are recombined in the pSTARR expression vector to generate the STARR-seq libraries, which are transfected in cells with or without stimulation, that is with pcDNA (control) or expression vectors for Smad/Gata or Tcf factors. Two days after transfection, total RNA is isolated from all cells. mRNA transcripts are isolated from the pool of total RNA and next-generation sequenced on an Illumina MiSeq. Reads are mapped to the respective genomes. Comparison of stimulated over control data yields stimulus-responsive REs. (B) Overview of the human TBX3/TBX5 locus with STARR-seq tracks for hSTARR_SG4 (SG4-vs-ctrl) and hSTARR_Wnt (Wnt-vs-ctrl). The displayed tracks represent log2 fold changes of enrichment of SG4/Wnt-stimulated regions over the unstimulated control. (C,D) Functional conservation of STARR-seq activity between murine and human fragments. Overlap of translated (mm9 to hg19) mSTARR_SG4 (160/216) (C) or mSTARR_Wnt (172/253) (D) regions with human hSTARR_SG4/Wnt regions. (E) Correlation between STARR-seq activities of replicate hSTARR_SG4 transfections in COS-7 cells. X- and y-axis depict log2 of the fold change of replicate 1 and replicate 2, respectively. (F) Genome browser views of hSTARR tracks for replicate transfections of libraries in COS-7 cells with co-transfection of SG4 factors show reproducibility of STARR-seq data. (G) Validation of selected active (log2FC >0.58 (FC >1.5)) hSTARR (n = 10), mSTARR (n = 9) and negative h/mSTARR (FC <1.5; n = 10) regions by luciferase assay. Y-axis represents percentage of tested fragments with activity in luciferase assay (FC >2 of reporter activity over empty vector). (H) Relative luciferase activity (RLA) of pGL4-(Tbx2)4 (top) and the ratio of luciferase activity of TOP over FOP reporter (bottom) upon co-transfection with pcDNA (‘-‘) and SG4- and Tcf-factors, respectively. Transfection in COS-7 cells; n = 4. (I,J) Overlap of mSTARR_SG4/Wnt regions with ATAC_AVCS regions (I) and of hSTARR_SG4/Wnt with hEMERGE regions (J). (K) HOMER motif enrichment analysis on human and murine STARR_SG4 and STARR_Wnt active (log2FC >0/58 (FC >1.5)) regions. Binding motifs for Smad/Gata factors are generally more enriched in STARR_SG4 regions, whereas STARR_Wnt regions are more enriched for motifs for Tcf factors in both human and murine datasets.
Figure 2—figure supplement 1
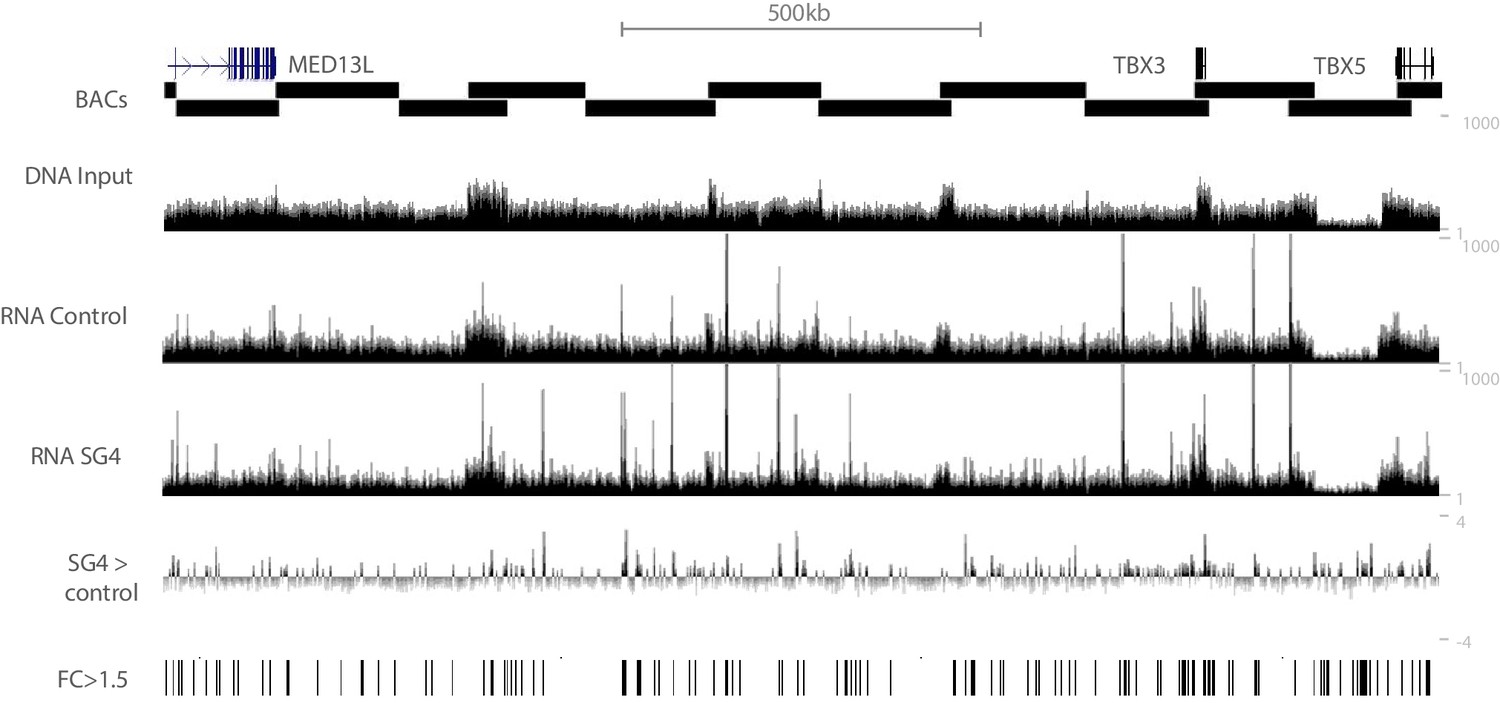
Overview of STARR-seq results in the human TBX3/TBX5 locus.
16 BACs spanning the entire TBX3/TBX5 locus were used to capture genomic fragments to generate STARR-seq libraries. Sequencing of the input library (DNA input) reveals an even coverage throughout the locus, indicating the entire locus is sufficiently represented in the library. Domains where two input BACs overlap can be recognized by an approximate doubling of the number of reads. Sequencing of RNA isolated after transfection of the input library in COS7 cells without stimulation (RNA control) shows regions that activate reporter gene expression in COS7 cells. RNA_SG4 track shows additional peaks, indicating regions stimulated by Smad/Gata factors. SG4 >Control depicts the log2 fold change of RNA_SG4 reads over RNA_control reads. Regions with a fold change >1.5 (FC >1.5) were included for further analysis.
Figure 2—figure supplement 2
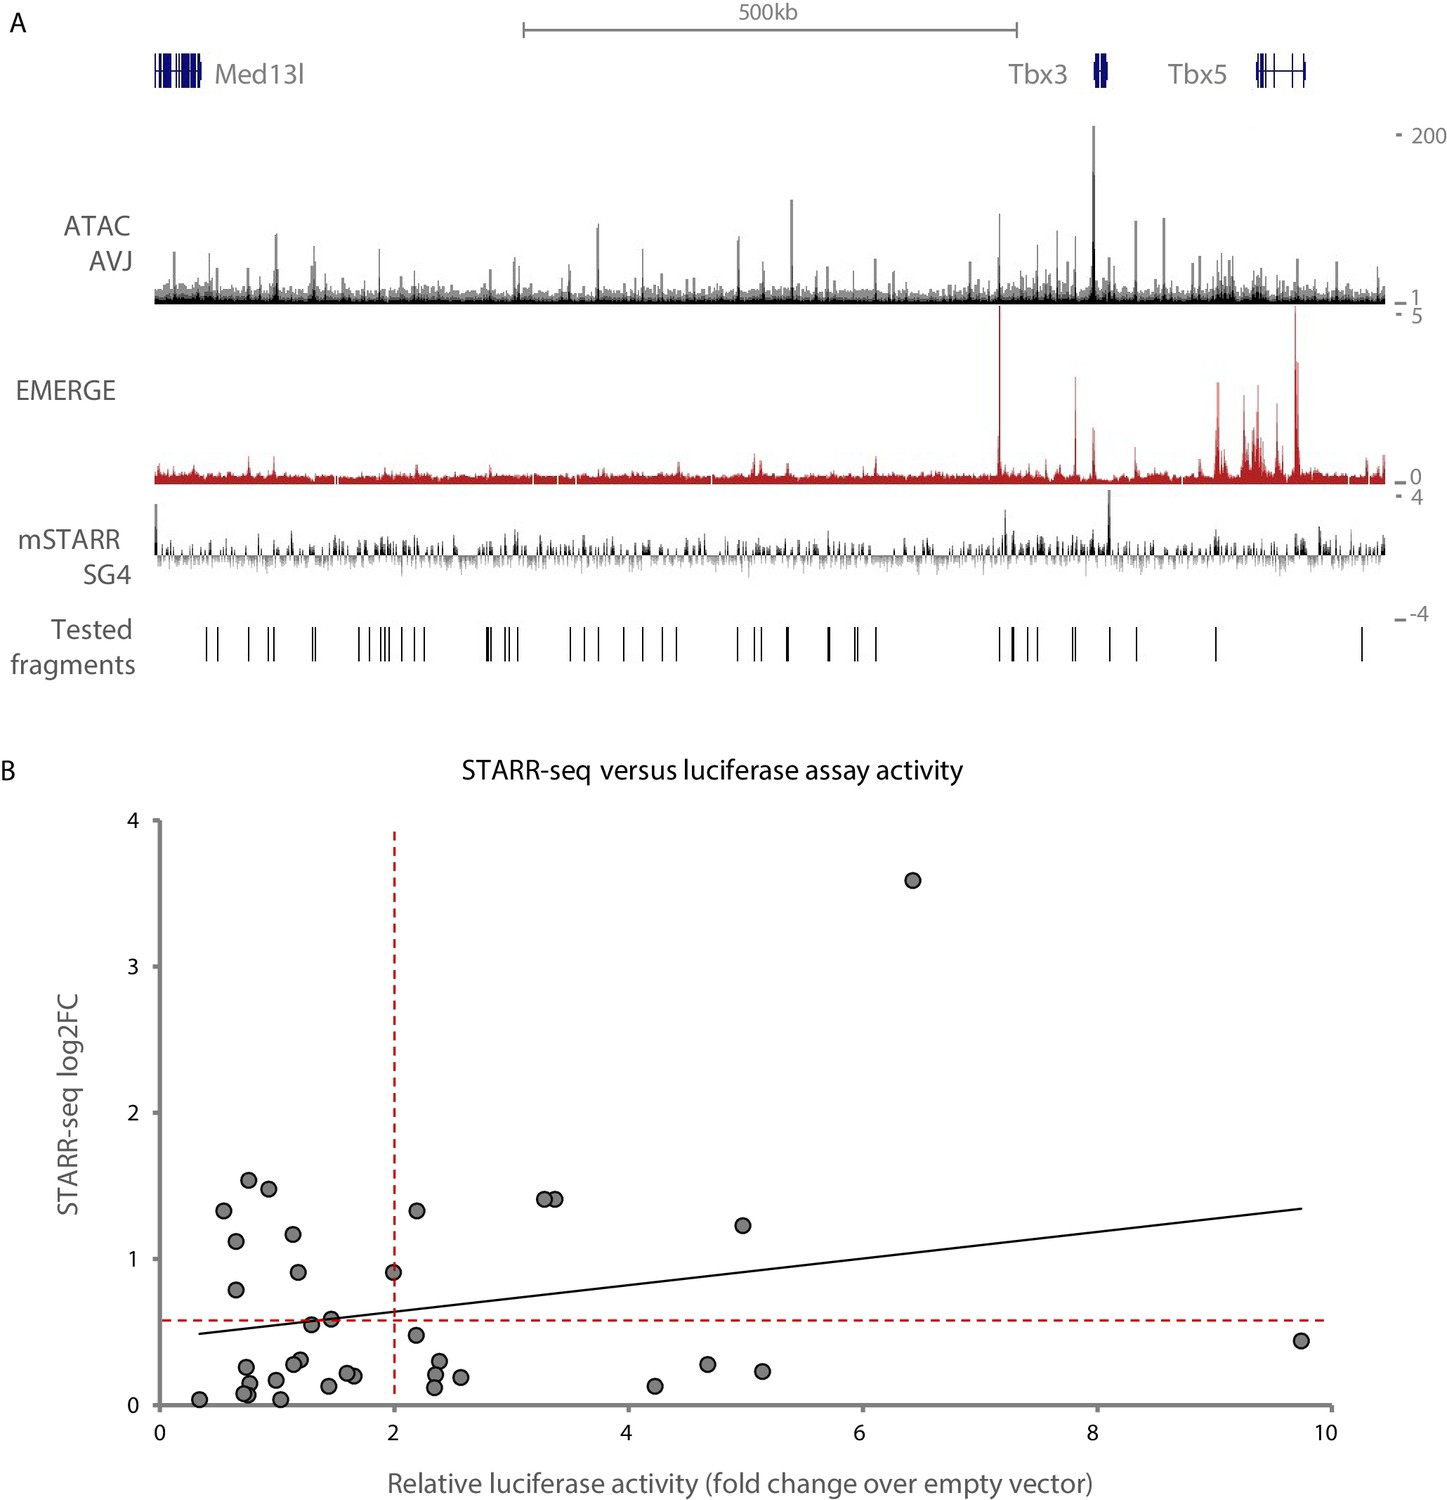
Discrepancy between STARR-seq activity and luciferase reporter activity of selected regions.
(A) Overview of the murine Tbx3 locus with ATAC_AVJ, EMERGE and STARR_SG4 data. Fragments selected for luciferase assay, selected either on STARR-seq activity or EMERGE/ATAC peaks are depicted below. (B) Correlation between luciferase reporter activity (fold change of reporter activity over activity of empty pGL2-SV40 vector; threshold FC >2) and STARR-seq (log2FC of SG4 over pcDNA control; threshold log2FC >0.58 (FC >1.5)) of selected fragments.
Figure 3 with 1 supplement
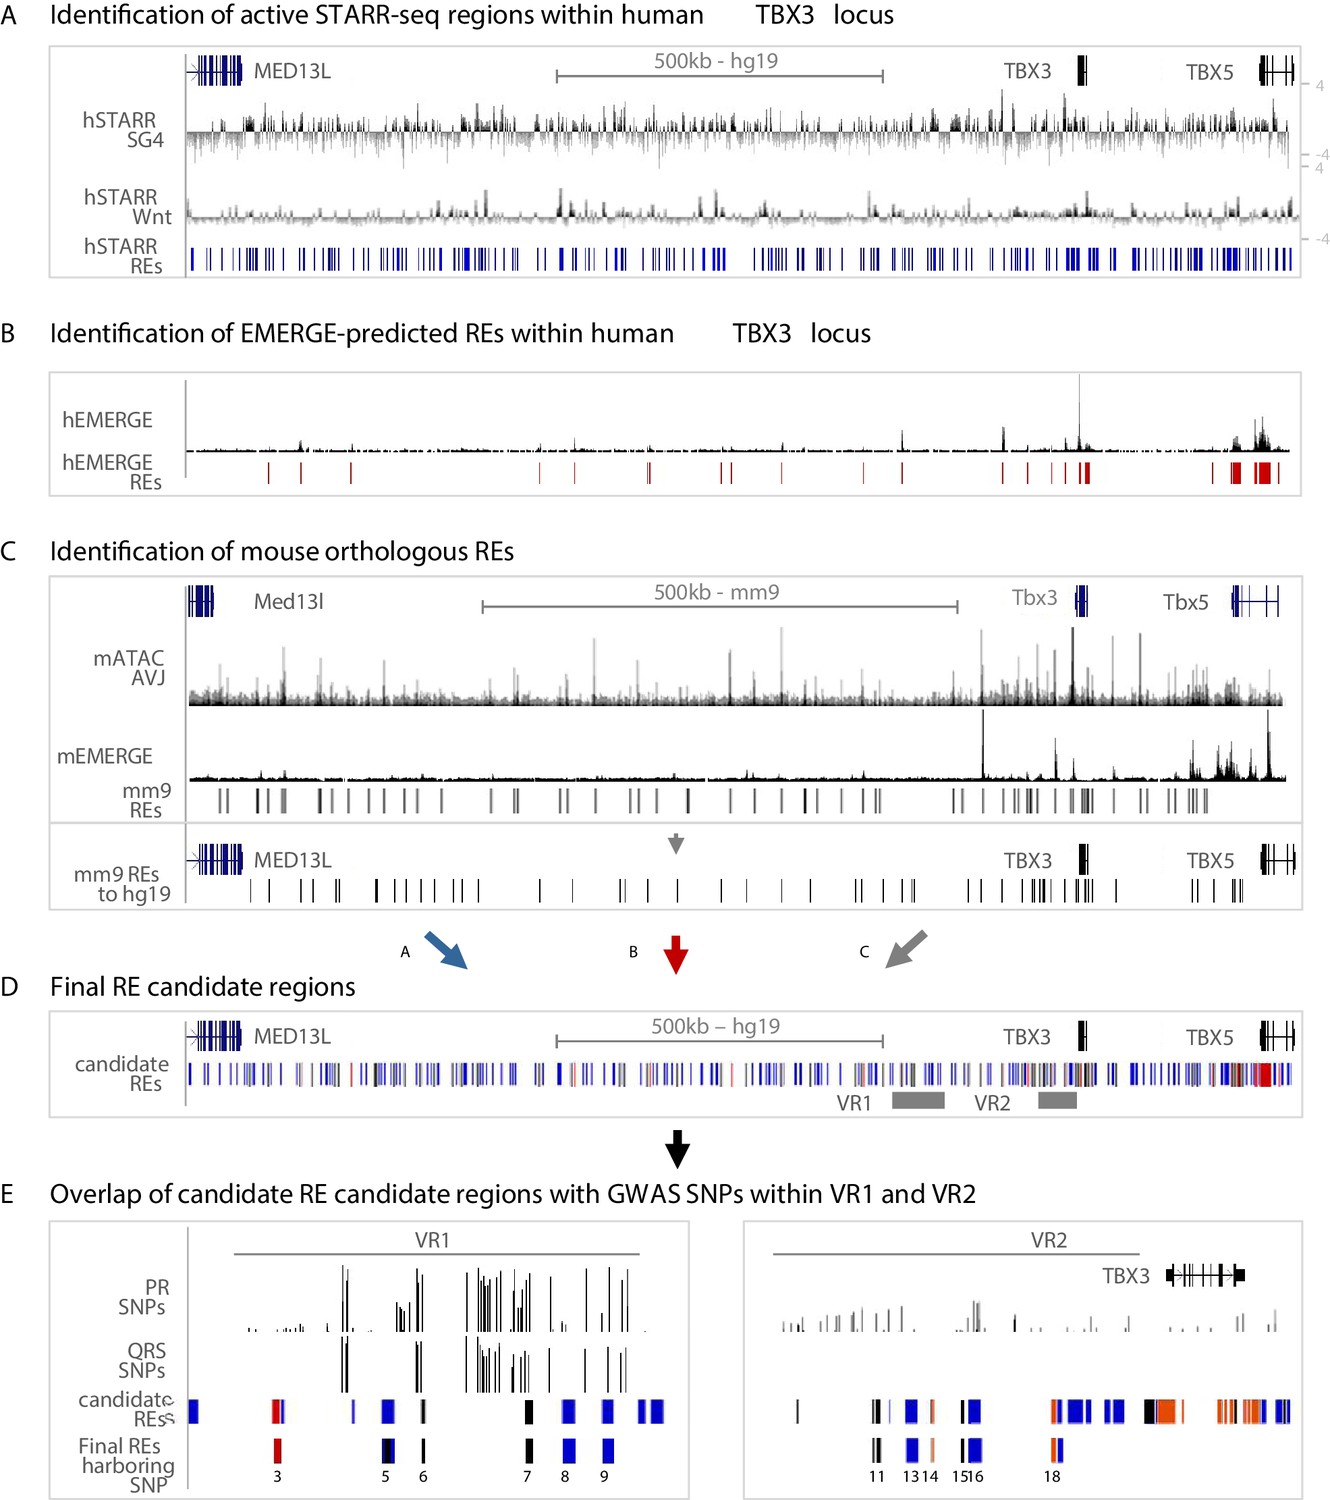
Approach for the identification of candidate REs potentially affected by GWAS variation.
(A) Active STARR regions within the human TBX3 locus, responding to either SG4- or Tcf-factors. Log2 ratios of the fold change of SG4- or Tcf-stimulated respons to pcDNA is depicted. Blue bars represent active regions (fold change >1.5) included for further analysis. (B) EMERGE enhancer prediction track (black) with selected enhancer candidates (red bars) included for further analysis. (C) Identification of candidate REs within the mouse Tbx3 locus. Regions were selected based on ATAC_AVCS (top black track) and mouse EMERGE enhancer prediction (bottom black track). Selected regions (black bars) were translated to and plotted onto the human genome and included for further analysis. (D) Final RE candidate regions within the human TBX3 based on the three criteria listed above. Blue bars: hSTARR regions; red bars: human EMERGE regions; black bars: mouse orthologous candidate regions translated to human genome. (E) Overlap of candidate regions from (D) within VR1 and VR2 with GWAS SNPs leads to final list of RE candidates potentially affected by GWAS variation.
Figure 3—figure supplement 1
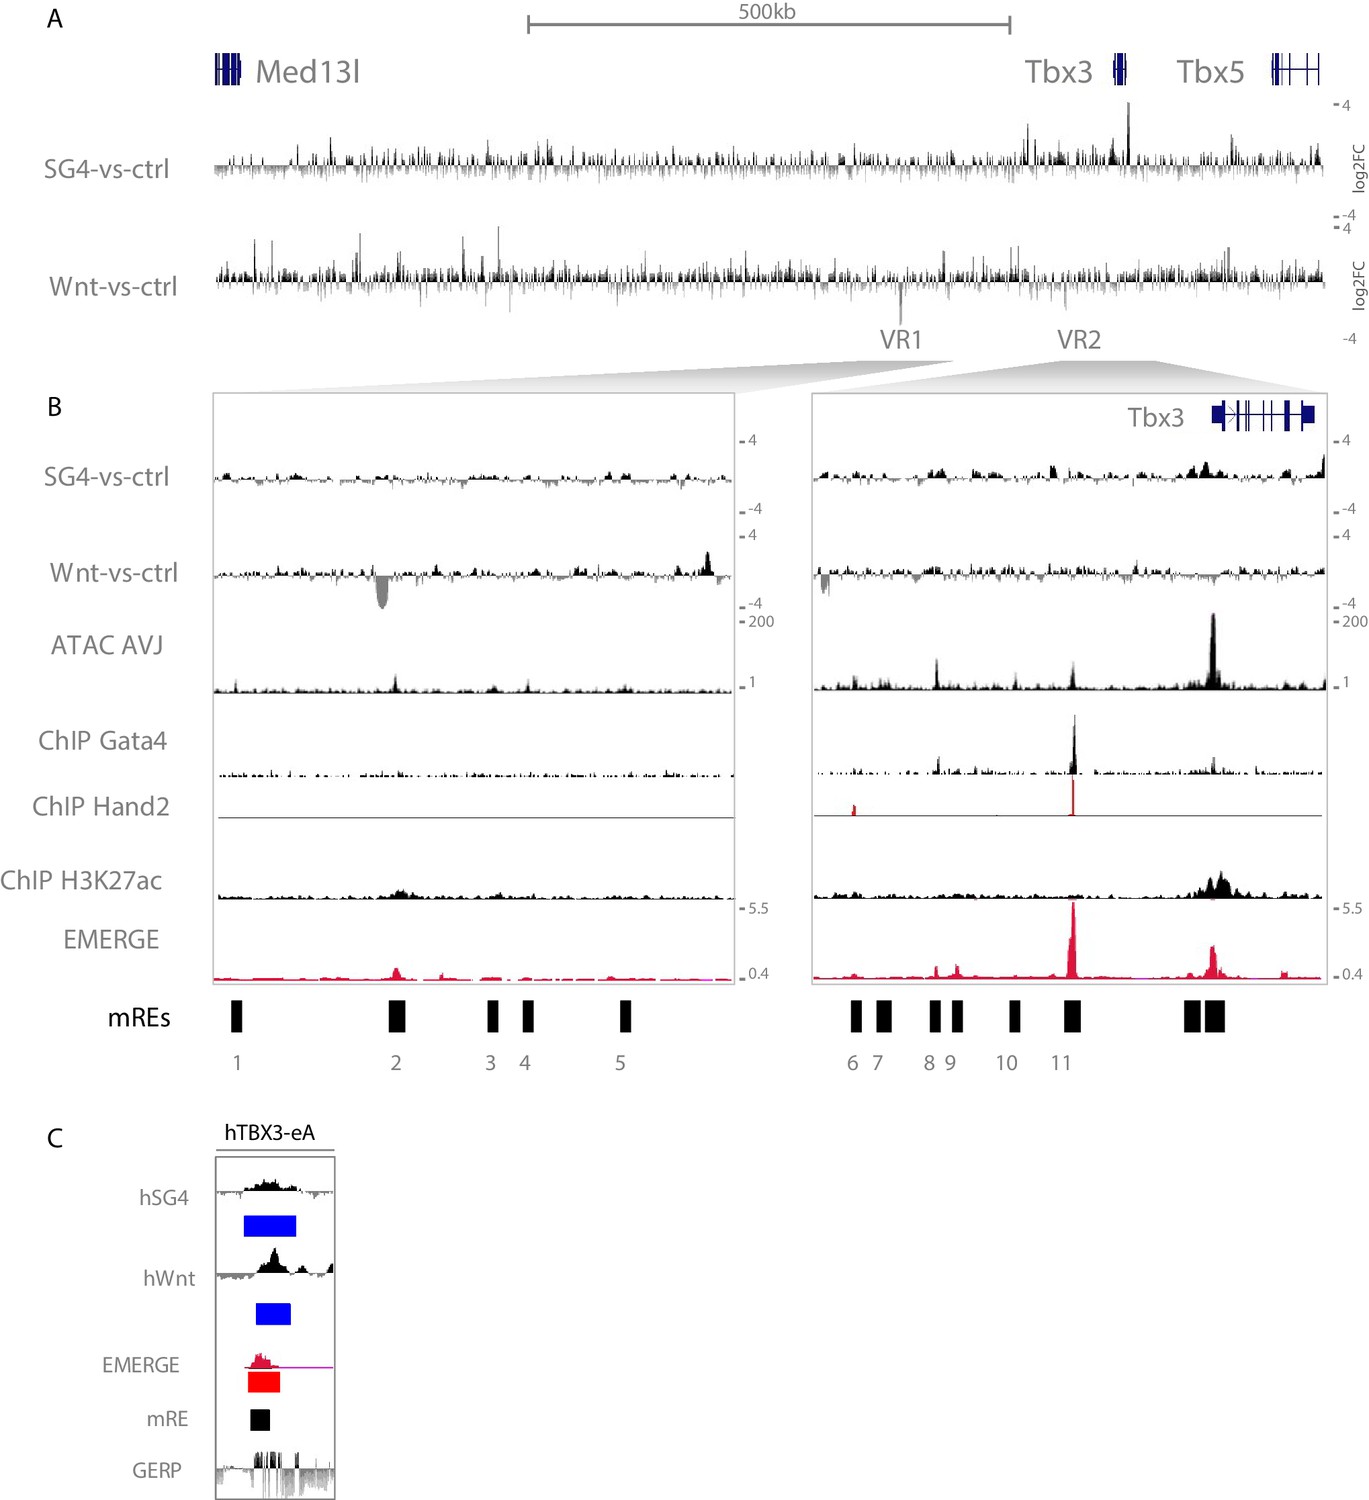
STARR-seq of the murine Tbx3/Tbx5 locus.
(A) Overview of the murine Tbx3/Tbx5 locus with STARR-seq data tracks for mSTARR_SG4 (SG4-vs-ctrl) and mSTARR_Wnt (Wnt-vs-ctrl). The displayed tracks represent log2 fold changes of enrichment of SG4/Wnt-stimulated over the unstimulated control. (B) Zoom-in of VR1 and VR2 show overlap of mSTARR data tracks with tracks of ATAC-seq in embryonic AVJs, ChIP-seq for Gata4, Hand2 and H3K27ac, and EMERGE enhancer prediction. Black mRE bars below tracks depict final murine RE candidates selected based on signal in the different datasets. (C) Validated enhancer hTBX3-eA, previously shown to drive AVCS expression and to respond to SG4 stimulation in vitro (van Weerd et al., 2014), is conserved between human and mice (Genomic Evolutionary Rate Profiling; GERP), shows STARR-seq activity for both SG4 and Wnt stimulation (hSG4/hWnt), is predicted by human EMERGE, and is accessible in murine Tbx3+ AVCS cardiomyocytes (ATAC_AVCS; mRE).
Figure 4 with 1 supplement
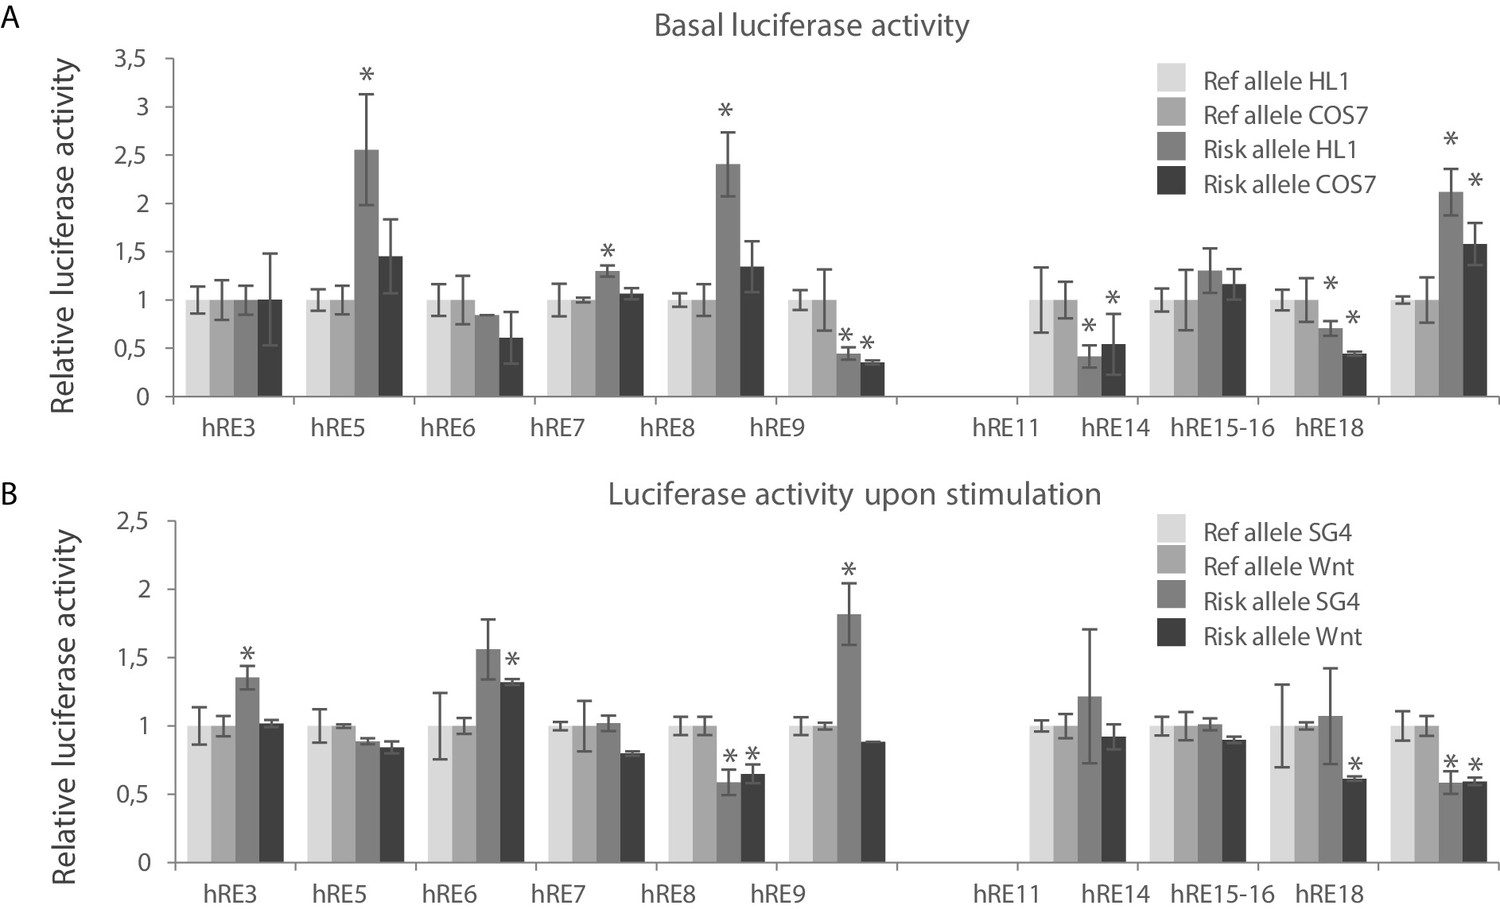
Identification of functional variants affecting RE candidate activity within human VR1 and VR2.
(A) Basal luciferase activity of the reference and alternative alleles for each RE candidate in HL-1 and COS-7 cells. Luciferase activities were normalized to the activity of the reference allele for each fragment, in both HL-1 and COS-7 cells. (B) Relative luciferase activity of the reference and alternative alleles for each RE candidate upon stimulation with Smad- and Gata4 factors (SG4) and Tcf+LiCl factors (Wnt) in COS-7 cells. SG4/Wnt activity of the alternative alleles were normalized to the respective activity of the reference allele for each RE candidate. Transfections were performed in duplicates and replicated twice. Error bars represent standard deviations. *: p<0.05 (Student’s t-test).
Figure 4—figure supplement 1

Regulatory activity of RE candidates.
(A) Basal activity of reference alleles of RE candidates in HL1 (light grey bars) and COS7 cells (dark grey bars). Luciferase activity for each RE candidate is normalized to the activity of the empty pGL2-SV40 vector. (B) Luciferase activity of reference alleles of RE candidates upon stimulation with Smad/Gata- (SG4) and Tcf+LiCl- (Wnt) factors in COS7 cells. Luciferase activity of each RE candidate is normalized to the activity of each RE candidate upon co-transfection with pcDNA (control). Transfections were performed in duplicates and replicated twice. Error bars represent standard deviation. *: p<0.05.
Figure 5 with 1 supplement
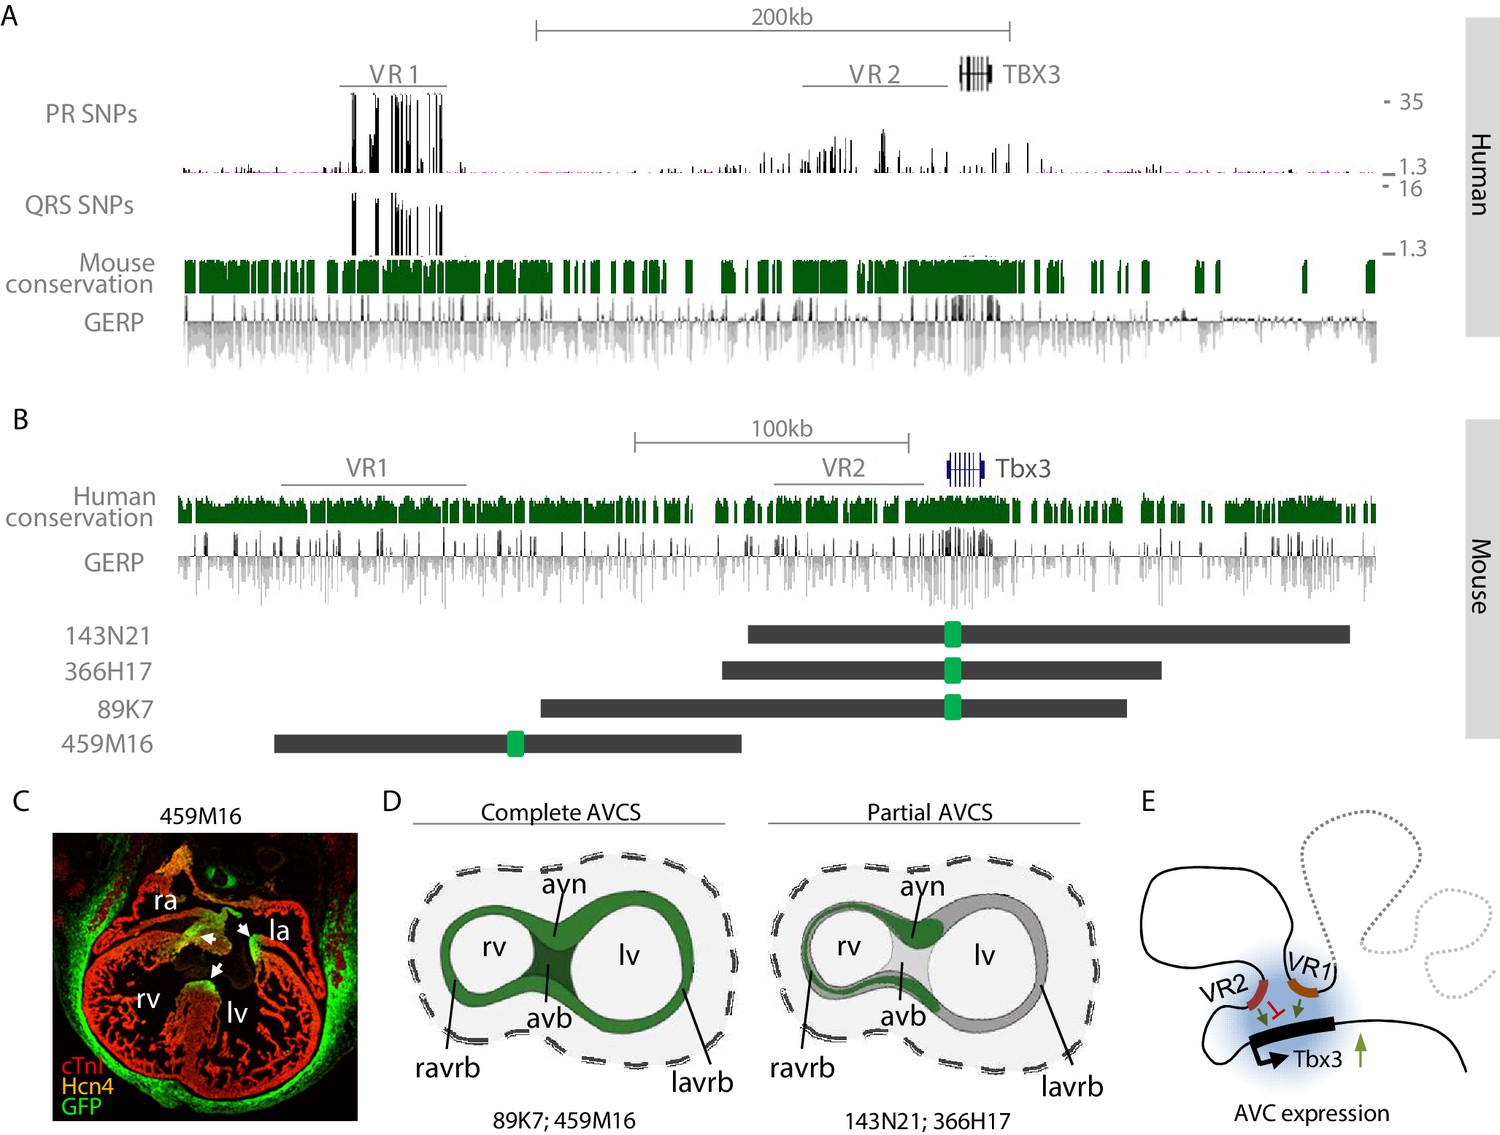
VR1 and VR2 are located within regulatory domains that redundantly drive AVCS expression.
(A) Zoom-in of the human TBX3 locus depicting distal variant region VR1, harboring SNPs for both PR interval and QRS duration, and proximal variant region VR2, harboring SNPs for PR interval. Mouse conservation (green) depicts genomic sequences conserved in the mouse genome; GERP depicts evolutionary constraint of genomic regions. (B) Homologous murine region within the Tbx3 locus corresponding to the region depicted in (A). Homologous regions of VR1 and VR2 are depicted. Dark grey lines depict the locations of GFP-modified BACs, harboring either only VR2 (143N21, 366H17), both VR1 and VR2 (89K7) or only VR1 (459M16). (C) Immunohistochemistry on section through E14.5 459M16-GFP heart shows GFP reporter gene expression throughout the entire AVCS (white arrows). The Hcn4+ sinoatrial node does not express GFP. (D) Schematic overview of GFP-expression domains of BACs depicted in (B). The genomic region spanned by BACs 89K7 and 459M16, both harboring VR1, harbors regulatory elements driving expression throughout the complete AVCS including the atrioventricular bundle. The genomic region spanned by BACs 143N21 and 366H17 drive partial AVCS expression, not including left atrioventricular ring bundle and atrioventricular bundle expression. (E) Model of the topology of the Tbx3 locus, depicting VR1 and VR2 both involved in regulation of Tbx3 in the AV conduction system. Genomic sequences involved in the expression of Tbx3 in the sinoatrial node are absent from these regions and likely reside more distally (grey dashed line). avb, atrioventricular bundle; avn, atrioventricular node; la, left atrium; lv, left ventricle; ra, right atrium; ravrb, right atrioventricular ring bundle; rv, right ventricle.
Figure 5—figure supplement 1

BAC 459M16-GFP recapitulates AVCS expression.
(A) Fluorescence of GFP in whole E14.5 459M16-GFP embryo (left) and isolated heart (right). Expression is seen in among others the whisker placodes, limb buds, mammary glands and developing retina. Within the heart, GFP expression is observed in the atrioventricular canal, the atrioventricular bundle and the bundle branches. (B) Table listing regions where Tbx3 is endogenously expressed and where GFP expression in 459M16-GFP E14.5 embryos is (+) or is not (-) observed.
Figure 6 with 2 supplements
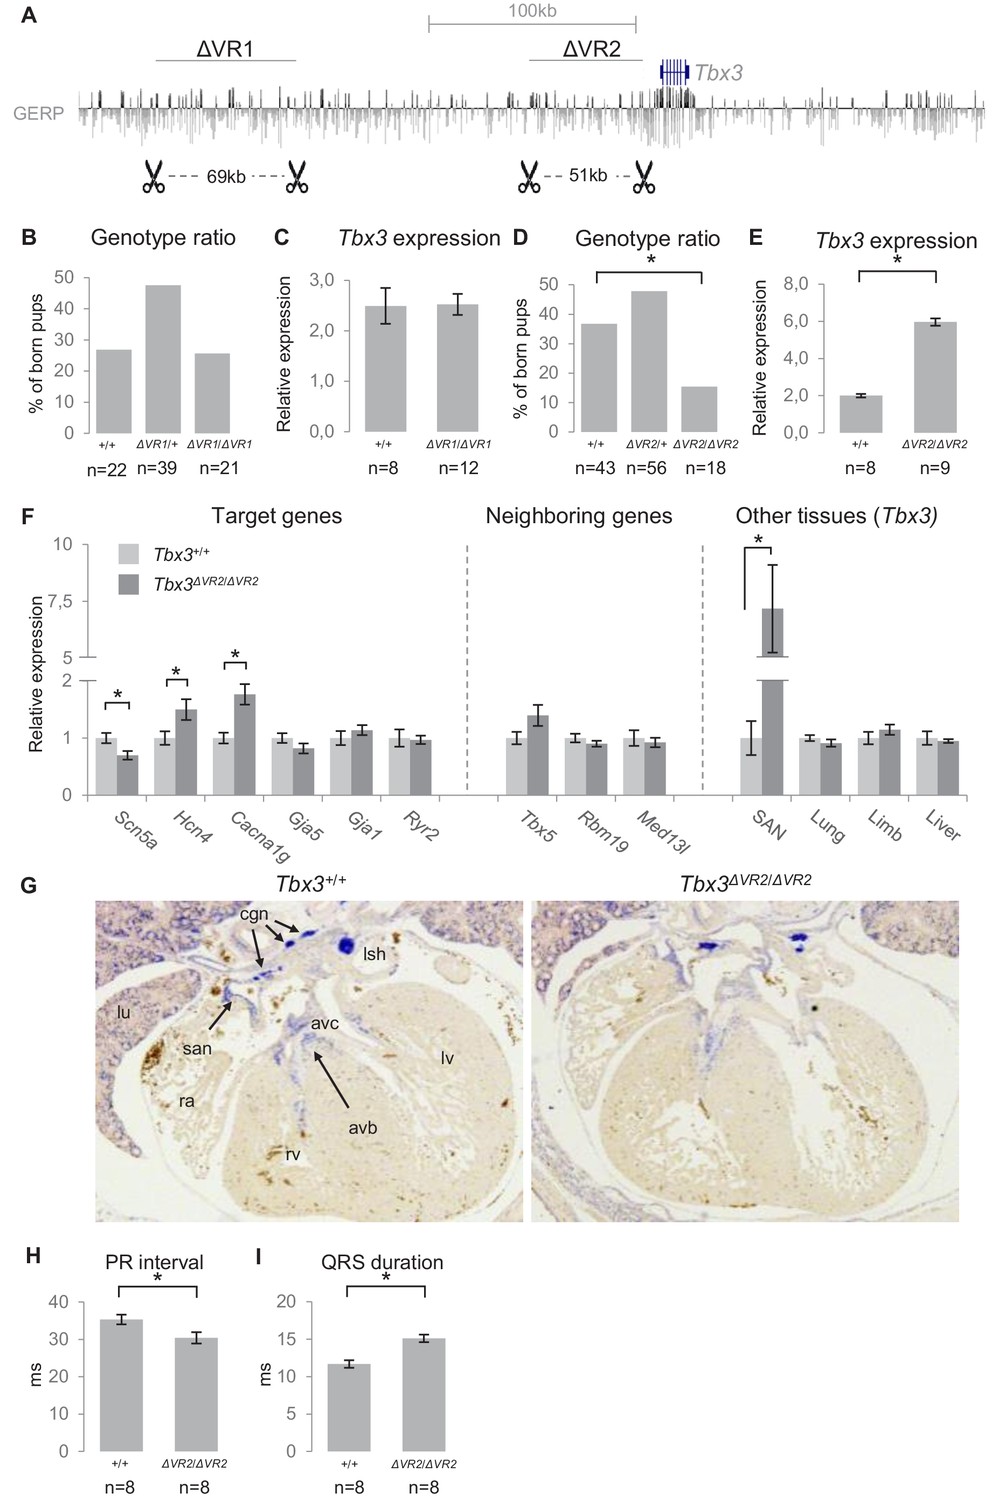
Genomic deletion of VR1 and VR2 in vivo.
(A) Mouse genomic regions targeted by TALEN- (VR1) or CRISPR-Cas9- (VR2) mediated genome editing. (B) Genotype ratios of ∆VR1 mutant and wildtype born pups, depicted as percentage of total number of pups. (C) Relative expression levels of Tbx3 in Tbx3+/+ (n = 8) and Tbx3∆VR1/∆VR1 (n = 12) microdissected E13.5 AV junctions. Expression levels are normalized to the expression of Tbx2. (D) Genotype ratios of ∆VR2 mutant and wildtype born pups, depicted as percentage of total number of pups, revealing the number of Tbx3∆VR2/∆VR2 pups is lower than expected according to Mendelian ratios (*: p<0.01). (E) Relative expression levels of Tbx3 in Tbx3+/+ (n = 8) and Tbx3∆VR2/∆VR2 (n = 9) microdissected E13.5 AV junctions, revealing increased expression of Tbx3 in Tbx3∆VR2/∆VR2 mutants (p<0.05). Expression levels are normalized to the expression of Tbx2. (F) Expression levels of target genes of Tbx3 in microdissected E13.5 AV junctions, expression levels of neighboring genes in microdissected E13.5 AV junctions, and expression levels of Tbx3 in other tissues in which Tbx3 is expressed, in Tbx3+/+ (n = 8) and Tbx3∆VR2/∆VR2 (n = 9) E13.5 embryos. Expression levels were normalized to the expression of Tbx2 (AV junctions), Isl1 (SAN) or Hprt (lung, limb, liver). *:p<0.05. (G) In-situ hybridization on sections of Tbx3+/+ and Tbx3∆VR2/∆VR2 E13.5 hearts shows expression of Tbx3 in the cardiac conduction system, including the sinoatrial node, atrioventricular canal, atrioventricular bundle and bundle branches. The expression pattern is not affected in Tbx3∆VR2/∆VR2 hearts. (H,I) PR interval (H) and QRS duration (I) in Tbx3+/+ (WT; n = 8) and Tbx3∆VR2/∆VR2 (hom; n = 8) mice measured by surface ECG on male mice (2–4 months old). *:p<0.05. avb, atrioventricular bundle; avc, atrioventricular canal; cgn, cardiac ganglia; la, left atrium; lsh, left sinus horn; lu, lung; lv, left ventricle; ra, right atrium; rv, right ventricle; san, sinoatrial node.
Figure 6—figure supplement 1
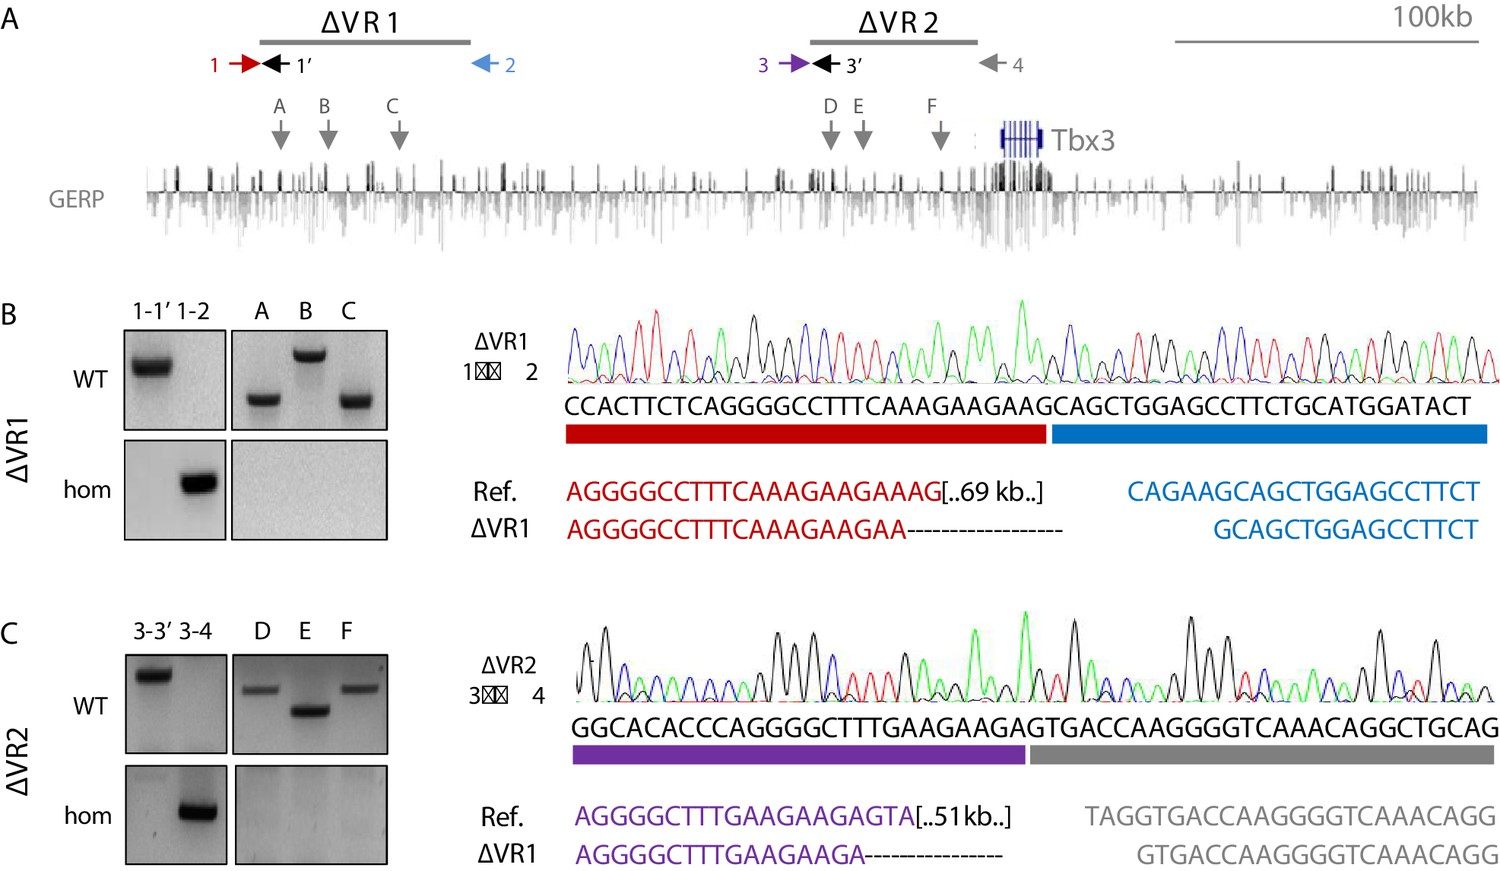
Validation of genomic deletion of VR1 and VR2.
(A) UCSC browser view of the murine Tbx3 locus with the location of VR1 and VR2 depicted. Numbered arrows depict primers used for genotyping. Grey lettered arrows depict the location of regions within VR1/VR2 to test for proper deletion in Tbx3ΔVR1/ΔVR1 and Tbx3ΔVR2/ΔVR2 as shown in (B). (B) Genotyping by PCR (left) and Sanger sequencing (right) show regions A, B and C (VR1) and D, E and F (VR2) are absent in Tbx3ΔVR1/ΔVR1 and Tbx3ΔVR2/ΔVR2 mice. Sanger sequencing on the PCR product of primer pairs 1–2 and 3–4 flanking VR1 and VR2 reveal exclusion of these regions from the genome.
Figure 6—figure supplement 2
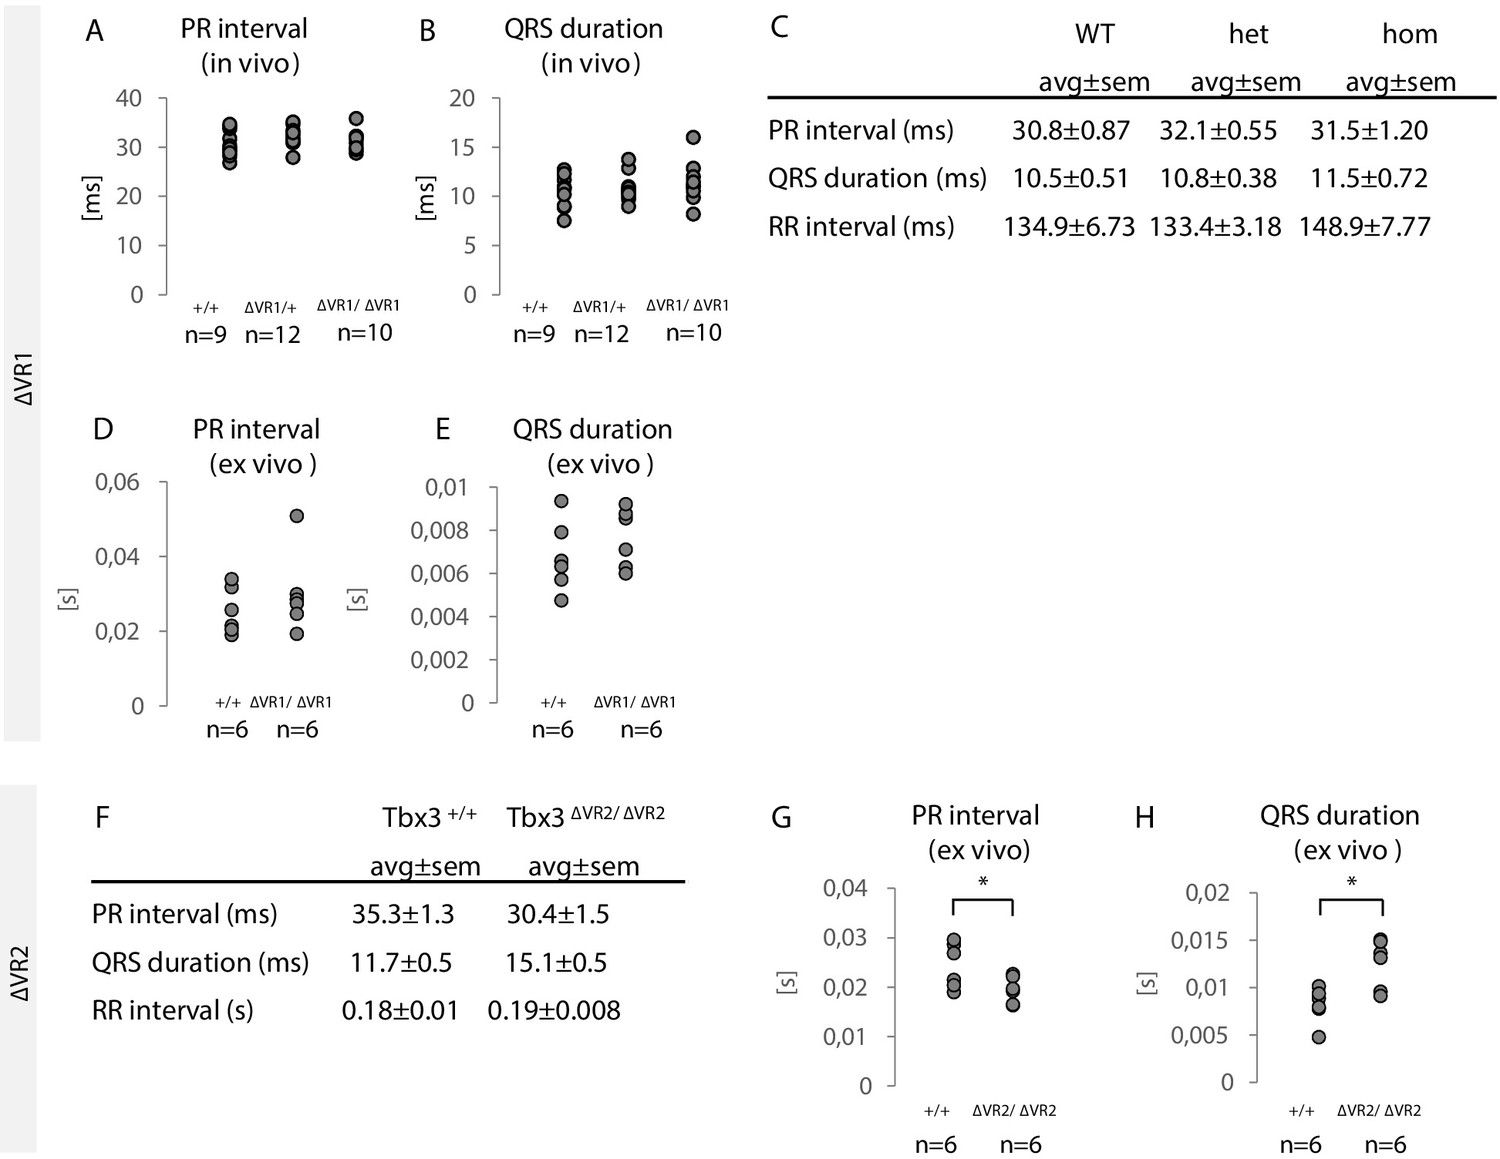
Characterization of Tbx3ΔVR1/ΔVR1 and Tbx3ΔVR2/ΔVR2 mice.
(A,B) PR interval and QRS duration in Tbx3+/+ (WT; n = 9), Tbx3ΔVR1/+ (het; n = 12) and Tbx3ΔVR1/ΔVR1 (hom; n = 10) mice measured by surface ECG. No significant difference between the different genotypes was observed. (C) Average values for PR interval, QRS duration and RR intervals for Tbx3+/+ (WT), Tbx3ΔVR1/+ (het) and Tbx3ΔVR1/ΔVR1 (hom) mice as measured by surface ECG. Values depict average ± standard error of the mean. (D,E) PR interval and QRS duration in Tbx3+/+ (WT; n = 6) and Tbx3ΔVR1/ΔVR1 (hom; n = 6) Langendorff perfused hearts (ex vivo ECG). No significant difference between genotypes was observed. (F) Average values for PR interval, QRS duration and RR intervals for Tbx3+/+ (WT) and Tbx3ΔVR2/ΔVR2 (hom) mice as measured by surface ECG. Values depict average ± standard error of the mean. (G,H) PR interval and QRS duration in Tbx3+/+ (WT; n = 6) and Tbx3ΔVR2/ΔVR2 (hom; n = 6) Langendorff perfused hearts (ex vivo ECG). No significant difference between genotypes was observed.
Tables
Key resources table
| Reagent type (species) or resource | Designation | Source or reference | Identifiers | Additional information |
|---|---|---|---|---|
| Cell line (Chlorocebus aethiops) | COS-7 | ATCC | RRID:CVCL_0224 | Fibroblast cell line |
| Cell line (Mus musculus) | HL-1 | William C. Claycomb (Claycomb et al., 1998) | RRID:CVCL_0303 | Cardiomyocyte cell line |
| Genetic reagent (Mus musculus) | Tbx3∆VR1/+; Tbx3∆VR1/∆VR1 | This paper | See Materials and methods, section ‘TALEN/CRISPR/Cas9-mediated genome editing of VR1 and VR2’ | |
| Genetic reagent (Mus musculus) | Tbx3∆VR2/+; Tbx3∆VR2/∆VR2 | This paper | See Materials and methods, section ‘TALEN/CRISPR/Cas9-mediated genome editing of VR1 and VR2’ | |
| Genetic reagent (Mus musculus) | Tbx459M16-GFP/+ | This paper | See Materials and methods, section ‘BAC modification and immunohistochemistry’ | |
| Recombinant DNA reagent | pSTARR-seq_human | Arnold et al., 2013 | Addgene; Plasmid #71509 | |
| Commercial assay or kit | Nextera DNA library prep kit | Illumina | FC-121–1030 | |
| Commercial assay or kit | NEBNext DNA Library Preparation Kit | New England Biolabs | NEB E6000S | |
| Commercial assay or kit | NEBNext Multiplex Oligos for Illumina | New England Biolabs | NEB E7335S | |
| Software, algorithm | EMERGE | van Duijvenboden et al., 2016 |
Additional files
-
Supplementary file 1
Supplementary Tables 1—11.
Supplementary Table 1. Transcription factor binding motif enrichment in genomic regions accessible in E14.5 atrioventricular junctions. Transcription factor binding motif enrichment in 67 genomic regions accessible in E14.5 atrioventricular junctions (AVJ) or E14.5 ventricles. Enrichment was compared to enrichment in a number of random control sequences. Enrichment is depicted as total number of regions with the motif and the percentage of the total number of tested regions. P-values depict statistical significance of enrichment. Supplementary Table 2. Transcription factor binding motif enrichment in active STARR-regions. Transcription factor binding motif enrichment in genomic regions within both mouse (A) and human (B) TBX3 locus that respond to Smad/Gata (SG4) or Tcf (Wnt) factors as demonstrated by STARR-seq. Enrichment of binding motifs for Smad/Gata- and Tcf-factors is depicted. Enrichment was compared to enrichment in a number of random control sequences. Enrichment is depicted as total number of regions with the motif and the percentage of the total number of tested regions. P-values depict statistical significance of enrichment. Supplementary Table 3. Murine RE candidates within VR1 and VR2. Murine RE candidates selected based on accessible chromatin in AV junction cardiomyocytes (ATAC_AVJ), EMERGE prediction, or mSTARR_SG4/Wnt activity. Overlap is depicted of candidate regions with ChIP-seq peaks from publicly available datasets for Gata4 (differentiated cardiomyocytes) (Luna-Zurita et al., 2016), Hand2 (E10.5 heart) (Laurent et al., 2017) and H3K27ac (E11.5 heart) (Nord et al., 2013). Supplementary Table 4. Human RE candidates within VR1 and VR2. Human RE candidates selected based on mouse RE homology (mm9 liftover), EMERGE prediction, or hSTARR_SG4/Wnt activity. Regions overlapping GWAS SNPs (SNP id, trait association and respective p-value are listed) were selected for further analysis. Supplementary Table 5. TALEN/CRISPR target sequences for deletion of VR1 and VR2 from the murine genome Supplementary Table 6. qPCR primer sequences Supplementary Table 7. Overview of BACs used for the generation of STARR-seq libraries Supplementary Table 8. Primer sequences for the amplification of active STARR-seq regions for validation by luciferase reporter assay Supplementary Table 9. Primer sequences for the amplification of RE candidate fragments Supplementary Table 10. Mouse functional genomic datasets included in merge as possible predictors Supplementary Table 11. Human functional genomic datasets included in merge as possible predictors.
- https://cdn.elifesciences.org/articles/56697/elife-56697-supp1-v1.docx
-
Transparent reporting form
- https://cdn.elifesciences.org/articles/56697/elife-56697-transrepform-v1.docx
Download links
A two-part list of links to download the article, or parts of the article, in various formats.
Downloads (link to download the article as PDF)
Open citations (links to open the citations from this article in various online reference manager services)
Cite this article (links to download the citations from this article in formats compatible with various reference manager tools)
Trait-associated noncoding variant regions affect TBX3 regulation and cardiac conduction
eLife 9:e56697.
https://doi.org/10.7554/eLife.56697


