Cadherins regulate nuclear topography and function of developing ocular motor circuitry
- Centre for Developmental Neurobiology, King’s College London, United Kingdom
- Department of Biology, Virginia Commonwealth University, United States
- School of Life Sciences, University of Sussex, United Kingdom
Figures
Figure 1 with 3 supplements

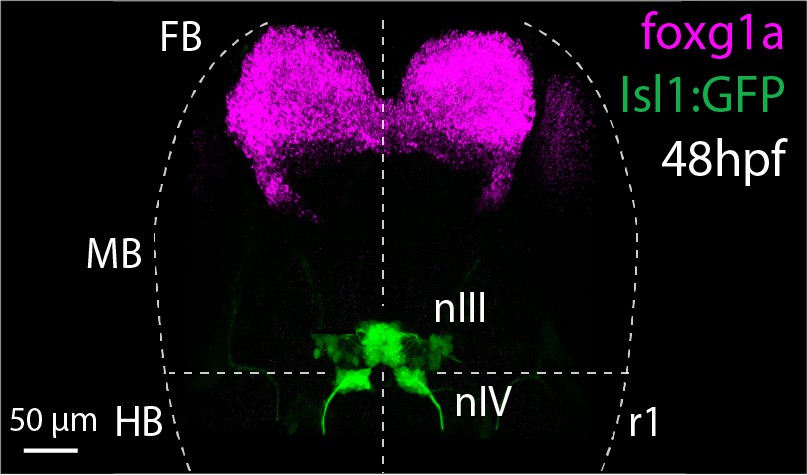
Differential expression of cadherin combinations in ocular motor neurons in Isl1:GFP zebrafish at 48 hpf.
(A) Dorsal view of cranial motor neurons (green) and cdh8 expression (magenta). Abbreviations: MB, midbrain; HB, hindbrain; r1-8, rhombomeres 1–8; nIII, oculomotor nucleus; nIV, trochlear nucleus; nVa, anterior trigeminal nucleus; nVp, posterior trigeminal nucleus; nVII, facial motor nucleus. Dotted lines indicate MHB, midline and outlines of the neural tube. (B–C) Combinatorial cadherin expression in nIII and nIV neurons. Font sizes indicate varying expression levels according to the median value of mean fluorescence intensities (in arbitrary units, a.u.) displayed in (D): small (500–1500 a.u.), regular (1500–2500 a.u.), large (2500–3500 a.u.) and large and bold font size (3500+ a.u.). Mean intensities below 500 a.u are omitted. Views represent flattened dorsal and transverse projections. IR, inferior rectus; MR, medial rectus; SR, superior rectus; IO, inferior oblique. See also Figure 1—figure supplements 1 and 3. (D–K) Expression of type I cadherins cdh2 and cdh4 and type II cadherins cdh8 and cdh10a (magenta) in ocular motor neurons (green). White and blue arrows indicate high and low expression, outlines indicate location of nIII and nIV. All images are snapshots of 3D Imaris visualisations of entire z-stacks. Scale bars = 20 μm. (D–G) Dorsal views of ocular motor neurons and cadherin expression in surrounding tissue and masked by GFP-positive area. (H–K) Transverse views of ocular motor neurons and masked cadherin expression by GFP-positive area. (L) Corrected mean fluorescence intensities of cadherin expression in nIII and nIV neurons in a.u., detected using RNAscope in situ hybridisation. Data represents median and interquartile range, n = 5 measurements from n = 3 embryos, from three different clutches.
Figure 1—figure supplement 1

Differential expression of cadherins in ocular motor neurons in Isl1:GFP at 48 hpf.
(A, E) Dorsal views of ocular motor neurons (green) and detection of mRNA expression (magenta) of negative control dapB. (B–D, F–H) Expression of type II cadherins cdh7a and cdh11 and atypical cadherin cdh13 (magenta) in ocular motor neurons (green). Dorsal views show cadherin expression in surrounding tissue and masked by GFP-positive area. Outlines indicate locations of nIII and nIV. White and blue arrows indicate high and low expression, respectively. All images represent snapshots of 3D Imaris visualisations of entire z-stacks. Scale bars (A, C–E) = 20 μm. (B–D) Dorsal views of ocular motor neurons and cadherin expression in surrounding tissue and masked by GFP-positive area. (F–H) Transverse views of ocular motor neurons and masked cadherin expression by GFP-positive area.
Figure 1—figure supplement 2
Detection of foxg1a mRNA expression at 48 hpf.
Dorsal view of ocular motor neurons (green) in Tg(Isl1:GFP) embryo at 48 hpf and foxg1a mRNA expression (magenta, positive control). Image represents a snapshot of 3D Imaris visualisation of entire z-stack.
Figure 1—figure supplement 3
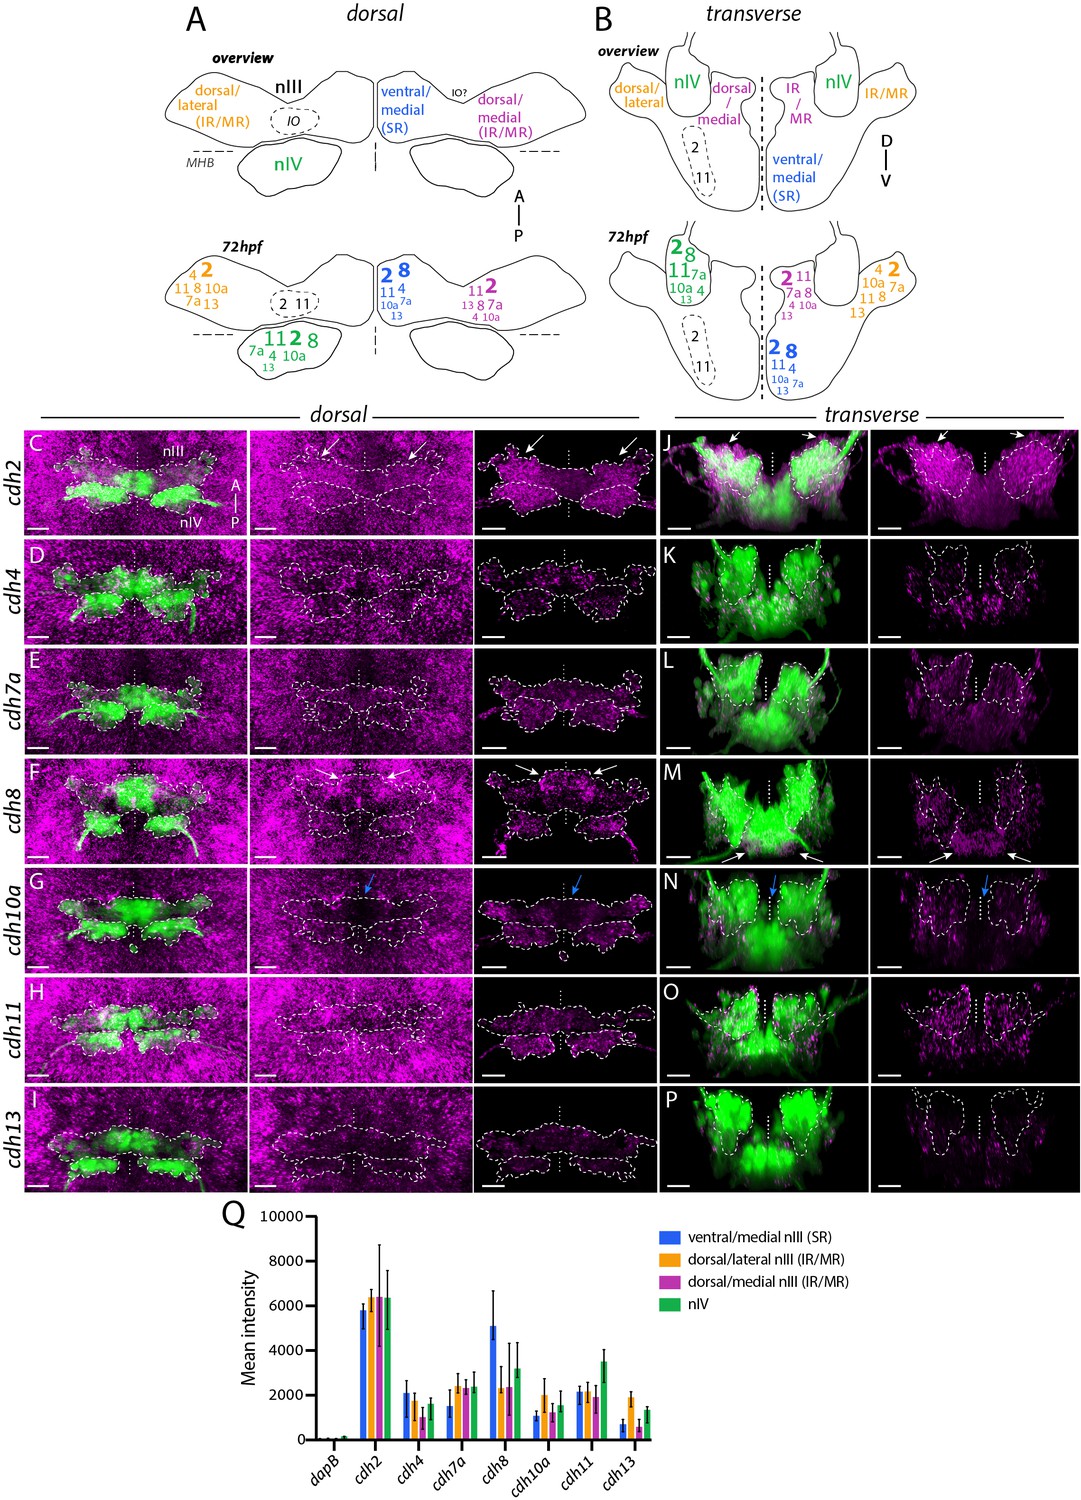
Differential expression of cadherin combinations in ocular motor neurons in Isl1:GFP at 72 hpf.
(A–B) Summary schematics of combinatorial cadherin expression in nIII and nIV neurons based on anatomical location. Font sizes indicate varying expression levels according to the median value of mean fluorescence intensities (in arbitrary units, a.u.) displayed in (D): small (500–1500 a.u.), regular (1500–2500 a.u.), large (2500–3500 a.u.) and large and bold font size (3500+ a.u.). Mean intensities below 500 a.u are omitted. Views represent flattened dorsal and transverse projections. IR, inferior rectus; MR, medial rectus; SR, superior rectus; IO, inferior oblique. (C–P) Expression of type I cadherins cdh2 and cdh4, type II cadherins cdh7a, cdh8, cdh10a and cdh11 and atypical cadherin cdh13 (magenta) in ocular motor neurons (green) and surrounding tissue. Outlines indicate locations of nIII and nIV. White and blue arrows indicate high and low expression, respectively. All images represent snapshots of 3D Imaris visualisations of entire z-stacks. Scale bars = 20 μm. (C–I) Dorsal views of ocular motor neurons and cadherin expression in surrounding tissue and masked by GFP-positive area. (J–P) Transverse views of ocular motor neurons and masked cadherin expression by GFP-positive area. (Q) Corrected mean fluorescence intensities of cadherin expression in nIII and nIV neurons in a.u., detected using RNAscope in situ hybridisation. Data represents median and interquartile range, n = 5 measurements from n = 3 embryos, from three different clutches.
-
Figure 1—figure supplement 3—source data 1
- https://cdn.elifesciences.org/articles/56725/elife-56725-fig1-figsupp3-data1-v2.xlsx
Figure 2 with 1 supplement
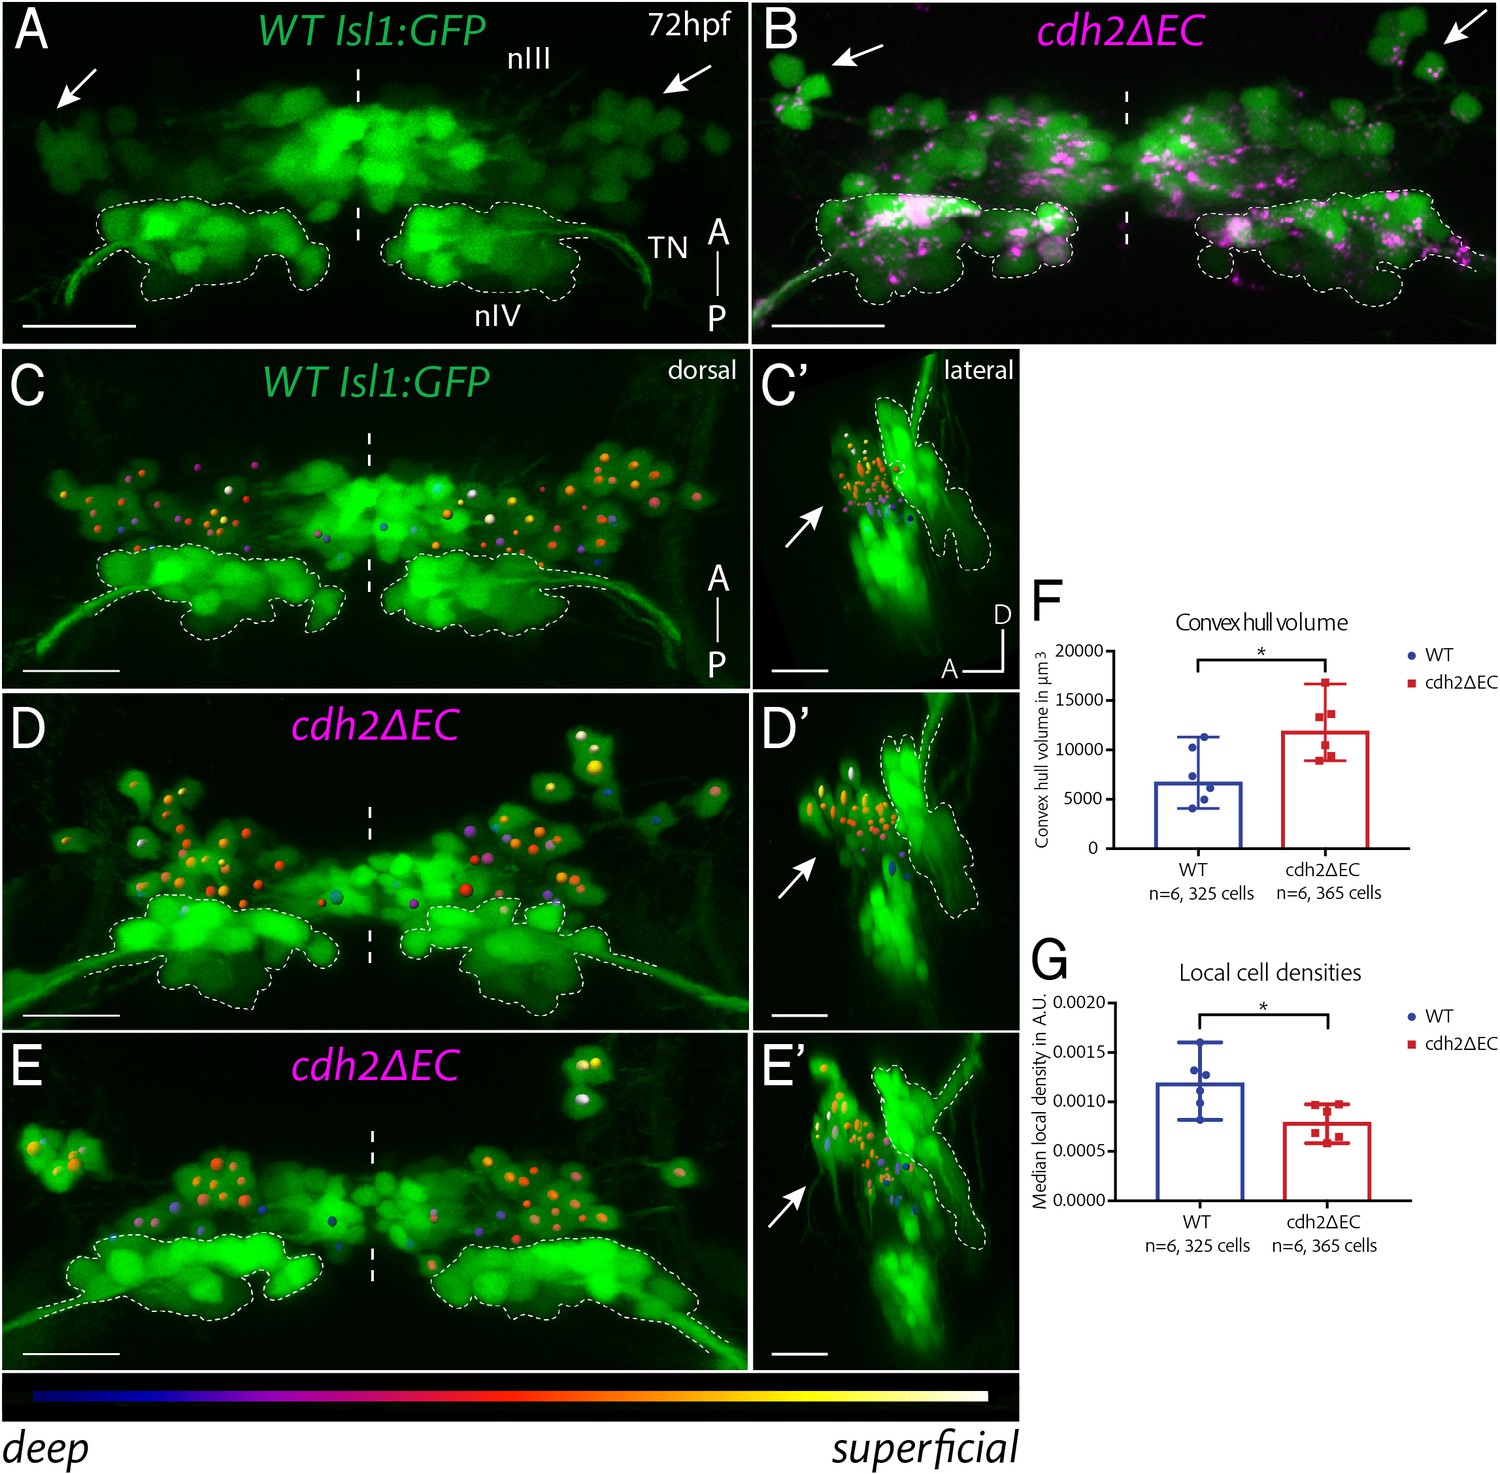
Expression of cdh2ΔEC in zebrafish ocular motor neurons causes scattering of dorsal oculomotor neurons.
(A–B) Dorsal maximum intensity projections of nIII and nIV (green) in wild-type (A) Isl1:GFP and cdh2ΔEC larvae (B) at 72 hpf. Arrows point to dorsal neurons which lie in lateral regions of nIII. TN, trochlear nerve. Scale bars = 20 μm. See also Figure 2—figure supplement 1. (C–E’) Oculomotor coordinates in dorsal half of nIII shown in dorsal and lateral views of wild-type Isl1:GFP and cdh2ΔEC larvae at 72 hpf, colour coded according to z-level. Arrows point to dorsal nIII neurons which are mispositioned in cdh2ΔEC fish. All images are snapshots of 3D Imaris visualisations of entire z-stacks. Outlines indicate location of nIV. Scale bars = 20 μm. (F) Convex hull volumes of dorsal cell coordinates in μ3. Data represents median and range, n = 6 larvae from two clutches for each genotype, *p=0.0411, two-tailed Mann-Whitney U. (G) Local cell densities derived from dorsal cell coordinates in arbitrary units. Data represents median and range, n = 6 larvae from two clutches for each genotype, *p=0.0152. There was no significant difference in the number of cells measured per side (medians of 28.25 for wild types and 29.75 for cdh2ΔEC; n = 6 larvae per genotype, p=0.3074). Both tests are two-tailed Mann-Whitney U.
Figure 2—figure supplement 1
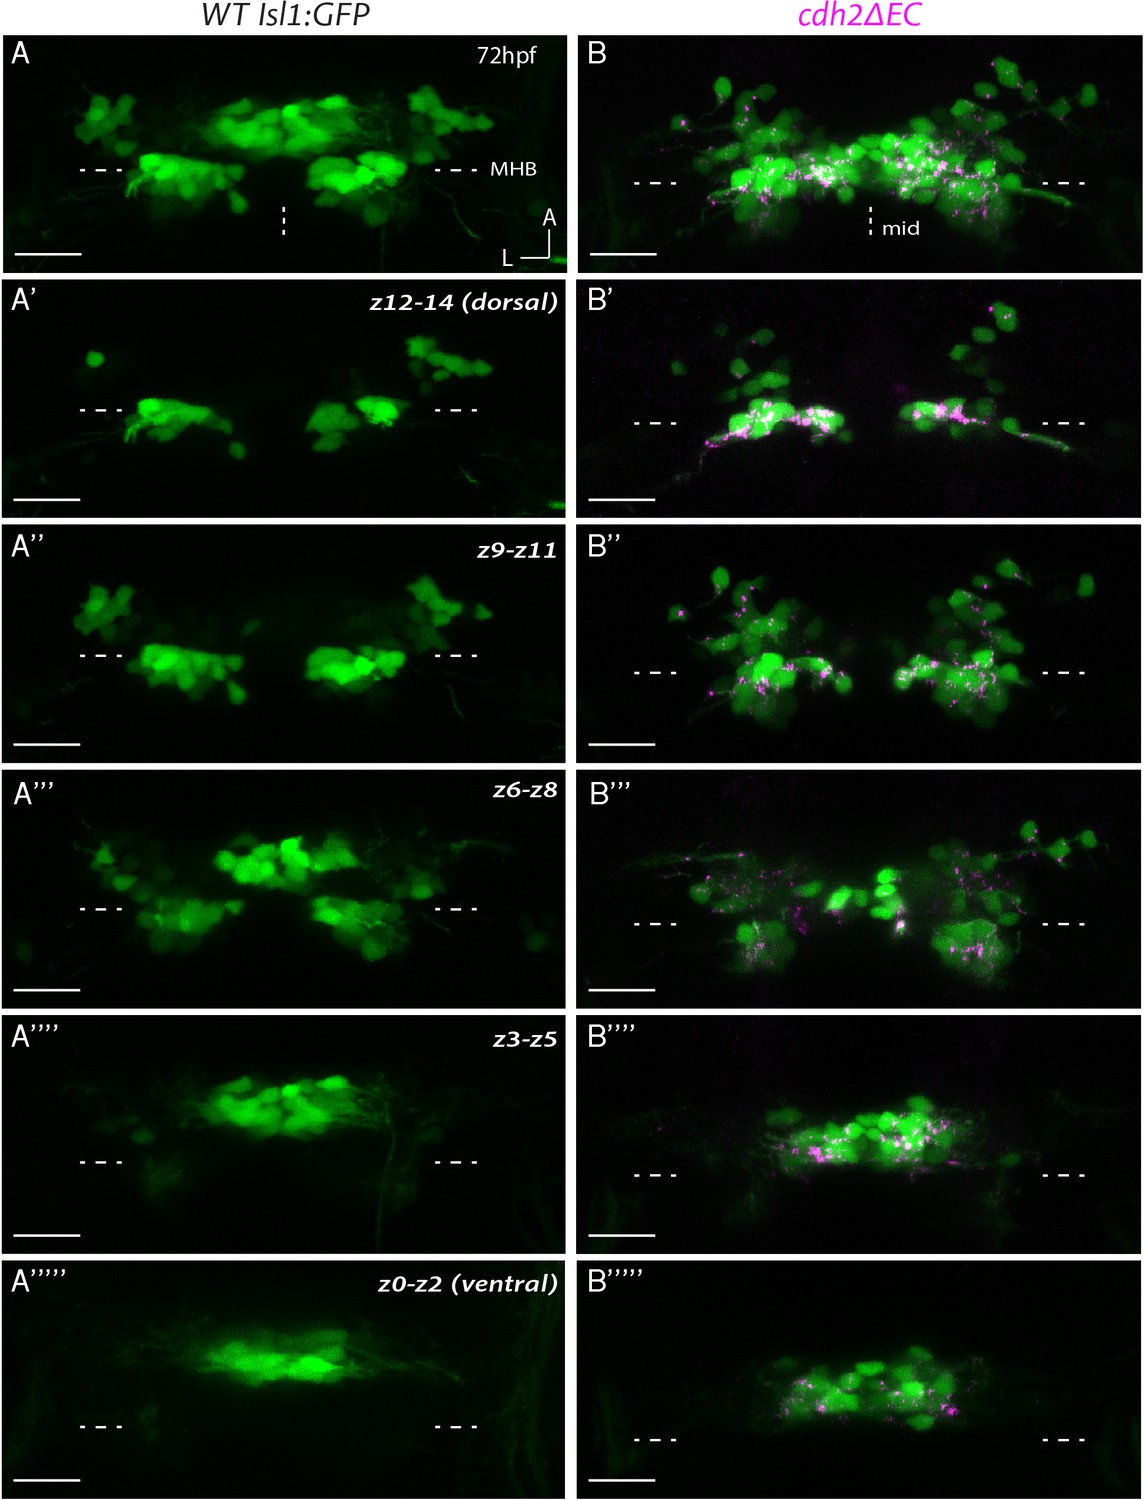
Ocular motor nuclei of cdh2ΔEC larvae retain key characteristics of dorsoventral organisation but appear disorganised compared to wild types.
(A, B) Dorsal views of the entire z-stack for representative wild-type Isl1:GFP and cdh2ΔEC larvae at 72 hpf. Example embryo in (B) is the same as shown in Figure 2D. (A’-A’’’’’; B’–B’’’’’) Sub-stack projections of three combined dorsoventral (DV) subdivisions (z0–z14) moving from dorsal to ventral for wild-type Isl1:GFP (A–A’’’’’) and cdh2ΔEC (B–B’’’’’) larvae. All images are maximum intensity projections of confocal z-stacks. nIII: rostral to MHB; nIV: caudal to MHB. Arrows indicate differences in clustering of dorsal neurons and less organised ventral population in the case of cdh2ΔEC larvae. MHB: midbrain-hindbrain boundary, mid: midline. Scale bars = 20 μm.
Figure 3
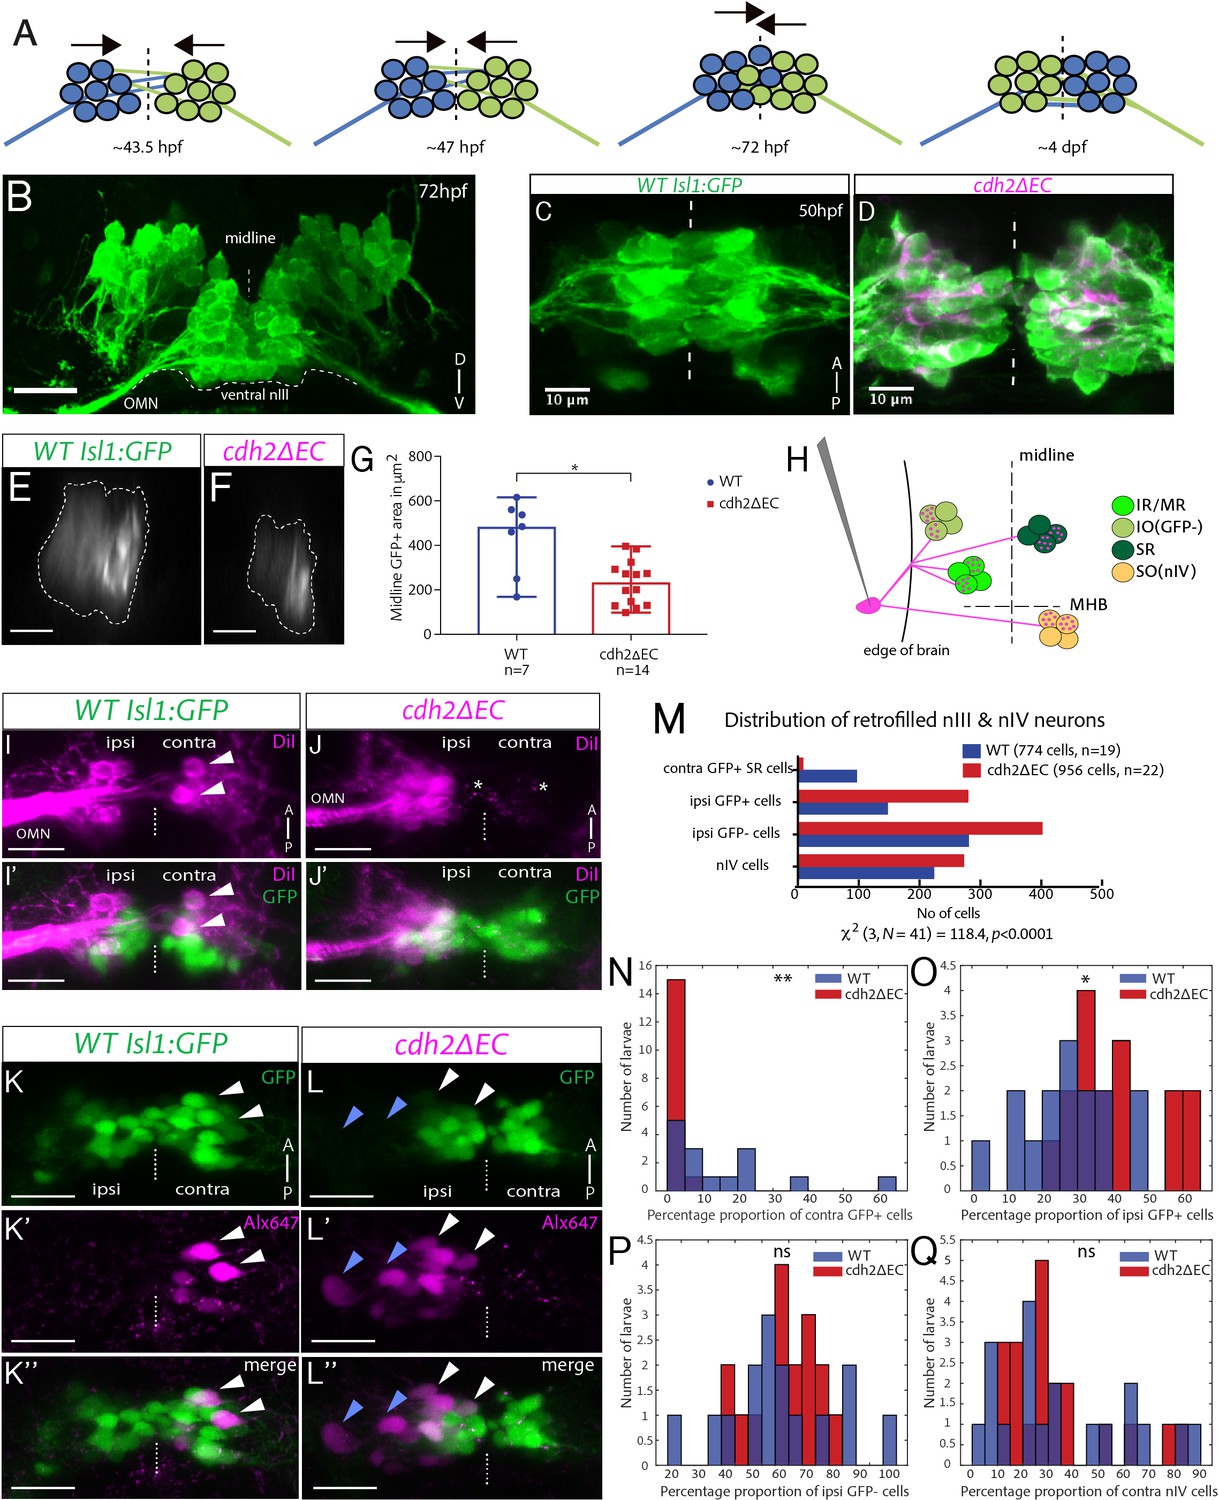
Contralateral migration of ventral SR neurons is abolished in cdh2ΔEC fish.
(A) Dorsal view schematic of contralateral migration phases. Dotted lines and arrows indicate the midline and direction of migration, lines represent leading processes. (B) Transverse view projection of an Isl1:GFP embryo immunostained against GFP. TN, trochlear nerve. Scale bars = 20 μm. (C–D) Dorsal view maximum intensity projections of ventral half of wild-type Isl1:GFP and cdh2ΔEC embryos immunostained against GFP and RFP at 50 hpf. Dotted lines represent the midline. (E–F) Single sagittal confocal sections of nIII GFP fluorescence at the midline in wild-type and cdh2ΔEC fish. Scale bars = 20 μm. (G) Area of GFP fluorescence measured in sagittal sections of nIII. Error bars represent median and range, n = 7 (wild-type) from two clutches and n = 14 from two clutches (cdh2ΔEC), *p=0.0125. There was no difference in the number of nIII cells (medians for wild types (n = 4)=95 and cdh2ΔEC (n = 9)=103, p=0.414). Both tests are two-tailed Mann-Whitney U. (H) Labelling of ocular motor subnuclei by retro-orbital dye fill. MHB, midbrain-hindbrain boundary. (I–J’) Ventral view maximum intensity projections of DiI-filled ventral nIII neurons in Isl1:GFP and cdh2ΔEC larvae at 5 dpf. Scale bars = 20 μm. White arrows indicate neurons which have crossed to the contralateral side, asterisks represent mCherry+ signal. (K–L’’) Dorsal view maximum intensity projections of sparsely labelled neurons located in ventral nIII in Isl1:GFP and cdh2ΔEC larvae at 5 dpf. White and blue arrows indicate GFP-positive and GFP-negative dye-filled neurons. The left eye is the side of dye fill. Alx647 = AlexaFluor 647 dye. Scale bars = 20 μm. Note that in K-K’’, small magenta puncta represent non-specific dye spread, while in K-K’’ these likely also include punctate mCherry signal from cdh2ΔEC expression, due to spectral overlap. (M) Total observed number of pooled dye-filled cells belonging to each category in wild types and cdh2ΔEC at 5 dpf. There is a significant relationship between genotype and distribution of dye-filled neurons, (p<0.0001; chi squared test). There was no significant effect of genotype on the total number of dye-filled neurons across groups per larva, medians for wild types = 31, cdh2ΔEC = 40.5, p=0.674, 2-tailed Mann-Whitney U. Wild-type larvae are from four clutches and cdh2ΔEC larvae are from five clutches. (N–Q) Percentage proportions of dye-filled neurons per larva for each genotype separated by category. All tests are two-tailed Mann-Whitney U. (N) Percentage proportions of contralateral GFP-positive SR cells. n = 15 larvae (wild-type) and n = 16 (cdh2ΔEC) larvae, **p=0.0015. (O) Percentage proportions of ipsilateral GFP+ cells. n = 15 larvae (wild-type) and n = 16 (cdh2ΔEC) larvae, *p=0.0109. (P) Percentage proportions of ipsilateral GFP negative IO cells. n = 15 larvae (wild-type) and n = 16 (cdh2ΔEC) larvae, p=0.5131. (Q) Percentage proportions of contralateral nIV cells. n = 19 larvae (wild-type) and n = 20 (cdh2ΔEC) larvae, p=0.9391. (N–P) Proportions are relative to the total number of nIII cells filled per larva, for (Q) proportions are relative to combined total of dye-filled nIII and nIV neurons. Larvae in which less than 10 nIII cells were filled in total were excluded from analysis in (N–P), whereas larvae in which less than 10 combined nIII and nIV cells were filled in total were excluded from analysis in (Q).
Figure 4
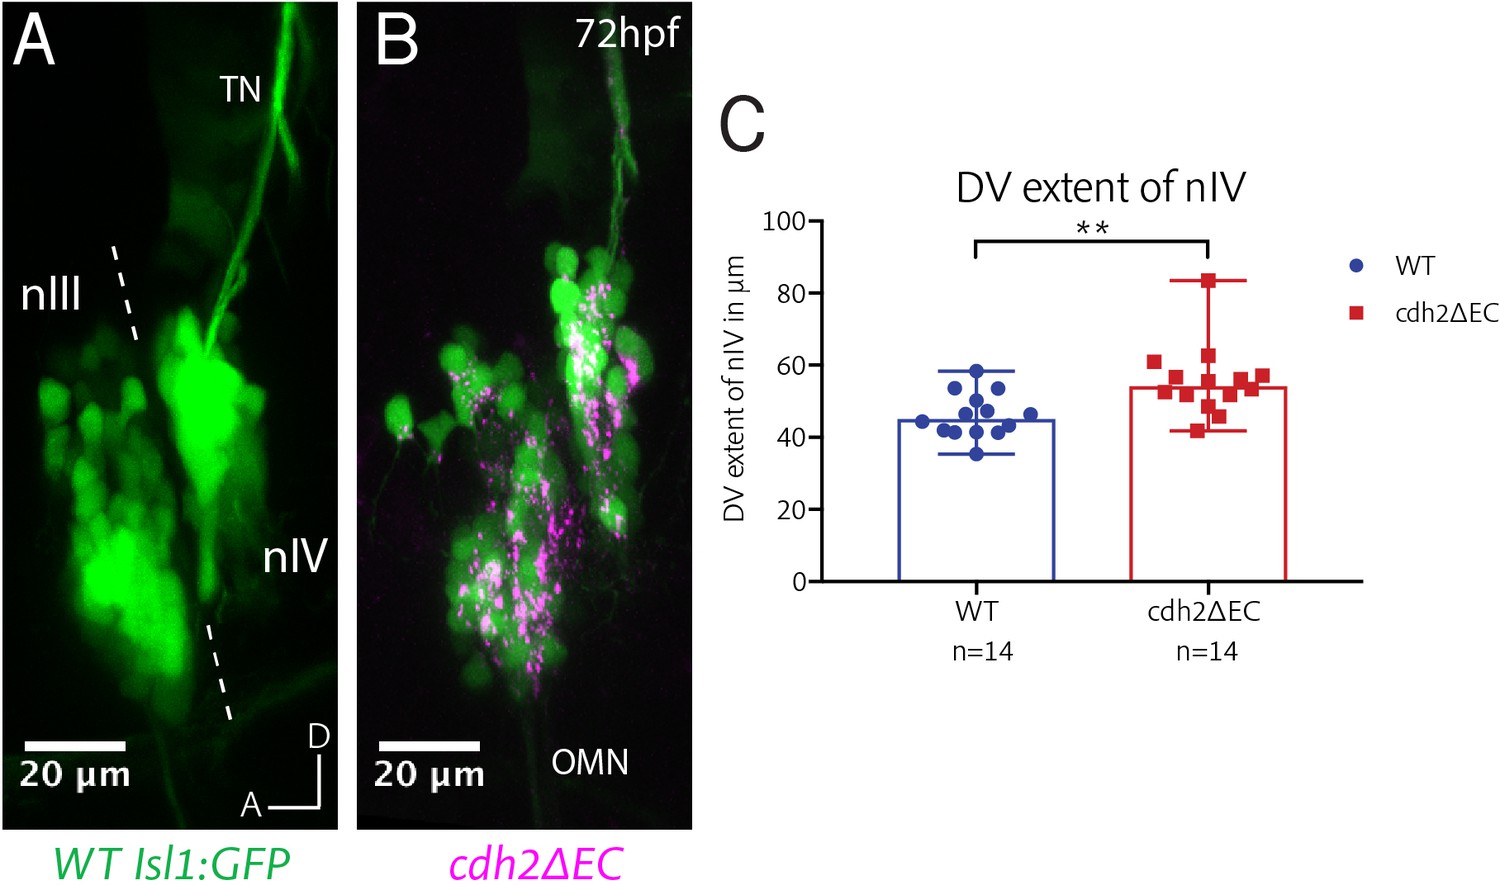
cdh2ΔEC expression results in mispositioning of zebrafish trochlear neurons along the dorsoventral axis.
(A–B) Lateral view maximum intensity projections of nIII and nIV of wild-type Isl1:GFP and cdh2ΔEC larvae at 72 hpf. Dotted lines represent the midbrain-hindbrain boundary. OMN, oculomotor nerve; TN, trochlear nerve. (C) Measurements of dorsoventral extent of nIV at 72 hpf. Dots represent individual larvae. Error bars represent median and range. n = 14 larvae from two clutches for each genotype, **p=0.0042, two-tailed Mann-Whitney U. Larvae were mounted laterally to align both eyes prior to imaging. Where necessary, images were resampled to align bilateral ocular motor nuclei to the same plane and oriented so that the edge of the neuropil was directly parallel to the anterior-posterior axis.
Figure 5
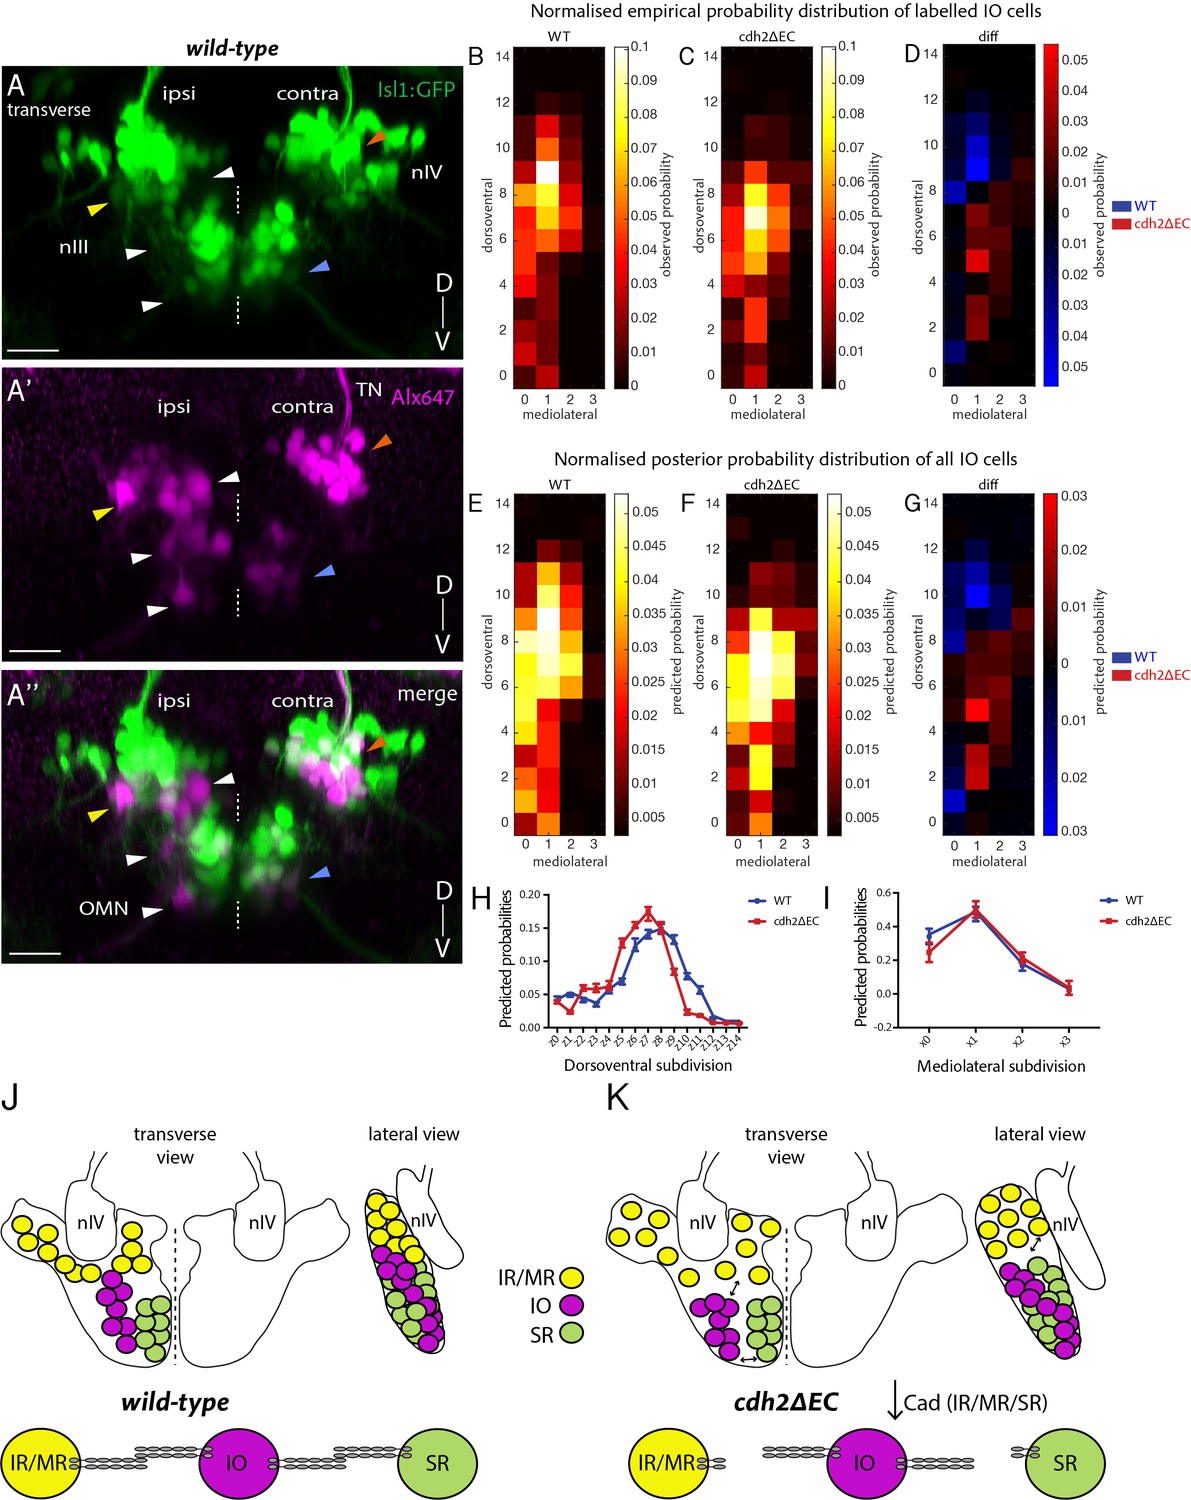
Non-cdh2ΔEC expressing zebrafish inferior oblique neurons are mispositioned following perturbation of cadherin function in neighbouring oculomotor subnuclei.
(A–A’’) Transverse maximum intensity projection of a wild-type Isl1:GFP larva at 5 dpf in which nIII and nIV neurons have been labelled using retro-orbital dye fills with Alexa647 dextrans. Ipsi denotes side of dye fill. White and yellow arrows indicate ipsilateral GFP-negative IO neurons and ipsilateral GFP-positive neurons (IR/MR). Blue and orange arrows indicate contralateral GFP-positive SR neurons and SO (nIV) neurons. OMN, oculomotor nerve; TN, trochlear nerve. Scale bars = 20 μm. (B–C) Normalised empirical and posterior (E–F) probability distribution of IO neuron spatial locations in wild types (278 cells, n = 19 larvae, four clutches) and cdh2ΔEC (399 cells, n = 22 larvae, five clutches) according to dorsoventral (DV; from z0 (ventral) to z14 (dorsal)) and mediolateral (ML; from x0 (medial) to x3 (lateral)) subdivisions. (D) Normalised empirical and posterior (G) differential probability distribution of IO neuron spatial locations between genotypes. diff = cdh2ΔEC distribution – wild-type distribution. There are differences in the overall spatial distribution between genotypes (KLmean = 0.3114, 95% CI [0.3107 0.3122]). (H–I) Median posterior probabilities of IO cell location within DV (H) and ML (I) subdivisions for wild types and cdh2ΔEC larvae. There is a difference in DV (z-shift = 0.5201, 95% CI [0.5168 0.5234]) and ML distribution (x-shift = −0.1423, 95% CI [−0.1431–0.1414]) between genotypes. (J–K) Diagrammatic representation of transverse and lateral views of IO ocular motor neuron location in wild types and cdh2ΔEC. Perturbation of cadherin binding between cdh2ΔEC-expressing IR/MR and SR subnuclei and wild-type IO neurons leads to a ventral and lateral shift in IO neuron location.
Figure 6 with 1 supplement
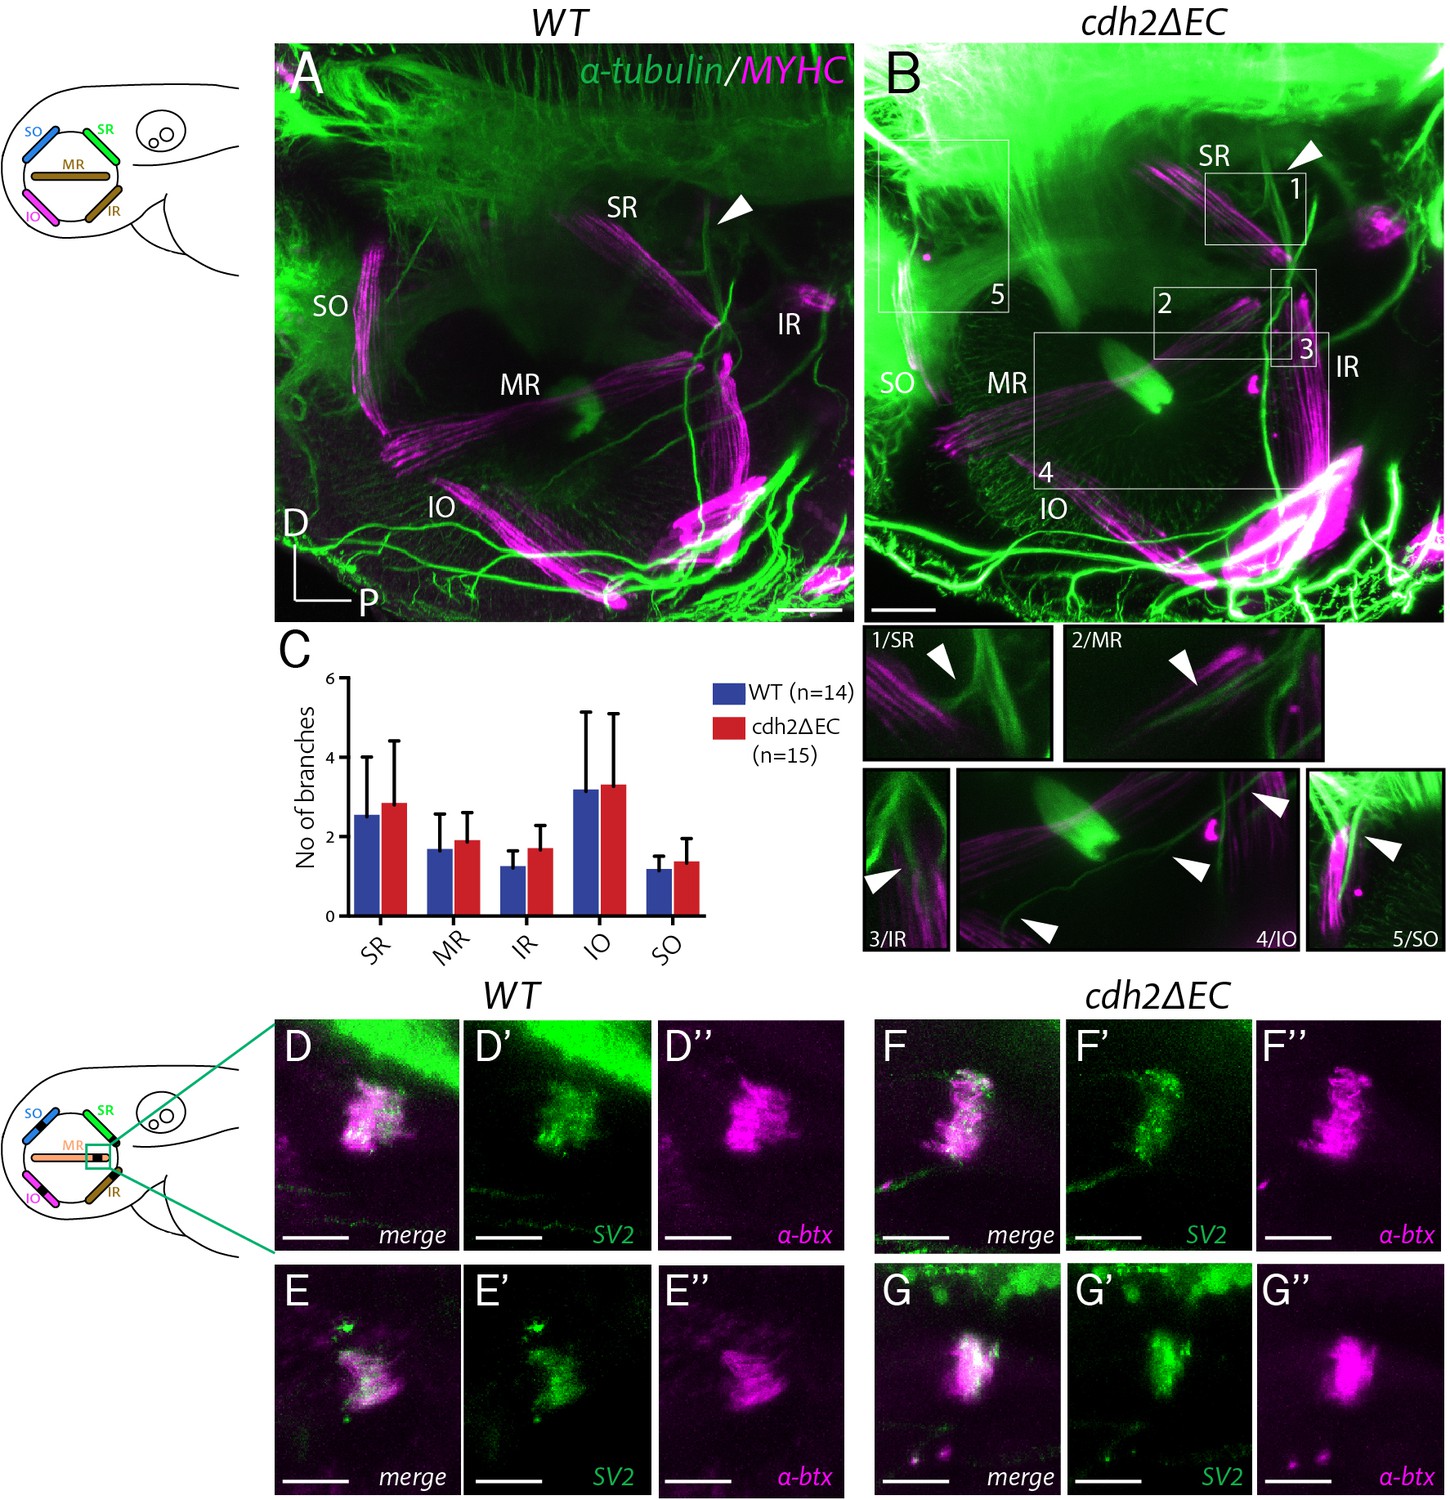
Extraocular muscle innervation and neuromuscular junction formation is unperturbed in cdh2ΔEC larvae.
(A–B) Immunostained axon projections of oculomotor and trochlear nerves (α-tubulin) innervating extraocular muscles (myosin heavy chain) at 72 hpf in wild types and cdh2ΔEC-mCherry. Images are lateral view maximum intensity projections, white arrow indicates the point at which the oculomotor nerve enters the orbit. Boxes show high magnification view of individual branches. Scale bars = 40 μm. (C) Quantification of branch number per genotype for each nerve/branch. There was no significant difference in branch number for any muscle target (ns; SR, p=0.9406; MR, p=0.9451; IR, p=0.8512; IO, p=0.9451; SO, p=0.94512; multiple t-tests, and Holm-Sidak test). Error bars are mean and SD. Both wild-type and cdh2ΔEC larvae are from three clutches. (D–G’’) Immunostained NMJs composed of presynaptic vesicles (SV2) and acetylcholine receptors (α-bungarotoxin) in wild types (D–E’’) and cdh2ΔEC (F–G’’) at 4 dpf at the medial rectus (MR) muscle. Scale bars = 20 μm. All images are maximum intensity projections of sub-stacks taken from larger z-stacks. See also Figure 6—figure supplement 1.
Figure 6—figure supplement 1
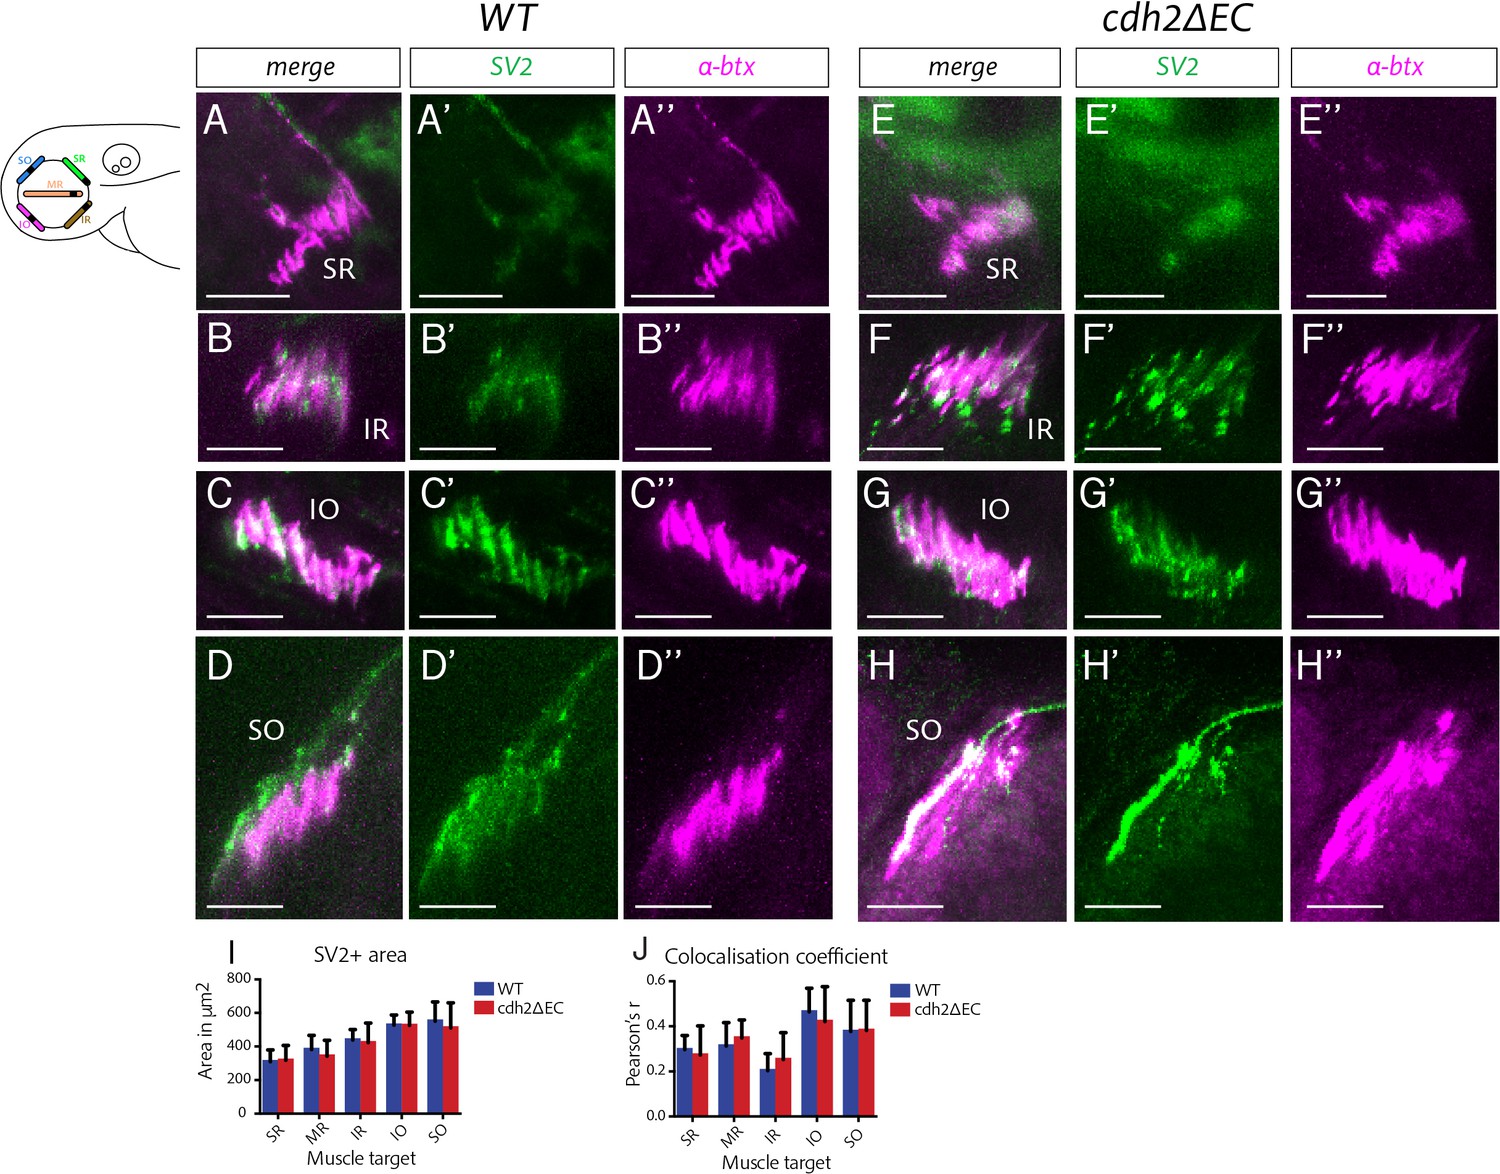
Perturbation of cadherin function does not disrupt zebrafish extraocular neuromuscular junction formation.
(A–H’’) Immunostained NMJs composed of presynaptic vesicles (SV2) and acetylcholine receptors (α-bungarotoxin) in wild-type (A–D’’) and cdh2ΔEC (E–H’’) larvae at superior rectus (SR), inferior rectus (IR), inferior oblique (IO) and superior oblique (SO) extraocular muscles at 4 dpf. Scale bars = 20 μm. All images are maximum intensity projections of sub-stacks taken from larger z-stacks. (I) Area of SV2+ signal and colocalisation coefficient of SV2 and α-bungarotoxin (J) of NMJs of each individual extraocular muscle. There was no significant difference in the area of SV2 (SR, p=0.9880; MR, p=0.9391; IR, p=0.9880; IO, p=0.9880; SO, p=0.9751; multiple t-tests, and Holm-Sidak test) or colocalisation of SV2 (SR, p=0.9288; MR, p=0.9288; IR, p=0.9212; IO, p=0.9288; SO, p=0.9534) and α-bungarotoxin for any muscle between wild types (n = 7 for MR, IO, SO; n = 6 for SR and IR; from two clutches) and isl1:cdh2ΔEC-mCherry (n = 7 for SR, MR, IR, IO; n = 6 for SO; from two clutches). Error bars are mean and SD.
-
Figure 6—figure supplement 1—source data 1
- https://cdn.elifesciences.org/articles/56725/elife-56725-fig6-figsupp1-data1-v2.xlsx
Figure 7
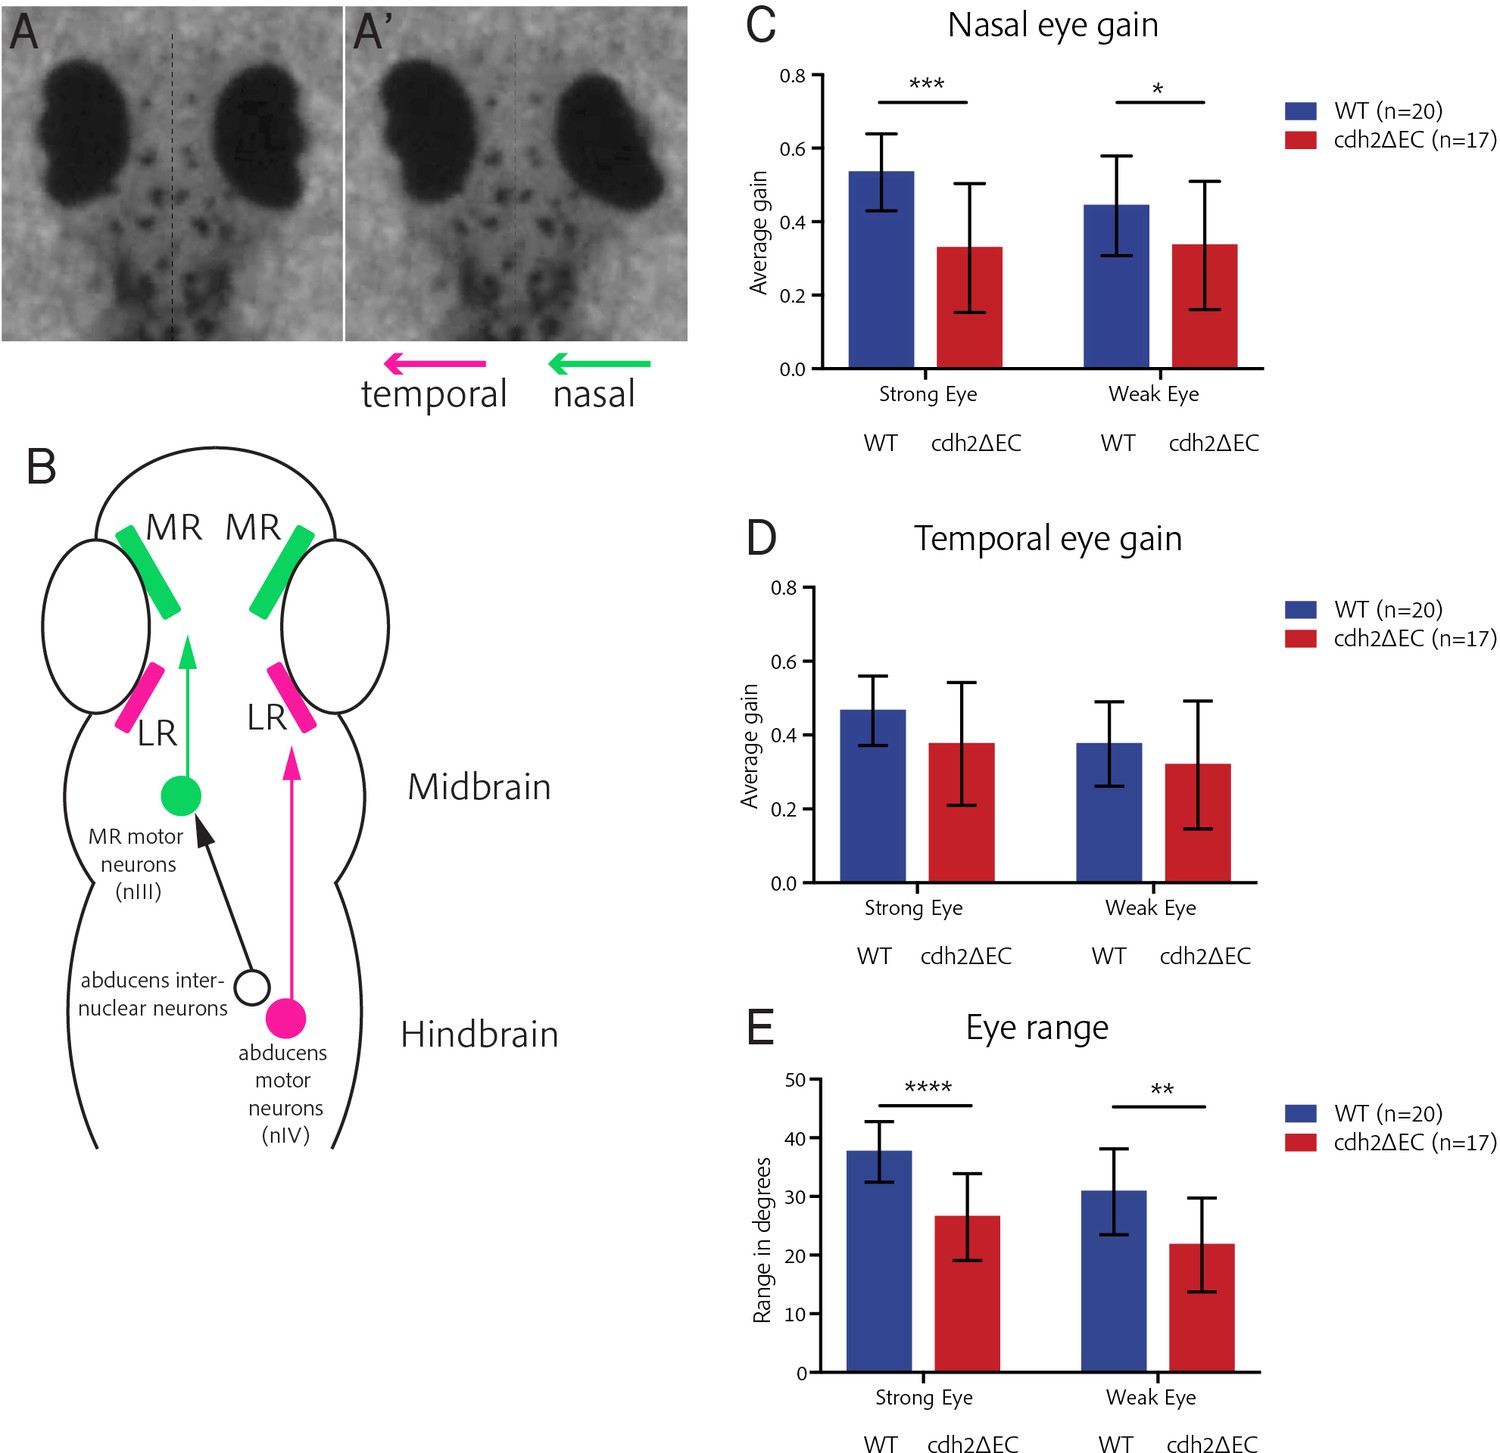
cdh2ΔEC larvae display impaired efficiency of nasal eye movements and defects in eye range.
(A–A’) Example OKR video still illustrating coordinated nasal (right eye) and temporal (left eye) eye movements. (B) Ocular motor circuitry of underlying the OKR of larval zebrafish. Nasal and temporal eye movements are driven by medial and lateral rectus-innervating motor neurons of distinct nuclei. (C–D) Average nasal (C) and temporal (D) eye gain of wild types and cdh2ΔEC larvae averaged for all trials. There is a significant difference in nasal eye gain for the strong (p=0.0003) and weak eye (p=0.0472). There was no significant difference in temporal eye gain for the strong (p=0.0597) or weak eye (p=0.2574). (E) Total eye range for strong and weak eyes for each genotype. There was a significant difference for the strong (p<0.0001) and weak eye (p=0.0011). (C–E) All tests are t-test with Welch’s corrections. Error bars are mean and SD. Both wild type and cdh2ΔEC larvae are from two clutches.
Videos
Video 1
Expression of cdh8 (magenta) in ocular motor neurons (green) in Tg(Isl1:GFP) embryo at 48 hpf in confocal z-stack.
Video displays z-stack moving from most ventral to dorsal and reveals high ventral expression.
Video 2
Expression of cdh7a (magenta) in ocular motor neurons (green) in Tg(Isl1:GFP) embryo at 48 hpf in confocal z-stack.
Video displays z-stack moving from most ventral to dorsal and reveals low ventral expression.
Tables
Key resources table
| Reagent type (species) or resource | Designation | Source or reference | Identifiers | Additional information |
|---|---|---|---|---|
| Genetic reagent (Danio rerio) | Tg(Isl1:GFP) | Higashijima et al., 2000 | RRID:ZFIN_ZDB-GENO-070810-2 | |
| Genetic reagent (Danio rerio) | Tg(isl1:cdh2ΔEC-mCherry)vc25/Tg(Isl1:GFP) | Rebman et al., 2016 | ||
| Antibody | anti-GFP (chicken polyclonal) | Abcam | RRID:AB_300798 | 1:500 dilution |
| Antibody | anti-RFP (rabbit polyclonal) | MBL Life Science | RRID:AB_591279 | 1:200 dilution |
| Antibody | Anti-acetylated tubulin (rabbit monoclonal) | Cell Signalling Technologies | RRID:AB_10544694 | 1:1000 dilution |
| Antibody | Anti-myosin heavy chain (mouse monoclonal) | Developmental Studies Hybridoma Bank (DSHB), University of Iowa | RRID:AB_528356 | 1:200 dilution |
| Antibody | Anti-SV2A (mouse monoclonal) | Developmental Studies Hybridoma Bank (DSHB), University of Iowa | RRID:AB_2315387 | 1:200 dilution |
| Chemical compound, drug | Tetramethylrhodamine-α-bungarotoxin conjugate | Invitrogen | RRID:AB_2313931 | 1:1000 dilution |
| Commercial assay, kit | RNAscope Fluorescent Multiplex Reagent kit | ACD Bio | Cat# 320850 | |
| Software, algorithm | FIJI/Image J | https://github.com/fiji/fiji | RRID:SCR_002285 | |
| Software, algorithm | Imaris 9 | Bitplane | RRID:SCR_007370 | |
| Software, algorithm | MATLAB | Mathworks | RRID:SCR_001622 | |
| Software, algorithm | JAGS | https://cran.r-project.org/web/packages/rjags/index.html | RRID:SCR_017573 | |
| Software, algorithm | LabView | National Instruments | RRID:SCR_014325 | |
| Software, algorithm | Prism7 | GraphPad | RRID:SCR_002798 |
Additional files
Download links
A two-part list of links to download the article, or parts of the article, in various formats.
Downloads (link to download the article as PDF)
Open citations (links to open the citations from this article in various online reference manager services)
Cite this article (links to download the citations from this article in formats compatible with various reference manager tools)
Cadherins regulate nuclear topography and function of developing ocular motor circuitry
eLife 9:e56725.
https://doi.org/10.7554/eLife.56725


