Diverse homeostatic and immunomodulatory roles of immune cells in the developing mouse lung at single cell resolution
- Division of Critical Care Medicine, Department of Pediatrics, Stanford University School of Medicine, United States
- Center for Excellence in Pulmonary Biology, Stanford University School of Medicine, United States
- Department of Bioengineering, Stanford University, United States
- Prince of Wales Clinical School, Lowy Cancer Research Centre, University of New South Wales, Australia
- Division of Pulmonary, Asthma and Sleep Medicine, Department of Pediatrics, Stanford University School of Medicine, United States
- Department of Chemical and Systems Biology, Stanford University, United States
- Chan Zuckerberg Biohub, United States
- Department of Applied Physics, Stanford University, United States
Figures
Figure 1 with 2 supplements
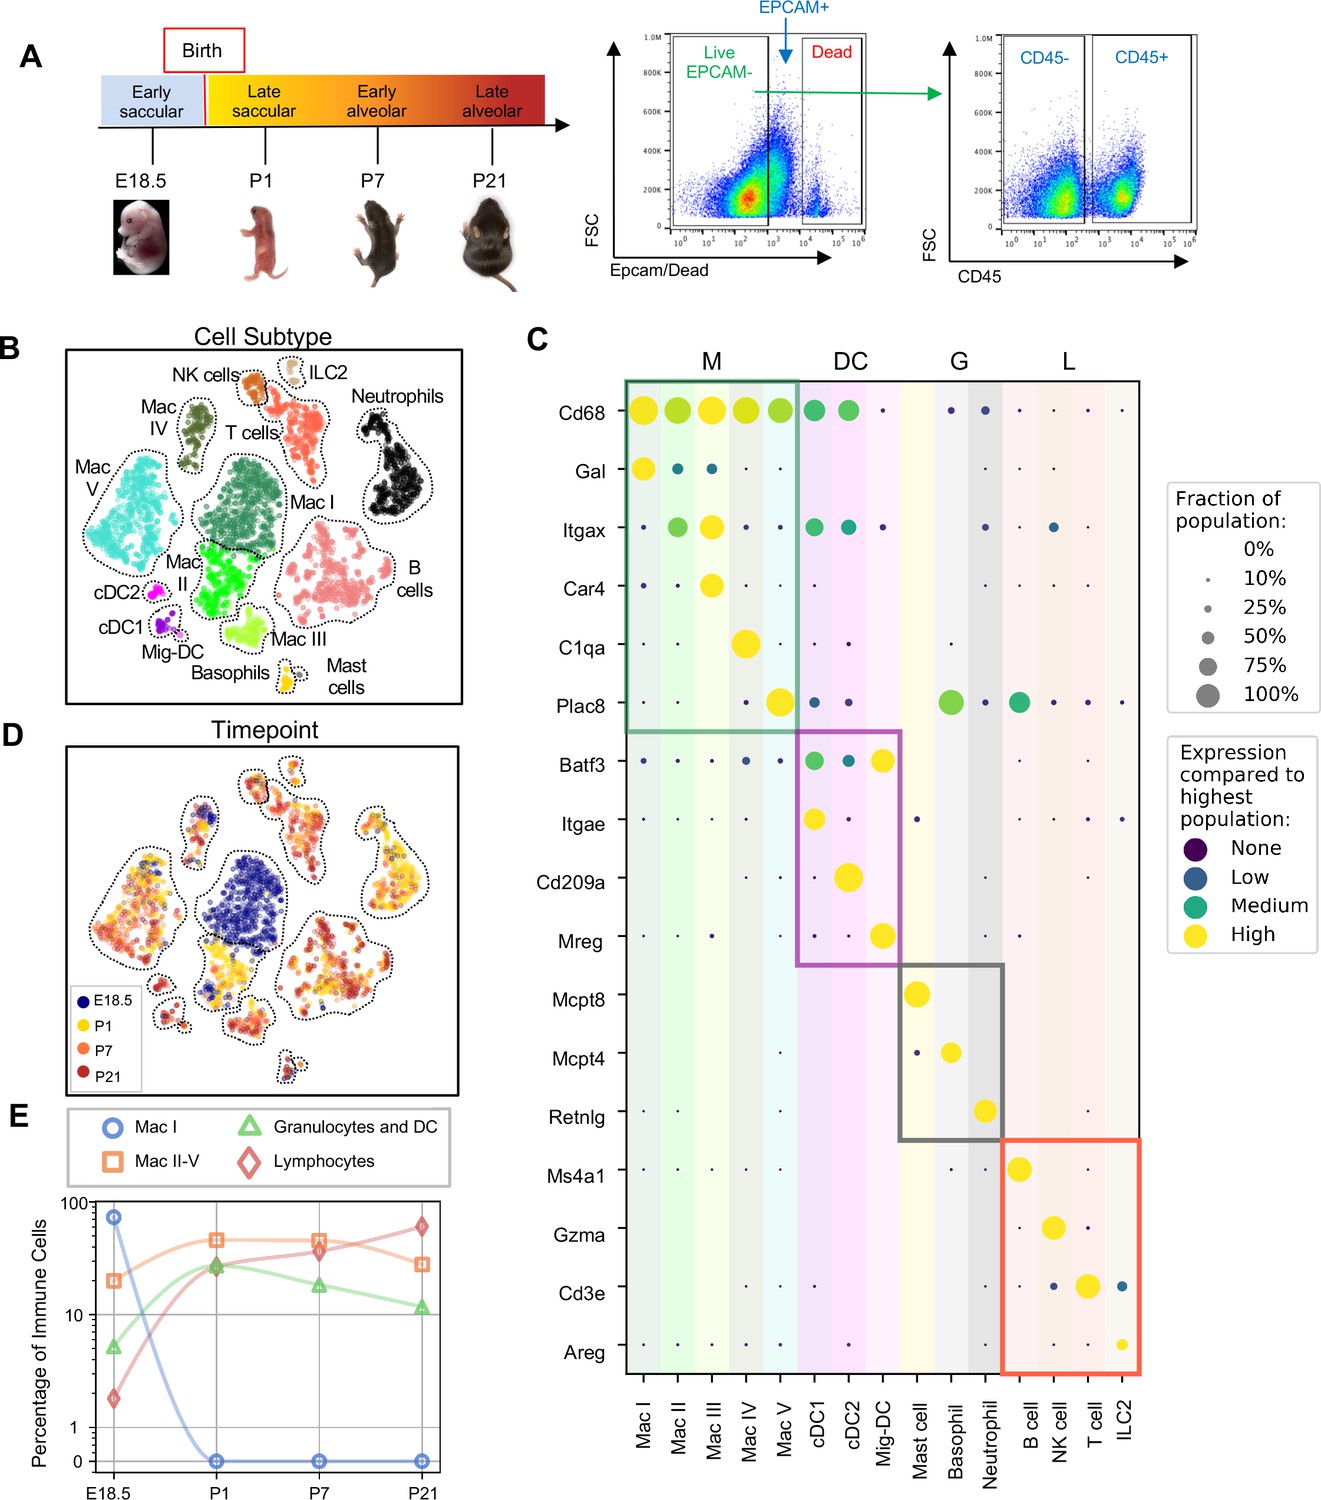
Diversity of the lung immune landscape increases dramatically after birth.
(A) Overview of the experimental design including the four timepoints (E18.5, P1, P7, P21) corresponding to key stages in late lung development. Lungs were isolated, perfused, and digested and immune cells isolated by fluorescence activated cell sorting (FACS) for the dead-stain-, EPCAM-, CD45+ population. (B) t-Distributed Stochastic Neighbor Embedding (t-SNE) and unsupervised clustering of over 4000 immune cells identifies fifteen distinct populations. (C) Dot plot showing level of expression (purple to yellow), and fraction of the population expressing the particular gene (dot size) for distinguishing genes expressed by the Leiden clusters broadly separated into myeloid (M), dendritic cell (DC) granulocyte (G) and lymphocyte (L) populations. (D) t-SNE of immune cell clusters identifying developmental timepoint of cell origin with E18.5 (blue), P1 (yellow), P7 (orange) and P21 (red). (E) Quantification of the abundance of specific immune subpopulations in the lung at each developmental timepoint expressed on a log (Rodríguez-Castillo et al., 2018) scale as percentage of total immune cells.
Figure 1—figure supplement 1
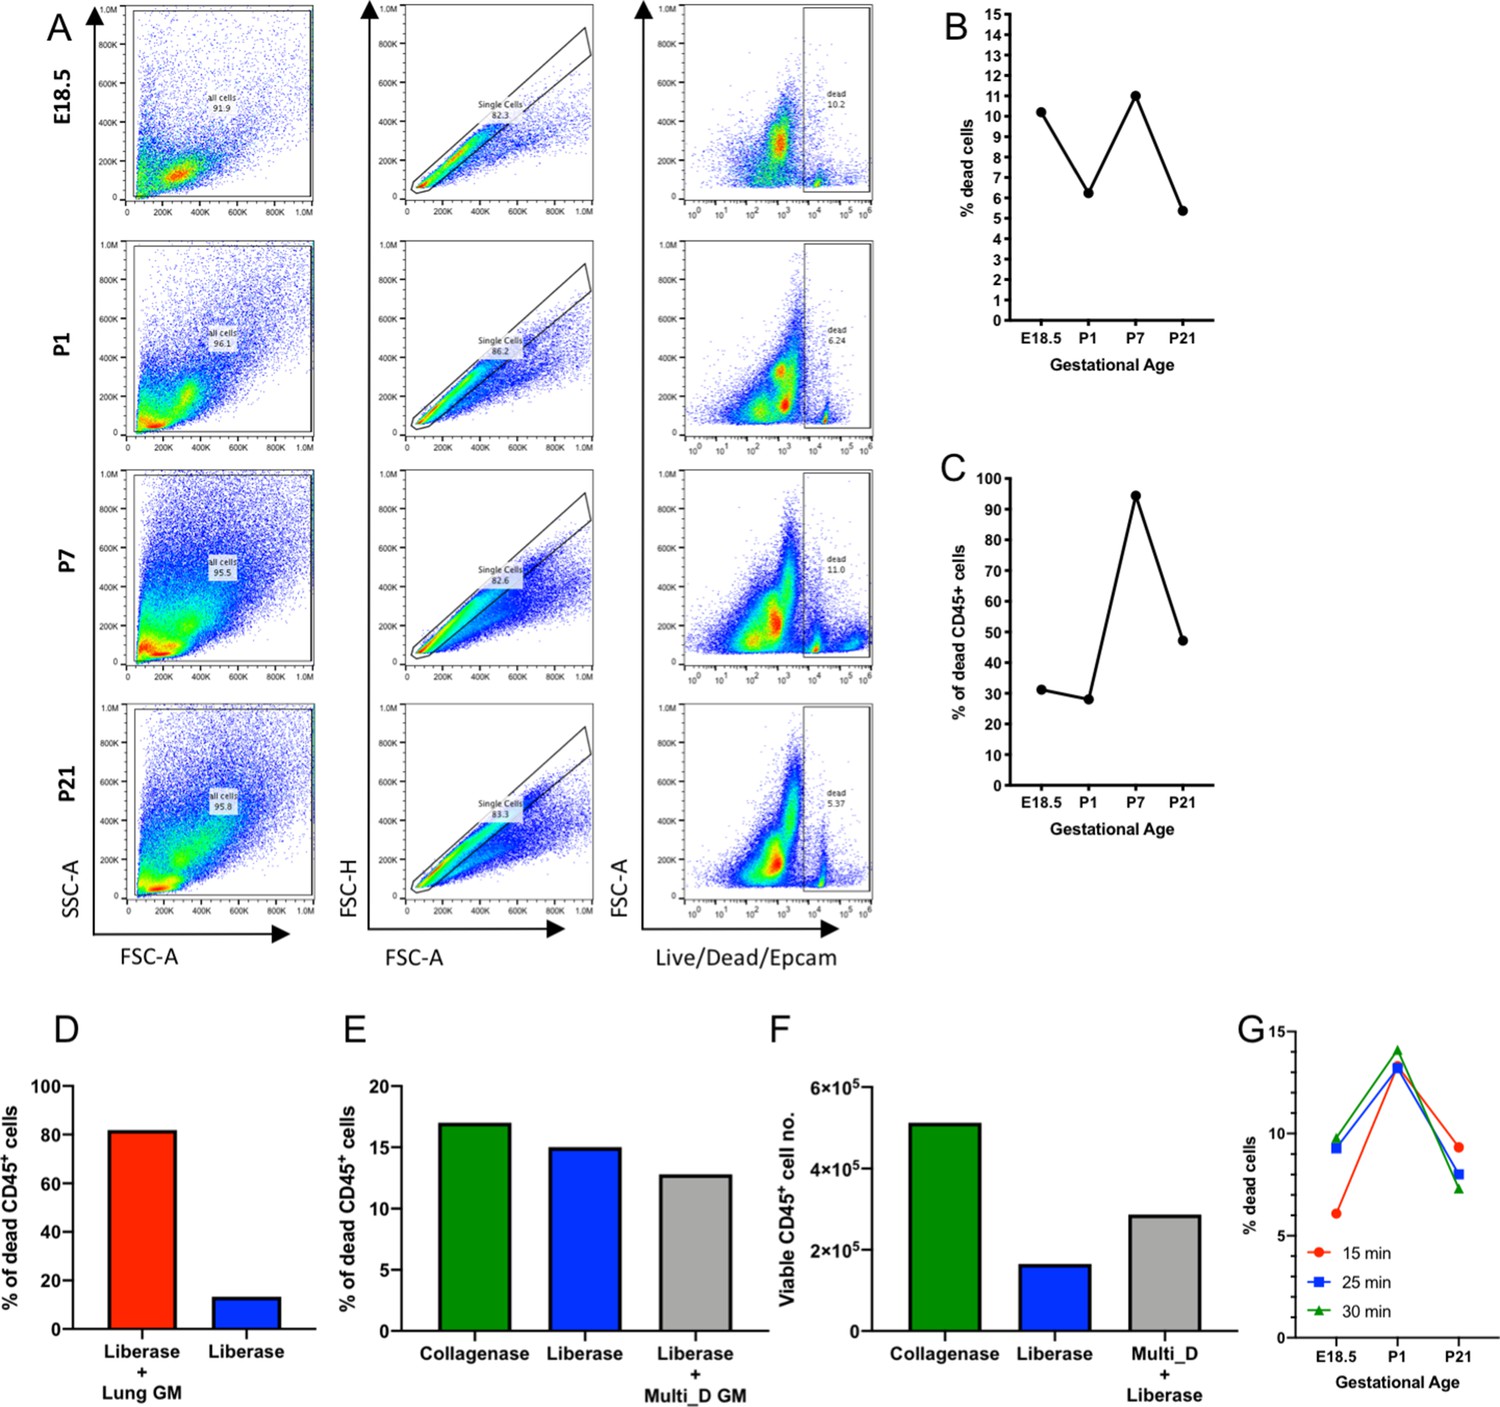
Optimization of lung tissue digestion.
(A–C) E18.5, P1, P7 and P21 murine lungs were processed for flow cytometry and the frequency of (B) total and (C) CD45+ (immune) dead cells was assessed. (D–E) Frequency of dead cells of P7 murine lungs was determined by flow cytometry following 30 min (D) enzymatic digestion with 0.38 mg/mL liberase with manual tituration (Liberase) and/or mechanical disruption using the lung program on the GentleMACS dissociator (Lung GM) or (E) enzymatic digestion with collagenase and manual tituration (Collagenase), Liberase, or 0.38 mg/mL liberase with the Multi_D program on the GentleMACS dissociator (Liberase + Multi_D GM). (F) Number of viable P7 murine lung cells following Collagenase, Liberase, or Liberase + Multi_D GM was quantified. (G) Frequency of murine lung cells at gestational age E18.5, P1, P21 was quantified following incubation with 0.38 mg/mL liberase for 15, 25, and 30 min and manual tituration.
Figure 1—figure supplement 2
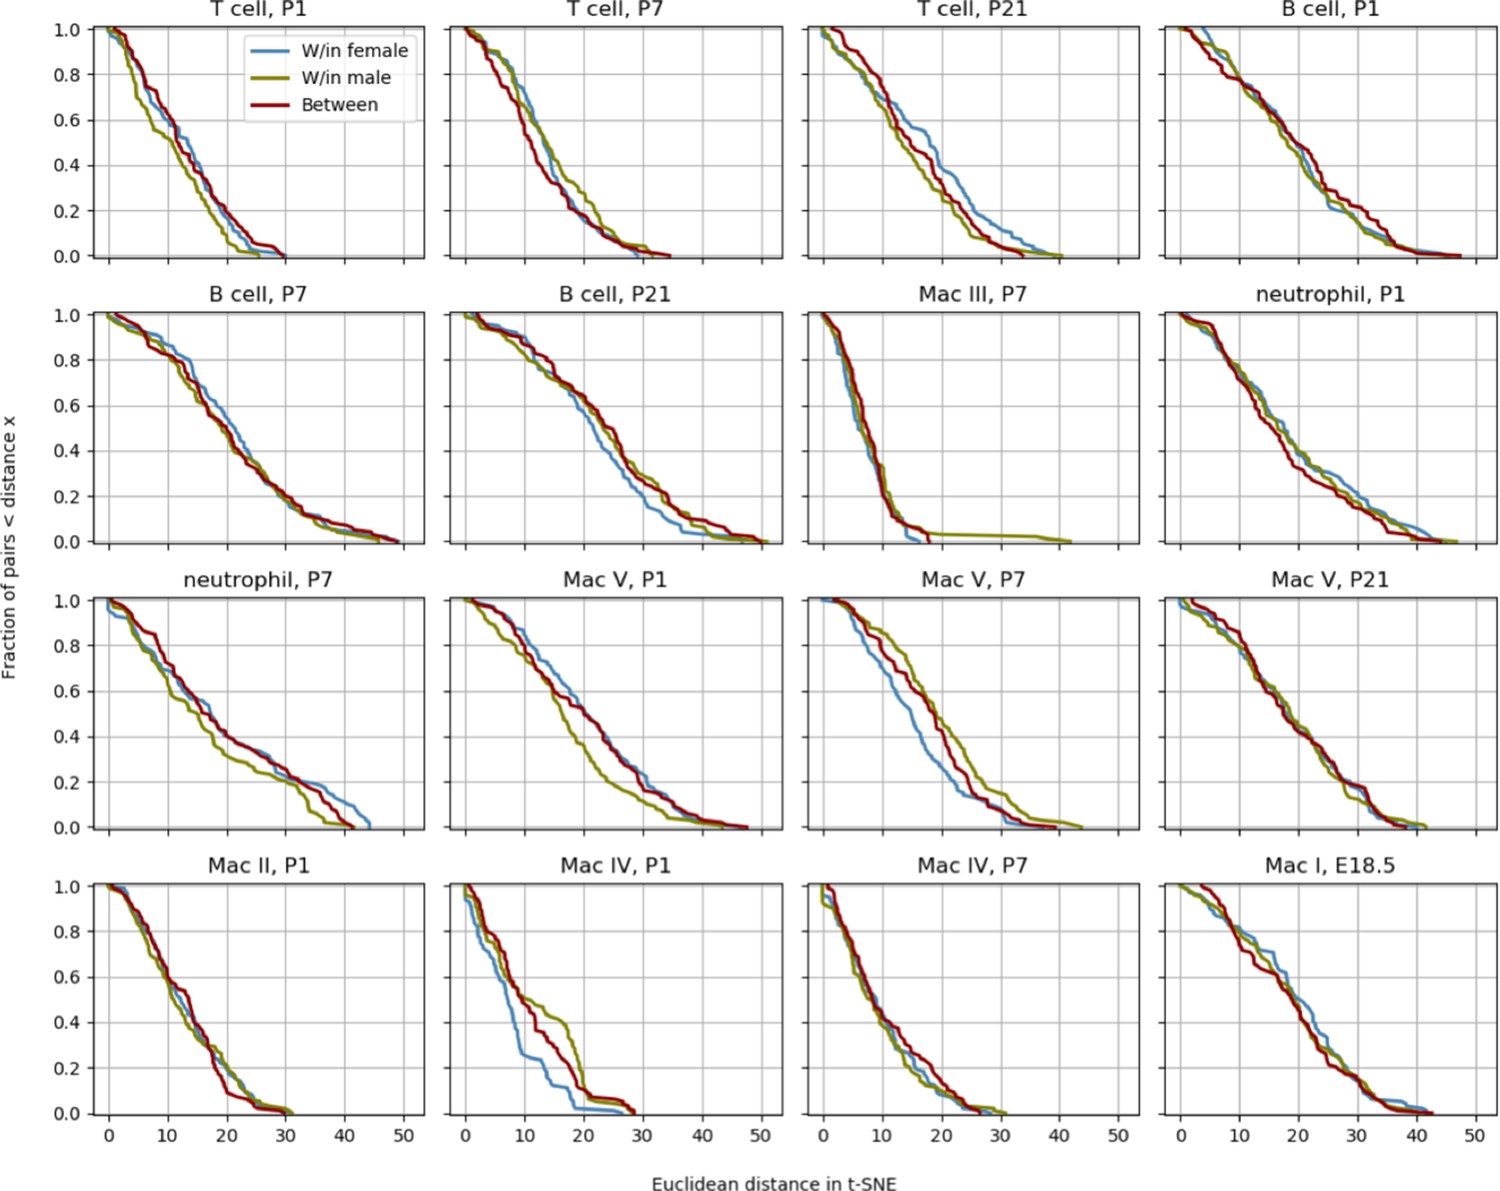
Determination of variation between mice.
To quantify whether the different mice contributed spurious variation to the data, a distribution level approach was chosen. For each cell type and time point, 100 pairs of cells from either the same mouse or between different mice were chosen and the distance in t-SNE space calculated. The cumulative distributions for those pairs were subsequently plotted to check whether pairs from different animals had a significantly longer distance than cells from the same mouse.
Figure 2 with 2 supplements
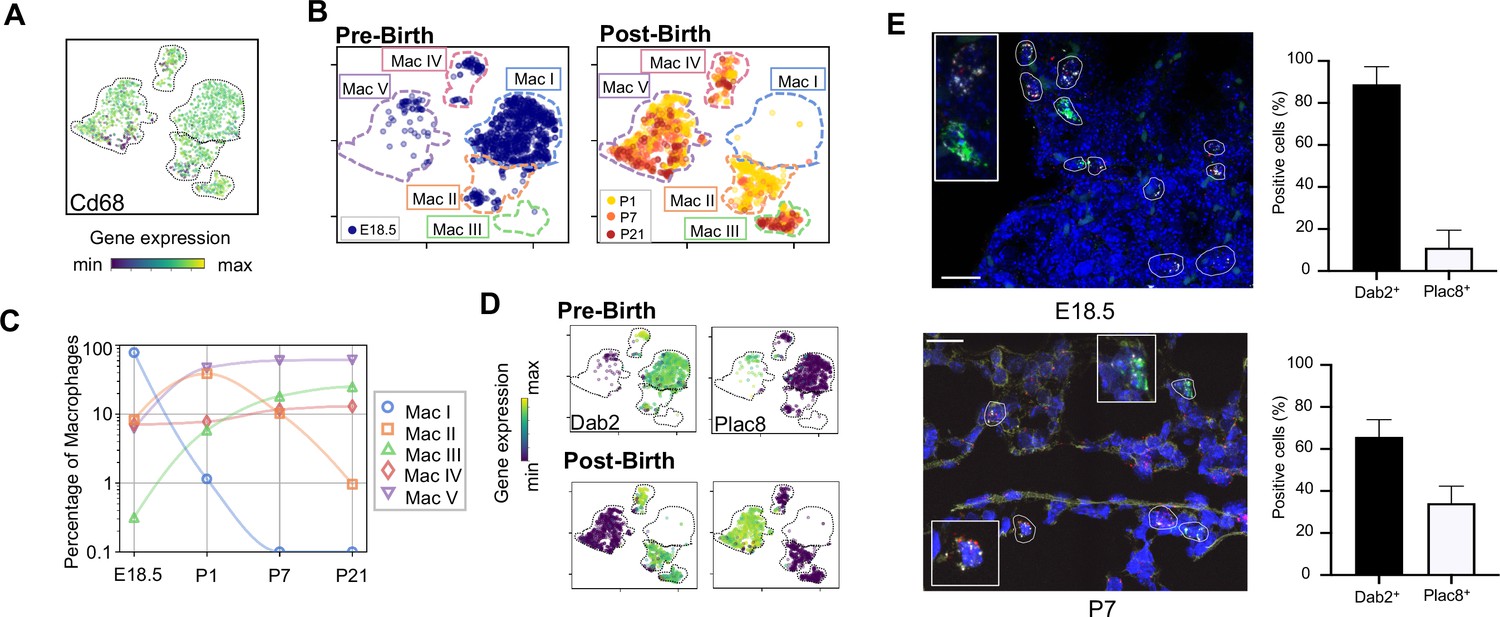
Macrophage populations present before and after birth broadly separate into two populations based on expression of Dab2 and Plac8.
(A) t-SNE plot depicting Cd68 expression in the five macrophage populations. (B) Separate embeddings for prenatal versus postnatal macrophages, identifying developmental timepoint of cell origin with E18.5 (blue), P1 (yellow), P7 (orange) and P21 (red). (C) Quantification of the abundance of each macrophage subpopulation at each developmental timepoint expressed on a log (Rodríguez-Castillo et al., 2018) scale as percentage of total macrophages. (D) t-SNE plots depicting expression of Dab2 and Plac8 within the macrophages present pre- and post-birth. (E) Multiplexed in situ hybridization to detect gene expression of Cd68 (yellow), Dab2 (red), and Plac8 (green) in lung tissue from mice at E18.5 and P7. Quantification of Dab2+ and Plac8+ cells with data = mean ± SD for n = 4–15 images from three separate FISH experiments. Calibration bar = 20 μm. For all t-SNE embeddings, the color scale is a logarithmic scale with a pseudocount of 0.1 counts per million, normalized to the highest expressing cell. Source files of all fluorescent micrographs used for the quantitative analysis are available in the Figure 2—source data 1.
-
Figure 2—source data 1
Source files for quantification of Dab2+ and Plac8+ Cd68+ cells.
This zip archive contains all the fluorescent micrographs used for the quantitative analysis shown in Fig. blank. The individual files are named with the timepoint (for figures containing more than one timepoint), the gene detected by FISH, followed by the color of the label for the gene with ‘G’ for green, ‘R’ for red, ‘W’ for white, and ‘Y’ for yellow.
- https://cdn.elifesciences.org/articles/56890/elife-56890-fig2-data1-v2.zip
Figure 2—figure supplement 1
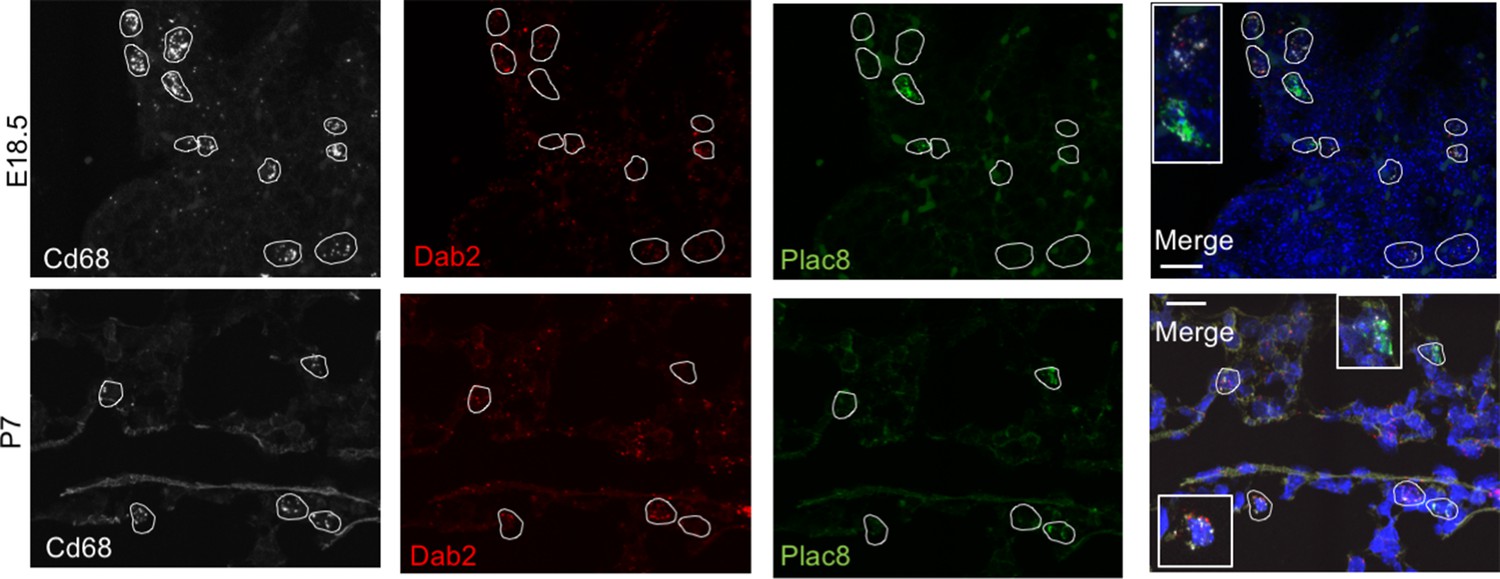
Multiplex in situ hybridization to detect Dab2 and Plac8 expressing macrophages.
In situ hybridization at E18.5 and P7 to detect Cd68 (white), Dab2 (red), Plac8 (green), and a merged image. Calibration bar = 20 μm.
Figure 2—figure supplement 2
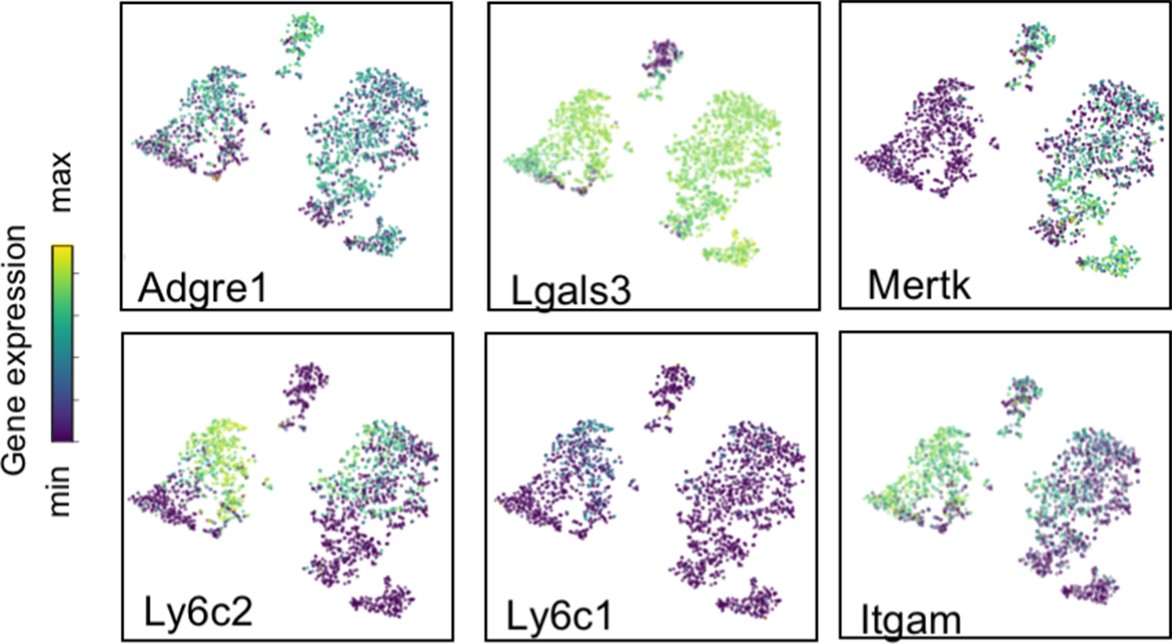
Lineage-defining genes are diffusely expressed across macrophage populations.
t-SNE plots of Adgre1, Lgals3, Mertk, Ly6c2, Ly6c1 and Itgam expression across all macrophage clusters between E18.5 and P21. The color scale is a logarithmic scale with a pseudocount of 0.1 counts per million, normalized to the highest expressing cell.
Figure 3 with 1 supplement
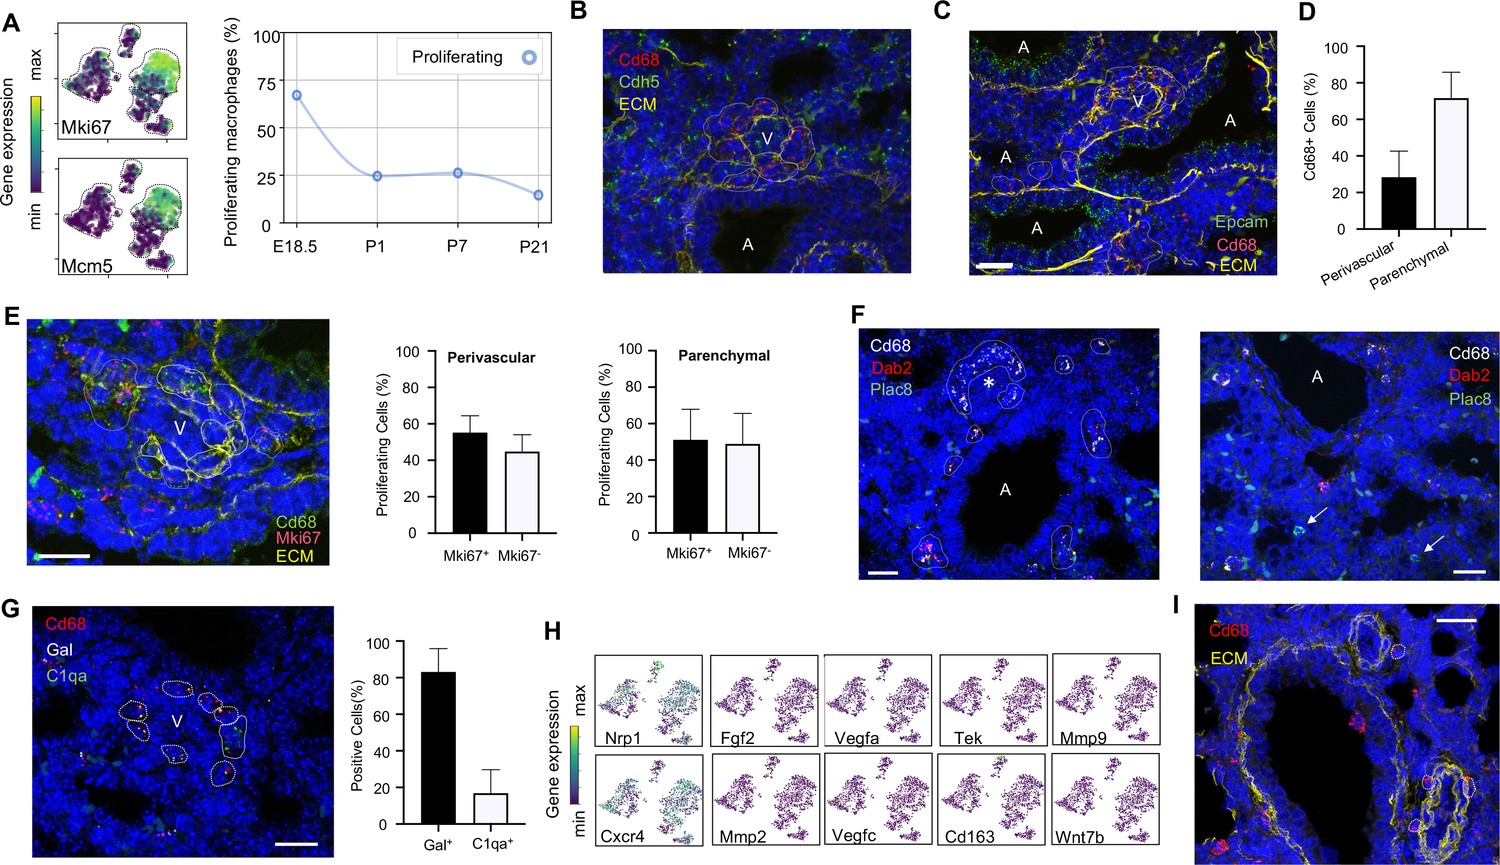
Embryonic macrophages encircle developing blood vessels prior to birth.
(A) t-SNE plots depicting expression of Mki67 and Mcm5 in the macrophage clusters with low expression in purple and high expression in yellow, with quantification of proliferating macrophages at each timepoint. In situ hybridization at E18.5 to detect: (B) Cd68 (red) and Cdh5 (green) with dotted lines identifying macrophages in circles around small vessels; (C) Epcam (green), Cd68 (red), and extracellular matrix (ECM, yellow), with white dotted circles identifying Cd68+ cells or groups of cells; (D) Quantification of the number of Cd68+ cells around vessels versus in lung parenchyma, with data = mean ± SD in n = 14 images, from five independent FISH experiments. (E) In situ hybridization at E18.5 to detect Mki67 (red), Cd68 (green), and ECM (yellow), with white dotted circles identifying Cd68+Mki67+ cells, and solid circles identify Cd68+ Mki67- cells. Quantification of the number of perivascular and parenchymal Mki67+ and Mki67- Cd68+ cells in n = 10 images with data = mean ± SD from two independent FISH experiments. (F) In situ hybridization at E18.5 to detect Cd68 (white) Dab2 (red), and Plac8 (green) with white dotted circles identifying Cd68+Dab2+ macrophages in the left panel, and arrows identifying Plac8+ cells in a separate area from the same slide (right panel). (G) In situ hybridization at E18.5 to detect Cd68 (red), Gal (white), and C1qa (green), with quantification of Gal+ and C1qa+ Cd68+ cells with data = mean ± SD from n = 12 images from three independent FISH experiments. (H) t-SNE plots of genes previously associated with a perivascular macrophage phenotype. (I) In situ hybridization of lung at P1 to detect Cd68 (red) and ECM (yellow), with white dotted circles identifying isolated macrophages around blood vessels. In each micrograph, calibration bar = 20 μm and ‘V’ denotes ‘vessel and ‘A’ ‘airway’. For all t-SNE embeddings, the color scale is a logarithmic scale with a pseudocount of 0.1 counts per million, normalized to the highest expressing cell. Source files of all fluorescent micrographs used for the quantitative analysis are available in the Figure 3—source data 1, Figure 3—source data 2, and Figure 3—source data 3.
-
Figure 3—source data 1
Source files for quantification of perivascular and parenchymal Cd68+ cells at E18.5.
This zip archive contains all the fluorescent micrographs used for the quantitative analysis shown in Fig. blank. The individual files are named with the timepoint (for figures containing more than one timepoint), the gene detected by FISH, followed by the color of the label for the gene with ‘G’ for green, ‘R’ for red, ‘W’ for white, and ‘Y’ for yellow.
- https://cdn.elifesciences.org/articles/56890/elife-56890-fig3-data1-v2.zip
-
Figure 3—source data 2
Source files for quantification of Mki67+ Cd68+ cells at E18.5.
This zip archive contains all the fluorescent micrographs used for the quantitative analysis shown in Fig. blank. The individual files are named with the timepoint (for figures containing more than one timepoint), the gene detected by FISH, followed by the color of the label for the gene with ‘G’ for green, ‘R’ for red, ‘W’ for white, and ‘Y’ for yellow.
- https://cdn.elifesciences.org/articles/56890/elife-56890-fig3-data2-v2.zip
-
Figure 3—source data 3
Source files for quantification of Gal+ and C1qa+ perivascular Cd68+ cells at E18.5.
This zip archive contains all the fluorescent micrographs used for the quantitative analysis shown in Fig. blank. The individual files are named with the timepoint (for figures containing more than one timepoint), the gene detected by FISH, followed by the color of the label for the gene with ‘G’ for green, ‘R’ for red, ‘W’ for white, and ‘Y’ for yellow.
- https://cdn.elifesciences.org/articles/56890/elife-56890-fig3-data3-v2.zip
Figure 3—figure supplement 1
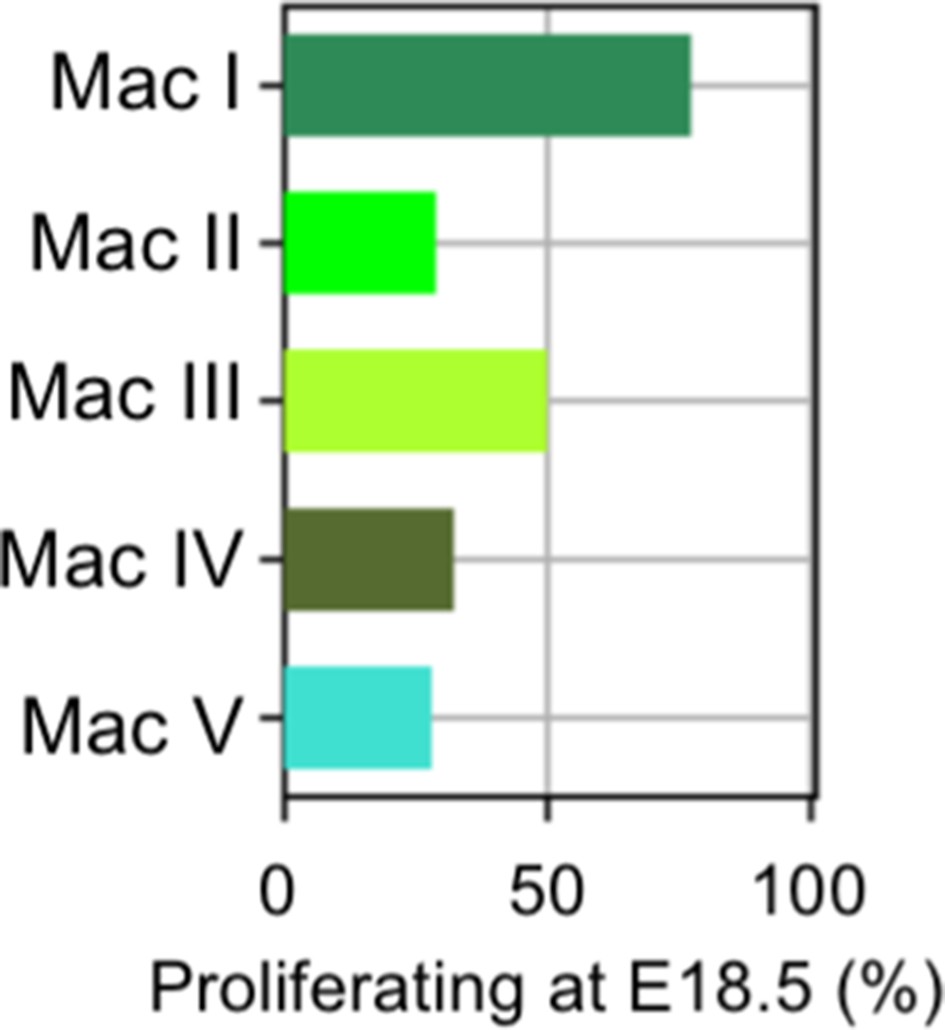
Distribution of proliferating cells among macrophage/monocyte clusters.
Graph of percentage of proliferating macrophages in each cluster at E18.5.
Figure 4 with 4 supplements
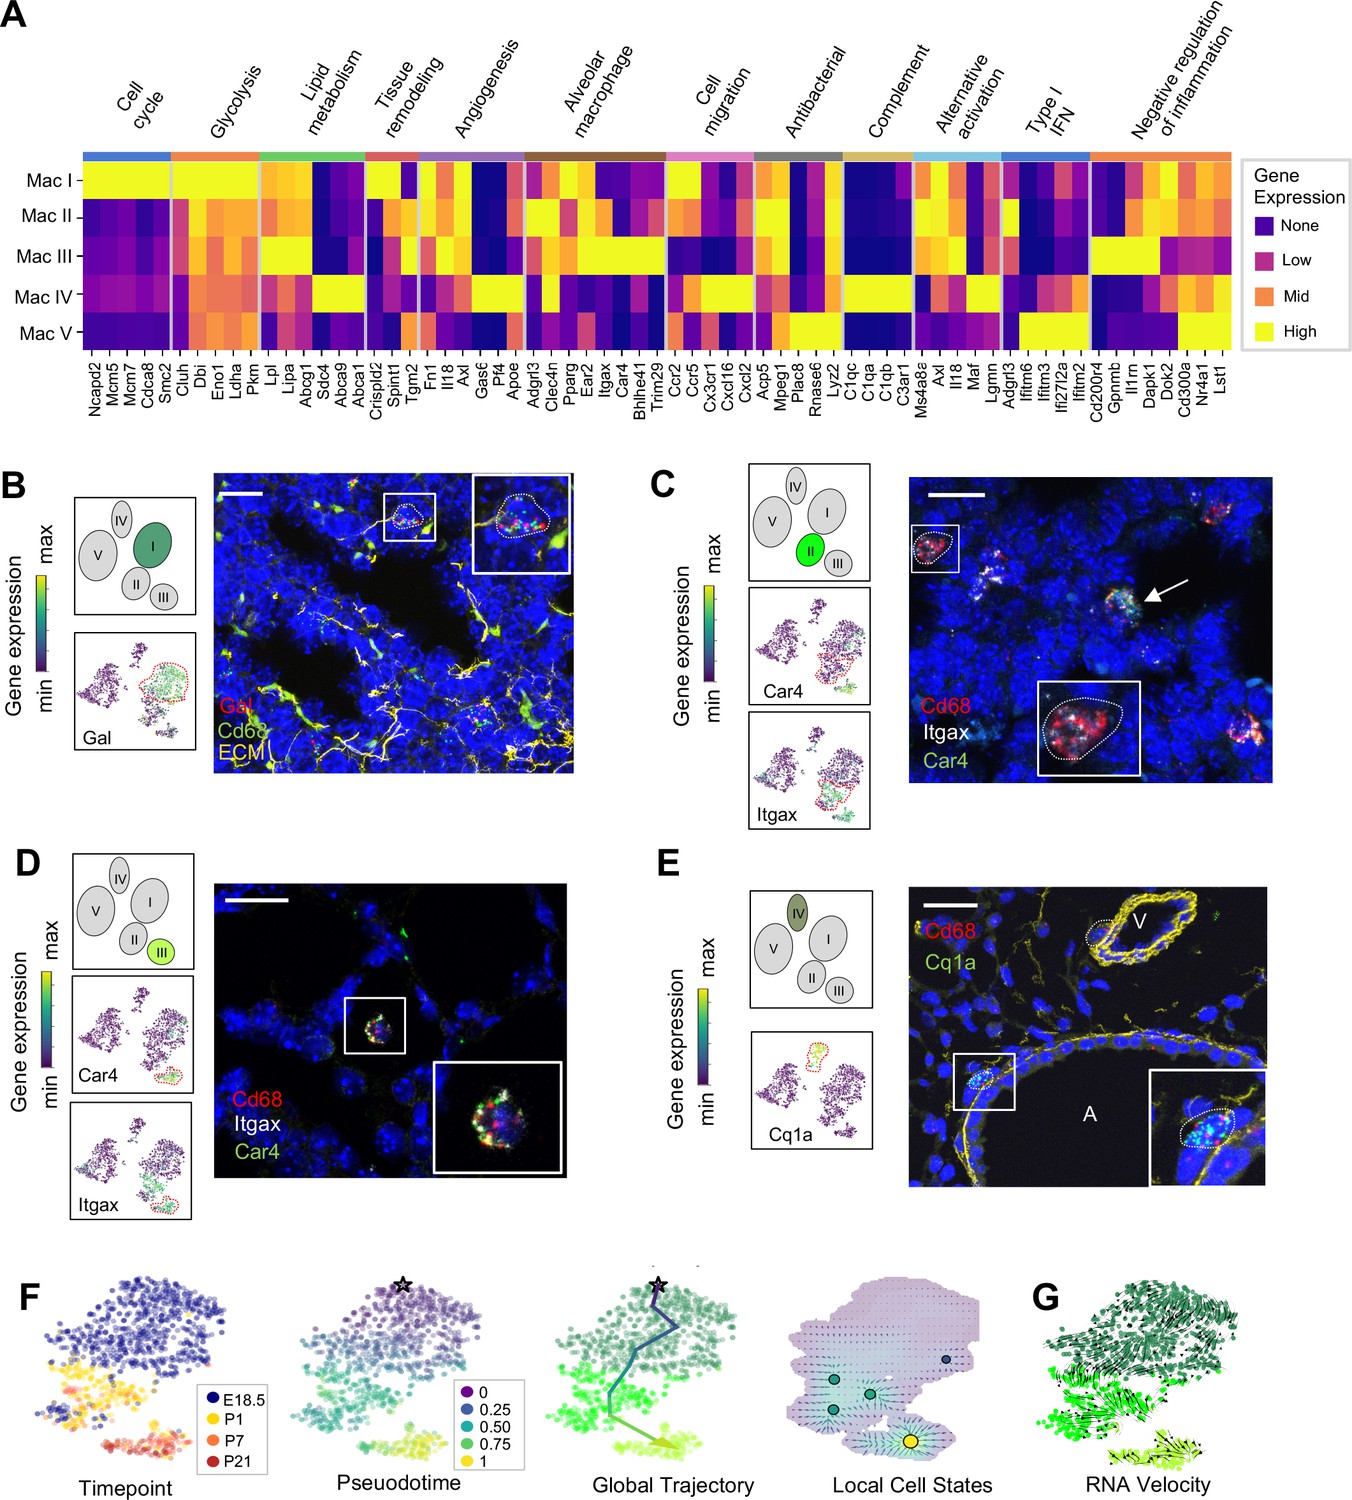
Distinct transcriptional profiles and spatial distribution suggest specific physiologic functions for discrete macrophage populations.
(A) Heatmap of select differentially expressed genes within enriched pathways illustrated. The color scale is logarithmic with a pseudocount of 0.1 counts per million, normalized to the highest expressing population for each gene, depicting 0 (none), 33 (low), 67 (mid), and 100% (high) expression compared to the highest expressing population. (B) t-SNE plots demonstrating high expression of Gal in Mac I cells, and in situ hybridization at E18.5 to detect Mac I cells that co-express Gal (red) and Cd68 (green). (C) t-SNE plots demonstrating high expression of Itgax but not Car4 in Mac II cells, and in situ hybridization to detect Mac II cells at P1 expressing Itgax, and Cd68 but not Car4 (dotted line), and additional Mac III cells in the same image co-expressing Itgax, Cd68, and Car4 (arrow). (D) t-SNE plots demonstrating high expression of Itgax and Car4 in Mac III cells, and in situ hybridization detecting Mac III cells at P7 expressing Itgax, Car4 and Cd68 now located within alveoli. (E) t-SNE plot demonstrating high expression of C1qa in Mac IV cells, and in situ hybridization to detect Mac IV cells expressing C1qa (green) and Cd68(red) at P7, with ECM marked in yellow, localizing Mac IV cells abutting vessels and large airways. Calibration bar = 20 μm for all panels. For all t-SNE embeddings, the color scale is a logarithmic scale with a pseudocount of 0.1 counts per million, normalized to the highest expressing cell. (F) t-SNE plot showing a developmental gradient across Mac I-III. Pseudotime ordering of the cells identified a global trajectory from the starting cell (star) in Mac I to Mac III, and local cell states revealing multiple areas of local attraction within the Mac II and Mac III clusters. (G) RNA velocity demonstrating local group velocity from Mac I to Mac II and continuation of the vectors through Mac III.
Figure 4—figure supplement 1
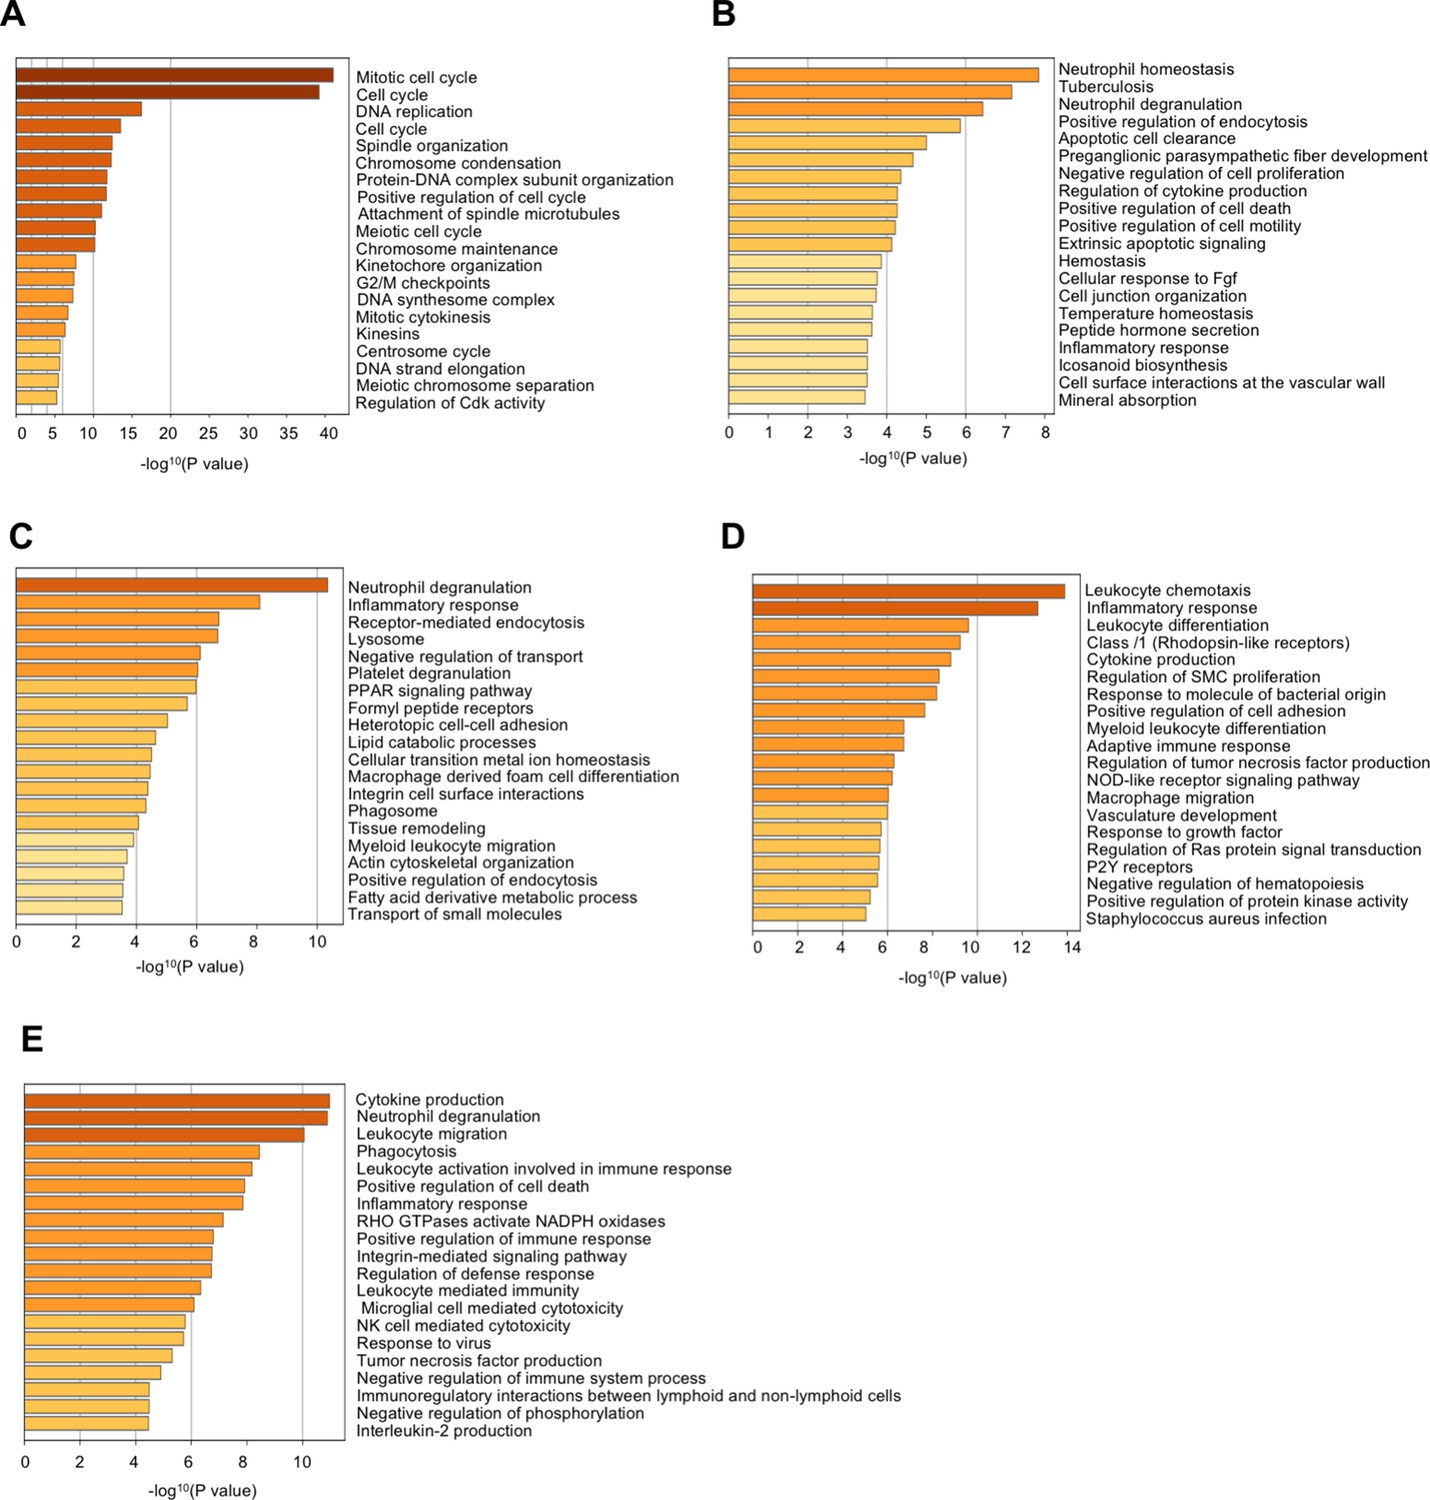
Pathway analysis of differentially expressed genes in the macrophage populations.
Pathway analysis on the top 100 expressed genes from the 5 Mac clusters was performed for each cluster in a one-vs-rest comparison, and the gene set enrichment evaluated with Metascape. Enriched pathways were ordered by significance. The x axis is the negative logarithm of the P value.
Figure 4—figure supplement 2
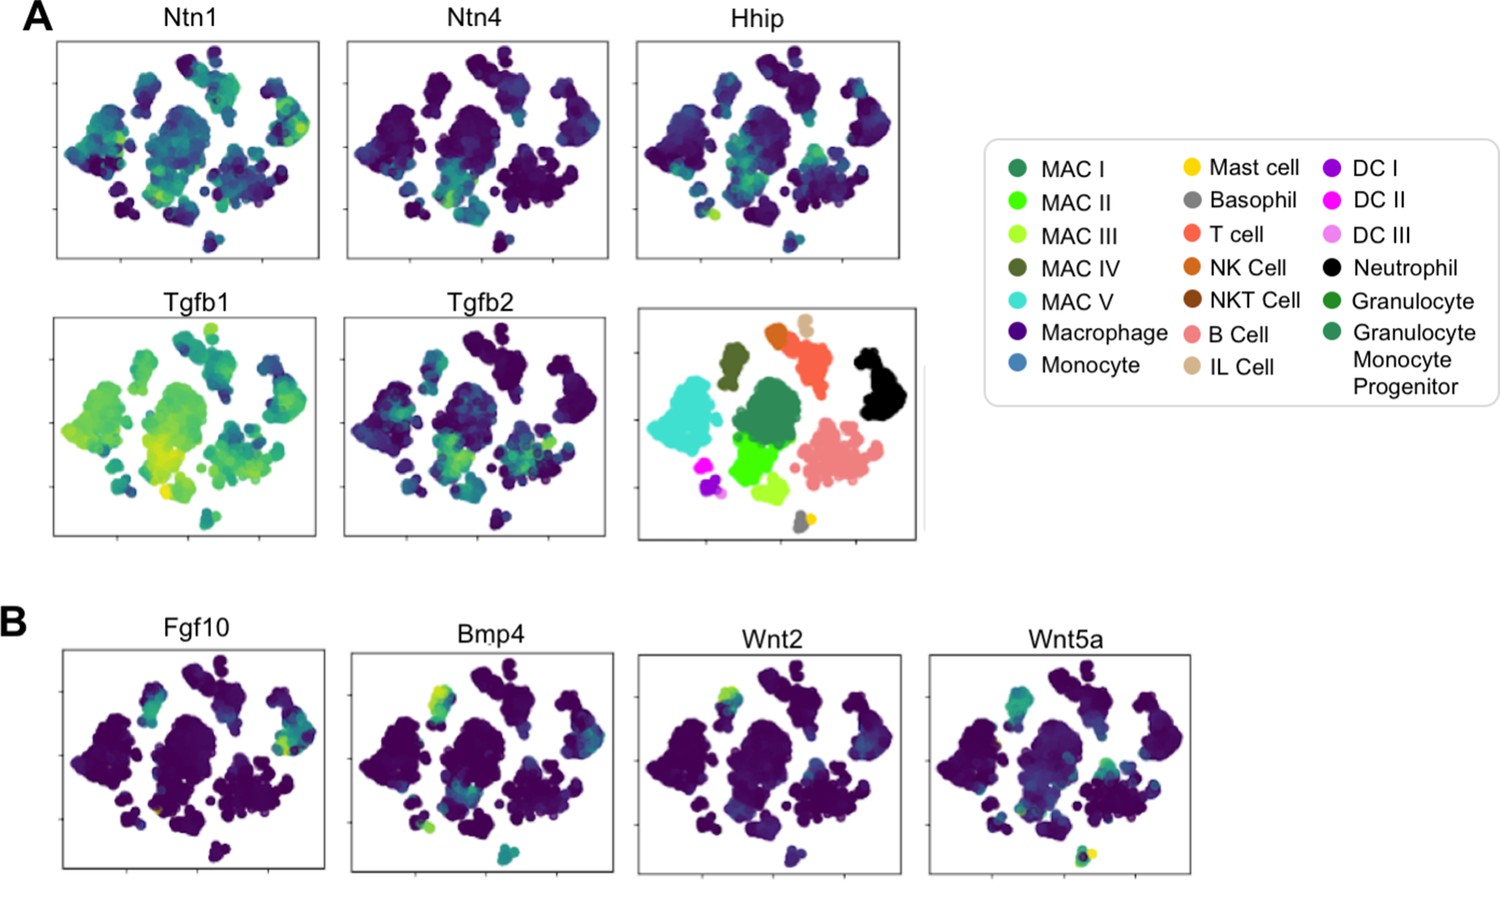
Select genes involved in pathways regulating lung progenitor cells are expressed by Mac II and Mac IV.
(A) t-SNE plots of genes expressed by Mac II including Ntn1, Ntn4, Hhip, Tgfb1, and Tgfb2 with plot of cell subtype. (B) t-SNE plots of genes expressed by Mac IV including Fgf10, Bmp4, Wnt2, and WNt5a. For all t-SNE plots, the color scale is a logarithmic scale with a pseudocount of 0.1 counts per million, normalized to the highest expressing cell, after smoothing with a modified version of the MAGIC algorithm as described in the Materials and methods.
Figure 4—figure supplement 3

Expression of select genes in Mac IV cluster.
t-SNE plots of (A) H2-Ab1, (B) H2-Eb1, (C) Cd74, and (D) Mrcl1 demonstrating differential expression in a portion of Mac IV (dotted red line). t-SNE plots of (E) Cx3cr1, (F) Mertk, (G) Cclr2, and (H) Cd68 demonstrating diffuse expression throughout Mac IV. The color scale is a logarithmic scale with a pseudocount of 0.1 counts per million, normalized to the highest expressing cell.
Figure 4—figure supplement 4

Multiplex in situ hybridization to detect specific macrophage clusters.
(A) In situ hybridization at P1 to detect Cd68 (red), Itgax (white), Car4 (green) and a merged image. (b) In situ hybridization at P1 to detect Cd68 (white), Ifitm6 (red), Ccr2 (green) and a merged image. In all images, calibration bar = 20 μm.
Figure 5
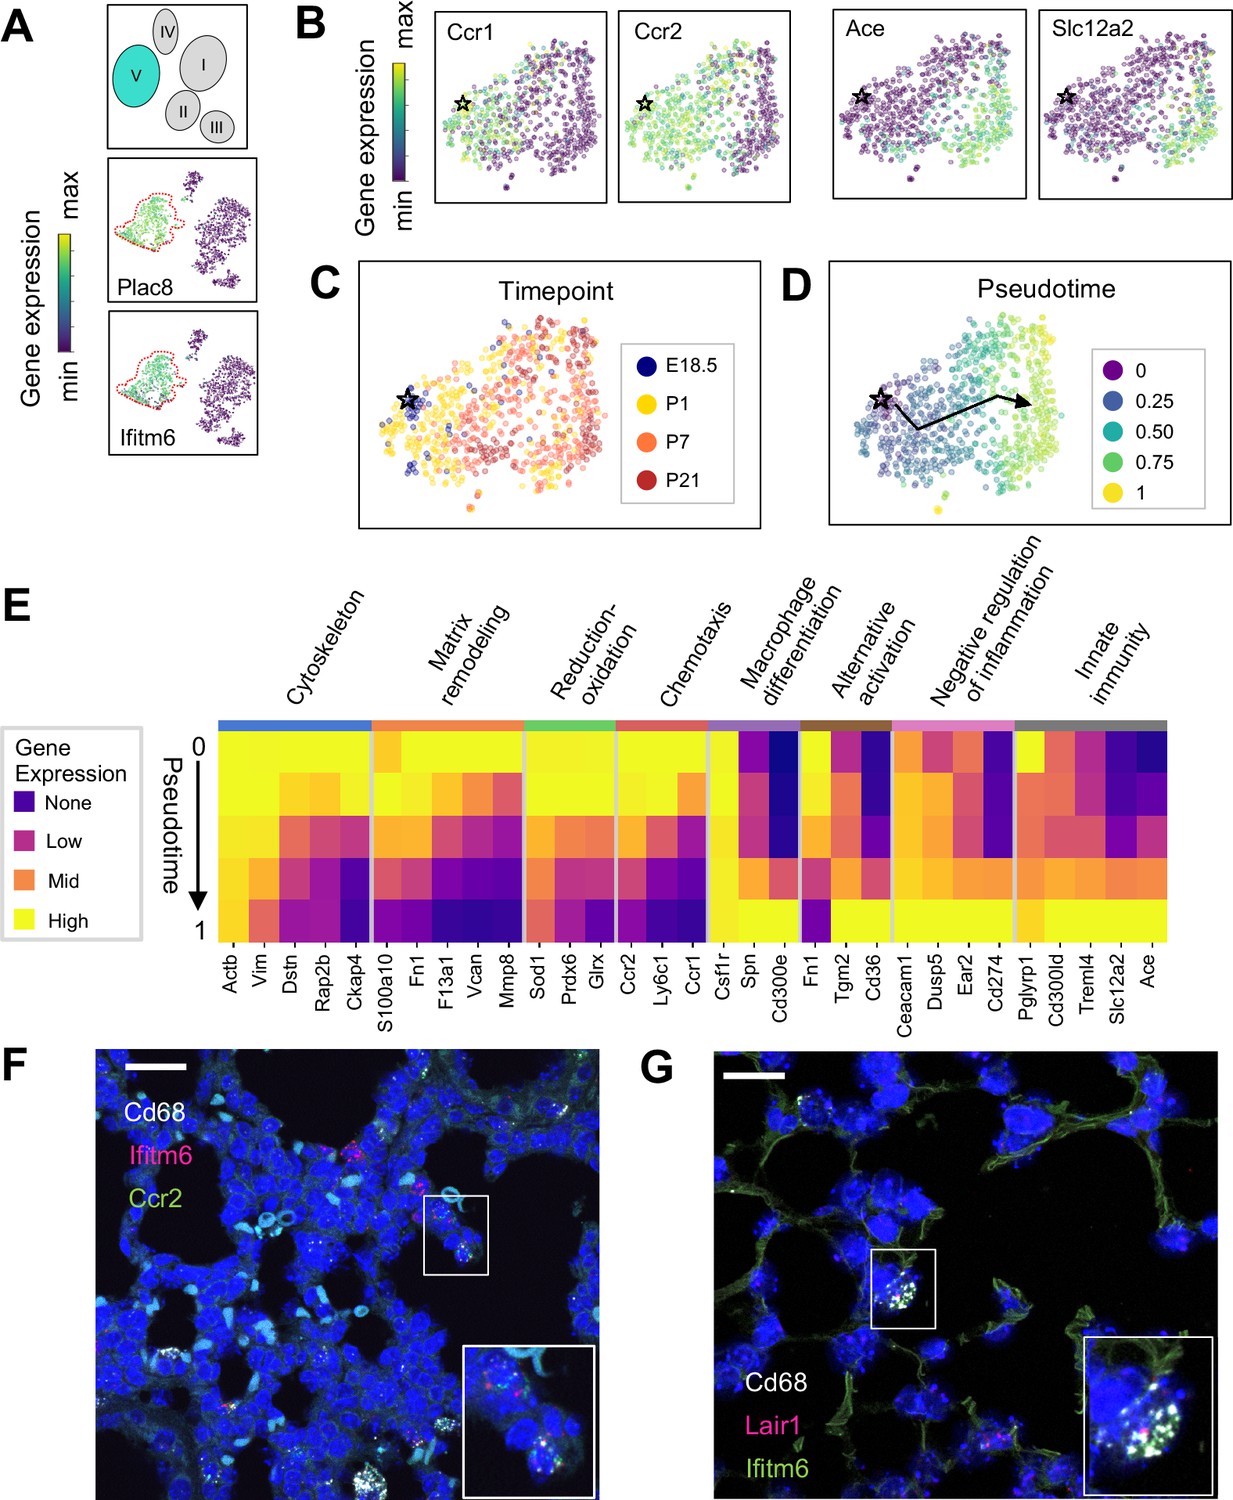
The Mac V cluster harbors distinct subpopulations with developmentally regulated gene expression patterns.
(A) t-SNE plots demonstrating high expression of Plac8 and Ifitm6 in Mac V cells. (B) t-SNE plots of Ccr1, Ccr2, Ace, and Slc12a2 suggesting the presence of two transcriptionally distinct populations within the Mac V cluster. (C) t-SNE demonstrating a developmental gradient within the Mac V sub cluster. For all t-SNE embeddings, the color scale is a logarithmic scale with a pseudocount of 0.1 counts per million, normalized to the highest expressing cell. (D) Pseudotime analysis with the star indicating the starting point and the arrow denoting the trajectory across pseudotime. (E) Heatmap of differentially expressed genes within enriched pathways across pseudotime. The color scale is logarithmic with a pseudocount of 0.1 counts per million, normalized to the highest expressing population for each gene, depicting 0 (none), 33 (low), 67 (mid), and 100% (high) expression compared to the highest expressing population. (F) In situ hybridization of Cd68 (white), Ifitm6 (red), and Ccr2 (green), and to detect the ‘early’ Mac V subcluster at P1. (G) In situ hybridization of Cd68 (white), Lair1 (red), and Ifitm6 (green), to detect the ‘late’ Mac V subcluster at P21. Calibration bar = 20 μm for all panels.
Figure 6
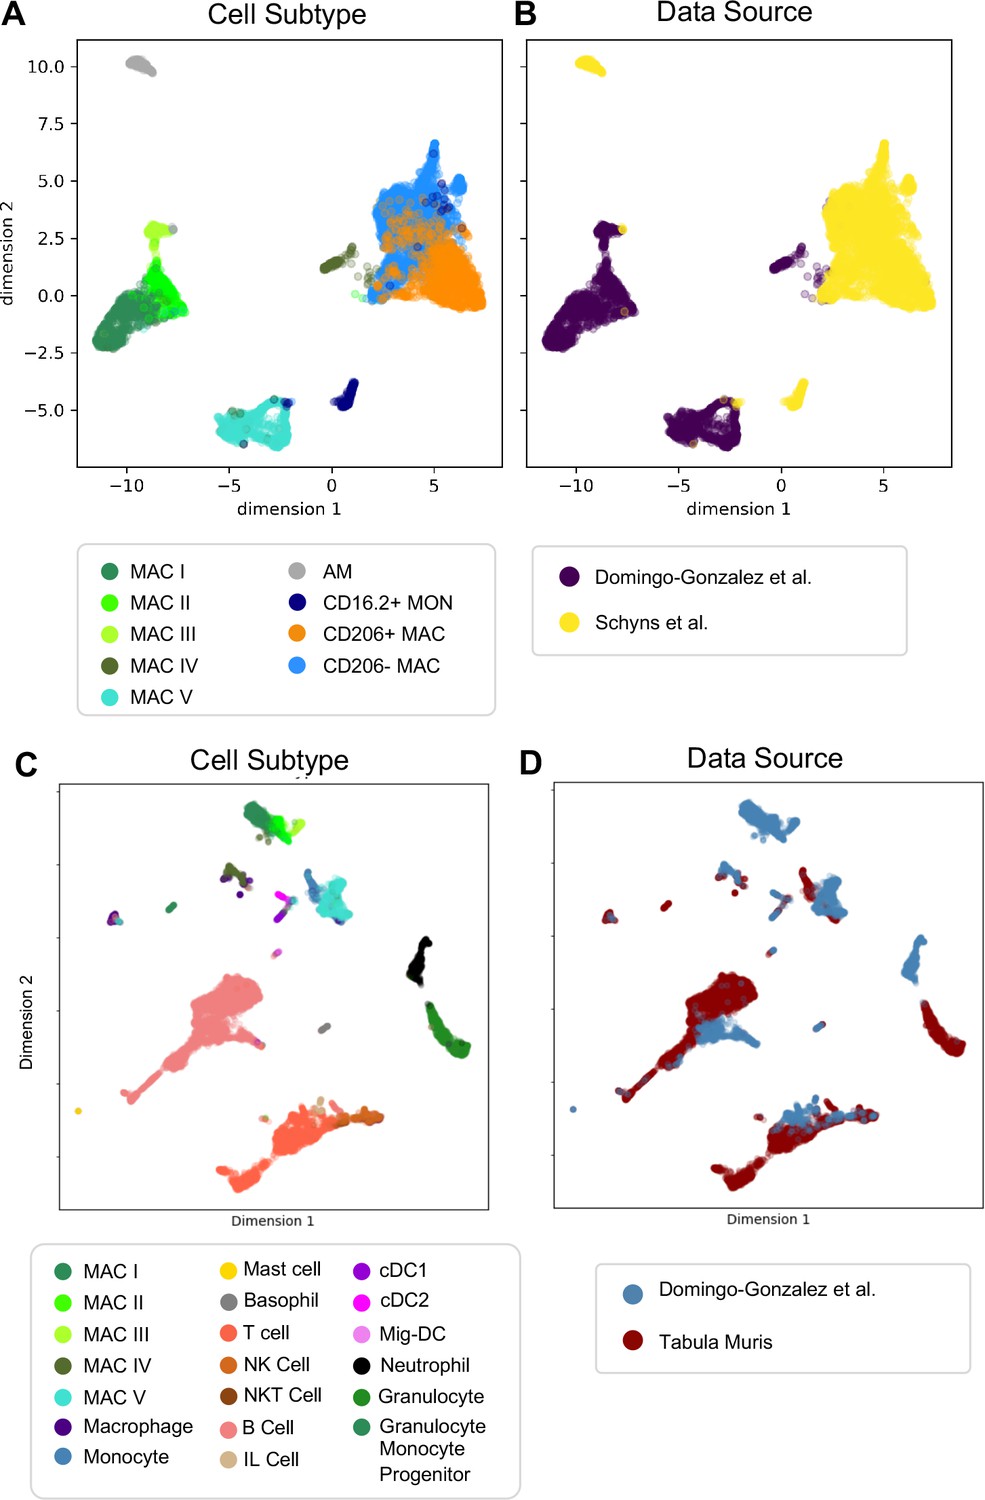
Comparison of Macrophage/Monocyte Subtypes in the Perinatal and Adult Lung.
Data sets were merged, restricted to genes that were overlapping, normalized to counts per million reads, feature selected and subjected to PCA, followed by UMAP. UMAP plots of (A) cell type and (B) data source using our data combined with Schyns et al. Data sets were merged and processed as described above, and the Northstar algorithm was used to infer the cell subtypes for our cells based on the Tabula Muris Atlas, with UMAP plots of (C) cell type and (D) data source.
Figure 7
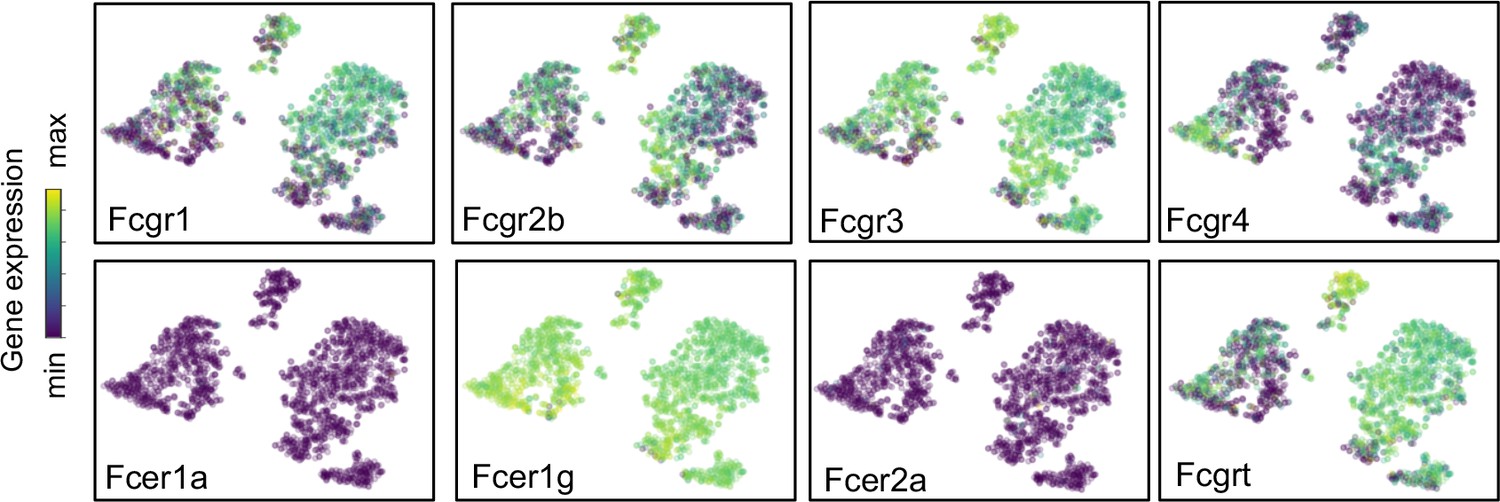
Expression of Fc receptors across macrophage clusters.
t-SNE plots of the expression of Fc receptors Fcgr1, Fcgr2b, Fcgr3, Fcgr4, Fcer1a, Fcer1g, Fcer2a, Fcgrt. For all tSNE embeddings, the color scale is a logarithmic scale with a pseudocount of 0.1 counts per million, normalized to the highest expressing cell.
Figure 8 with 1 supplement

Multiple dendritic cell populations and lung granulocytes are primed for rapid pathogen response.
(A) Colored schematic and lung immune cell clustering demonstrating three separate clusters of DCs. (B) t-SNE plots of genes discriminating the three DC subclusters including Itgae (cDC1), Cd209a (cDC2) and Mreg (mig-DC). (C) Quantification of specific DC subpopulations relative to total immune cells (left) or total DC (right). (D) Colored schematic and lung immune cell clustering demonstrating the basophil, mast cell and neutrophil clusters, with high magnification of basophil and mast cell clusters and t-SNE plots of Mcpt4 and Mcpt8. (E) t-SNE plots of Il6, Hgf, Ccl4, and Osm in the basophil cluster. (F) High magnification of the neutrophil cluster with t-SNE plots of neutrophil specific genes S100a8, S100a9, Stfa1, and Stfa2. For all t-SNE embeddings, the color scale is a logarithmic scale with a pseudocount of 0.1 counts per million, normalized to the highest expressing cell.
Figure 8—figure supplement 1
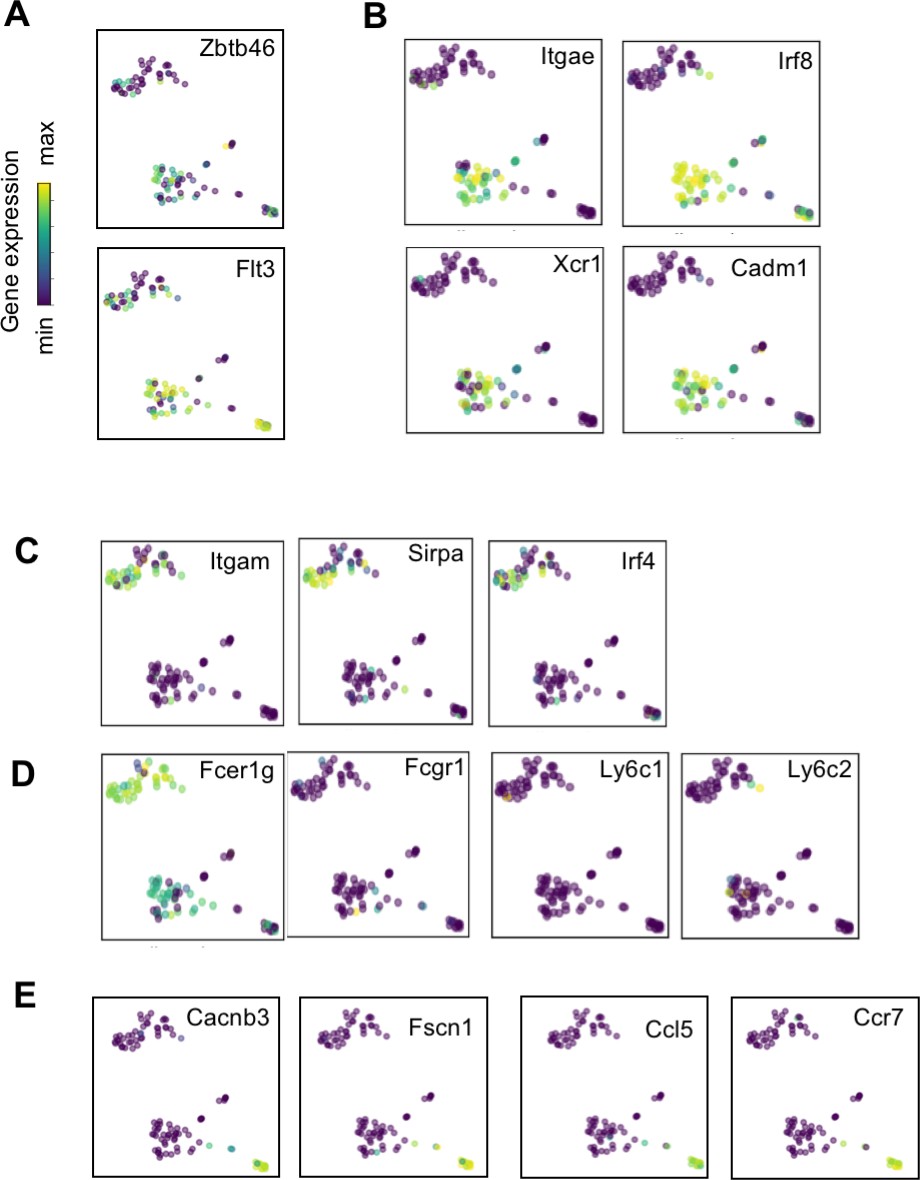
Expression of dendritic cell associated genes.
t-SNE plots of (A) pan-DC-associated genes Zbtb46 and Flt3; (B) cDC1 specific genes Itgae, Irf8, Xcr1, and Cadm1; (C) cDC2 specific genes Itgam, Sirpa, and Irf4; (D) monocyte-derived specific genes Fcer1g, Fcgr1, Ly6c1, and Ly6c2; and (E) mig-DC associated genes Cacnb3, Fscn1, Ccl5, and Ccr7.
Figure 9 with 1 supplement
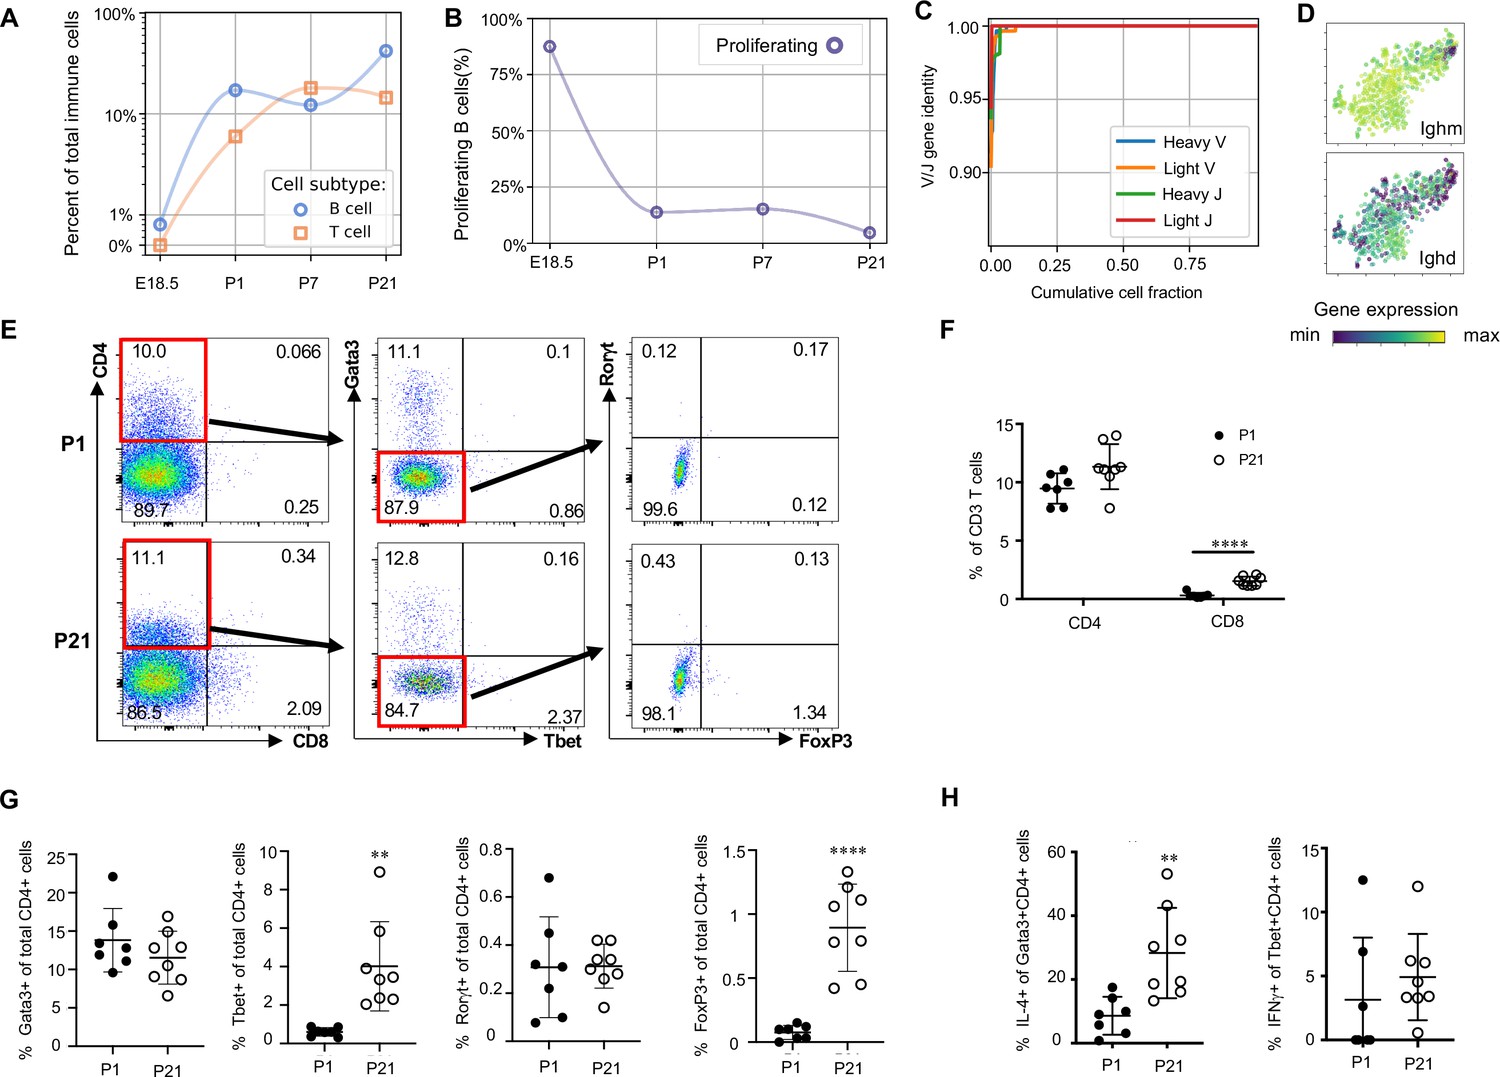
Lymphocytes populate the lung at birth but remain naïve during the first three weeks of life (A) Quantification of the abundance of B and T cells at each developmental timepoint expressed on a log (Rodríguez-Castillo et al., 2018) scale as percentage of total immune cells.
(B) Quantification of the percentage of proliferating B cells at each developmental timepoint. (C) B cell heavy and light variable (V) and joining (J) gene identity and their cumulative cell fraction. (D) t-SNE plot of Ighm and Ighd, with the logarithmic color scale with a pseudocount of 0.1 counts per million, normalized to the highest expressing cell. (E–H) At P1 (n = 7 mice) and P21 (n = 8 mice), lungs were processed to a single-cell suspension, and flow cytometry was used to assess frequencies of (F) CD4+CD3+ and CD8+CD3+ T cells, (G) Gata3+, Tbet+, Rorγt+ and Foxp3+ CD4+ T cells, and (H) IL-4-producing Gata3+CD4+ T cells or IFNγ-producing Tbet+CD4+ T cells. Data shown as mean ± SD, **p<0.01, ****p<0.00001 by Student’s t test.
Figure 9—figure supplement 1
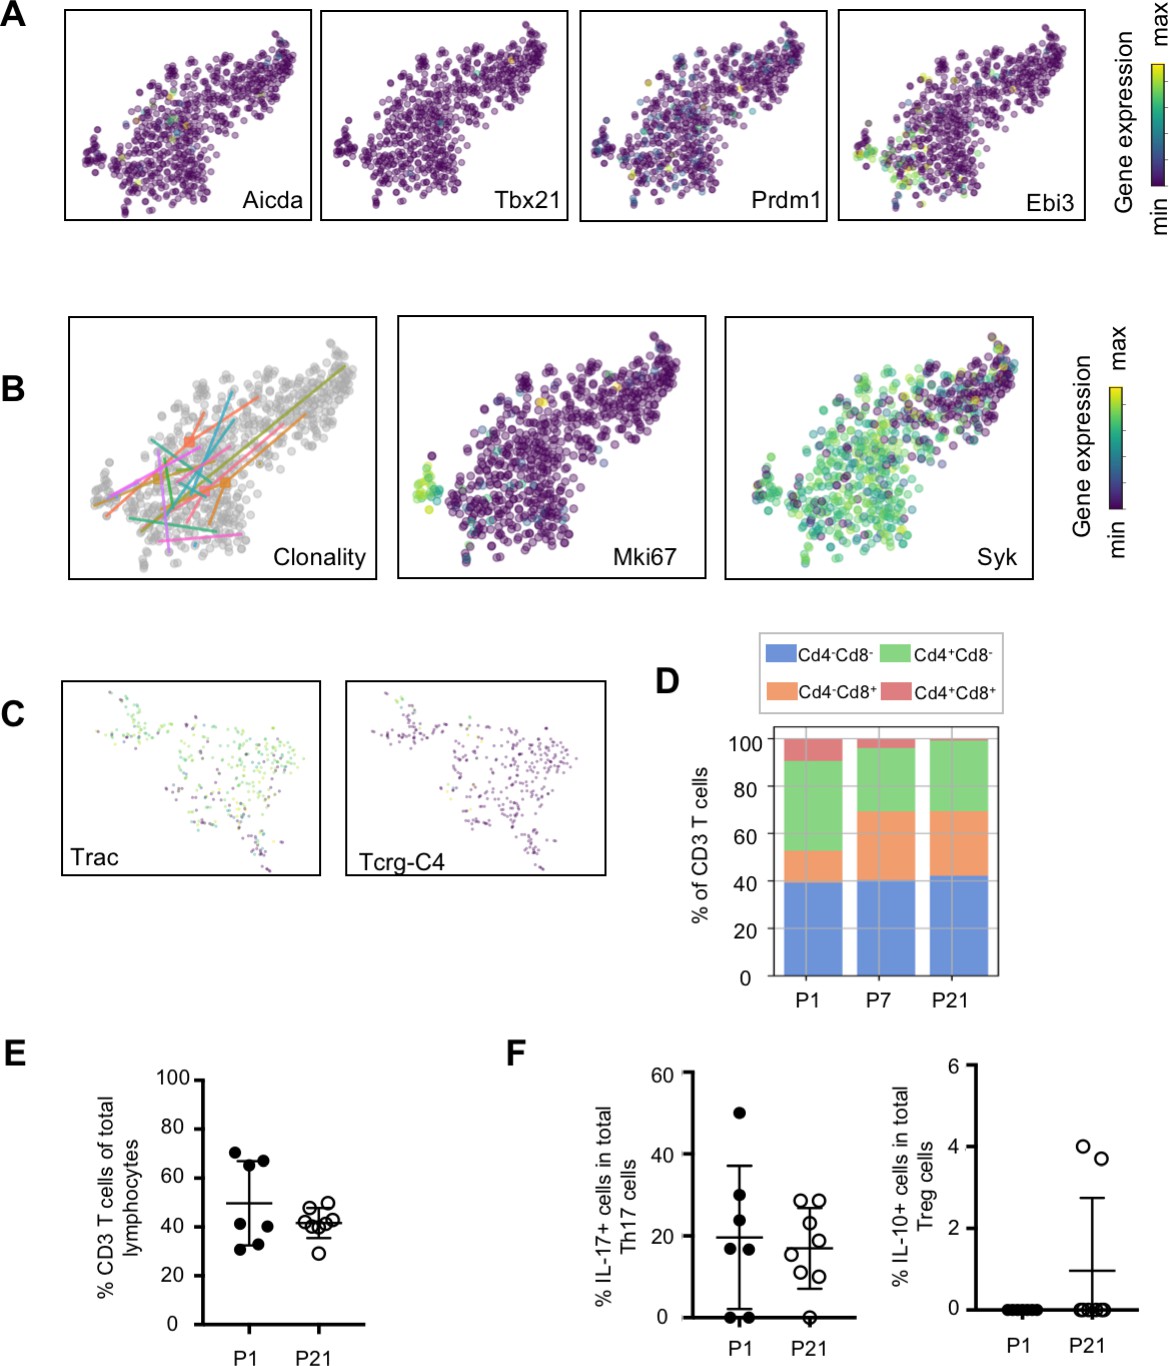
Transcriptional and flow cytometric profiling of lymphocytes.
t-SNE plots of (A) B cell-associated genes Aicda, Tbx21, Prdm1, and Ebi3. (B) Clonality and t-SNE plots of Mki67 and Syk within the B cell cluster. (C) t-SNE plots of T cell-associated genes Trac and Tcrg-C4. (D) Bar graph of the frequencies of Cd4+Cd8-, Cd4-Cd8+, Cd4-CD8-, and Cd4+Cd8+ T cells at P1, P7, and P21. (E-F) Flow cytometric analyses of murine lung cells isolated at P1 and P21 assessing the frequencies of (E) CD3+ lymphocytes and (F) Il-17-producing Th17 cells and IL-10-producing T regulatory cells.
Tables
Table 1
Top 35 differentially expressed genes in the Mac I cluster.
ScRNA-Seq was performed on live CD45+ lung cells isolated from E18.5, P1, P7 and P21 B6 pups. Top 35 upregulated genes are shown for the Mac I cluser; n = 2 mice.
| Mac I cluster top 35 differentially expressed genes | |||
|---|---|---|---|
| Gene name | Statistic | P value | Log2 fold change |
| Gal | 0.6133 | 5.42E-53 | 3.6207 |
| Crispld2 | 0.5 | 1.89E-34 | 3.6018 |
| Ncapd2 | 0.4567 | 1.40E-28 | 3.3349 |
| Pclaf | 0.49 | 4.88E-33 | 3.1388 |
| Mcm5 | 0.5067 | 2.07E-35 | 2.9792 |
| Cdca8 | 0.44 | 1.74E-26 | 2.8548 |
| Lig1 | 0.45 | 9.89E-28 | 2.7655 |
| AI506816 | 0.5233 | 7.05E-38 | 2.7046 |
| Asf1b | 0.4433 | 6.73E-27 | 2.5712 |
| Smc2 | 0.4367 | 4.44E-26 | 2.4042 |
| Fkbp5 | 0.5533 | 1.42E-42 | 2.3039 |
| Mcm7 | 0.44 | 1.74E-26 | 2.1166 |
| Cks1b | 0.45 | 9.89E-28 | 2.0842 |
| A930007I19Rik | 0.46 | 5.23E-29 | 2.0187 |
| Psat1 | 0.52 | 2.24E-37 | 2.0158 |
| Pfkl | 0.4467 | 2.59E-27 | 1.9417 |
| Ezh2 | 0.4433 | 6.73E-27 | 1.8453 |
| Dkc1 | 0.4733 | 9.21E-31 | 1.8027 |
| Cluh | 0.44 | 1.74E-26 | 1.7959 |
| Scd2 | 0.44 | 1.74E-26 | 1.7455 |
| Ruvbl2 | 0.4433 | 6.73E-27 | 1.7334 |
| Mif | 0.4933 | 1.67E-33 | 1.6941 |
| Tmem273 | 0.44 | 1.74E-26 | 1.628 |
| Stmn1 | 0.4433 | 6.73E-27 | 1.5905 |
| Spint1 | 0.5267 | 2.20E-38 | 1.5781 |
| Tpi1 | 0.5033 | 6.29E-35 | 1.562 |
| C230062I16Rik | 0.45 | 9.89E-28 | 1.5462 |
| Nt5dc2 | 0.4467 | 2.59E-27 | 1.5376 |
| Ran | 0.4567 | 1.40E-28 | 1.5078 |
| Trf | 0.5933 | 2.32E-49 | 1.4397 |
| Gcnt1 | 0.44 | 1.74E-26 | 1.4095 |
| Abcd2 | 0.46 | 5.23E-29 | 1.3537 |
| Anp32b | 0.47 | 2.56E-30 | 1.3418 |
| Dbi | 0.5167 | 7.04E-37 | 1.2018 |
| Atp5g3 | 0.52 | 2.24E-37 | 1.1808 |
Table 2
Top 35 differentially expressed genes in the Mac II cluster.
ScRNA-Seq was performed on live CD45+ lung cells isolated from E18.5, P1, P7 and P21 B6 pups. Top 35 upregulated genes are shown for the Mac II cluster; n = 2 mice.
| Mac II cluster top 35 differentially expressed genes | |||
|---|---|---|---|
| Gene name | Statistic | P value | Log2 fold change |
| Adgrl3 | 0.5713 | 8.85E-42 | 3.8593 |
| Adarb1 | 0.4216 | 5.92E-23 | 2.6952 |
| Ms4a8a | 0.4528 | 2.11E-26 | 2.4485 |
| Nav2 | 0.4751 | 4.97E-29 | 2.1319 |
| Tmcc3 | 0.4289 | 9.85E-24 | 2.0579 |
| Ldhb | 0.3809 | 8.26E-19 | 2.0235 |
| Acp5 | 0.3837 | 4.45E-19 | 2.0198 |
| Dapk1 | 0.3658 | 2.20E-17 | 1.8704 |
| Itgax | 0.5825 | 2.02E-43 | 1.8680 |
| Csf2rb2 | 0.3459 | 1.11E-16 | 1.7791 |
| H2-DMa | 0.5022 | 2.22E-32 | 1.7642 |
| Trerf1 | 0.3850 | 3.31E-19 | 1.7402 |
| Dmxl2 | 0.4117 | 6.59E-22 | 1.7264 |
| Tgm2 | 0.3663 | 1.99E-17 | 1.6906 |
| Ear2 | 0.5159 | 3.79E-34 | 1.6602 |
| Dok2 | 0.3695 | 1.00E-17 | 1.6373 |
| Flt1 | 0.3655 | 2.34E-17 | 1.5457 |
| Axl | 0.5068 | 5.74E-33 | 1.4698 |
| AU020206 | 0.3723 | 5.40E-18 | 1.4207 |
| Ece1 | 0.3962 | 2.54E-20 | 1.4075 |
| Ear10 | 0.3938 | 4.41E-20 | 1.4069 |
| Il18 | 0.4084 | 1.46E-21 | 1.4021 |
| Clec7a | 0.4959 | 1.37E-31 | 1.3413 |
| Spint1 | 0.3724 | 5.29E-18 | 1.3407 |
| Mpeg1 | 0.5454 | 4.05E-38 | 1.3269 |
| Il1rn | 0.3463 | 1.11E-16 | 1.2922 |
| Clec4n | 0.4454 | 1.45E-25 | 1.2765 |
| Fn1 | 0.4088 | 1.34E-21 | 1.2497 |
| Il1b | 0.4002 | 1.02E-20 | 1.2281 |
| Dst | 0.4484 | 6.72E-26 | 1.1994 |
| F11r | 0.4129 | 4.97E-22 | 1.1982 |
| Nceh1 | 0.3548 | 2.24E-16 | 1.1299 |
| Neurl3 | 0.3721 | 5.74E-18 | 1.1091 |
| Tnfaip2 | 0.3785 | 1.40E-18 | 1.0880 |
| Plet1 | 0.4461 | 1.23E-25 | 1.0845 |
Table 3
Top 35 differentially expressed genes in the Mac III cluster.
ScRNA-Seq was performed on live CD45+ lung cells isolated from E18.5, P1, P7 and P21 B6 pups. Top 35 upregulated genes are shown for Mac III cluster; n = 2 mice.
| Mac III cluster top 35 differentially expressed genes | |||
|---|---|---|---|
| Gene name | Statistic | P value | Log2 fold change |
| Slc39a2 | 0.6600 | 3.98E-62 | 9.2983 |
| Atp6v0d2 | 0.9533 | 1.14E-151 | 7.1784 |
| Krt19 | 0.7533 | 1.56E-83 | 6.8066 |
| Cd200r4 | 0.7533 | 1.56E-83 | 5.9139 |
| Gpnmb | 0.6967 | 5.32E-70 | 5.0666 |
| Ear1 | 0.6267 | 1.66E-55 | 4.9379 |
| Car4 | 0.7500 | 1.10E-82 | 4.6965 |
| Ly75 | 0.7867 | 2.26E-92 | 4.4964 |
| Bhlhe41 | 0.7800 | 1.51E-90 | 4.4452 |
| Slc7a2 | 0.7933 | 3.16E-94 | 4.1798 |
| Lrp12 | 0.6533 | 9.21E-61 | 3.7640 |
| Ccl6 | 0.8700 | 4.58E-118 | 3.7161 |
| Spp1 | 0.6267 | 1.66E-55 | 3.4907 |
| Serpinb1a | 0.6600 | 3.98E-62 | 3.4778 |
| Mgll | 0.8067 | 4.96E-98 | 3.4554 |
| Il1rn | 0.6567 | 1.93E-61 | 3.2640 |
| Kcnn3 | 0.7600 | 3.03E-85 | 3.2372 |
| Ralgds | 0.7000 | 9.49E-71 | 3.1251 |
| Dst | 0.7633 | 4.13E-86 | 3.1042 |
| Atp10a | 0.6600 | 3.98E-62 | 3.0453 |
| Ccnd2 | 0.7233 | 3.77E-76 | 2.9813 |
| Fabp5 | 0.6233 | 7.18E-55 | 2.9667 |
| Cd36 | 0.7600 | 3.03E-85 | 2.9174 |
| Vat1 | 0.7467 | 7.57E-82 | 2.8682 |
| Myof | 0.7600 | 3.03E-85 | 2.8483 |
| Plet1 | 0.7567 | 2.19E-84 | 2.7934 |
| Hvcn1 | 0.6967 | 5.32E-70 | 2.7689 |
| Fth-ps3 | 0.6933 | 2.94E-69 | 2.7627 |
| Lima1 | 0.6533 | 9.21E-61 | 2.7359 |
| Itgax | 0.7567 | 2.19E-84 | 2.7210 |
| Card11 | 0.6367 | 1.93E-57 | 2.6520 |
| Mir692-2 | 0.7567 | 2.19E-84 | 2.5974 |
| Ctsd | 0.8167 | 5.70E-101 | 2.5402 |
| Klhdc4 | 0.6500 | 4.35E-60 | 2.5367 |
| Mir692-1 | 0.6500 | 4.35E-60 | 2.4553 |
Table 4
Top 35 differentially expressed genes in the Mac IV cluster.
ScRNA-Seq was performed on live CD45+ lung cells isolated from E18.5, P1, P7 and P21 B6 pups. Top 35 upregulated genes are shown for the Mac IV cluster; n = 2 mice.
| Mac IV cluster top 35 differentially expressed genes | |||
|---|---|---|---|
| Gene name | Statistic | P value | Log2 fold change |
| Fcrls | 0.7367 | 2.28E-79 | 12.2139 |
| Pf4 | 0.7900 | 2.70E-93 | 11.4117 |
| Gas6 | 0.6433 | 9.38E-59 | 9.6283 |
| C1qc | 0.8733 | 3.18E-119 | 9.1247 |
| Ccl12 | 0.6400 | 4.28E-58 | 8.7381 |
| C1qa | 0.8700 | 4.58E-118 | 8.3676 |
| Stab1 | 0.8033 | 4.55E-97 | 7.6076 |
| C1qb | 0.8600 | 1.17E-114 | 7.0450 |
| Sdc4 | 0.7200 | 2.32E-75 | 6.3860 |
| Igfbp4 | 0.7433 | 5.15E-81 | 6.2878 |
| Ms4a7 | 0.7200 | 2.32E-75 | 6.0618 |
| Slc40a1 | 0.6033 | 3.72E-51 | 6.0358 |
| Tmem176b | 0.8600 | 1.17E-114 | 5.5402 |
| Maf | 0.7500 | 1.10E-82 | 5.4450 |
| S1pr1 | 0.6367 | 1.93E-57 | 5.3458 |
| Igf1 | 0.6700 | 3.28E-64 | 4.8862 |
| Tmem37 | 0.5900 | 9.02E-49 | 4.8077 |
| Ophn1 | 0.5933 | 2.32E-49 | 4.6672 |
| Tmem176a | 0.7167 | 1.41E-74 | 4.6367 |
| C3ar1 | 0.7100 | 4.98E-73 | 4.5725 |
| Smagp | 0.6700 | 3.28E-64 | 4.5052 |
| Cxcl16 | 0.5800 | 4.98E-47 | 4.2439 |
| Sesn1 | 0.5633 | 3.27E-44 | 4.0183 |
| Apoe | 0.7600 | 3.03E-85 | 4.0149 |
| Hpgds | 0.6333 | 8.62E-57 | 3.9920 |
| Lgmn | 0.7267 | 6.04E-77 | 3.9551 |
| Ms4a4a | 0.5667 | 9.10E-45 | 3.5567 |
| Selenop | 0.6200 | 3.07E-54 | 3.4452 |
| Cx3cr1 | 0.6000 | 1.49E-50 | 3.3845 |
| Abca1 | 0.5433 | 5.69E-41 | 3.2834 |
| Tcf4 | 0.5433 | 5.69E-41 | 3.1404 |
| Blvrb | 0.5533 | 1.42E-42 | 3.1103 |
| Aif1 | 0.6933 | 2.94E-69 | 3.0826 |
| Abca9 | 0.5833 | 1.32E-47 | 3.0325 |
| Pea15a | 0.5400 | 1.91E-40 | 3.0198 |
Table 5
Top 35 differentially expressed genes in the Mac V cluster.
ScRNA-Seq was performed on live CD45+ lung cells isolated from E18.5, P1, P7 and P21 B6 pups. Top 35 upregulated genes are shown for the Mac V cluster; n = 2 mice.
| Mac V cluster top 35 differentially expressed genes | |||
|---|---|---|---|
| Gene name | Statistic | P value | Log2 fold change |
| I830127L07Rik | 0.4867 | 1.42E-32 | 7.0634 |
| Ifitm6 | 0.8800 | 1.41E-121 | 6.9362 |
| Pglyrp1 | 0.6867 | 8.67E-68 | 6.2150 |
| Serpinb10 | 0.5333 | 2.09E-39 | 6.1537 |
| Plac8 | 0.9600 | 6.02E-155 | 5.9647 |
| Adgre4 | 0.6033 | 3.72E-51 | 5.8672 |
| Nxpe4 | 0.5000 | 1.89E-34 | 4.8441 |
| Ifitm3 | 0.9267 | 1.17E-139 | 4.6727 |
| Plbd1 | 0.7267 | 6.04E-77 | 3.9525 |
| Susd3 | 0.5033 | 6.29E-35 | 3.9210 |
| Hp | 0.6333 | 8.62E-57 | 3.8550 |
| Pmaip1 | 0.4767 | 3.29E-31 | 3.7016 |
| Adgre5 | 0.7500 | 1.10E-82 | 3.5335 |
| Ifi27l2a | 0.5667 | 9.10E-45 | 3.3416 |
| Atp1a3 | 0.4900 | 4.88E-33 | 3.3206 |
| Ifitm2 | 0.7600 | 3.03E-85 | 3.2359 |
| Xdh | 0.4833 | 4.07E-32 | 3.2003 |
| Pou2f2 | 0.4733 | 9.21E-31 | 3.1216 |
| Rnase6 | 0.5067 | 2.07E-35 | 3.0629 |
| Pla2g7 | 0.6800 | 2.43E-66 | 3.0556 |
| Thbs1 | 0.5767 | 1.86E-46 | 3.0133 |
| Itga4 | 0.6600 | 3.98E-62 | 2.9055 |
| Itgam | 0.5500 | 4.91E-42 | 2.7702 |
| Napsa | 0.6000 | 1.49E-50 | 2.6112 |
| Sorl1 | 0.5033 | 6.29E-35 | 2.5328 |
| Wfdc17 | 0.4967 | 5.64E-34 | 2.5299 |
| Clec4a1 | 0.5300 | 6.81E-39 | 2.4922 |
| Slc11a1 | 0.5267 | 2.20E-38 | 2.4649 |
| Fyb | 0.6400 | 4.28E-58 | 2.4454 |
| Srgn | 0.6633 | 8.14E-63 | 2.2151 |
| Cnn2 | 0.4933 | 1.67E-33 | 2.1880 |
| Samhd1 | 0.6167 | 1.30E-53 | 2.1715 |
| Lst1 | 0.6667 | 1.65E-63 | 2.1340 |
| Cd300a | 0.5100 | 6.78E-36 | 2.1007 |
| Nr4a1 | 0.6100 | 2.24E-52 | 2.0001 |
Table 6
Top 20 differentially expressed genes in the Mig-DC vs cDC2 cluster.
ScRNA-Seq was performed on live CD45+ lung cells isolated from E18.5, P1, P7 and P21 B6 pups. Top 20 differentially expressed genes are shown for the migDC vs cDC2 cluster; n = 2 mice.
| Mig-DC versus cDC2 cluster top 20 differentially expressed genes | |||
|---|---|---|---|
| Gene name | Statistic | P. value | Log2 fold change |
| Ccl5 | 1.0000 | 3.45E-13 | 16.9849 |
| Il12b | 0.7857 | 6.97E-07 | 15.3906 |
| Fscn1 | 1.0000 | 3.45E-13 | 14.5028 |
| Nudt17 | 0.9286 | 2.48E-10 | 13.7990 |
| Zmynd15 | 0.9286 | 2.48E-10 | 13.5523 |
| Il15ra | 0.9286 | 2.48E-10 | 13.5174 |
| Cacnb3 | 1.0000 | 3.45E-13 | 13.4891 |
| Cd63-ps | 1.0000 | 3.45E-13 | 13.4587 |
| H2-M2 | 0.8571 | 2.06E-08 | 13.4381 |
| Tnfrsf4 | 0.7143 | 1.31E-05 | 13.4073 |
| Serpinb6b | 0.9286 | 2.48E-10 | 13.2991 |
| AW112010 | 0.8571 | 2.06E-08 | 13.1876 |
| Laptm4b | 0.8571 | 2.06E-08 | 12.9752 |
| Lad1 | 0.7143 | 1.31E-05 | 12.8948 |
| Cd63 | 1.0000 | 3.45E-13 | 12.8680 |
| Dnase1l3 | 0.7143 | 1.31E-05 | 12.7389 |
| Apol7c | 0.5000 | 7.75E-03 | 12.7302 |
| Tm4sf5 | 0.5000 | 7.75E-03 | 12.6086 |
| Spint2 | 0.9286 | 2.48E-10 | 12.2644 |
| Zfp872 | 0.6429 | 1.57E-04 | 11.4802 |
Table 7
Top 20 differentially expressed genes in the Mig-DC vs cDC1 cluster.
ScRNA-Seq was performed on live CD45+ lung cells isolated from E18.5, P1, P7 and P21 B6 pups. Top 20 differentially expressed genes are shown for the mig-DC vs cDC1 cluster; n = 2 mice.
| Mig-DC versus cDC1 cluster top 20 differentially expressed genes | |||
|---|---|---|---|
| Gene name | Statistic | P. value | Log2 fold change |
| H2-M2 | 0.8571 | 2.34E-09 | 14.0574 |
| Tnfrsf4 | 0.7143 | 3.71E-06 | 13.6282 |
| Zfp872 | 0.6429 | 5.96E-05 | 11.348 |
| Arc | 0.7143 | 3.71E-06 | 10.9369 |
| Gbp8 | 0.6429 | 5.96E-05 | 10.6692 |
| Ramp3 | 0.5 | 4.51E-03 | 10.6263 |
| Insl6 | 0.6429 | 5.96E-05 | 10.5787 |
| Gbp4 | 0.9286 | 1.19E-11 | 10.4833 |
| Adcy6 | 0.8201 | 2.13E-08 | 10.4176 |
| Atxn1 | 0.7143 | 3.71E-06 | 10.3352 |
| Ankrd33b | 0.9286 | 1.19E-11 | 10.1242 |
| Dscaml1 | 0.6429 | 5.96E-05 | 9.8945 |
| Src | 0.5 | 4.51E-03 | 9.7618 |
| Tmem150c | 0.6429 | 5.96E-05 | 9.566 |
| Slc4a8 | 0.7116 | 4.01E-06 | 9.5518 |
| Nudt17 | 0.9101 | 6.10E-11 | 9.5137 |
| Il21r | 0.6958 | 7.81E-06 | 9.3355 |
| Fas | 0.6243 | 1.12E-04 | 9.3023 |
| Clec2i | 0.5 | 4.51E-03 | 9.2653 |
| Cacnb3 | 0.9815 | 2.44E-13 | 8.6751 |
Table 8
Top 20 differentially expressed genes in the cDC2 vs cDC1 cluster.
ScRNA-Seq was performed on live CD45+ lung cells isolated from E18.5, P1, P7 and P21 B6 pups. Top 20 differentially expressed genes are shown for the cDC2 vs cDC1 cluster; n = 2 mice.
| cDC2 versus cDC1 cluster top 20 differentially expressed genes | |||
|---|---|---|---|
| Gene name | Statistic | P. value | Log2 fold change |
| Mgl2 | 0.7857 | 5.55E-15 | 12.5236 |
| Cd209d | 0.5476 | 4.76E-07 | 12.1889 |
| Cd209b | 0.3333 | 7.77E-03 | 12.1445 |
| Ms4a6d | 0.5714 | 1.14E-07 | 11.7772 |
| Ms4a4c | 0.5476 | 4.76E-07 | 11.2462 |
| Plaur | 0.3810 | 1.42E-03 | 11.0707 |
| Casp4 | 0.3810 | 1.42E-03 | 10.0788 |
| Il1rl1 | 0.6190 | 5.17E-09 | 10.0357 |
| Cd300lg | 0.3333 | 7.77E-03 | 9.9463 |
| Cd33 | 0.4762 | 2.21E-05 | 9.7976 |
| Emilin2 | 0.4048 | 5.52E-04 | 9.5336 |
| Il1rl2 | 0.3810 | 1.42E-03 | 9.5332 |
| Creb5 | 0.3915 | 9.39E-04 | 9.2747 |
| Cd209c | 0.4762 | 2.21E-05 | 9.0161 |
| Cd209a | 0.9577 | 3.33E-16 | 9.0160 |
| Ccl9 | 0.6772 | 7.43E-11 | 9.0010 |
| Fcrls | 0.3810 | 1.42E-03 | 8.9226 |
| Il18rap | 0.3915 | 9.39E-04 | 8.7118 |
| Wfdc17 | 0.7249 | 1.46E-12 | 8.5219 |
| Tent5a | 0.6534 | 4.52E-10 | 8.2999 |
Table 9
Top 25 differentially expressed genes in the mast cell cluster.
ScRNA-Seq was performed on live CD45+ lung cells isolated from E18.5, P1, P7 and P21 B6 pups. Top 25 upregulated genes are shown for the mast cell cluster; n = 2 mice.
| Mast cell top 25 differentially expressed genes | |||
|---|---|---|---|
| Gene name | Statistic | P. value | Log2 fold change |
| Tpsb2 | 1.0000 | 8.9E-16 | 18.7534 |
| Mcpt4 | 0.8750 | 2.4E-07 | 17.4253 |
| Tpsab1 | 0.8750 | 2.4E-07 | 15.5899 |
| Cma1 | 1.0000 | 8.9E-16 | 15.0710 |
| Slc45a3 | 0.7500 | 5.2E-05 | 11.7029 |
| Rprm | 0.8750 | 2.4E-07 | 11.6969 |
| Hs6st2 | 0.7500 | 5.2E-05 | 11.1665 |
| Maob | 0.8683 | 3.4E-07 | 10.7834 |
| Cpa3 | 0.9900 | 1.8E-13 | 10.6394 |
| Ednra | 0.7500 | 5.2E-05 | 10.2131 |
| Gata1 | 0.7500 | 5.2E-05 | 10.0639 |
| Kit | 1.0000 | 8.9E-16 | 9.2771 |
| Mlph | 0.7467 | 5.9E-05 | 8.5668 |
| Cma2 | 0.7500 | 5.2E-05 | 8.5455 |
| Cyp11a1 | 0.9933 | 4.9E-14 | 8.4308 |
| Tph1 | 0.8717 | 2.8E-07 | 8.3091 |
| Rab27b | 0.8717 | 2.8E-07 | 8.1436 |
| Il1rl1 | 0.9733 | 1.4E-11 | 7.7399 |
| Itga2b | 0.8350 | 1.8E-06 | 7.6658 |
| Gata2 | 0.9933 | 4.9E-14 | 7.5597 |
| Poln | 0.7367 | 8.2E-05 | 7.2024 |
| Slc18a2 | 0.9600 | 1.4E-10 | 6.8570 |
| Stard13 | 0.7467 | 5.9E-05 | 6.7772 |
| Adora3 | 0.7033 | 2.3E-04 | 6.4180 |
| Kcne3 | 0.8050 | 6.6E-06 | 6.4033 |
Table 10
Top 25 differentially expressed genes in the basophil cluster.
ScRNA-Seq was performed on live CD45+ lung cells isolated from E18.5, P1, P7 and P21 B6 pups. Top 25 upregulated genes are shown for the basophil cluster; n = 2 mice.
| Basophil top 25 differentially expressed genes | |||
|---|---|---|---|
| Gene name | Statistic | P. value | Log2 fold change |
| Mcpt8 | 0.7347 | 2.22E-16 | 15.6663 |
| Ms4a2 | 0.8676 | 2.22E-16 | 12.3460 |
| Gata2 | 0.9084 | 2.22E-16 | 9.7841 |
| Il4 | 0.6872 | 2.22E-16 | 8.7980 |
| Cd200r3 | 0.9525 | 2.22E-16 | 8.6767 |
| Il6 | 0.8309 | 2.22E-16 | 8.5795 |
| Ccl4 | 0.9021 | 2.22E-16 | 7.0748 |
| Ifitm1 | 0.9363 | 2.22E-16 | 6.8128 |
| Cyp11a1 | 0.9729 | 2.22E-16 | 6.6271 |
| Ccl3 | 0.9225 | 2.22E-16 | 5.9632 |
| Hgf | 0.7326 | 2.22E-16 | 5.7653 |
| Csf1 | 0.8921 | 2.22E-16 | 5.4838 |
| Ccl9 | 0.8825 | 2.22E-16 | 5.3108 |
| Ifitm7 | 0.7559 | 2.22E-16 | 5.1284 |
| Aqp9 | 0.7563 | 2.22E-16 | 5.0857 |
| Rab44 | 0.6534 | 2.22E-16 | 5.0335 |
| Hdc | 0.9133 | 2.22E-16 | 4.9976 |
| Cd69 | 0.7454 | 2.22E-16 | 4.9828 |
| Cdh1 | 0.7197 | 2.22E-16 | 4.9643 |
| Il18r1 | 0.6539 | 2.22E-16 | 4.5920 |
| Csf2rb2 | 0.6930 | 2.22E-16 | 4.3472 |
| Lilr4b | 0.8788 | 2.22E-16 | 4.1383 |
| Rgs1 | 0.7001 | 2.22E-16 | 4.0712 |
| Il18rap | 0.7571 | 2.22E-16 | 4.0030 |
| Osm | 0.6559 | 2.22E-16 | 3.6933 |
Table 11
Top 25 differentially expressed genes in the neutrophil cluster.
ScRNA-Seq was performed on live CD45+ lung cells isolated from E18.5, P1, P7 and P21 B6 pups. Top 25 upregulated genes are shown for the neutrophil cluster; n = 2 mice.
| Neutrophil top 25 differentially expressed genes | |||
|---|---|---|---|
| Gene name | Statistic | P. value | Log2 fold change |
| Retnlg | 0.7833 | 1.9E-91 | 16.7841 |
| Stfa2 | 0.9067 | 1.6E-131 | 13.3347 |
| BC100530 | 0.9033 | 3.1E-130 | 11.5407 |
| Mmp9 | 0.8867 | 5.5E-124 | 11.2071 |
| Asprv1 | 0.7500 | 1.1E-82 | 10.6669 |
| Stfa2l1 | 0.9300 | 4.5E-141 | 8.5427 |
| S100a9 | 0.9567 | 2.7E-153 | 8.3546 |
| 2010005H15Rik | 0.8467 | 2.9E-110 | 8.1305 |
| BC117090 | 0.8800 | 1.4E-121 | 7.8635 |
| Slpi | 0.8767 | 2.1E-120 | 7.5069 |
| Stfa1 | 0.8967 | 1.1E-127 | 6.8526 |
| Il1r2 | 0.7133 | 8.4E-74 | 6.6465 |
| S100a8 | 0.9467 | 1.6E-148 | 6.2103 |
| Slc7a11 | 0.6933 | 2.9E-69 | 5.9640 |
| Csf3r | 0.7400 | 3.5E-80 | 5.7411 |
| Cxcr2 | 0.7433 | 5.2E-81 | 5.6599 |
| Wfdc21 | 0.7733 | 9.5E-89 | 5.3370 |
| Pglyrp1 | 0.8367 | 4.4E-107 | 4.9416 |
| Mxd1 | 0.6800 | 2.4E-66 | 4.5560 |
| Hdc | 0.8267 | 5.5E-104 | 4.2867 |
| Grina | 0.7033 | 1.7E-71 | 4.0795 |
| Il1b | 0.6567 | 1.9E-61 | 3.8434 |
| Thbs1 | 0.6733 | 6.5E-65 | 2.7913 |
| S100a11 | 0.7600 | 3.0E-85 | 2.6263 |
| Srgn | 0.6600 | 4.0E-62 | 2.3914 |
Key resources table
| Reagent type (species) or resource | Designation | Source or reference | Identifiers | Additional information |
|---|---|---|---|---|
| Strain, strain background (M. musculus) | C57BL/6J | Charles Rivers Laboratories | ||
| Antibody | anti-CD3e (Hamster monoclonal) | BD Biosciences | Cat# 553062; RRID:AB_394595 | FACS (1:100) |
| Antibody | anti-CD4 (Rat monoclonal) | BD Biosciences | Cat# 552051; RRID:AB_394331 | FACS (1:100) |
| Antibody | anti- CD8a (Rat monoclonal) | BioLegend | Cat# 100721; RRID:AB_312760 | FACS (1:100) |
| Antibody | anti-Tbet (Mouse monoclonal) | BioLegend | Cat# 644808; RRID:AB_15955479 | FACS (1:100) |
| Antibody | anti-GATA3 (Mouse monoclonal) | BD Biosciences | Cat# 563510; RRID:AB_2738248 | FACS (1:100) |
| Antibody | anti-Foxp3 (Rat monoclonal) | eBioscience | Cat# 12-5773-82; RRID:AB_465936 | FACS (1:100) |
| Antibody | anti-Rorγt (Mouse monoclonal) | BD Biosciences | Cat# 562607; RRID:AB_11153137 | FACS (1:100) |
| Antibody | anti-IFNγ (Rat monoclonal) | BioLegend | Cat# 505829; RRID:AB_10897937 | FACS (1:100) |
| Antibody | anti-IL-4 (Rat monoclonal) | BD Biosciences | Cat# 562045; RRID:AB_10895799 | FACS (1:100) |
| Antibody | IL-10 (Rat monoclonal) | BioLegend | Cat# 505027; RRID:AB_2561522 | FACS (1:100) |
| Antibody | IL-17 (Rat monoclonal) | Miltenyi Biotec | Cat# 130-095-732; RRID:AB_10828821 | FACS (1:100) |
| Commercial assay or kit | FISH probe: anti-mouse Plac8 | Advanced Cell Diagnostics (ADC) | Cat# 532701 | RNAscope: 50 μl per slide |
| Commercial assay or kit | FISH probe: anti-mouse Dab2 | ADC | Cat# 558131-C2 | RNAscope: (1 μl per 50 μl) |
| Commercial assay or kit | FISH probe: anti-mouse Cd68 | ADC | Cat# 316611-C2 | RNAscope: (1 μl per 50 μl) |
| Commercial assay or kit | FISH probe: anti-mouse-Cd68 | ADC | Cat# 316611-C3 | RNAscope: (1 μl per 50 μl) |
| Commercial assay or kit | FISH probe: anti-mouse-Cd68 | ADC | Cat# 316611 | RNAscope: 50 μl per slide |
| Commercial assay or kit | FISH probe: anti-mouse-Cdh5 | ADC | Cat# 312531-C2 | RNAscope: (1 μl per 50 μl) |
| Commercial assay or kit | FISH probe: anti-mouse-Mki67 | ADC | Cat# 416771-C2 | RNAscope: (1 μl per 50 μl) |
| Commercial assay or kit | FISH probe: anti-mouse-Car4 | ADC | Cat# 468421-C2 | RNAscope: (1 μl per 50 μl) |
| Commercial assay or kit | FISH probe: anti-mouse-Gal | ADC | Cat# 400961-C2 | RNAscope: (1 μl per 50 μl) |
| Commercial assay or kit | FISH probe: anti-mouse-C1qa | ADC | Cat# 441221 | RNAscope: 50 μl per slide |
| Commercial assay or kit | FISH probe: anti-mouse-Epcam | ADC | Cat# 418151-C2 | RNAscope: (1 μl per 50 μl) |
| Commercial assay or kit | FISH probe: anti-mouse-Itgax | ADC | Cat# 311501-C3 | RNAscope: (1 μl per 50 μl) |
| Commercial assay or kit | FISH probe: anti-mouse-Ifitm6 | ADC | Cat# 511321-C3 | RNAscope: (1 μl per 50 μl) |
| Commercial assay or kit | FISH probe: anti-mouse-Lair1 | ADC | Cat# 509151 | RNAscope: 50 μl per slide |
| Commercial assay or kit | FISH probe: anti-mouse-Ccr2 | ADC | Cat# 501681 | RNAscope: 50 μl per slide |
Additional files
Download links
A two-part list of links to download the article, or parts of the article, in various formats.
Downloads (link to download the article as PDF)
Open citations (links to open the citations from this article in various online reference manager services)
Cite this article (links to download the citations from this article in formats compatible with various reference manager tools)
Diverse homeostatic and immunomodulatory roles of immune cells in the developing mouse lung at single cell resolution
eLife 9:e56890.
https://doi.org/10.7554/eLife.56890


