High glucose levels increase influenza-associated damage to the pulmonary epithelial-endothelial barrier
- School of Chemistry and Molecular Biosciences, The University of Queensland, Australia
- School of Biomedical Sciences, The University of Queensland, Australia
- Mater Research Institute, The University of Queensland, Translational Research Institute, Australia
- Australian Infectious Diseases Research Centre, The University of Queensland, Australia
- Institute for Molecular Bioscience, The University of Queensland, Australia
Figures
Figure 1 with 2 supplements
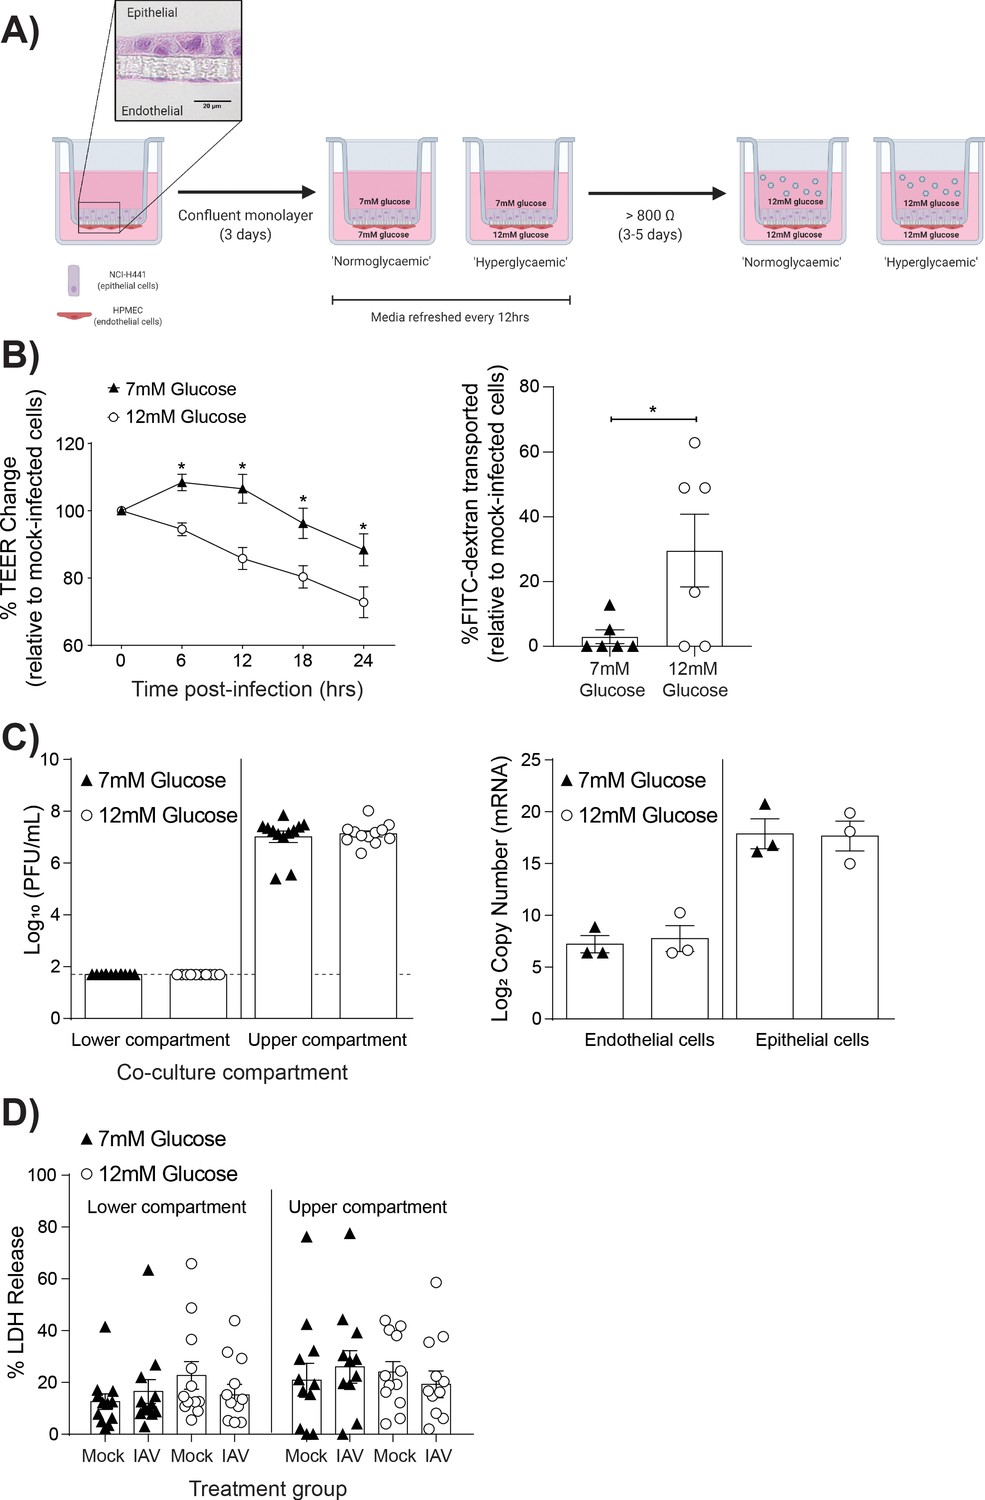
High glucose conditions increase IAV-induced barrier independent of cell death.
(A) Schematic representation of the in vitro co-culture model of the alveolar epithelial-endothelial barrier. Image created with Biorender. Micrograph (40x magnification) of transwell membrane. (B) Left: Measurement of co-culture barrier integrity using TEER (Ω) readings following infection with medium (‘mock’) or IAV. Data are expressed relative to the baseline TEER and the TEER of mock-infected cells at each time point. Statistical significance was determined using a two-way ANOVA with a Bonferroni post-test. Right: Permeability of co-cultures to FITC-dextran 24 hr post-infection. Data shows the percentage of FITC detected in the lower compartment relative to mock-infected wells (defined as 0). Statistical significance was determined using a Student’s t-test. (C) Left: PFU/mL of IAV detected in the lower and upper compartment of the co-culture 24 hr post-IAV infection. A dashed line indicates the detection limit of the assay. Right: mRNA detected by qPCR in epithelial and endothelial cells 24 hr post-IAV infection. Viral replication represented as viral copy number. Statistical significance was determined using a Student’s t-test. (D) Percentage release of LDH from co-cultured epithelial (upper compartment) and endothelial (lower compartment) cells at 24 hr post-infection. Statistical significance was determined using a Student’s t-test. All data are pooled from a minimum of three independent experiments (with six biological replicates per group) and are shown as mean ± SEM. *: p<0.05.
Figure 1—figure supplement 1
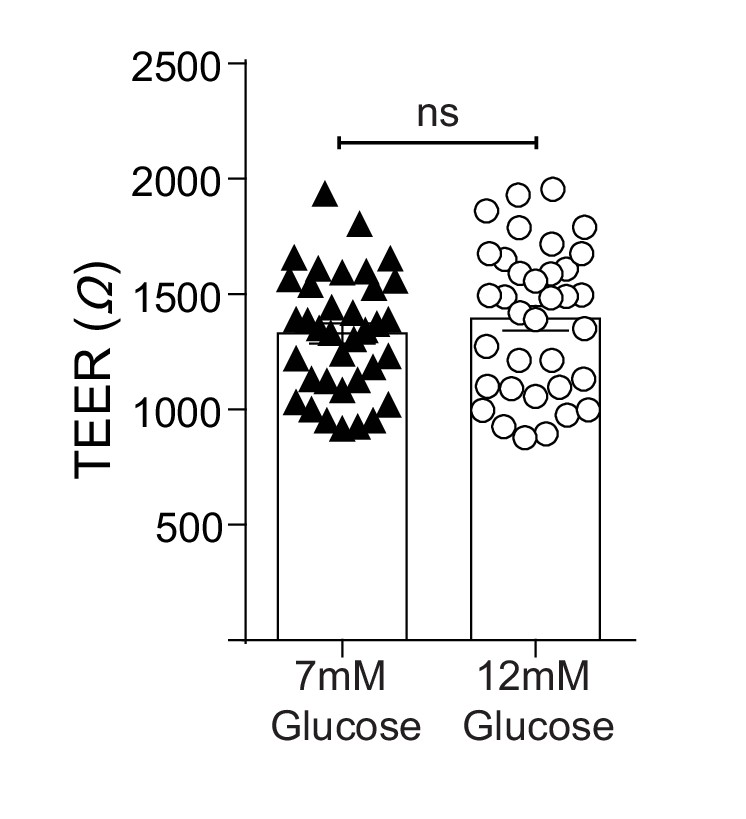
TEER (Ω) of epithelial-endothelial co-cultures following 3–5 days of different glucose concentrations in the lower compartment of the transwell.
All data are pooled from a minimum of three independent experiments (with 12 biological replicates per group) and are shown as mean ± SEM. Statistical analysis was performed using a Student’s unpaired t-test.
Figure 1—figure supplement 2
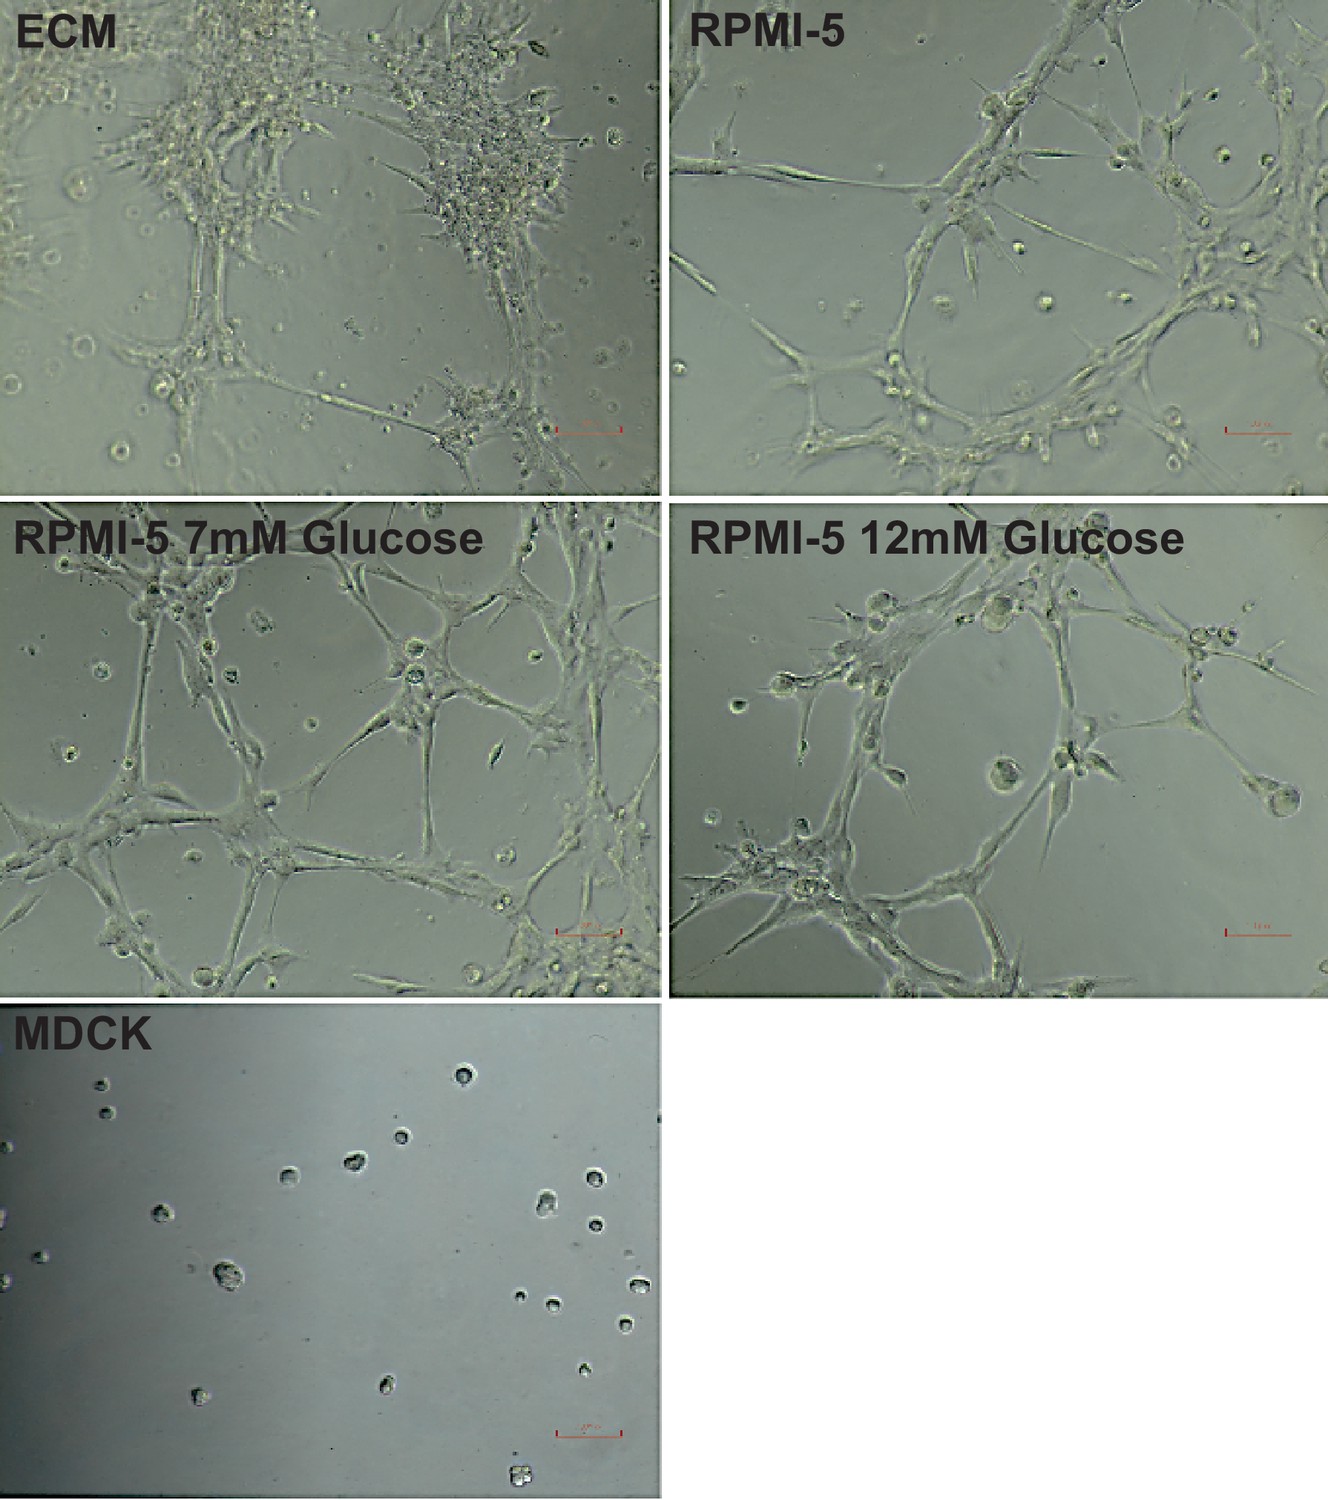
Tube formation of HPMECs under different media conditions.
Cells were cultured for 5 days in different media conditions and then seeded at a density of 7.5 × 10⁵ cells/mL on reduced growth factor basement membrane matrix. Tube formation was recorded after 3 hr. MDCK cells were subject to the same conditions and used as a negative control.
Figure 2 with 1 supplement
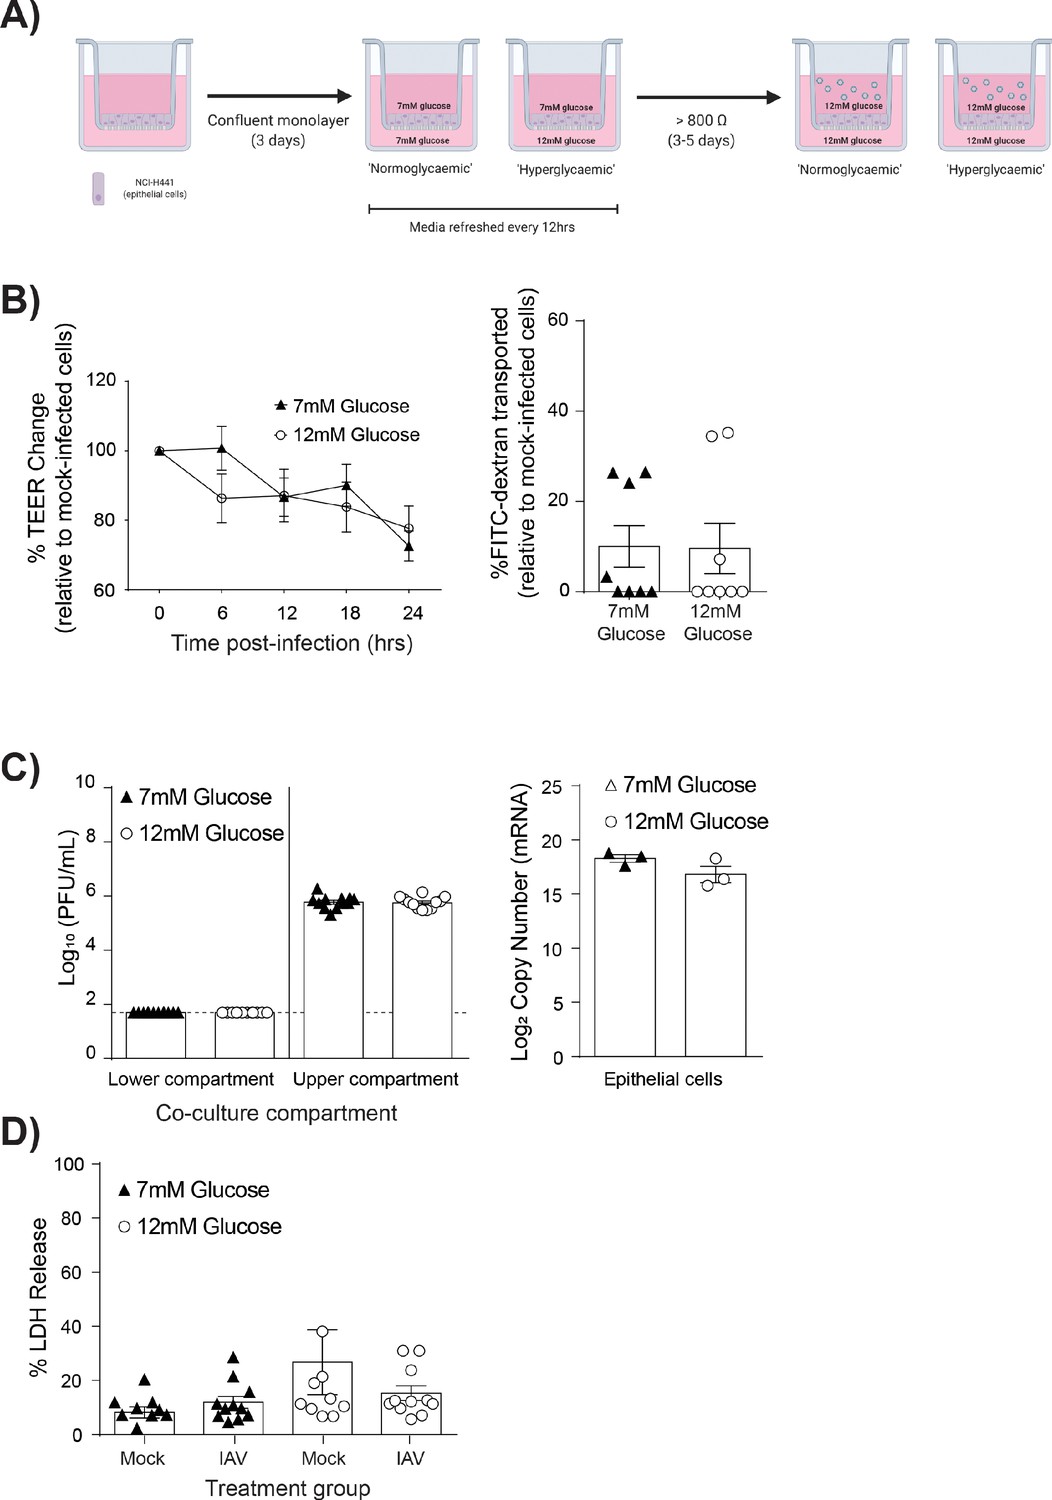
IAV-induced barrier damage in high glucose condition is dependent upon the presence of endothelial cells.
(A) Schematic representation of the in vitro mono-culture model of the alveolar epithelial-endothelial barrier. Image created with Biorender. (B) Left: Measurement of epithelial mono-culture barrier integrity using TEER (Ω) readings following infection with medium (‘mock’) or IAV. Data are expressed relative to the baseline TEER and the TEER of mock-infected cells at each time point. Statistical significance was determined using a two-way ANOVA with a Bonferroni post-test. Right: Permeability of epithelial mono-culture to FITC-dextran 24 hr post-infection. Data show the percentage of FITC detected in the lower compartment relative to mock-infected wells (defined as 0). Infected wells that had less detected FITC than mock-infected were set to 0. Statistical significance was determined using a Student’s unpaired t-test. (C) Left: PFU/mL of IAV detected in the lower compartment and upper compartment 24 hr post-IAV infection. A dashed line indicates the detection limit of the assay. Right: mRNA detected by qPCR in epithelial cells 24 hr post-IAV infection. Viral replication represented as viral copy. Statistical significance was determined using a Student’s unpaired t-test. (D) Percentage release of LDH from mono-culture epithelial (upper compartment) cells at 24 hr post-infection. Statistical significance was determined using a Student’s t-test. All data are pooled from a minimum of three independent experiments (with six biological replicates per group) and are shown as mean ± SEM. *: p<0.05.
Figure 2—figure supplement 1

Endothelial cells provide a stabilising effect on the integrity of the epithelial barrier.
Baseline TEER (Ω) of epithelial-endothelial co-cultures and epithelial mono-cultures following 3–4 days of media changes (prior to IAV infection). Data are pooled from a minimum of four independent experiments (each with 24 biological replicates per group) and shown as mean ± SEM. Statistical significance was determined using a Mann-Whitney test. *: p<0.05.
Figure 3 with 2 supplements
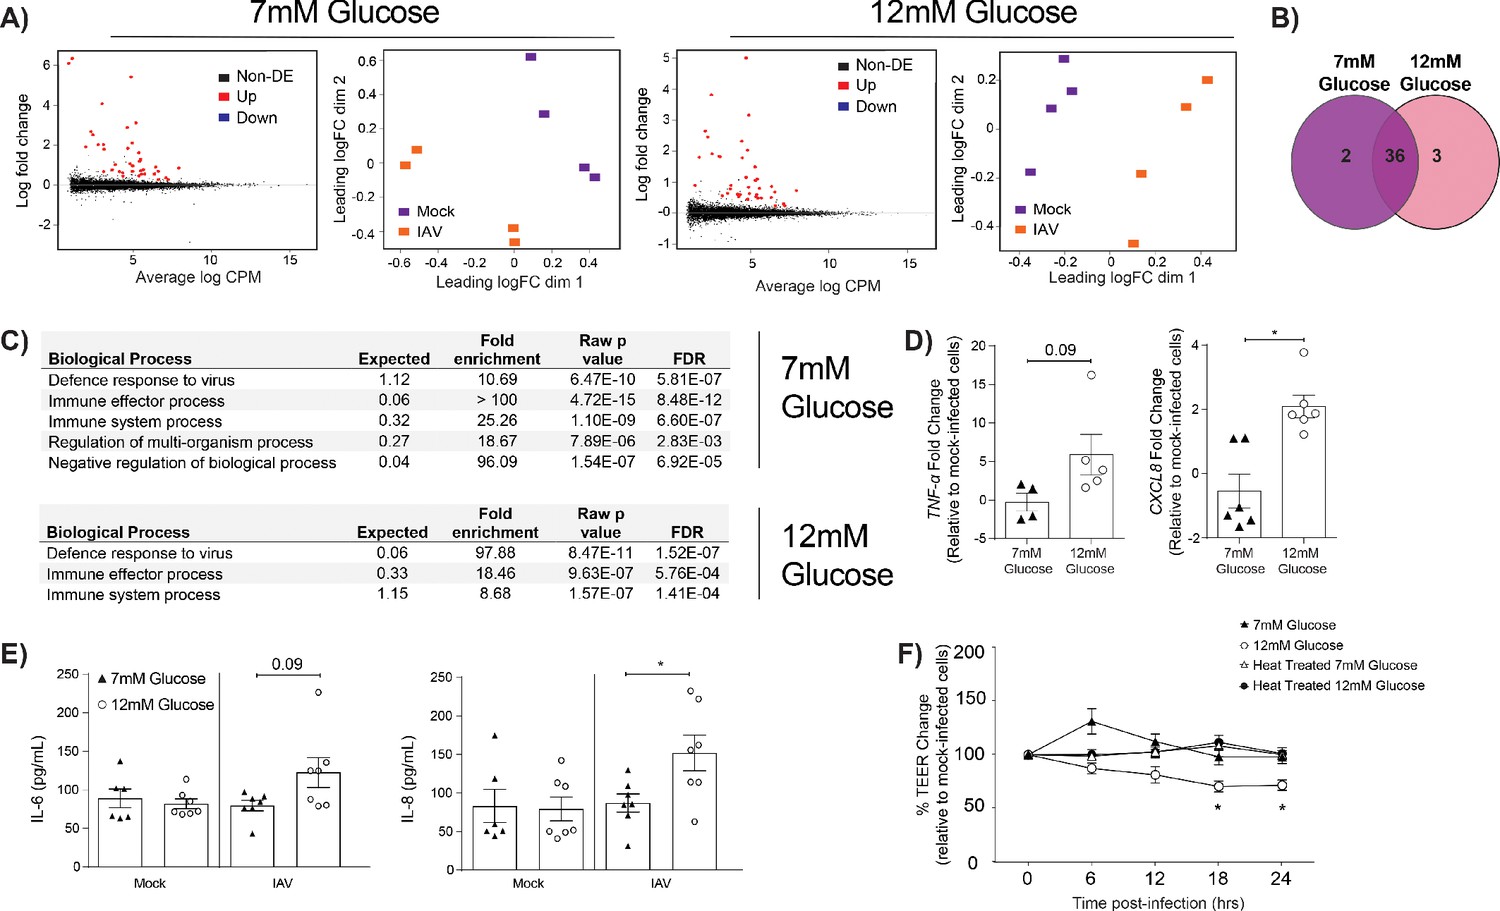
IAV-induced barrier damage in infected high glucose co-cultures is associated with a pro-inflammatory response in endothelial cells.
(A) Left: Mean difference (MD) plot depicts the relationship between gene-wise average log expression and the log-fold change comparison between IAV and mock infected cells. DE = differentially expressed. Right: Multi-dimensional scaling (MDS) plot of the endothelial cell sample used for RNASeq shows distinct clustering of samples by treatment group. (B) The number of DE expressed genes that are detected in endothelial cells derived from IAV-infected co-cultures (data collected at 24 hr post-infection). (C) Biological processes that are enriched in the endothelial cells derived from IAV-infected co-cultures at 24 hr post-infection. (D) Pro-inflammatory gene expression in co-culture endothelial cells. Data are normalised to GAPDH expression and fold change was calculated using the ΔΔCt method, expressed relative to mock infected cells. Data are mean ± SEM of an average of two technical replicates per group from a minimum of three independent experiments. (E) Levels of cytokines in the lower compartment (endothelial) cell culture supernatant 24 hr post IAV infection. Statistical significance was determined using a Mann-Whitney test. *: p<0.05. (F) Measurement of co-culture barrier integrity using TEER (Ω) readings after the addition of supernatant to the lower compartment. Supernatant was derived from the lower compartment of mock-infected or IAV-infected co-cultures with a history of 7 mM or 12 mM glucose. Harvested media was either heat treated or transferred without heat treatment. Data are shown relative to the TEER measured before the addition of the cell culture supernatant and to the TEER of wells subject to mock-infected supernatant transfer at each time point, for each glucose condition. Data are shown as mean ± SEM of three independent experiments (with six biological replicates per group). Statistical significance was determined using a two-way ANOVA with a Tukey post hoc test. *: p<0.05.
Figure 3—figure supplement 1
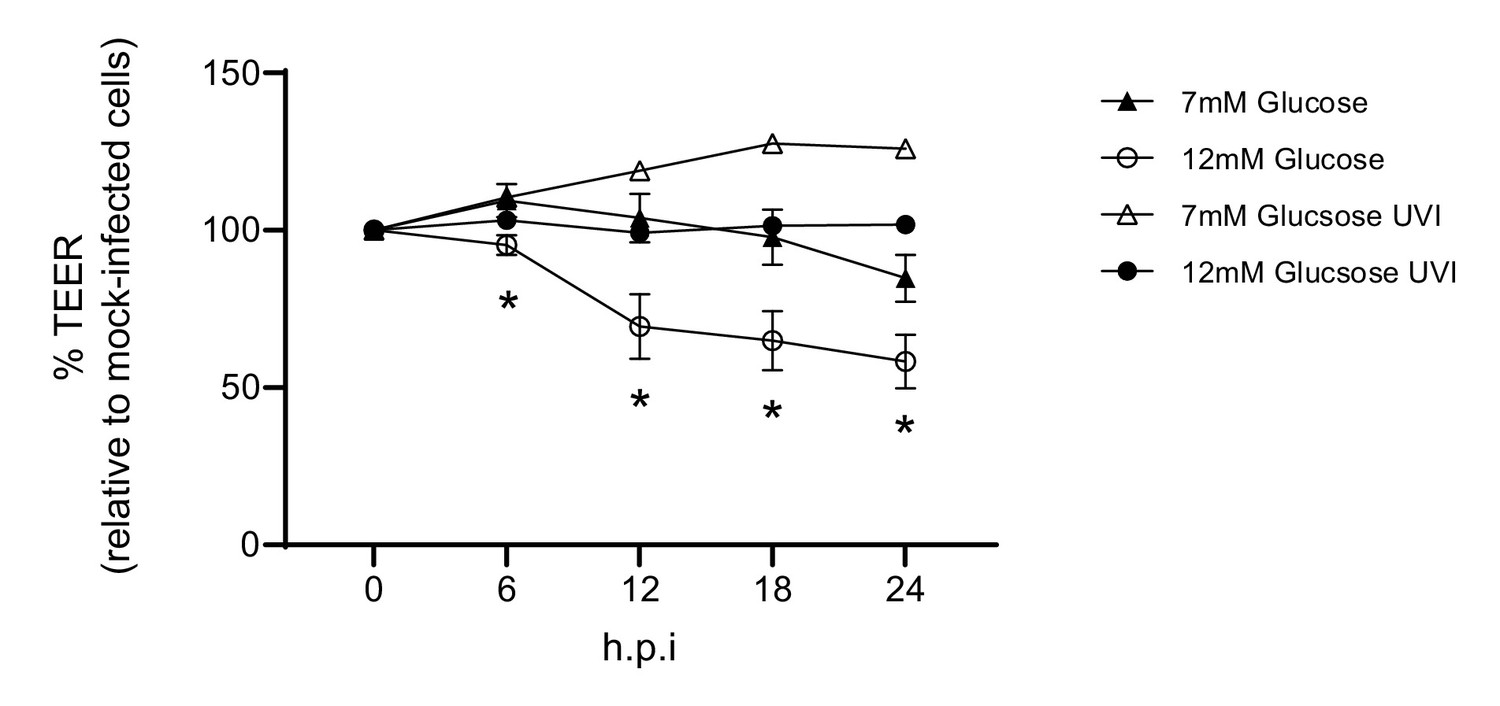
Barrier damage is dependent on active virus.
Measurement of co-culture barrier integrity using TEER (Ω) readings following infection with medium (‘mock’), IAV or ultra-violet inactivated (UVI) IAV (4 × 1 J/cm²). Viral titration of the UV inactivated virus revealed a dose of 5 PFU/well. Data are shown relative to the TEER measured before the addition of virus, and to the TEER of wells subject to mock-infection at each time point, for each glucose condition. Data are shown as mean ± SEM of two independent experiments (with four biological replicates per group, per experiment). Statistical significance was determined using a two-way ANOVA with a Tukey post hoc test. *: p<0.05 7 mM Glucose vs 12 mM Glucose.
Figure 3—figure supplement 2
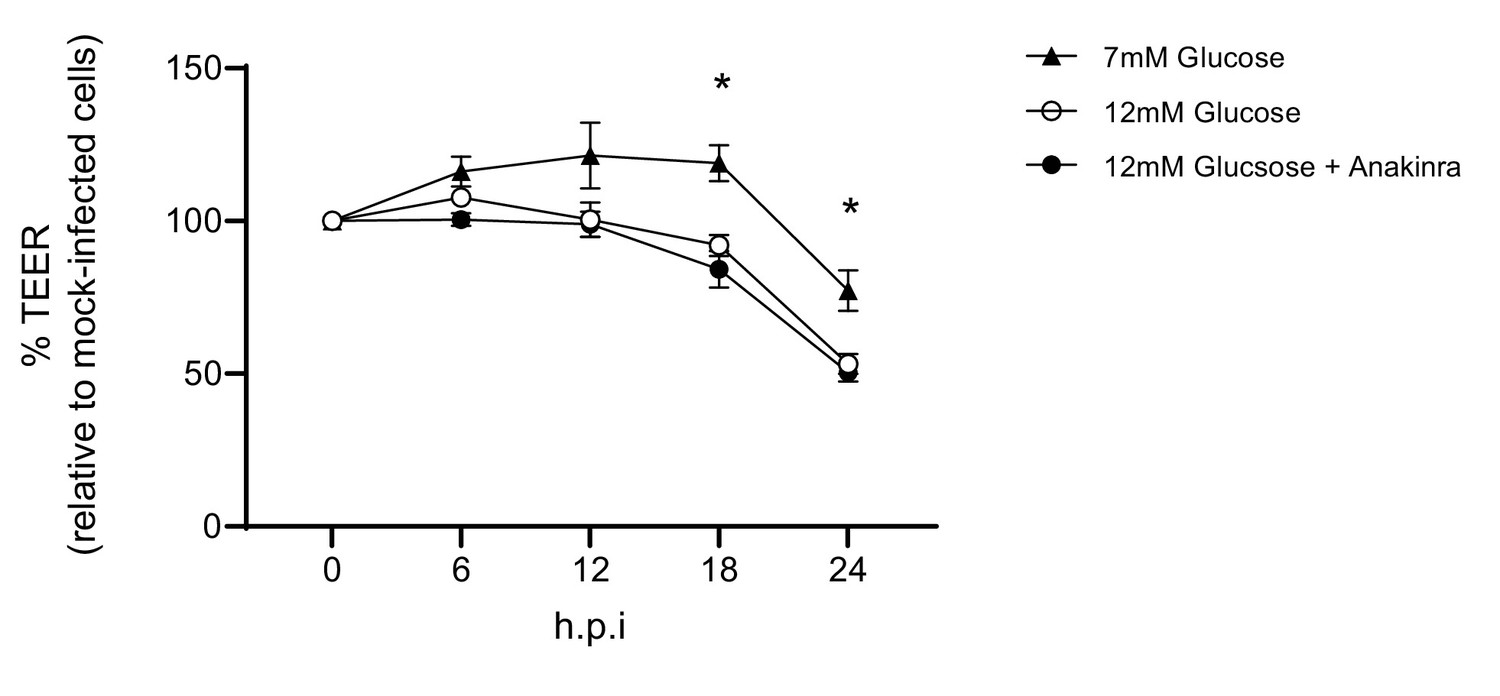
Barrier damage is and is not reversable via the addition of an IL-1 receptor antagonist.
Measurement of co-culture barrier integrity using TEER (Ω) readings following infection with medium (‘mock’) or IAV in the absence and presence of Anakinra. Anakinra was added to the endothelial compartment of the co-culture 1 hr prior to IAV infection at a dose of 10 µg/mL. Data are shown relative to the TEER measured before the addition of virus, and to the TEER of wells subject to mock-infection (with and without Anakinra) at each time point, for each glucose condition. Data are shown as mean ± SEM of two independent experiments (with three biological replicates per group, per experiment). Statistical significance was determined using a two-way ANOVA with a Tukey post hoc test. *: p<0.05 compared to 7 mM Glucose condition.
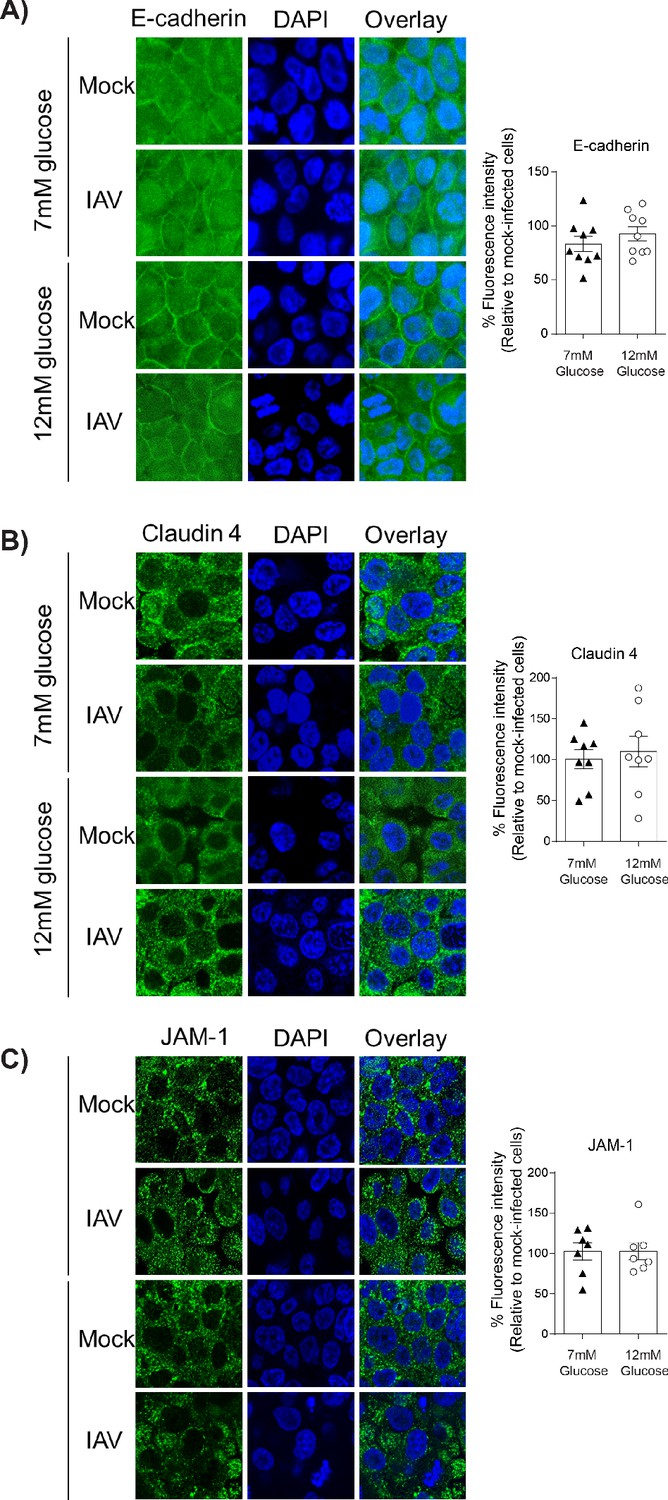
Figure 4
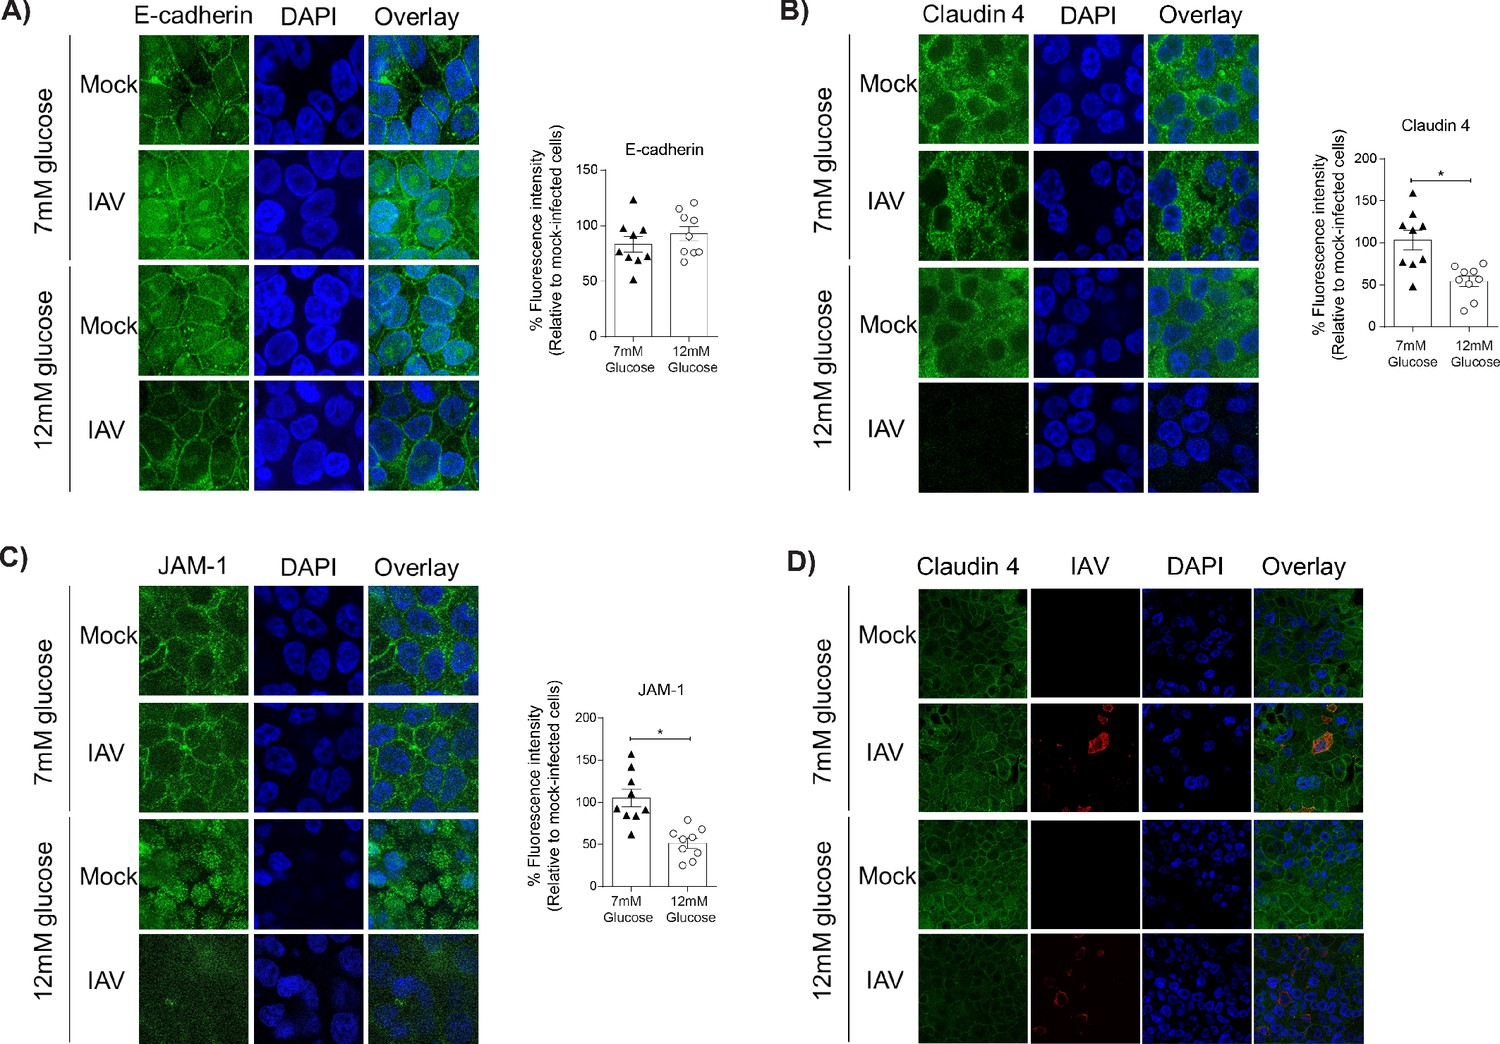
Barrier damage under high glucose conditions was associated with destruction of the apical junctional complex.
(A–C) Left: Representative immunofluorescence images (63x magnification) of apical junction complex proteins of epithelial cells. Epithelial cells were grown on transwell membrane in co-culture with endothelial cells and infected with either medium (‘mock’) or IAV. At 24 hr post-infection, cells were fixed and the nucleus and the relevant tight junction proteins were stained (blue and green, respectively). Right: The percentage of fluorescence intensity in IAV-infected epithelial cells in co-culture relative to mock-infected cells (defined as 100%) at 24 hr post-infection. Statistical comparisons were made using a Student’s unpaired t-test *: p<0.05. Data are pooled from three independent experiments (with three biological replicates per group) and shown as mean ± SEM. JAM-1: junctional adhesion molecule-1. (D) Representative immunofluorescence images (x63 magnification) of epithelial cells infected with either medium (‘mock’) or IAV. At 24 hr post-infection, cells were fixed and the nucleus, claudin 4 and influenza A nucleoprotein were stained (blue, green and red, respectively).
Figure 5
IAV-induced damage to the apical junctional complex is not observed in the absence of endothelial cells.
A–C) Left: Representative immunofluorescence images (63x magnification) of apical junction complex proteins of epithelial cells. Epithelial cells were grown on transwell membrane in mono-culture and infected with either medium (‘mock’) or IAV. At 24 hr post-infection, cells were fixed and the nucleus and the relevant tight junction proteins were stained (blue and green, respectively). Right: The percentage of fluorescence intensity in IAV-infected epithelial cells in mono-culture relative to mock-infected cells (defined as 100%) at 24 hr post-infection. Statistical comparisons were made using a Student’s unpaired t-test *: p<0.05. Data are pooled from three independent experiments (with three biological replicates per group) and shown as mean ± SEM. JAM-1: junctional adhesion molecule-1.
Figure 6
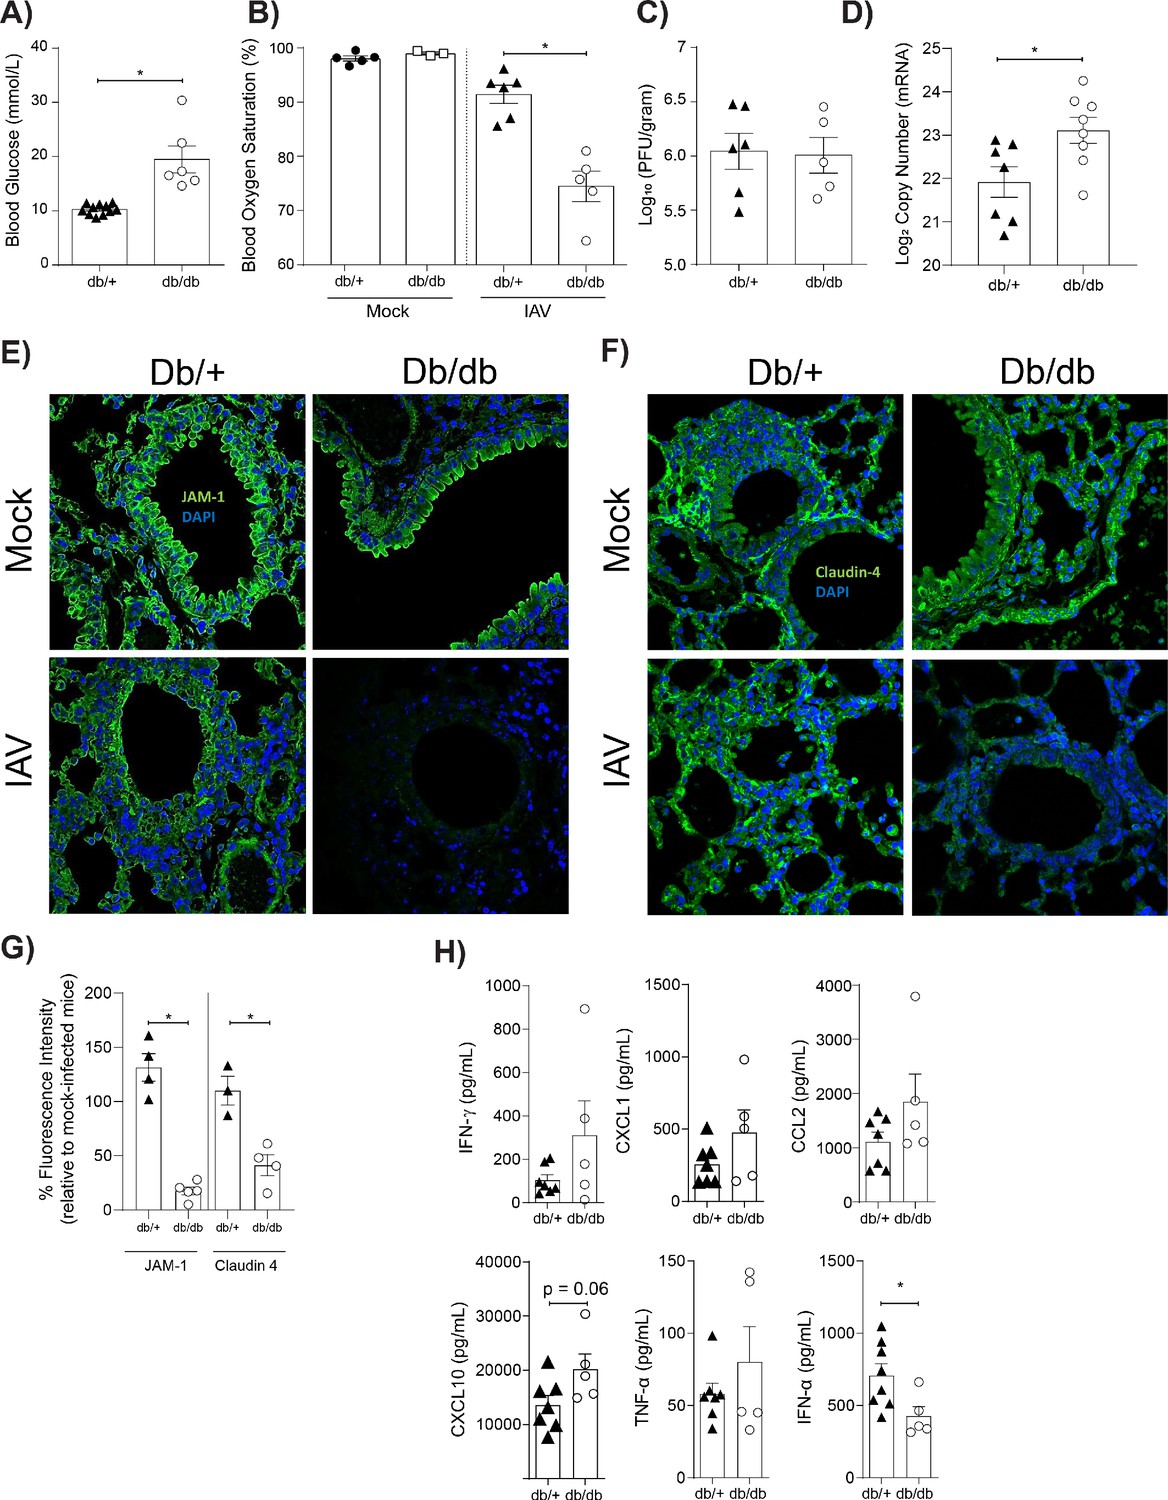
Mice with hyperglycaemia experience more severe influenza and destruction of the apical junctional complex.
Heterozygous (leprdb/+) and homozygous (leprdb/db) mice were infected with 5.5 × 10³ PFU of Auckland/09(H1N1) (n = minimum eight mice per group) or mock infected with PBS (n = minimum three mice per group). (A) Blood glucose concentration prior to infection was assessed. Statistical comparisons were made using a Student’s unpaired t-test. (B) Percentage blood oxygen saturation of mock and IAV-infected mice at 3 days post-infection (d.p.i). Statistical comparisons were made using a one-way ANOVA and Tukey post hoc test. (C) Viral titres (PFU/g) in lung homogenate 3 d.p.i. Statistical comparisons were made using a Student’s unpaired t-test. (D) mRNA detected by qPCR from murine lung homogenate 3 days post-IAV infection. Viral replication represented as viral copy number. Data are pooled from two independent experiments with at least three mice per group. Data are shown as mean ± SEM. Statistical significance was determined using a Student’s t-test. (E) Representative fluorescent immunohistochemistry images (40x magnification) of mock and IAV-infected heterozygous (leprdb/+) and homozygous (leprdb/db) mouse lung tissue sections stained for nucleus and the tight junction protein JAM-1 (blue and green, respectively). (F) Representative fluorescent immunohistochemistry images (40x magnification) of mock and IAV-infected heterozygous (leprdb/+) and homozygous (leprdb/db) mouse lung tissue sections stained for nucleus and the tight junction protein Claudin-4 (blue and green respectively). (G) The percentage of fluorescence intensity of the relevant tight junction molecules (JAM-1 and Claudin-4) in IAV-infected heterozygous (leprdb/+) and homozygous (leprdb/db) mouse lung tissue sections relative to mock-infected counterparts (defined as 100%) at 3 d.p.i. Statistical comparisons were made using a Student’s unpaired t-test *: p<0.05. Data are pooled from three independent experiments (with a minimum of three biological replicates per group) and shown as mean ± SEM. JAM-1: junctional adhesion molecule-1. (H) Levels of cytokines in the lung homogenate of IAV-infected mice at 3 d.p.i. Statistical comparisons were made using a Student’s unpaired t-test. Data are pooled from two independent experiments with at least three mice per group and shown as mean ± SEM. *: p<0.05.
Author response image 1
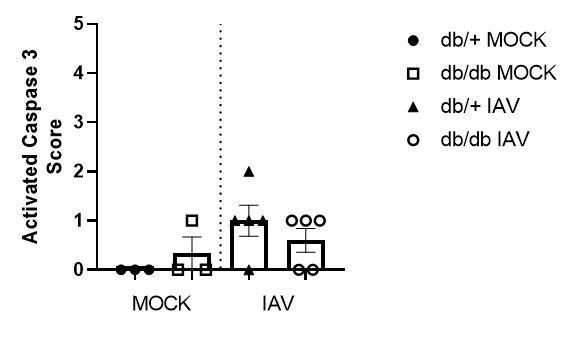
Histopathology scoring of lung sections for activated caspase 3.
Data are pooled from two independent experiments, with mean ± SEM.
Author response image 2
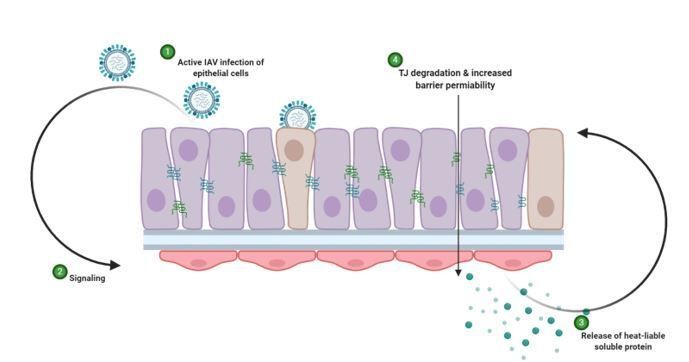
Schematic representation of hypothesised mechanism of tight junction barrier damage under hyperglycaemic conditions in vitro.
Active replicating virus triggers signalling either directly or indirectly acting on the endothelial cells (1). Endothelial cells exposed to a history of hyperglycaemia produce a heat-labile soluble protein into the supernatant (3). This soluble factor acts upon the tight junction proteins of the epithelial cells, causing degradation and barrier permeability in both infected and non-infected epithelial cells (4). Image created with Biorender.
Tables
Table 1
Primers used in the present study.
| Gene | Sequence |
|---|---|
| GAPDH | FW: CGAGATCCCTCCAAAATCAA RV: TTCACACCCATGACGAACAT |
| TNF-α | FW: AGCCCATGTTGTAGCAAACC RV: TGAGGTACAGGCCCTCTGAT |
| OAS1 | FW: AGAGACTTCCTGAAGCAGCG RV: GAGCTCCAGGGCATACTGAG |
| IL-6 | FW: CACAGACAGCCACTCACCTC RV: TTTTCTGCCAGTGCCTCTTT |
| CXCL8 | FW: GAATTGGAAAGAGGAGAGTGACAGA RV: GTCTCCACACTCTTTTGGATGCT |
| Influenza A Matrix | FW: AAGACCAATCCTGTCACCTCTGA RV: TCCTCGCTCACTGGGCA |
Additional files
Download links
A two-part list of links to download the article, or parts of the article, in various formats.
Downloads (link to download the article as PDF)
Open citations (links to open the citations from this article in various online reference manager services)
Cite this article (links to download the citations from this article in formats compatible with various reference manager tools)
High glucose levels increase influenza-associated damage to the pulmonary epithelial-endothelial barrier
eLife 9:e56907.
https://doi.org/10.7554/eLife.56907


