A large effective population size for established within-host influenza virus infection
- Department of Genetics, University of Cambridge, United Kingdom
- Great Ormond Street Hospital, United Kingdom
- Division of Infection and Immunity, University College London, United Kingdom
- Department of Applied Mathematics and Theoretical Physics, University of Cambridge, United Kingdom
- Department of Computer Science, Institute of Biotechnology, University of Helsinki, Finland
Figures
Figure 1 with 2 supplements

Population structure of the influenza infection.
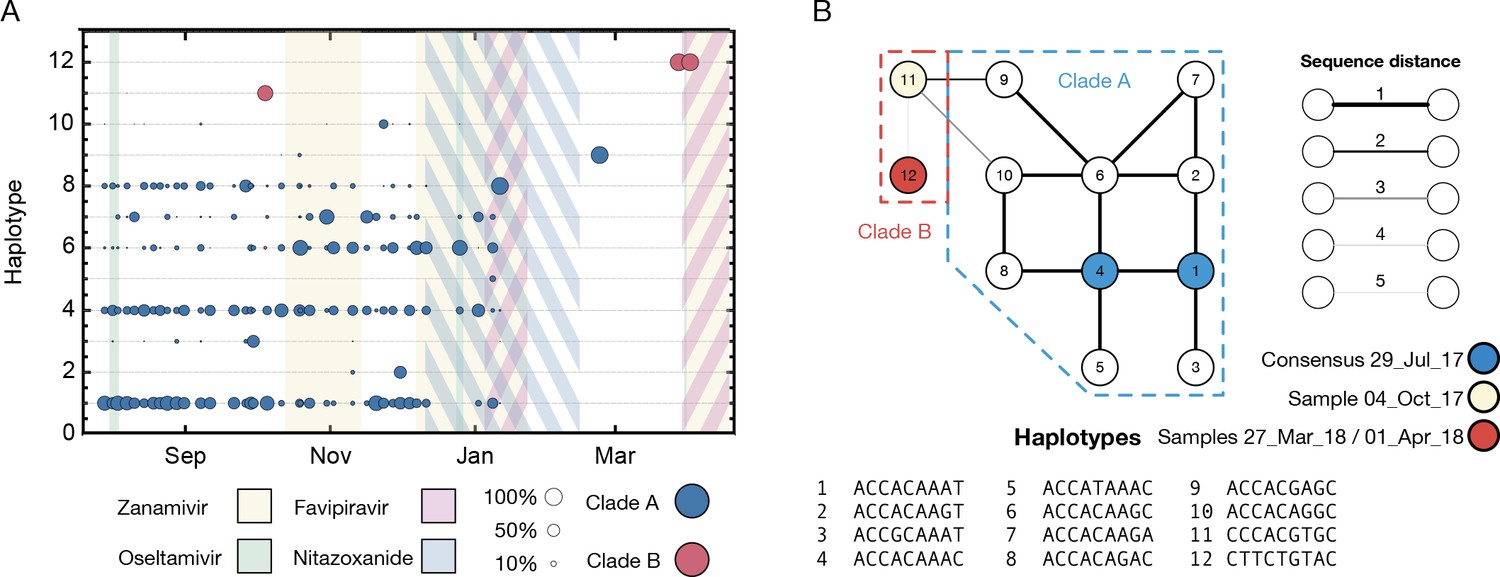
(A) CT values from viral samples collected over time indicate the viral load of the infection; a higher number corresponds to a lower viral load. Drug information, above, shows the times during which oseltamivir (green), zanamivir (yellow), nitazoxanide (blue) and favipiravir (purple) were prescribed. Black dots show samples from which viral sequence data were collected; gray dots show samples from which viral sequence data were not collected. The green box shows the window of time over which samples were analysed, preceding the use of favipiravir in January. The mean viral load (dashed horizontal line, red) was close to the mean reported for a set of samples from hospitalised children with influenza (dashed horizontal blue line) (Wishaupt et al., 2017). A black arrow shows the date of a bone marrow transplant (BMT). (B) A phylogeny of whole-genome viral consensus sequences identified two distinct clades in the viral population. Clade B featured three samples, distributed across the period of infection, with the remaining samples contained in Clade A. (C) Sub-consensus structure of the viral population inferred via a haplotype reconstruction algorithm using data from the neuraminidase segment. The same division of sequences into two clades is visible, with samples being comprised of distinct viral genotypes. The area of each circle is proportional to the inferred frequency of the corresponding haplotype in the viral population. Haplotypes reaching a frequency of at least 10% in at least one time point are shown. Multiple drugs were administered to the patient through time, with a favipiravir/zanamivir combination first causing a temporary reduction of the population to undetectable levels, then finally clearing the infection. Haplotypes spanned the loci 96, 170, 177, 402, 403, 483, 571, 653, 968, 973, 1011, 1079, 1170, and 1240 in the NA segment. (D) Evolutionary relationship between the haplotypes; clade B is distinct from and evolves away from those sequences comprising the initial infection. Numbers refer to the distinct haplotypes identified within the population.
-
Figure 1—source data 1
Viral load and details of treatment with inferred haplotype frequencies for the neuraminidase viral segment.
(A) CT values and dates of treatment. (C) Reconstructed haplotype frequencies for the neuraminidase viral segment.
- https://cdn.elifesciences.org/articles/56915/elife-56915-fig1-data1-v2.xlsx
-
Figure 1—source data 2
Data for the phylogenetic tree in Figure 1B.
- https://cdn.elifesciences.org/articles/56915/elife-56915-fig1-data2-v2.new
Figure 1—figure supplement 1
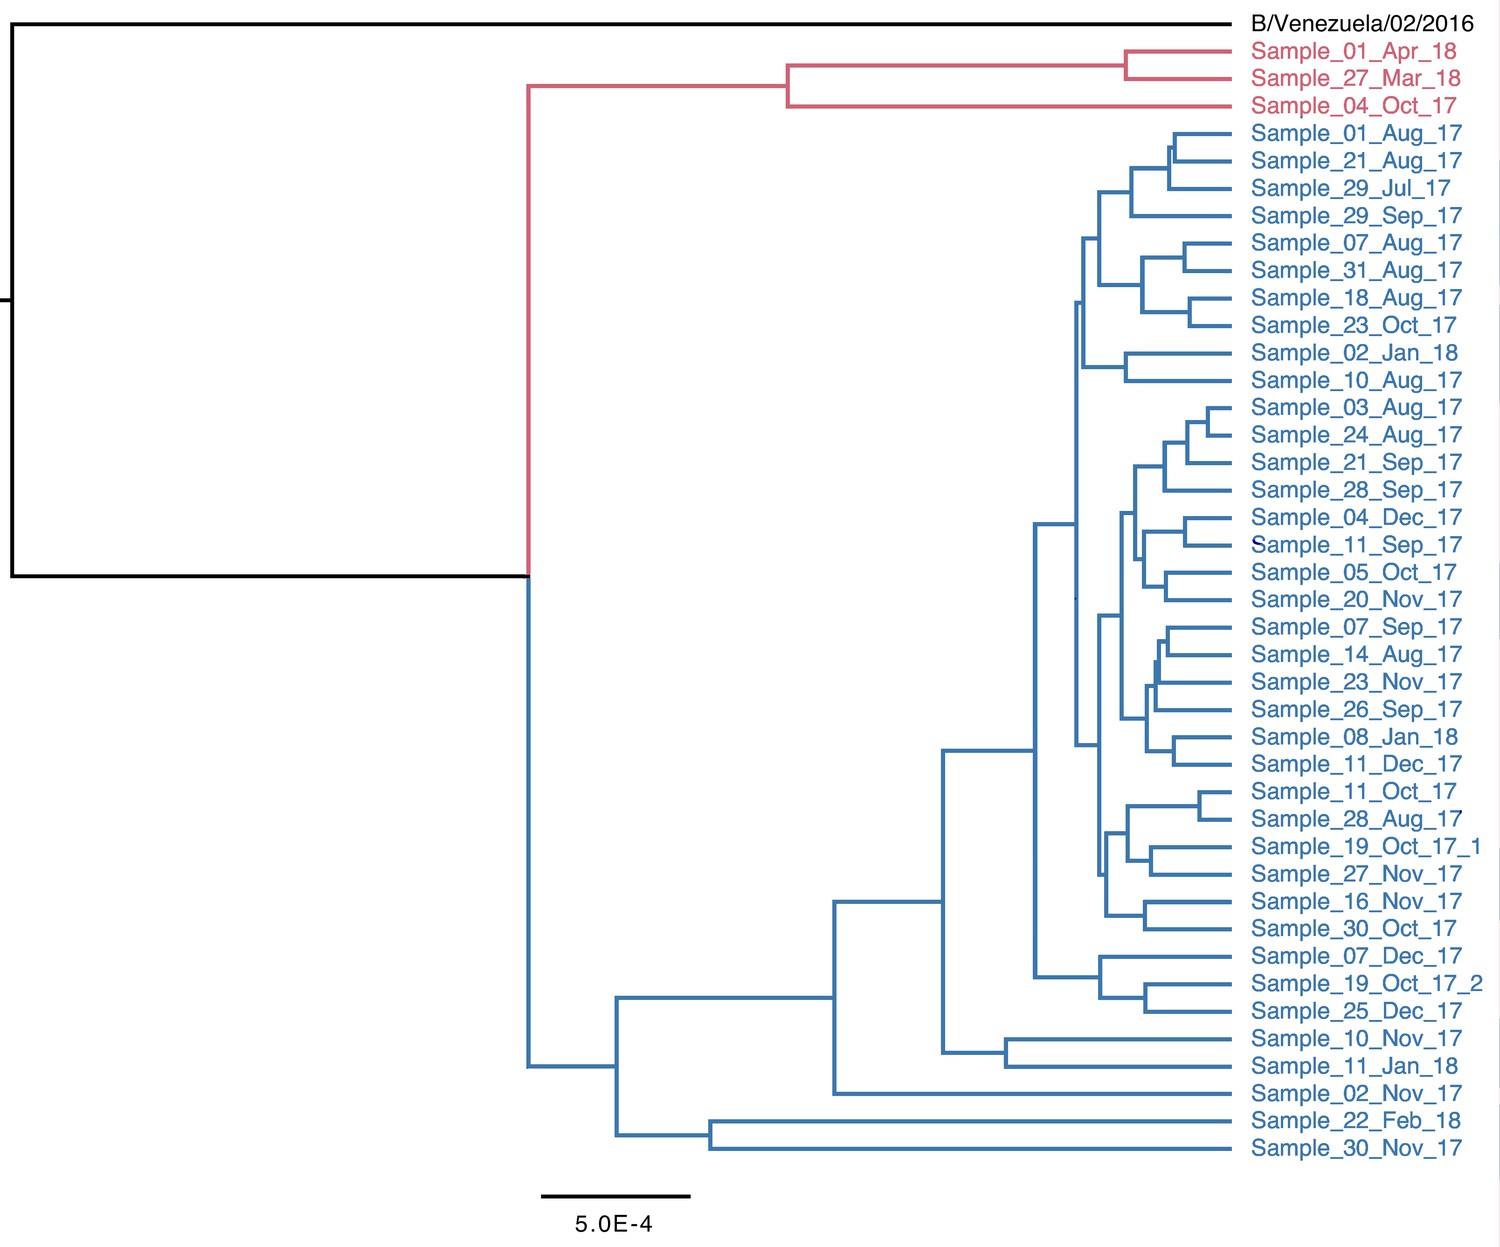
Complete phylogeny of whole-genome viral consensus sequences, coloured by clade.
Figure 1—figure supplement 2
Haplotype reconstruction for data describing the haemagglutinin segment of the virus.
(A) Sub-consensus structure of the viral population inferred via a haplotype reconstruction algorithm using data from the haemagglutinin segment. A division of sequences into two clades is visible, with samples including largely distinct viral genotypes. The area of each circle is proportional to the amount of virus in each clade. Haplotypes reaching a frequency of at least 10% in at least one time point are shown. Haplotypes spanned the loci 258, 261, 364, 451, 521, 541, 635, and 641 in the HA segment. (B) Evolutionary relationship between the haplotypes; clade B is distinct from and evolves away from those sequences comprising the initial infection. Numbers refer to the distinct haplotypes identified within the population.
-
Figure 1—figure supplement 2—source data 1
Reconstructed haplotype frequencies for the haemagglutinin viral segment.
- https://cdn.elifesciences.org/articles/56915/elife-56915-fig1-figsupp2-data1-v2.xlsx
Figure 2 with 7 supplements
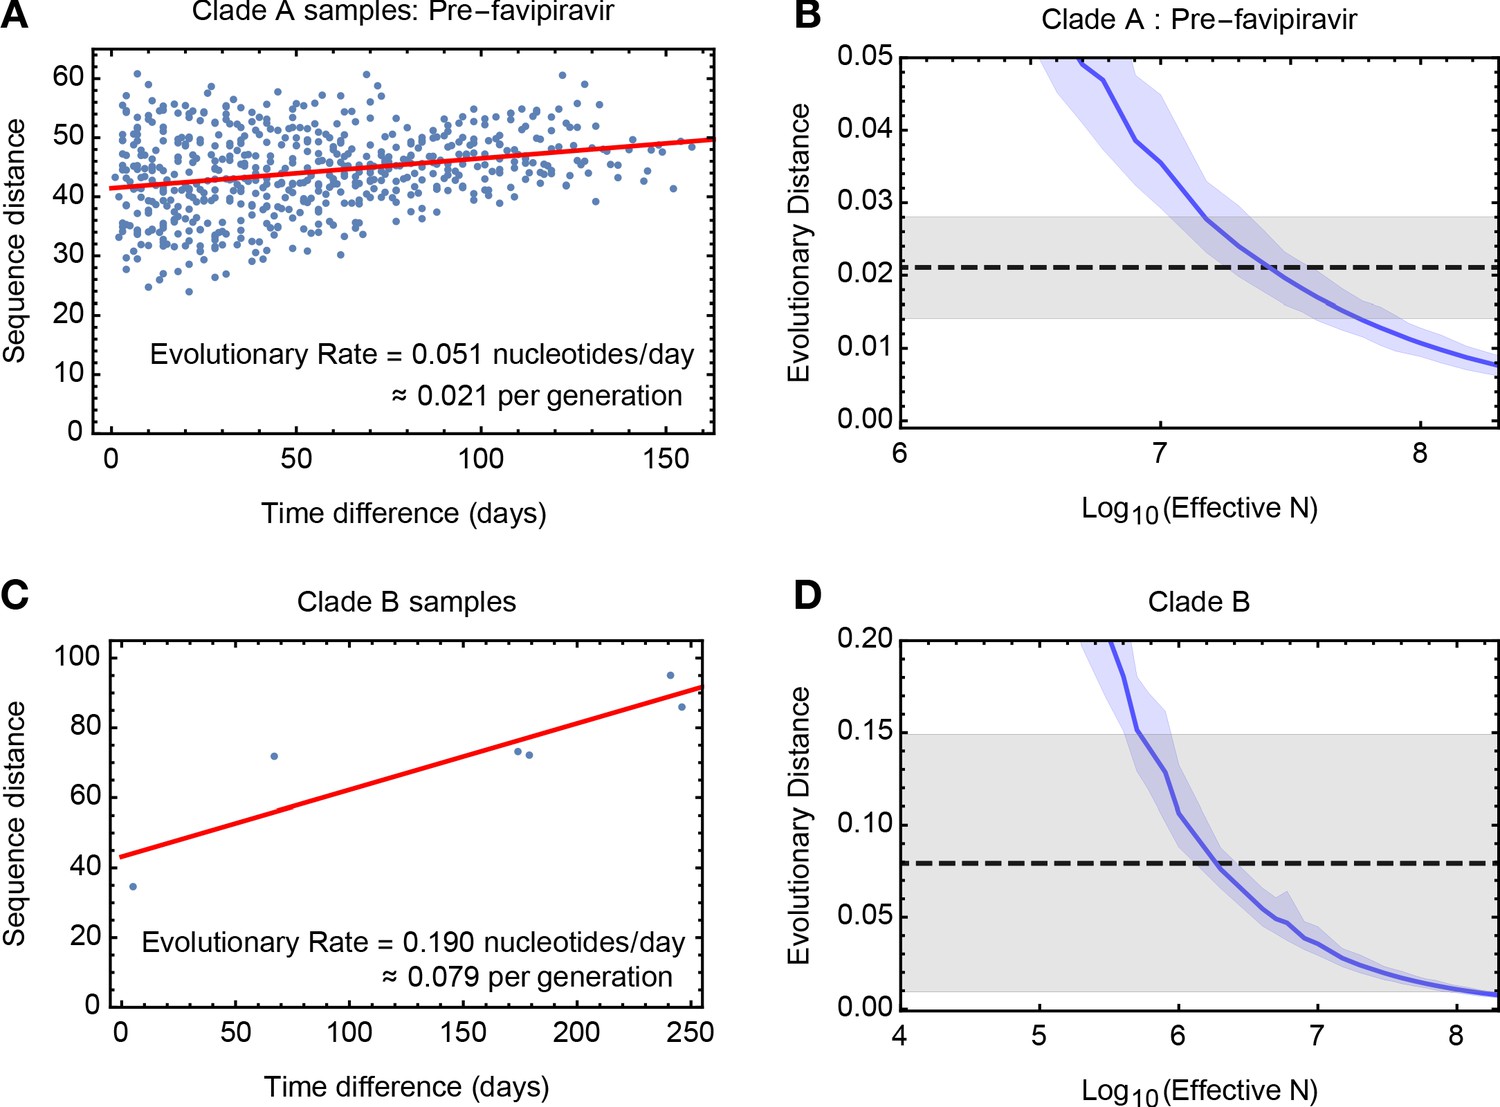
Measuring rates of evolution in the viral population.
(A) Computed rate of evolution for viruses in clade A up to the time of the first use of favipiravir. The distance between two sequences is calculated as the total absolute difference in four-allele frequencies measured across the genome. The calculated rate per generation is based upon a generation time for influenza of 10 hours (Nobusawa and Sato, 2006). (B) Distribution of evolutionary distances in influenza populations simulated using a Wright-Fisher model compared to the distance per generation calculated in the regression fit. A solid blue line shows the mean, with shading indicating an approximate 97.5% confidence interval around the mean. Statistics were calculated from sets of 400 simulations conducted at each value of Ne. The dashed black line shows the rate of evolution of the real population; gray shading shows a 97.5% confidence interval for this statistic. (C) Calculated rate of evolution for viruses in clade B. For the purposes of calculating a rate of evolution the first sample collected from the patient was included as part of clade B. (D) Estimation of Ne for clade B. The results of simulations shown here are identical to those in part B of the figure.
-
Figure 2—source data 1
Between sample differences and simulated rates of evolution for clades A and B of the viral population.
(A) Sequence distances D calculated for pairwise samples from the population used in the calculation for clade A. Data points are ordered by the difference in sample times, measured in whole days between samples. (B) Distance statistics calculated from simulated data for different effective population sizes Ne. (C) Sequence distances D calculated for pairwise samples from the population used in the calculation for clade B. (D) Distance statistics calculated from simulated data for different effective population sizes Ne.
- https://cdn.elifesciences.org/articles/56915/elife-56915-fig2-data1-v2.xlsx
Figure 2—figure supplement 1
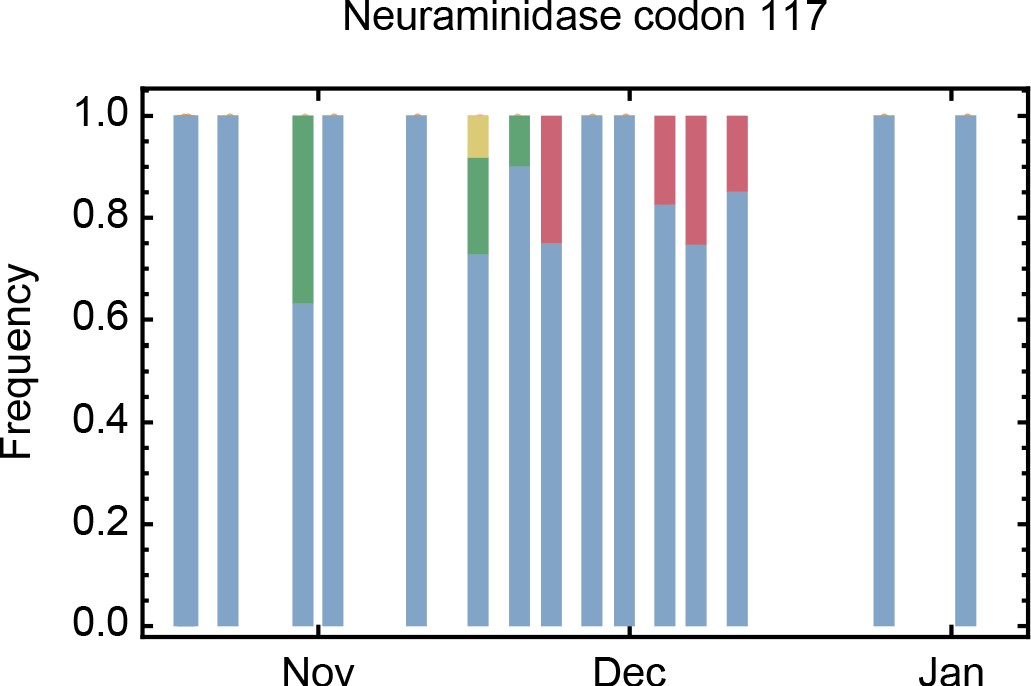
Amino acids present at codon 117 of the neuraminidase segment of the virus after the first administration of zanamivir.
The consensus glutamate nucleotide (blue) was sometimes replaced by glycine (green), valine (yellow), and alanine (red). Glycine and alanine are associated with zanamivir resistance in influenza B.
-
Figure 2—figure supplement 1—source data 1
Amino acid frequencies at position 117 in the neuraminidase viral segment.
- https://cdn.elifesciences.org/articles/56915/elife-56915-fig2-figsupp1-data1-v2.xlsx
Figure 2—figure supplement 2
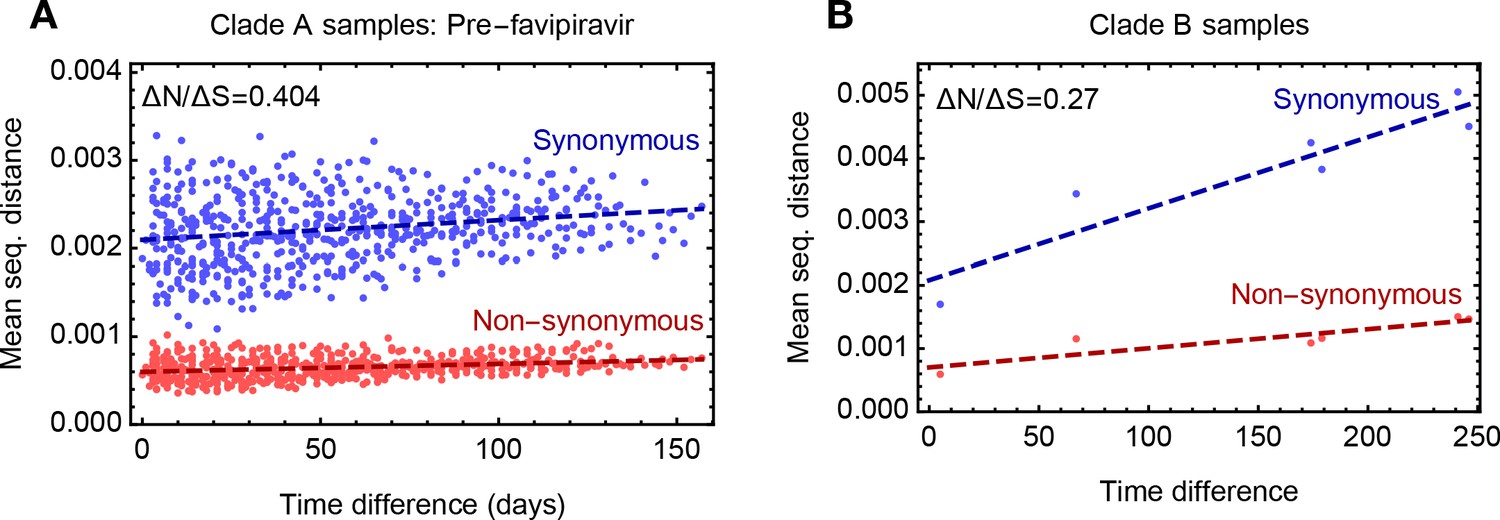
Rates of evolutionary change at non-synonymous and synonymous sites.
(A) Comparison of rates of synonymous and non-synonymous evolution for viruses in clade A up to the time of the administration of favipiravir. The distance between two samples is calculated as the mean absolute difference in allele frequency, as averaged over synonymous and non-synonymous positions in the genome. (B) Comparison of rates of synonymous and non-synonymous evolution for viruses in clade (B) The rate of evolution in both clades was slower at non-synonymous sites than at synonymous sites, suggesting a general pattern of purifying selection at non-synonymous sites. Change in the population was not as a whole driven by positive selection.
-
Figure 2—figure supplement 2—source data 1
Synonymous and non-synonymous sequence distances calculated per nucleotide across the whole viral genome for different pairs of samples.
Data are given according to the interval in time, measured in whole days between samples.
- https://cdn.elifesciences.org/articles/56915/elife-56915-fig2-figsupp2-data1-v2.xlsx
Figure 2—figure supplement 3
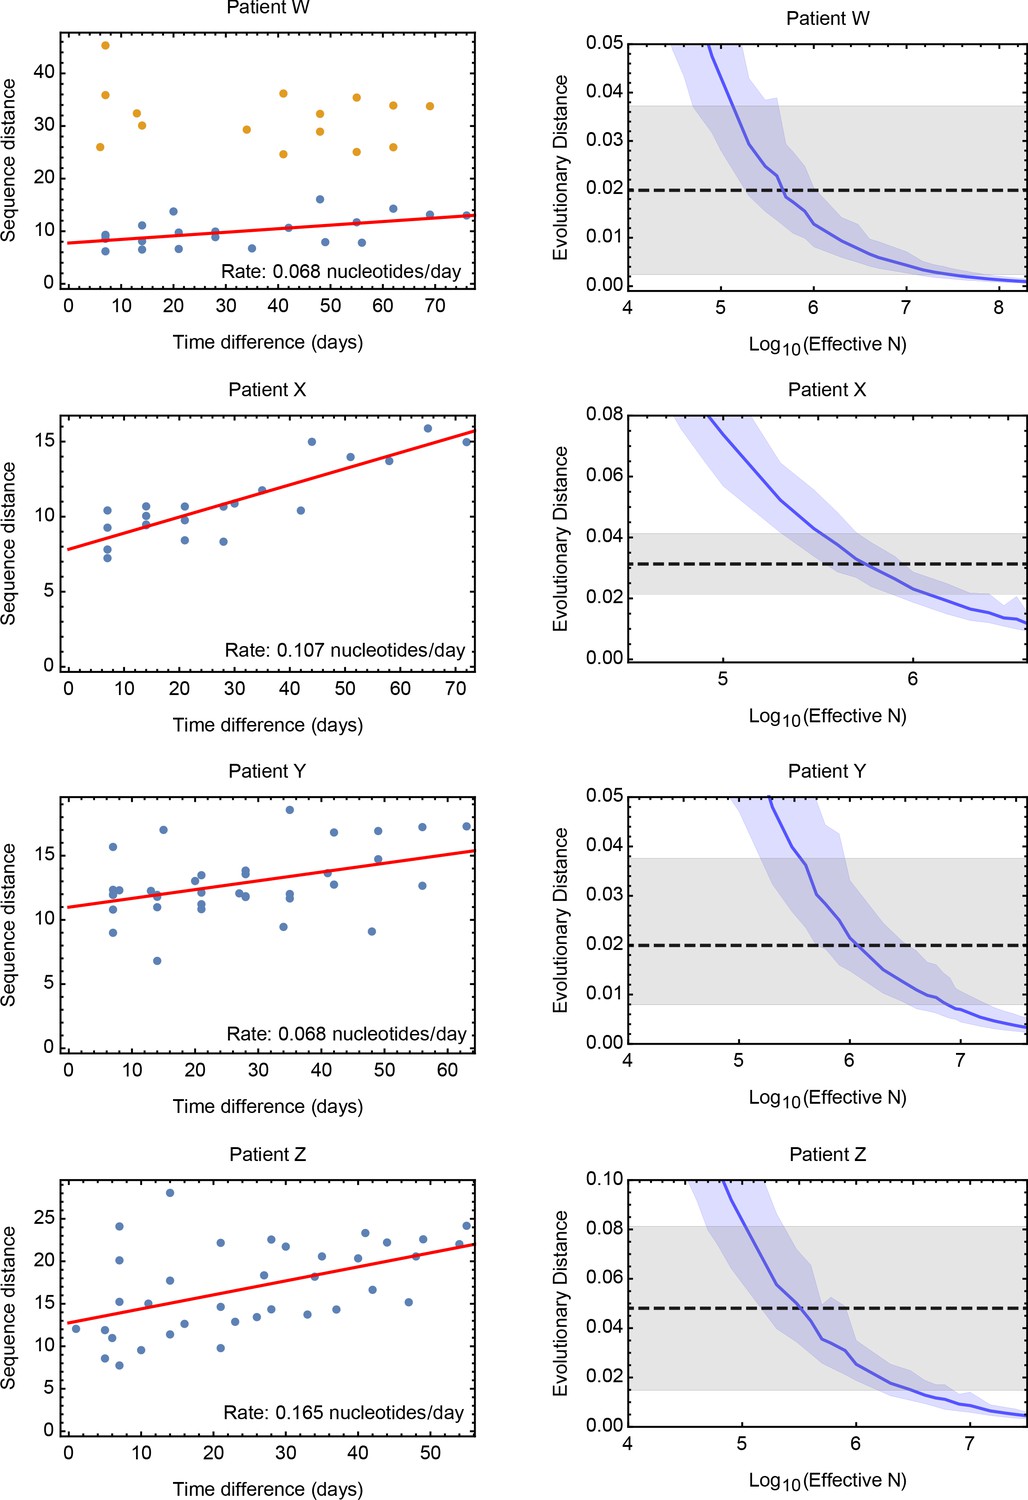
Estimates of the effective population size for data from a study of long-term influenza A/H3N2 infection in four patients.
Patients are denoted with the letters assigned them in the original study (Xue et al., 2017). Rates of evolution within each patient were calculated by linear regression, conducted on a plot of evolutionary versus temporal distance between samples. The inferred regression line is shown in red for each dataset. For Patient W samples collected at two time points appear as outliers in the distance plot; distances involving these samples, shown in yellow, were excluded from the calculation. Accompanying plots show distances inferred via simulation compared to the inferred rates. A solid blue line shows the mean, with shading indicating an approximate 97.5% confidence interval around the mean. Statistics were calculated from sets of 400 simulations conducted at each value of Ne.
-
Figure 2—figure supplement 3—source data 1
Sequence distances D calculated for the Xue et al dataset.
Equivalent distances for a single generation generated from simulated data at different effective population sizes are also provided. The calculated equivalent distance per generation from the sequence data is also provided.
- https://cdn.elifesciences.org/articles/56915/elife-56915-fig2-figsupp3-data1-v2.xlsx
Figure 2—figure supplement 4
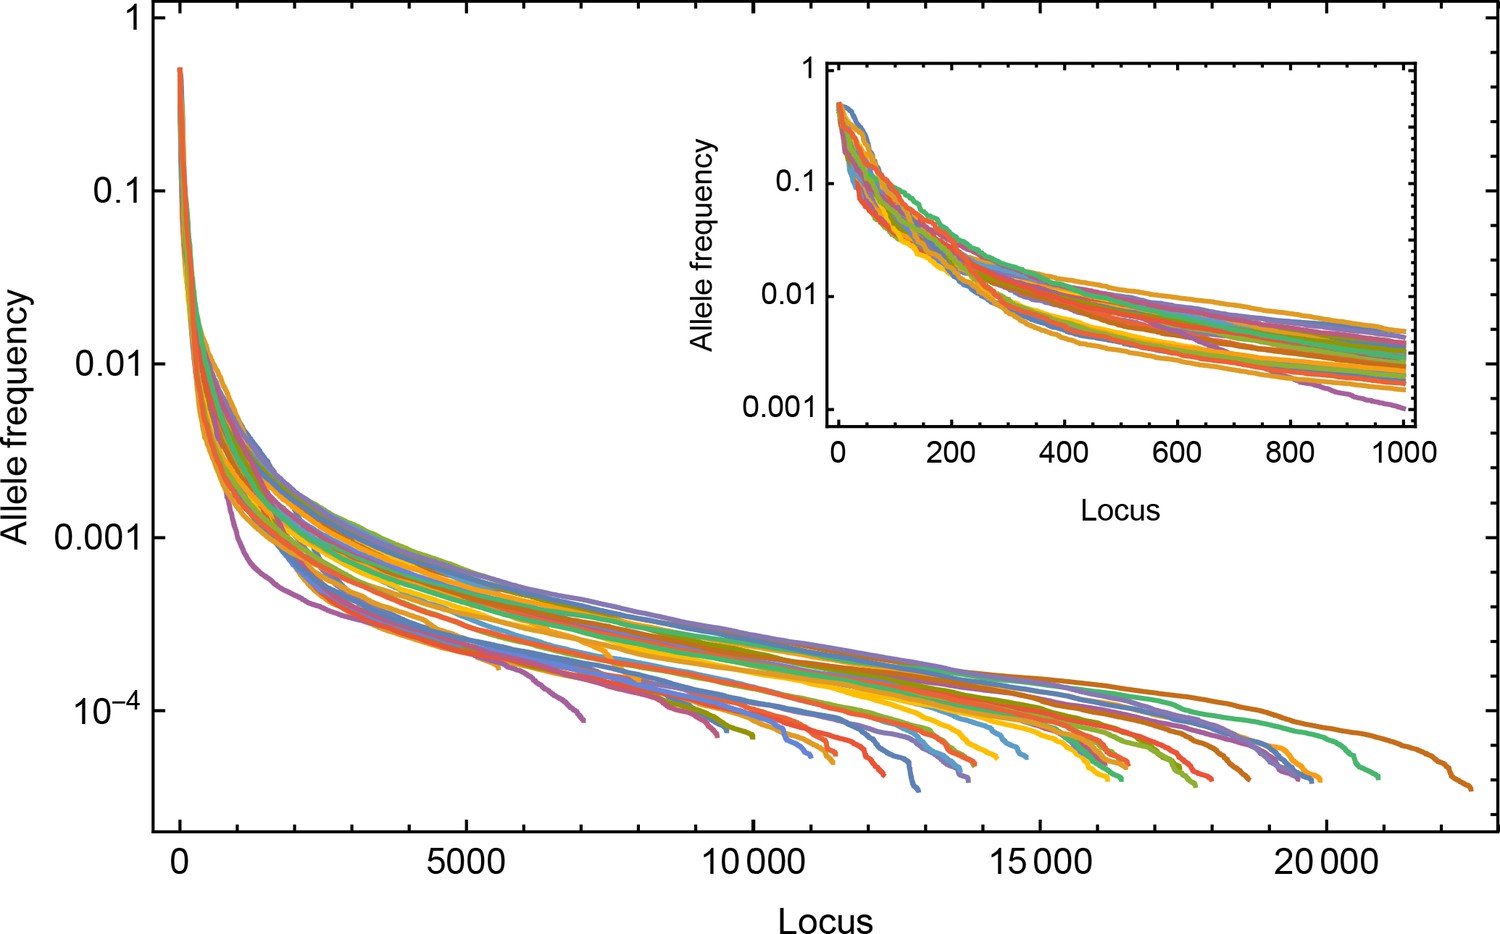
Minority allele frequencies from distinct time points used for the Wright-Fisher simulation applied to the influenza B sequence data.
Allele frequencies from across the genome are sorted and shown on a log scale.
-
Figure 2—figure supplement 4—source data 1
Sorted allele frequencies collected genome-wide for samples used in the simulation of data.
Only non-zero frequencies are reported. These allele frequencies were processed using a statistical method for removing false positive variant calls as a precursor step within the Wright-Fisher simulation.
- https://cdn.elifesciences.org/articles/56915/elife-56915-fig2-figsupp4-data1-v2.xlsx
Figure 2—figure supplement 5
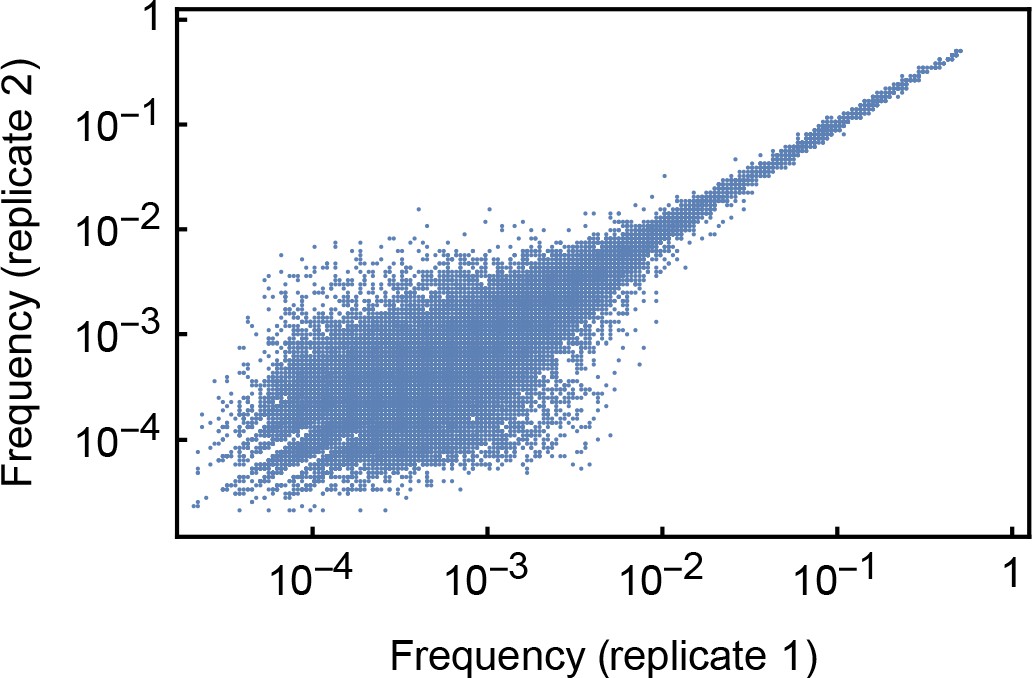
Frequencies of minority variant alleles identified in the HCV01 dataset used to evaluate the accuracy of variant calling in our sequencing pipeline.
Samples in this dataset were split following RNA extraction with replicate sets of RNA being processed and sequenced independently. Variants at higher frequencies were identified at more consistent frequencies than variants at lower frequencies.
-
Figure 2—figure supplement 5—source data 1
Replicate allele frequencies from the HCV01 dataset, described in a previous publication, and used in this study to estimate a frequency-dependent positive predictive value for variant calling using the sequencing method applied to the influenza B data.
- https://cdn.elifesciences.org/articles/56915/elife-56915-fig2-figsupp5-data1-v2.xlsx
Figure 2—figure supplement 6
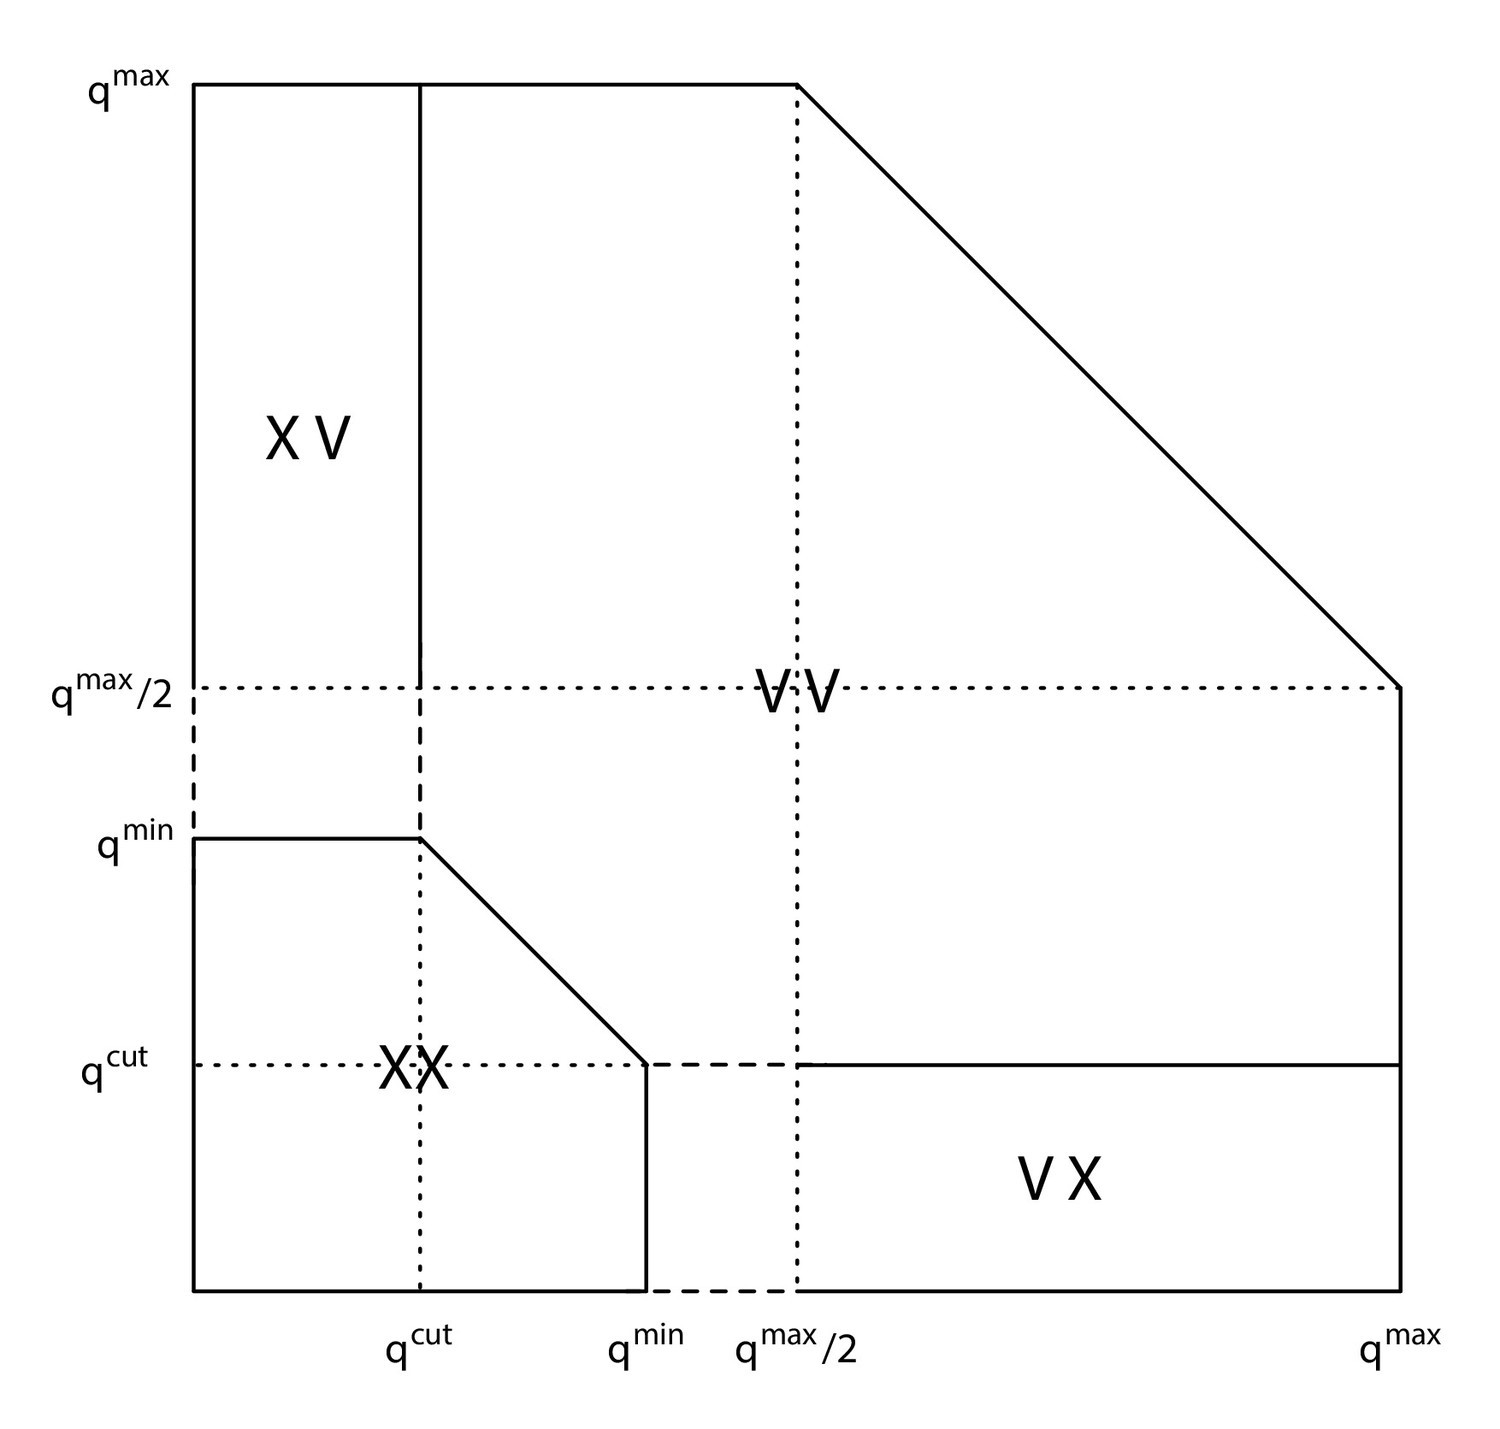
Regions of frequency space used to define observations and non-observations of allele frequencies.
V indicates the identification of a variant, while X indicates the non-identification of a variant. Combinations of V and X indicate observations made in two replicate samples.
Figure 2—figure supplement 7
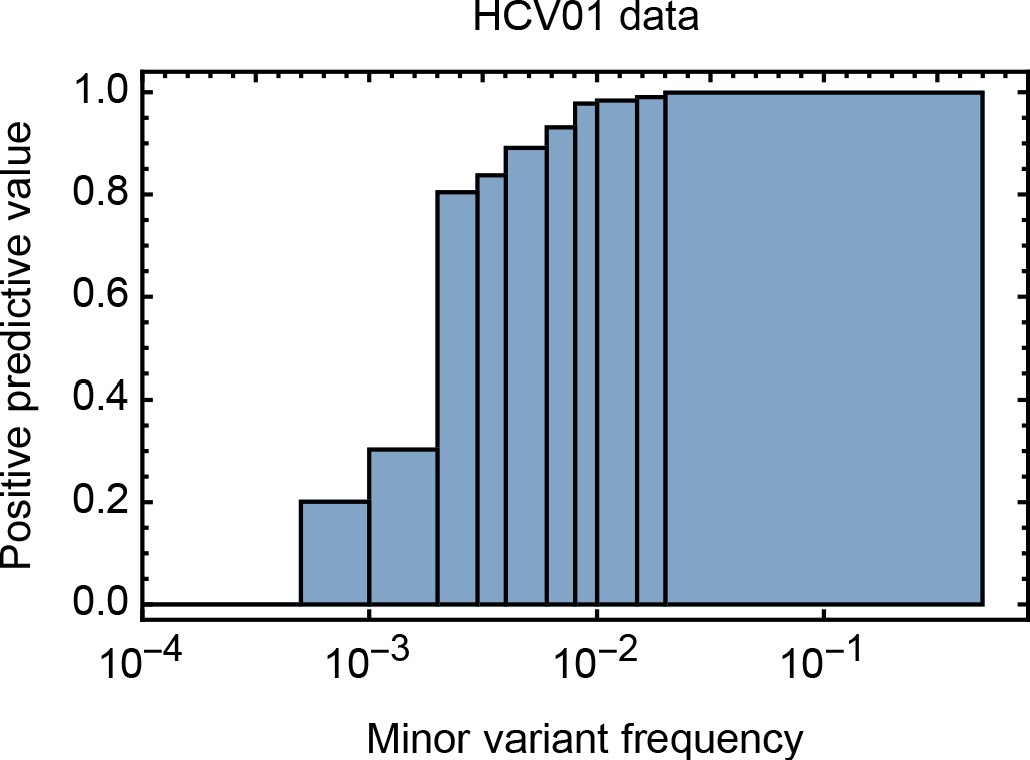
Positive predictive value for minority variants under our sequencing pipeline, calculated at different frequency ranges.
While high frequency variants were very reliably identified, the reliability of identifying variants was significantly impaired at lower frequencies.
-
Figure 2—figure supplement 7—source data 1
Frequency-dependent positive predictive values for variant calling.
- https://cdn.elifesciences.org/articles/56915/elife-56915-fig2-figsupp7-data1-v2.xlsx
Additional files
-
Supplementary file 1
Inferred effective population sizes for data from clade.
A generated under different modelling assumptions.
- https://cdn.elifesciences.org/articles/56915/elife-56915-supp1-v2.xlsx
-
Transparent reporting form
- https://cdn.elifesciences.org/articles/56915/elife-56915-transrepform-v2.docx
Download links
A two-part list of links to download the article, or parts of the article, in various formats.
Downloads (link to download the article as PDF)
Open citations (links to open the citations from this article in various online reference manager services)
Cite this article (links to download the citations from this article in formats compatible with various reference manager tools)
A large effective population size for established within-host influenza virus infection
eLife 9:e56915.
https://doi.org/10.7554/eLife.56915


