Structural insights into human acid-sensing ion channel 1a inhibition by snake toxin mambalgin1
- Hefei National Laboratory of Physical Sciences at Microscale, Anhui Laboratory of Advanced Photonic Science and Technology and School of Life Sciences, University of Science and Technology of China, China
- Tsinghua-Peking Joint Center for Life Sciences, Ministry of Education Key Laboratory of Bioorganic Phosphorus Chemistry and Chemical Biology, Department of Chemistry, Tsinghua University, China
- High Magnetic Field Laboratory, Chinese Academy of Sciences, China
- School of Medicine, Zhejiang University, China
Figures
Figure 1 with 1 supplement
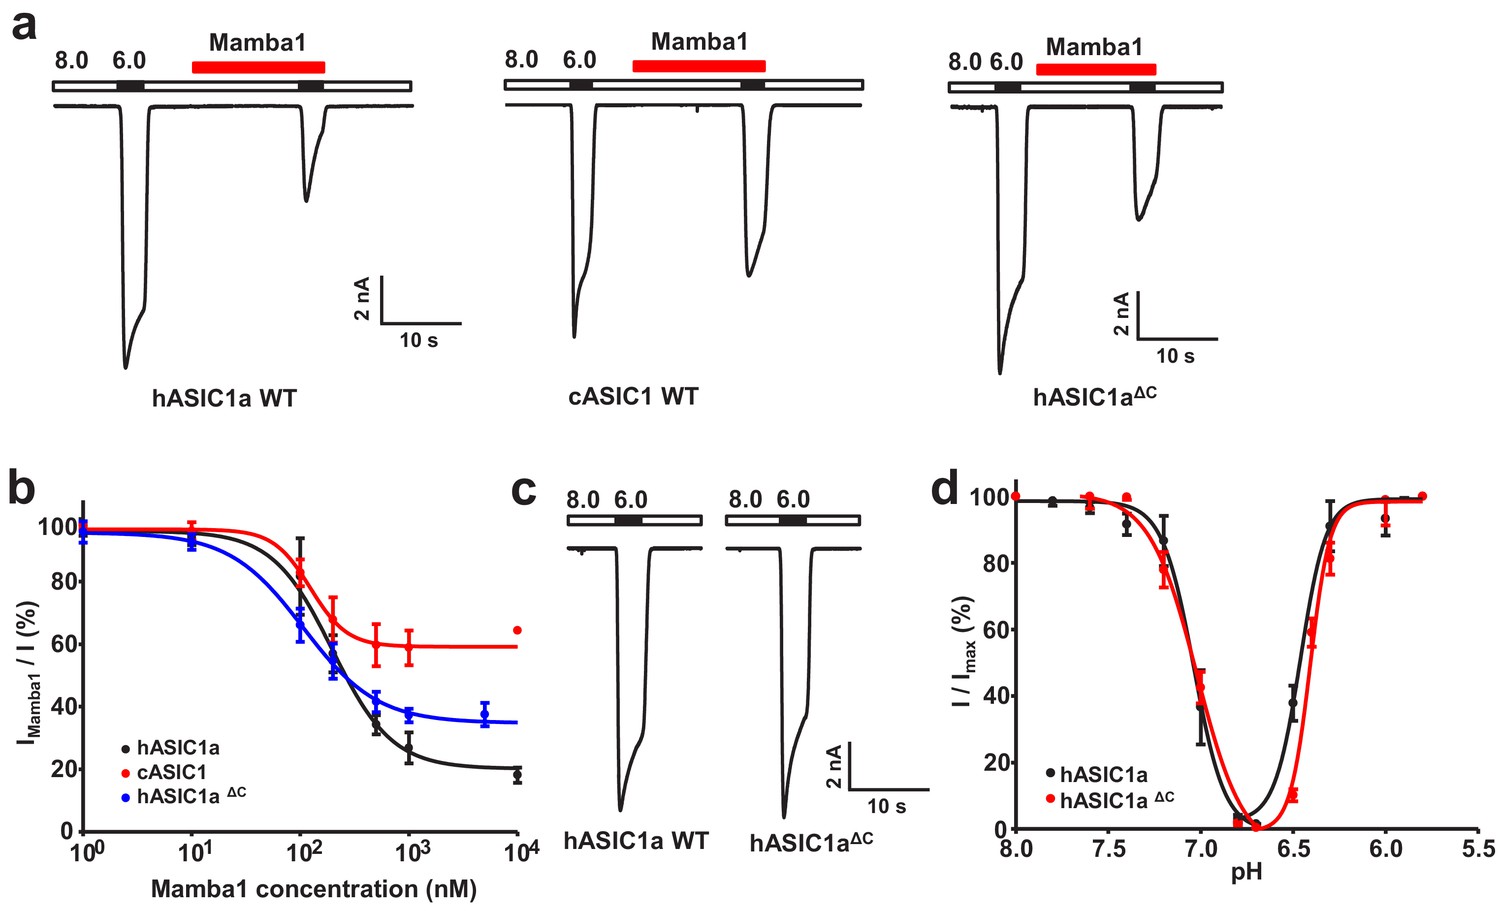
Functional analysis of hASIC1a and hASIC1aΔC.
(a) Typical current traces representing the inhibition of recombinant hASIC1a (left), cASIC1 (middle) and hASIC1aΔC (right) by Mamba1 toxin in CHO cells. (b) Concentration-response curve showing the inhibition of hASIC1a, hASIC1aΔC and cASIC1 expressed in CHO cells by Mamba1. Imamba1 and I represent the currents elicited by the pH 6.0 solution in the presence and absence of Mamba1 toxin respectively. (c) Representative whole-cell patch-clamp recordings from wild-type hASIC1a and hASIC1aΔC activated by pH 6.0 solution. (d) pH-dependent activation and inactivation curves of hASIC1a (solid lines) and hASIC1aΔC (dash lines). Data were collected from CHO cells transfected with hASIC1a or hASIC1aΔC DNA. Data are presented as the mean ± SD.
-
Figure 1—source data 1
Source data for Figure 1b and d.
- https://cdn.elifesciences.org/articles/57096/elife-57096-fig1-data1-v2.xlsx
Figure 1—figure supplement 1
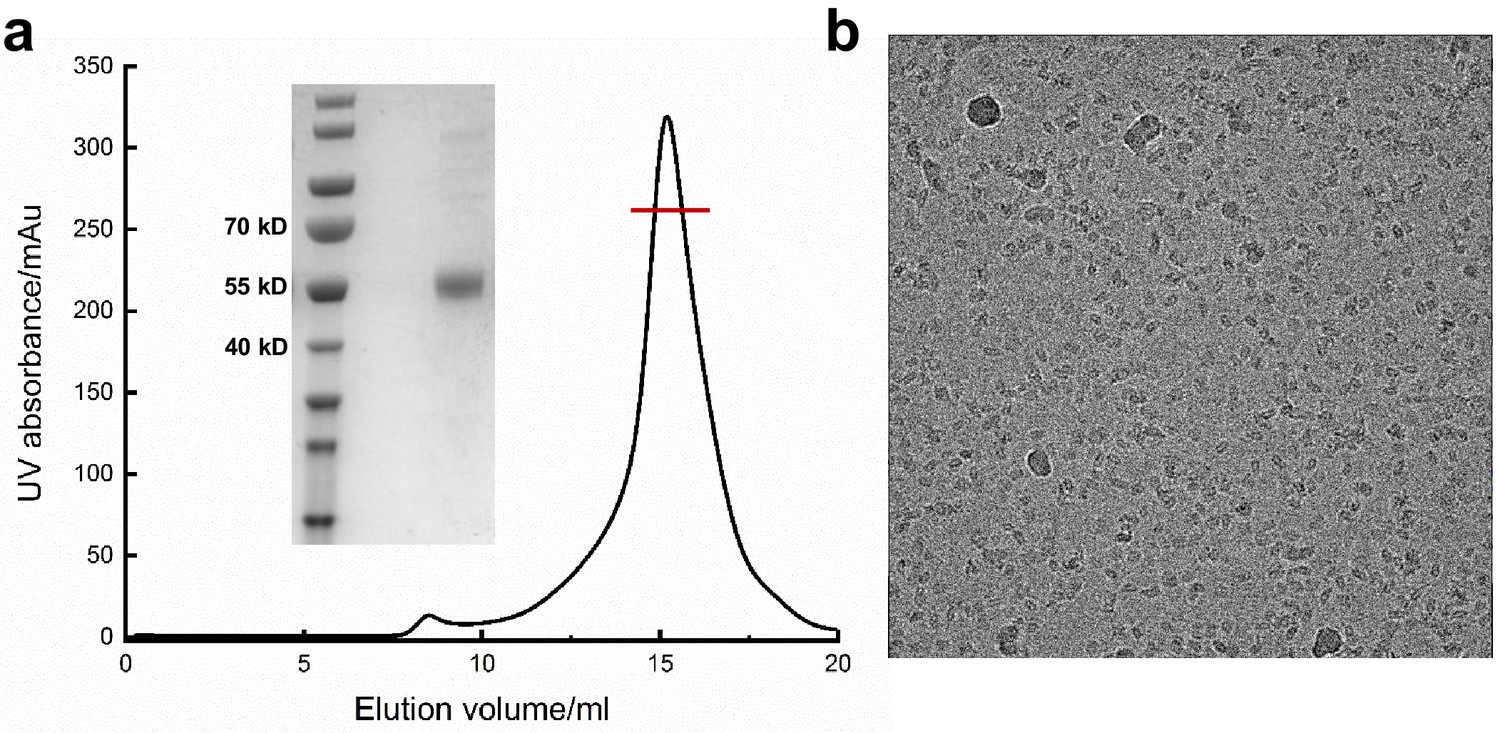
Purification of hASIC1aΔC for cryo-EM study.
(a) A representative size-exclusion chromatography of hASIC1aΔC and the SDS–PAGE of the peak fractions (insert, coomassie staining). The peak fraction collected for structural determination in indicated. (b) Representative electron micrograph of the hASIC1aΔC.
Figure 2 with 2 supplements
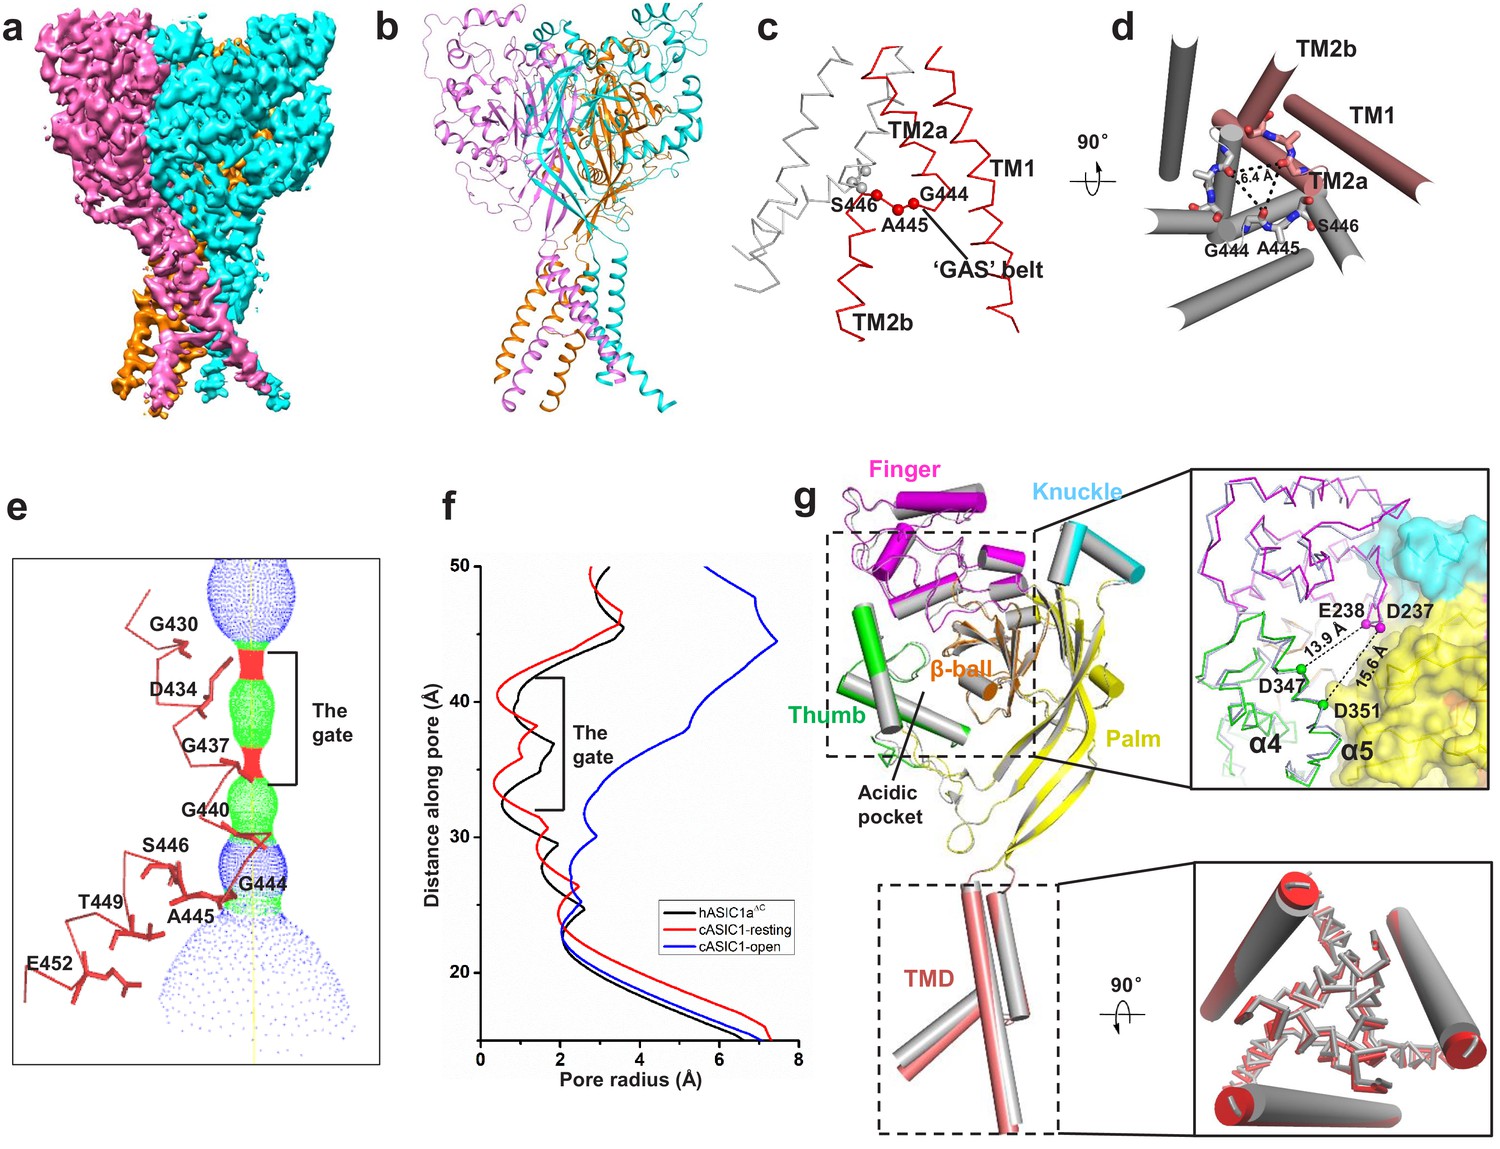
Cryo-EM structure of apo-hASIC1aΔC.
(a) Cryo-EM density map of apo-hASIC1aΔC. The three hASIC1aΔC subunits are colored orange, cyan and pink. (b) Overall structure of trimeric hASIC1aΔC, with different colors representing each subunit. (c) Ribbon representation of the hASIC1aΔC TMD. Two subunits are colored red and grey, respectively. The Cα atoms of the ‘GAS belt’ (G444-A445-S446) are shown as spheres. (d) View of the TMD from the intracellular side. Residues in the GAS belt are shown in stick representations. Distances between the Gly444 carbonyl oxygen atoms are indicated. (e) Close-up view of the pore domain. Map of solvent-accessible pathway is shown (red <1.4 Å<green < 2.3 Å<blue). Residues in TM2 lining the pore are shown as sticks. (f) Plot of radius as a function of longitudinal distance along the pore for hASIC1aΔC (black), cASIC1 in a resting state (red, PDB 6AVE) and cASIC1 in an open state (blue, PDB 4NTW). (g) Single subunit superposition of the apo-hASIC1aΔC and apo-cASIC1 channels in the resting state (PDB 6AVE) indicates the high similarity of the two structures. The hASIC1aΔC is represented with each domain in different colors, and cASIC1 is colored gray. The inserts show the close-up view of the acidic pocket (upper panel) and the TMD (lower panel) from the superposed hASIC1aΔC and cASIC1. For clarity, the TM1 of the TMD is shown in cartoon representation, and the TM2 is in ribbon.
Figure 2—figure supplement 1

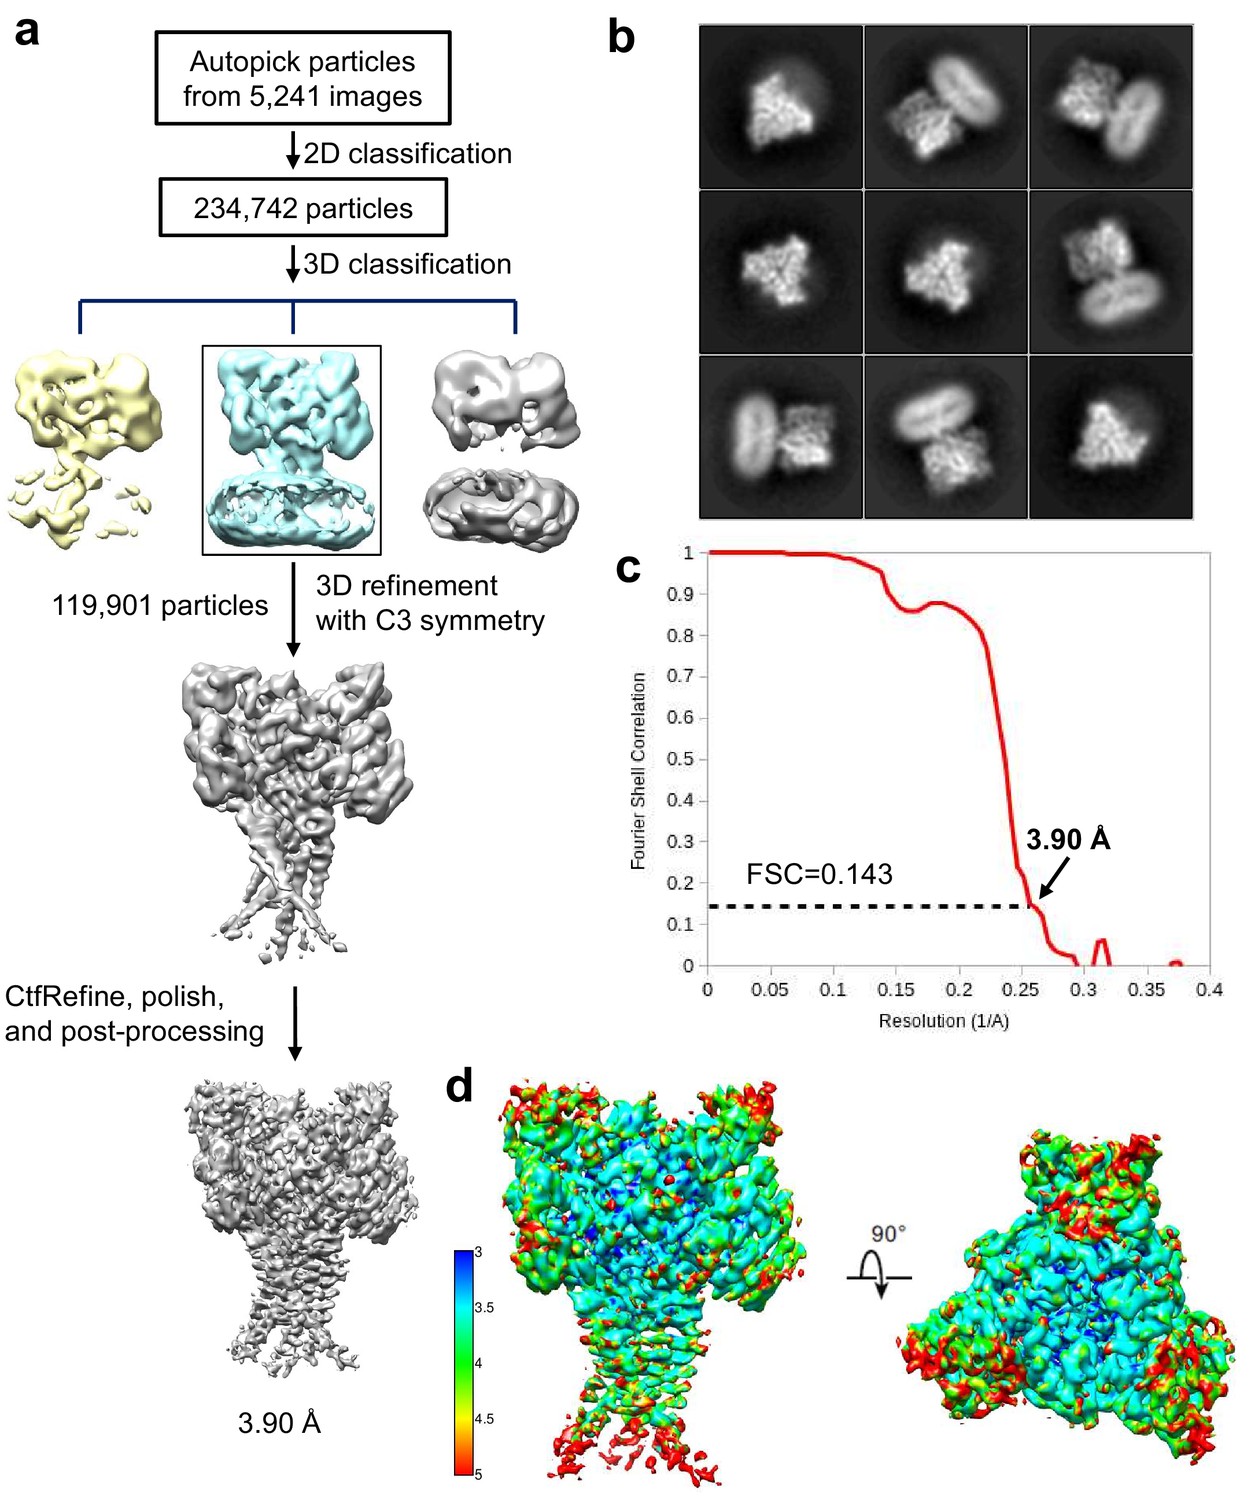
Cryo-EM structure determination of hASIC1aΔC.
(a) Flowchart of cryo-EM data processing. (b) Representative 2D class averages of the hASIC1aΔC. (c) The gold-standard Fourier shell correlation curve for the cryo-EM map shown in Figure 2a. (d) Cryo-EM map of the hASIC1aΔC colored by local resolution.
Figure 2—figure supplement 2

Structure model building of hASIC1aΔC.
(a) Representative density maps of the secondary structure elements of the hASIC1aΔC. (b) Cartoon representation of a single subunit of the hASIC1aΔC. Each domains are shown in different color.
Figure 3 with 5 supplements
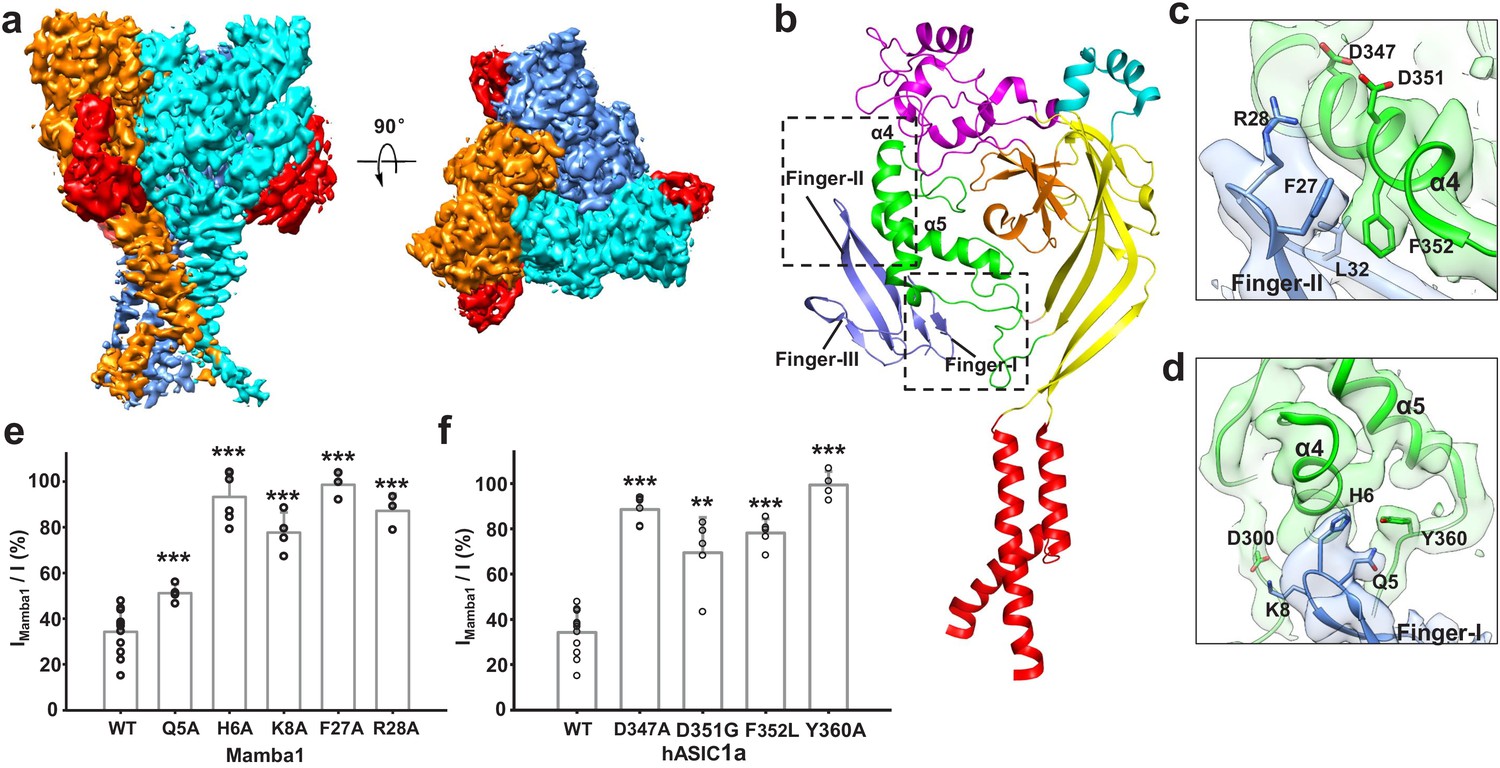
Structural basis of Mamba1 binding to hASIC1aΔC.
(a) Cryo-EM density map of the hASIC1aΔC-Mamba1 complex. The three hASIC1aΔC subunits are colored orange, cyan and slate. Mamba1 is colored red. (b) Overall structure of the hASIC1aΔC-Mamba1 complex. A single subunit of hASIC1aΔC is shown in cartoon representation, with each domain in a different color. Mamba1 is shown as a slate-colored ribbon. (c, d) Close-up views of the interactions of the Finger-I (c) and Finger-II (d) regions of Mamba1 with the thumb domain of hASIC1aΔC. (e, f) Bar graph representing the inhibition of wild-type hASIC1a currents by Mamba1 mutants (e) and hASIC1a mutants by wild-type Mamba1 (f). Imamba1 and I represent the currents elicited by the pH 6.0 solution in the presence and absence of Mamba1 toxin, respectively. Data are presented as the means ± SD. Comparison wild-type Mamba1 (e) or hASIC1a (f) unless specified, ***p<0.001; **p<0.01; *p<0.05 (t-test).
-
Figure 3—source data 1
Source data for Figure 3e and f.
- https://cdn.elifesciences.org/articles/57096/elife-57096-fig3-data1-v2.xlsx
Figure 3—figure supplement 1
Cryo-EM structure determination of hASIC1aΔC-Mamba1 complex.
(a) Flowchart of cryo-EM data processing. (b) Representative 2D class averages of the hASIC1aΔC-Mamba1 complex. (c) The gold-standard Fourier shell correlation curve for the cryo-EM map shown in Figure 3a. (d) Cryo-EM map of the hASIC1aΔC-Mamba1 complex colored by local resolution.
Figure 3—figure supplement 2

Structure model building of hASIC1aΔC-Mamba1 complex.
(a–b) Representative density maps of the secondary structure elements of the Mamba1 (a) and hASIC1aΔC (b). (c) Cartoon representation of a single subunit of the hASIC1aΔC-Mamba1 complex. Each domain are show in different color. Insert shows conformation change of Mamba1 after binding to hASIC1a. Structure comparison indicates the tip region of Finger II of Mamba1 flips to the thumb domain of hASIC1a. Apo form Mamba1 is colored in light pink (PDB 5DZ5). The Mamab1 and the thumb domain of hASIC1a in the hASIC1aΔC-Mamba1 complex are colored in light blue and green, respectively.
Figure 3—figure supplement 3
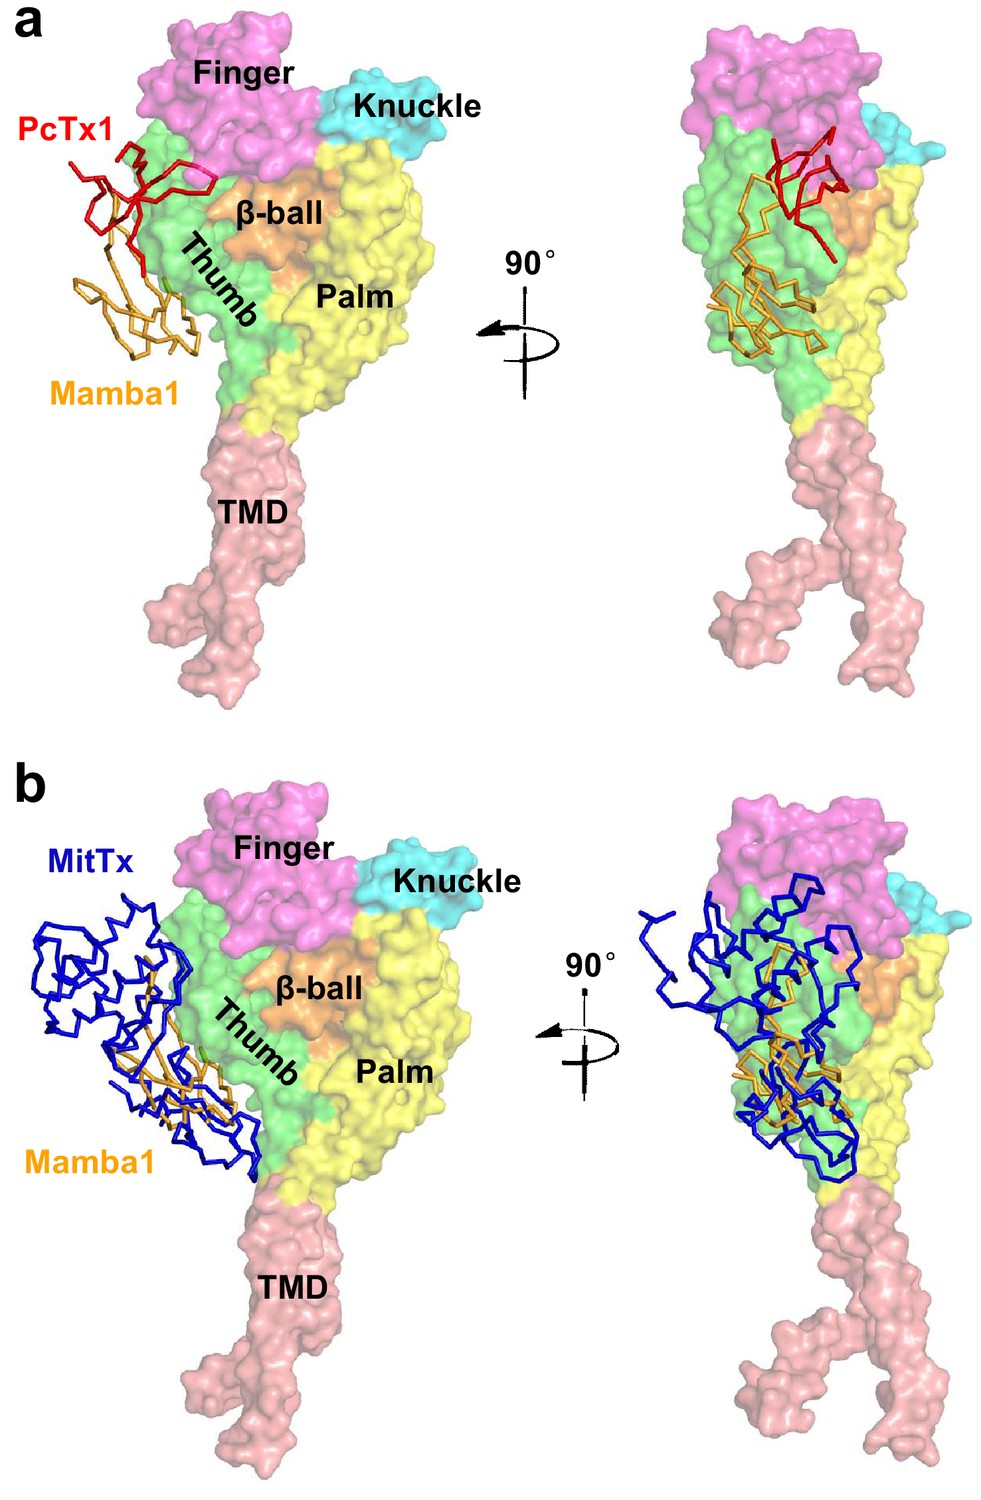
The overlapping of the binding site of toxins on ASIC.
The binding site of Mamba1 (orange) to hASIC1a overlaps with binding sites of the psalmotoxin (PcTx1, red, a) and MitTx (blue, b) to cASIC1. The psalmotoxin and MitTx are divided from the structures of cASIC1-psalmotoxin complex (PDB 4FZ1) and cASIC1-MitTx complex (PDB 4NTW), respectively, and docked to the hASIC1aΔC structure. The hASIC1aΔC is shown in surface representation with each domain in different color, and toxins are in ribbon representation.
Figure 3—figure supplement 4
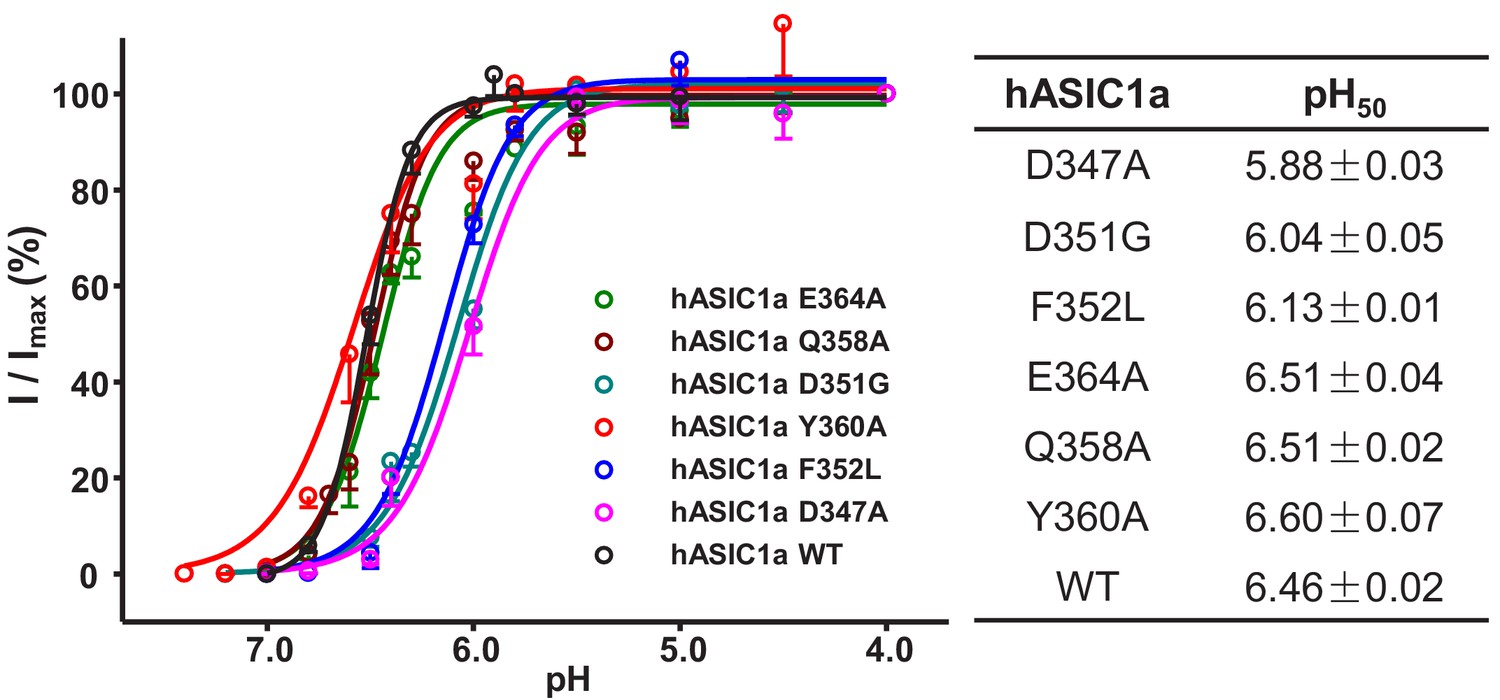
pH-dependent activation of the hASIC1a mutants currents.
Data were collected from CHO cells transfected with hASIC1a or hASIC1a mutants DNA. Data are presented as the mean ± SEM.
Figure 3—figure supplement 5
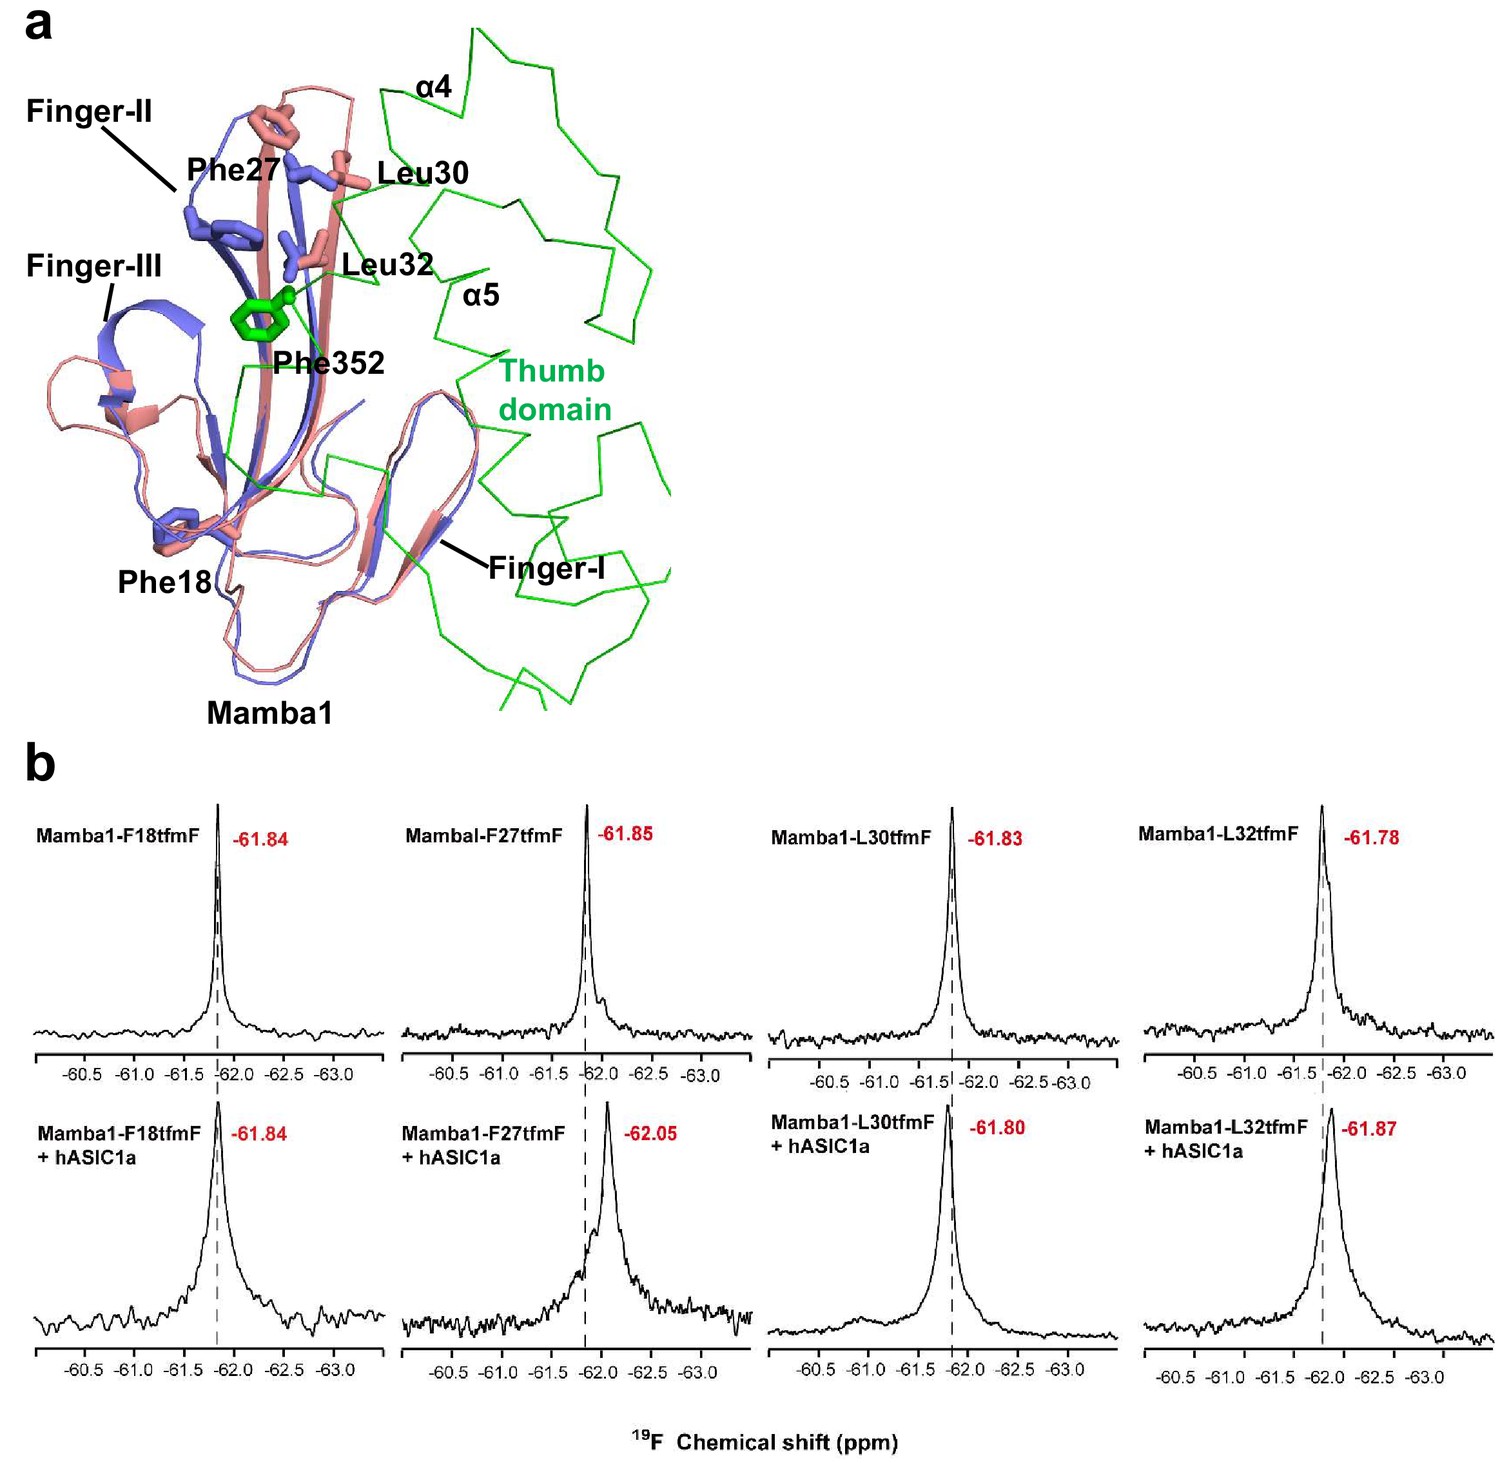
One-dimensional 19F-NMR measurements of Mamba1.
(a) Structure comparison of Mamba1 in apo from (pink, PDB 5D5Z) and in complex with hASIC1a (blue), showing the conformational change of Mamba1 after binding to hASIC1a is shown. Structure comparison indicates the tip region of Finger II of Mamba1 flips to the thumb domain of hASIC1a. (b) One-dimensional 19F-NMR measurements were performed using Mamba1 with substitution of F18tfmF, F27tfmF, L30tfmF or L32tfmF in the absence or presence of hASIC1aΔC. The chemical shift for each measurement is indicated.
Figure 4 with 1 supplement
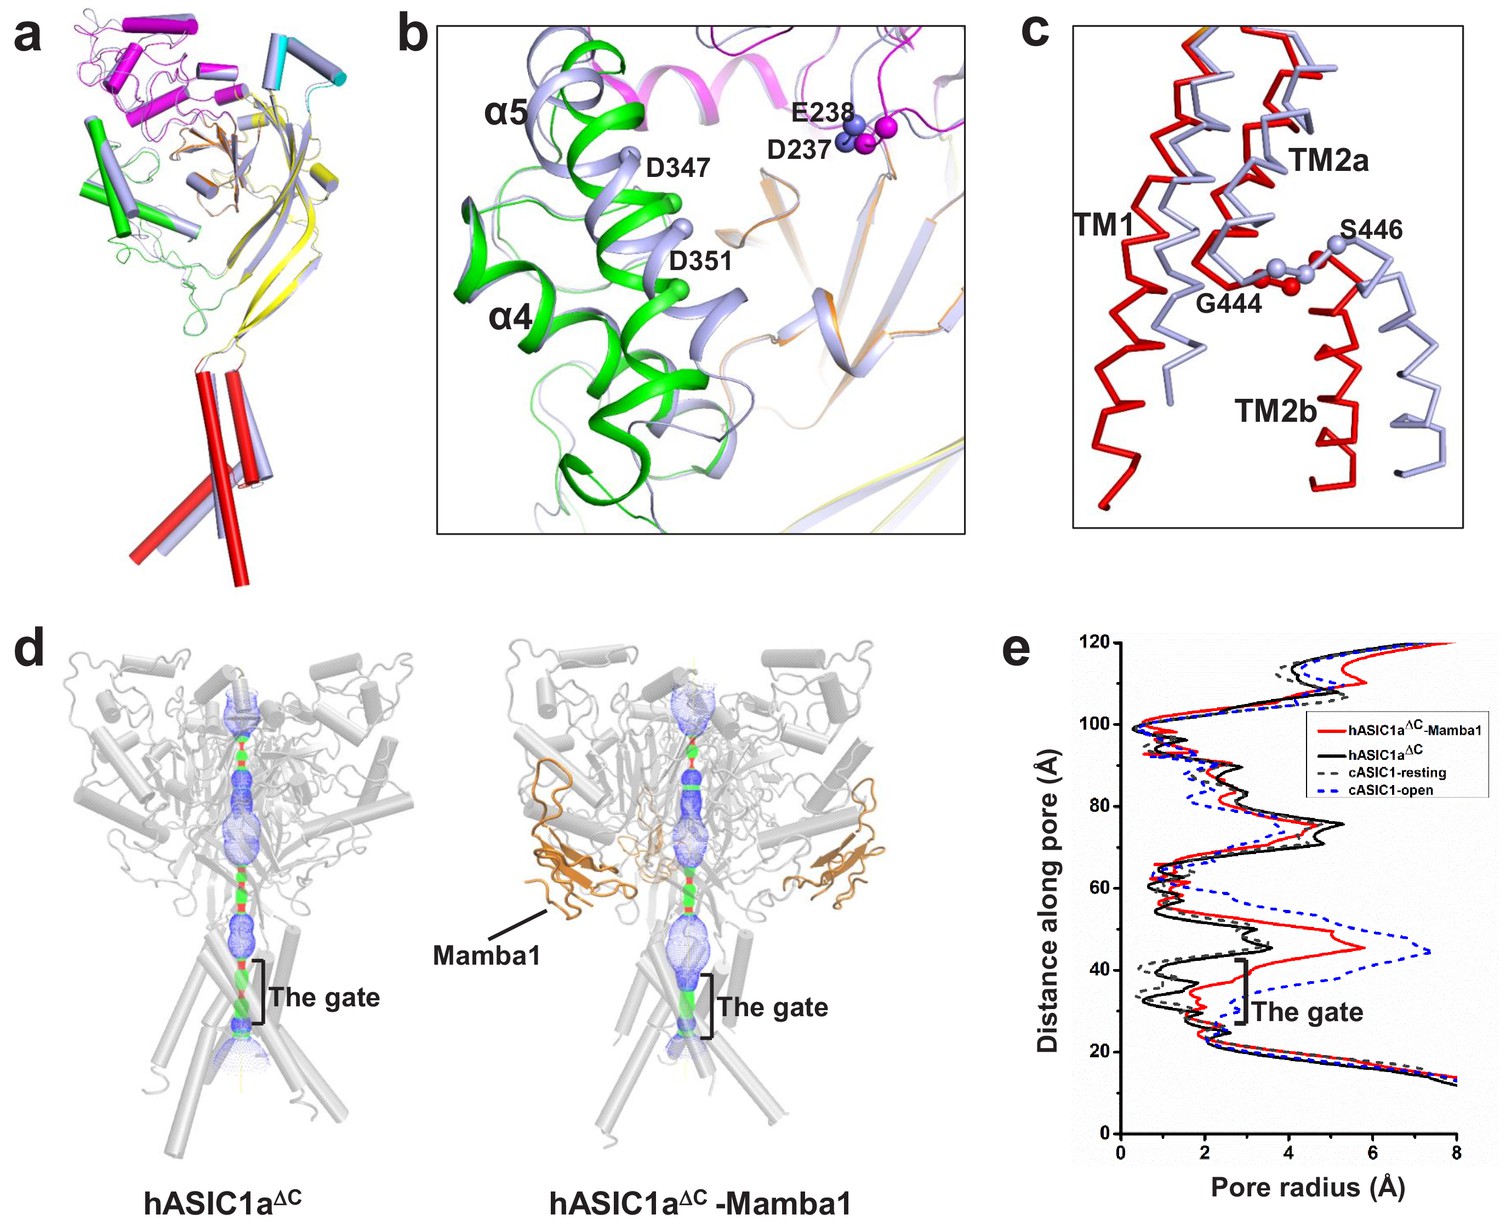
The structure of hASIC1aΔC inhibited by Mamba1.
(a) Single-subunit superposition of apo form and Mamba1-bound hASIC1aΔC shows global conformational changes. The domains of apo-hASIC1aΔC are shown in different colors, and Mamba1-bound hASIC1aΔC is colored grey. (b, c) Conformational changes in the acidic pocket and TMD of hASIC1aΔC upon Mamba1 binding. (b) View of the acidic pocket from superposed apo- and Mamba1-bound hASIC1aΔC. hASIC1aΔC is shown in cartoon representation and colored as in (a). Cα atoms of Glu238 and Asp347, Asp239 and Asp351 are shown as spheres. (c) View of the TMD from superposed apo- and Mamba1-bound hASIC1aΔC. The TMDs of hASIC1aΔC and the hASIC1aΔC-Mamba1 complex are shown as ribbons in red and grey, respectively. (d) Pore profiles of hASIC1aΔC (left) and the hASIC1aΔC-Mamba1 complex (right) calculated with HOLE software (red <1.4 Å<green < 2.3 Å<blue). (e) Plot of pore radius for the apo-form hASIC1aΔC (black, solid line), hASIC1aΔC-Mamba1 complex (red, solid line), cASIC1 in resting state (grey, dash line, PDB 6AVE), and cASIC1 in open state (blue, dash line, PDB 4NTW) along the threefold molecular axis.
Figure 4—figure supplement 1
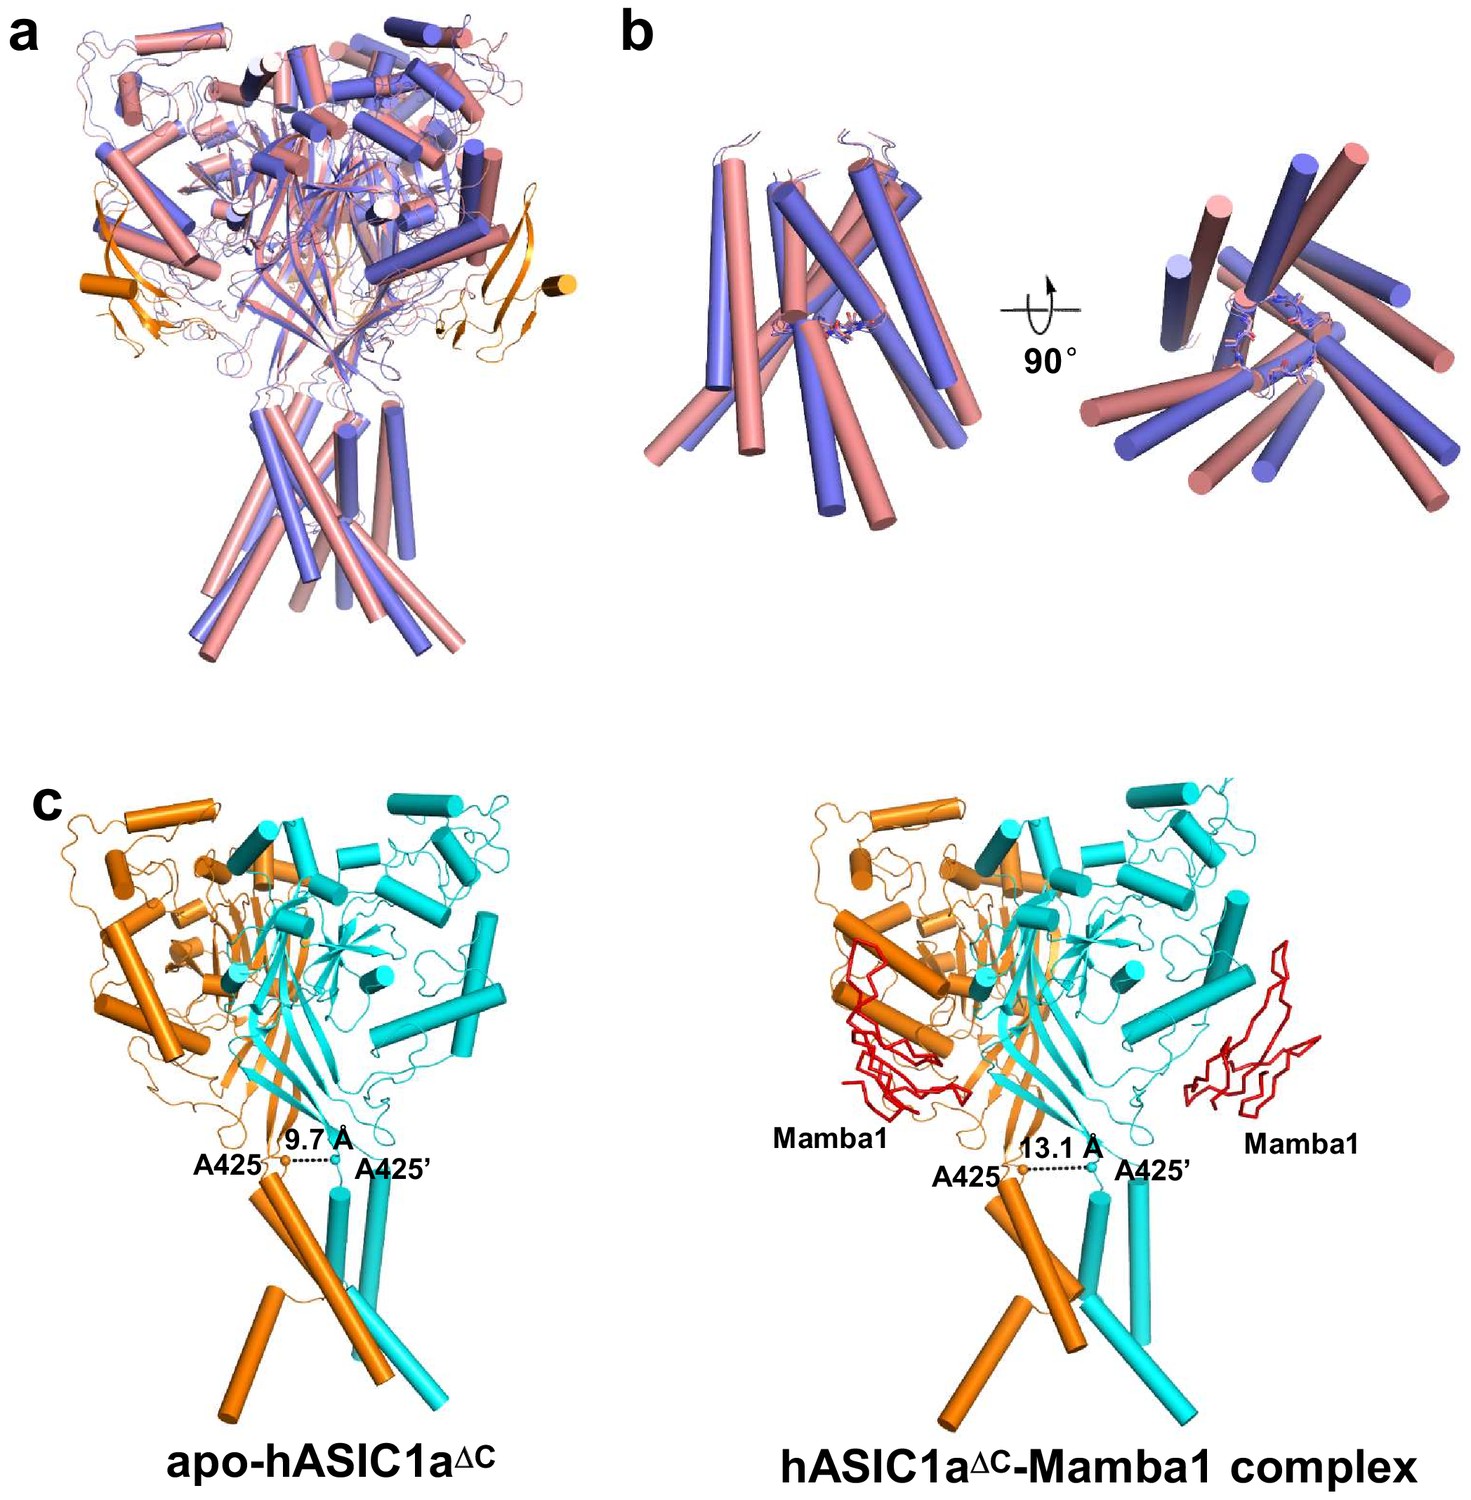
Structure comparison of apo-hASIC1aΔC and hASIC1aΔC-Mamba1 complex.
(a) Overall structure superposition of apo-form (pink) and Mamba1-bound hASIC1aΔC (blue) shows global conformational changes. The Mamba1 molecules is colored orange. (b) View of the TMD from superposed apo- (pink) and Mamba1-bound (blue) hASIC1aΔC. Side view (left) and bottom view (right) are shown. The GAS belts are shown as sticks. (c) Structure comparison of hASIC1aΔC (left) and hASIC1aΔC-Mamba1 complex (right) represents the expansion of the extracellular vestibule. Two subunits of hASIC1aΔC are shown as cartoon in orange and cyan, respectively. The Mamba1 molecules are shown as ribbon in red color. The distance between Cα atoms of Ala425 in the two subunits is indicated.
Figure 5

The ‘closed-state trapping’ model for Mamba1 inhibition of hASIC1a activity.
(a) Typical traces of hASIC1a currents recorded in CHO cells with administrations of Mamba1 (500 nM). The Mamba1 toxin applications were administered either in the absence (upper panel) or presence (middle and lower panels) of the stimulating pH 6.0 application. (b) Bar graph representing the inhibition of the peak currents of hASIC1a statistics with administrations of Mamba1 at pH 6.0 and pH 8.0 (left panel). The inhibition of current amplitudes at the end of such applications are also measured and statistically compared (right panel). (c) pH-dependent activation curves of wild-type hASIC1a (WT) and hASIC1aΔmutants obtained in the absence or presence of Mamba1. (d) The measured pH50 and Hill coefficient values of wild-type hASIC1a (hASIC1a-WT) and hASIC1a mutants in the conditions with or without Mamba1. Data are presented as the mean ± SEM. (e) The closed-state trapping inhibition mechanism of hASIC1a by Mamba1. Mamba1 binding leads to deformation of the proton-sensitive site, then stabilizes the expanded conformation of the acidic pocket and traps the channel in a closed state. The structure of a single subunit of hASIC1aΔC is shown as a cartoon in gray, representing the resting state of the channel (left). The structure of hASIC1aΔC-Mamba1 is shown as a cartoon, with each domain colored differently. Mamba1 is colored blue (right).
-
Figure 5—source data 1
Source date for Figure 5b, c and d.
- https://cdn.elifesciences.org/articles/57096/elife-57096-fig5-data1-v2.xlsx
Figure 6 with 2 supplements
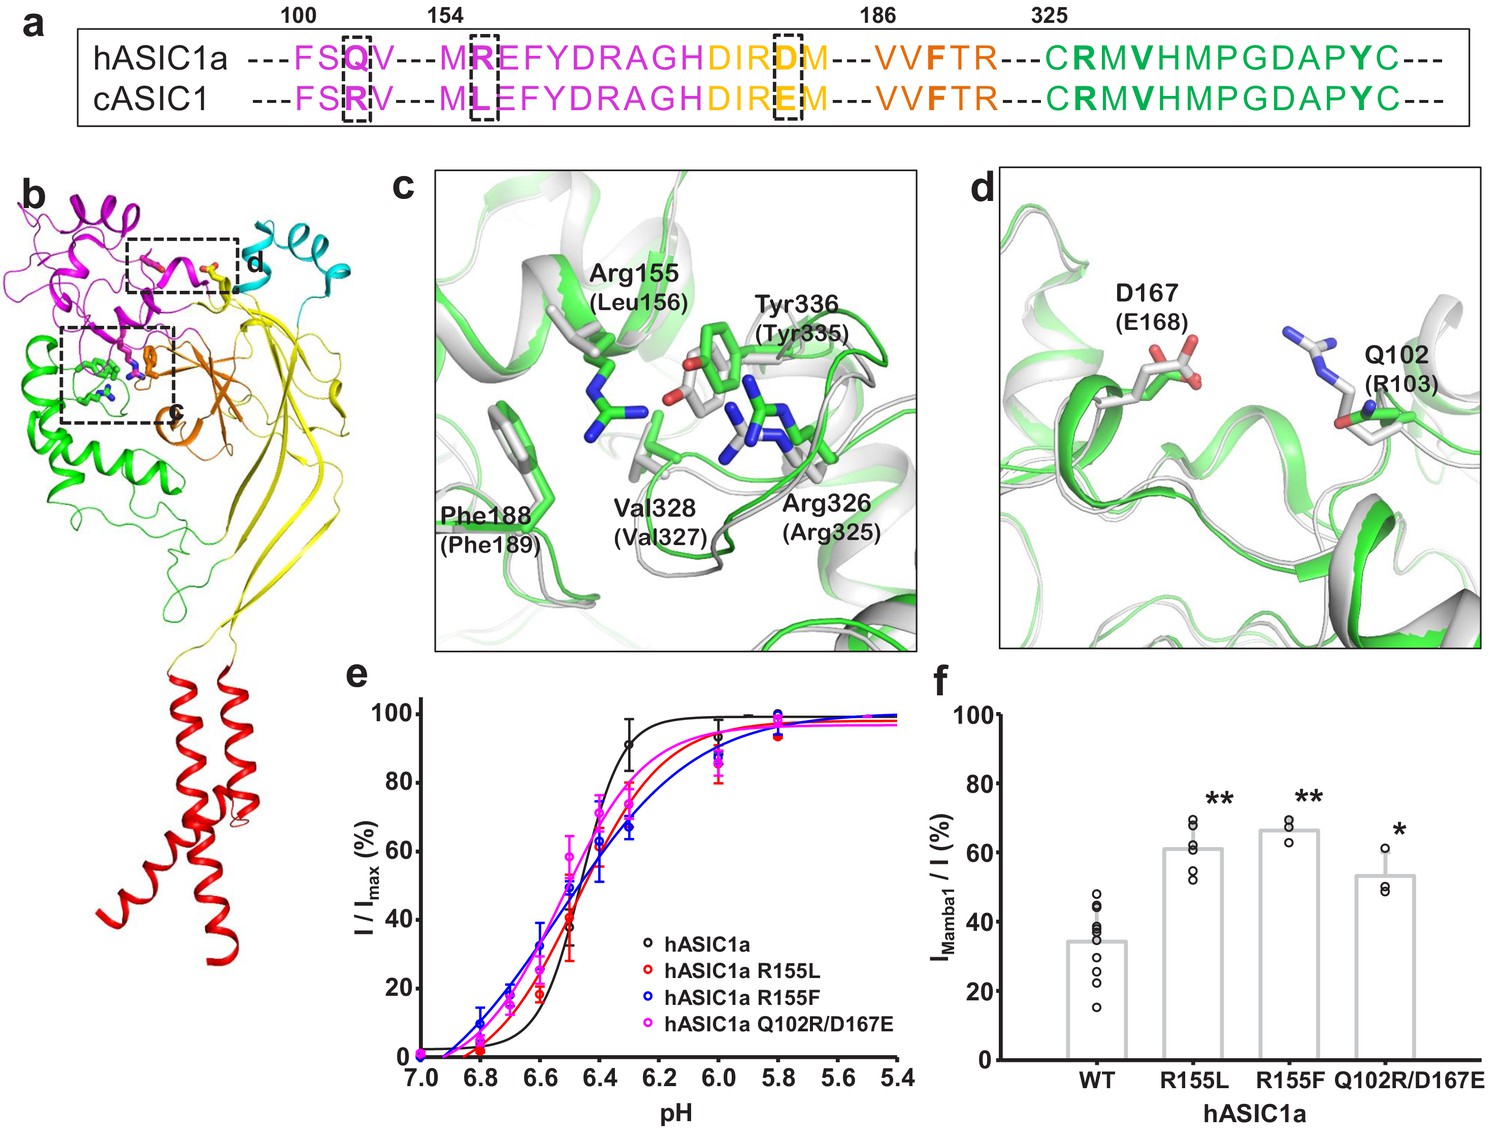
Structural basis for the differing activities of hASIC1a versus cASIC1.
(a) Sequence alignment of hASIC1a and cASIC1 indicates key residues that may contribute to the inhibitory effect of Mamba1 on ASIC. (b) An individual subunit of resting-state hASIC1aΔC. (c, d) Local alignments of hASIC1aΔC (green) with resting-state cASIC1 (grey, PDB 5WKV) demonstrate the possible interactions of residues in two handles. (e) pH-dependence curves of hASIC1a and its mutants. (f) Bar graph representing the inhibitory effect of wild-type Mamba1 (500 nM) on hASIC1a mutants. Data are presented as means ± SD. Comparison with wild-type hASIC1a, **p<0.01; *p<0.05 (t-test).
-
Figure 6—source data 1
Source data for Figure 6e and f.
- https://cdn.elifesciences.org/articles/57096/elife-57096-fig6-data1-v2.xlsx
Figure 6—figure supplement 1
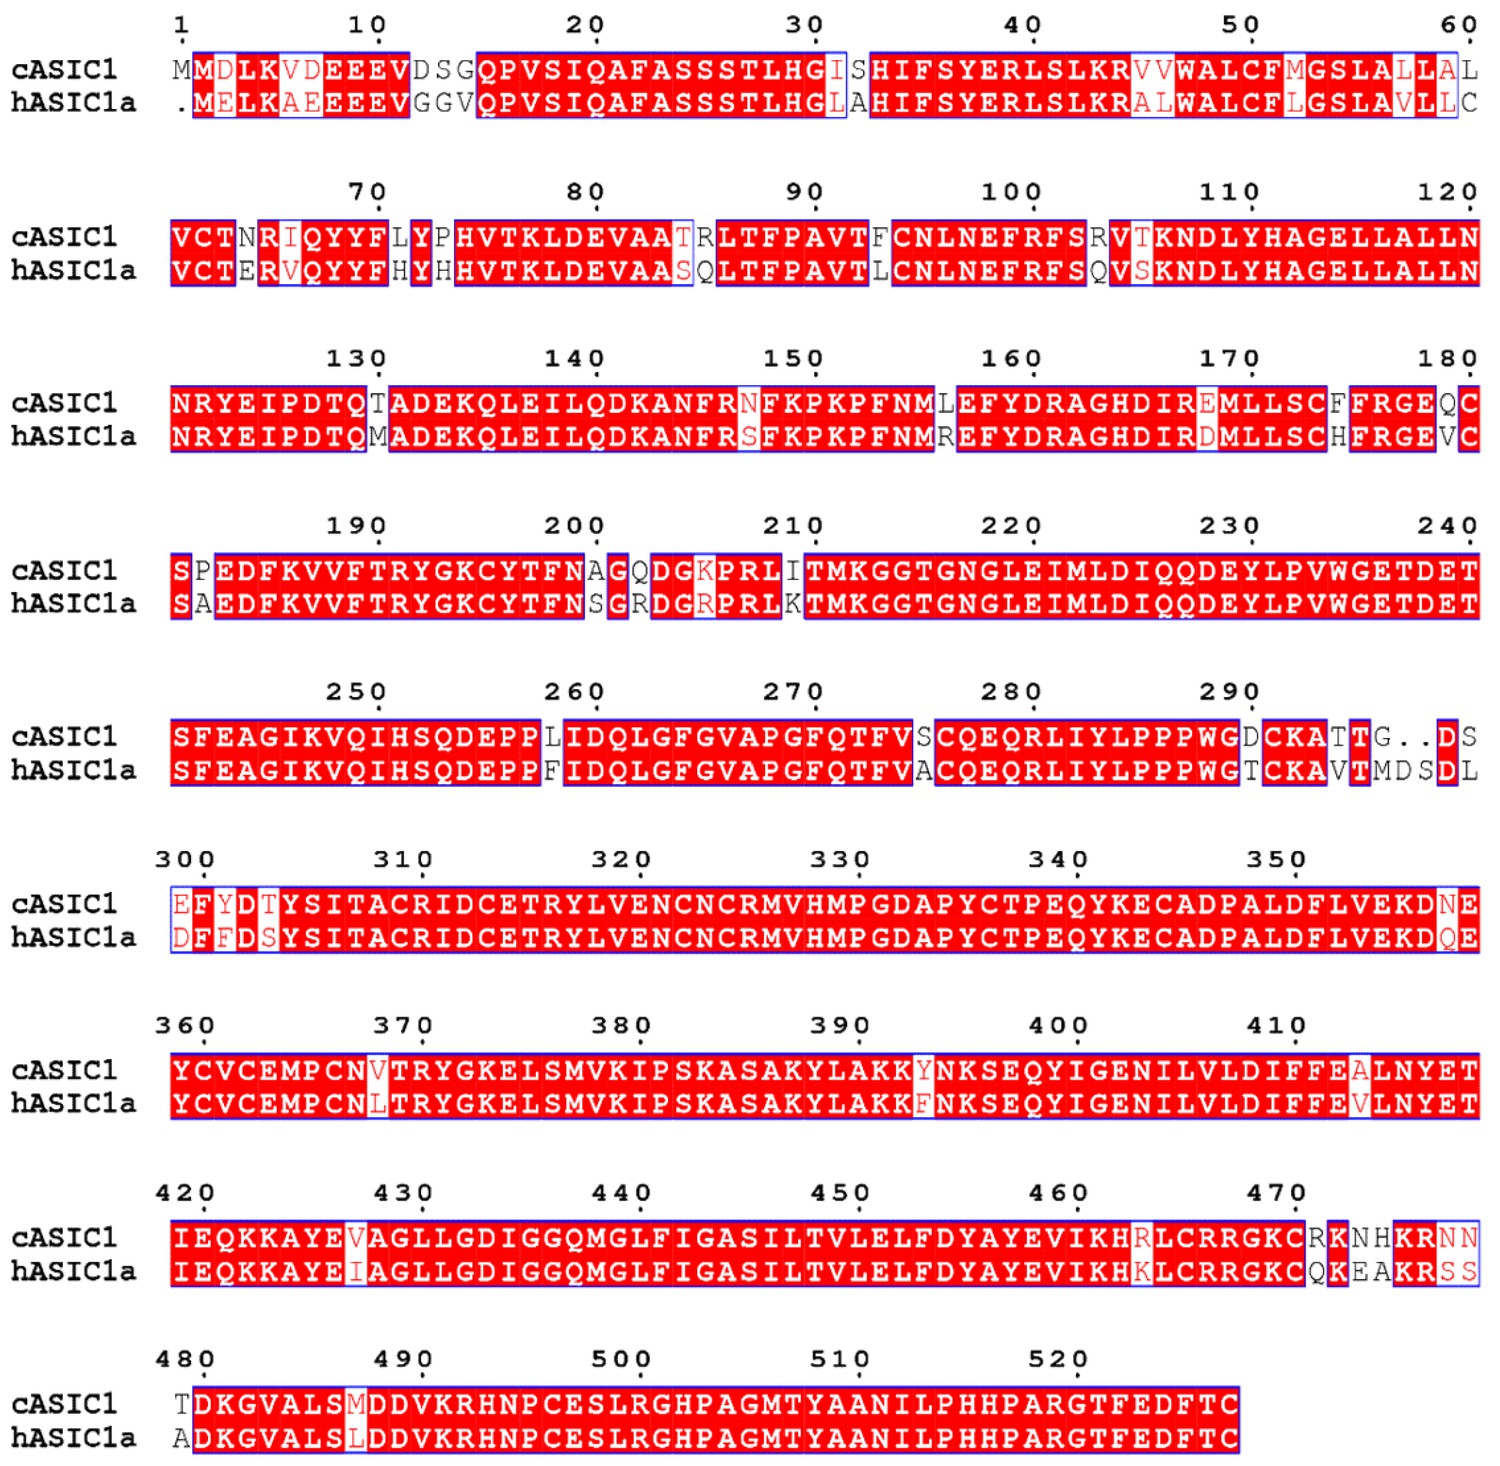
Sequence alignment of chicken ASIC1 and human ASIC1a channels.
Figure 6—figure supplement 2
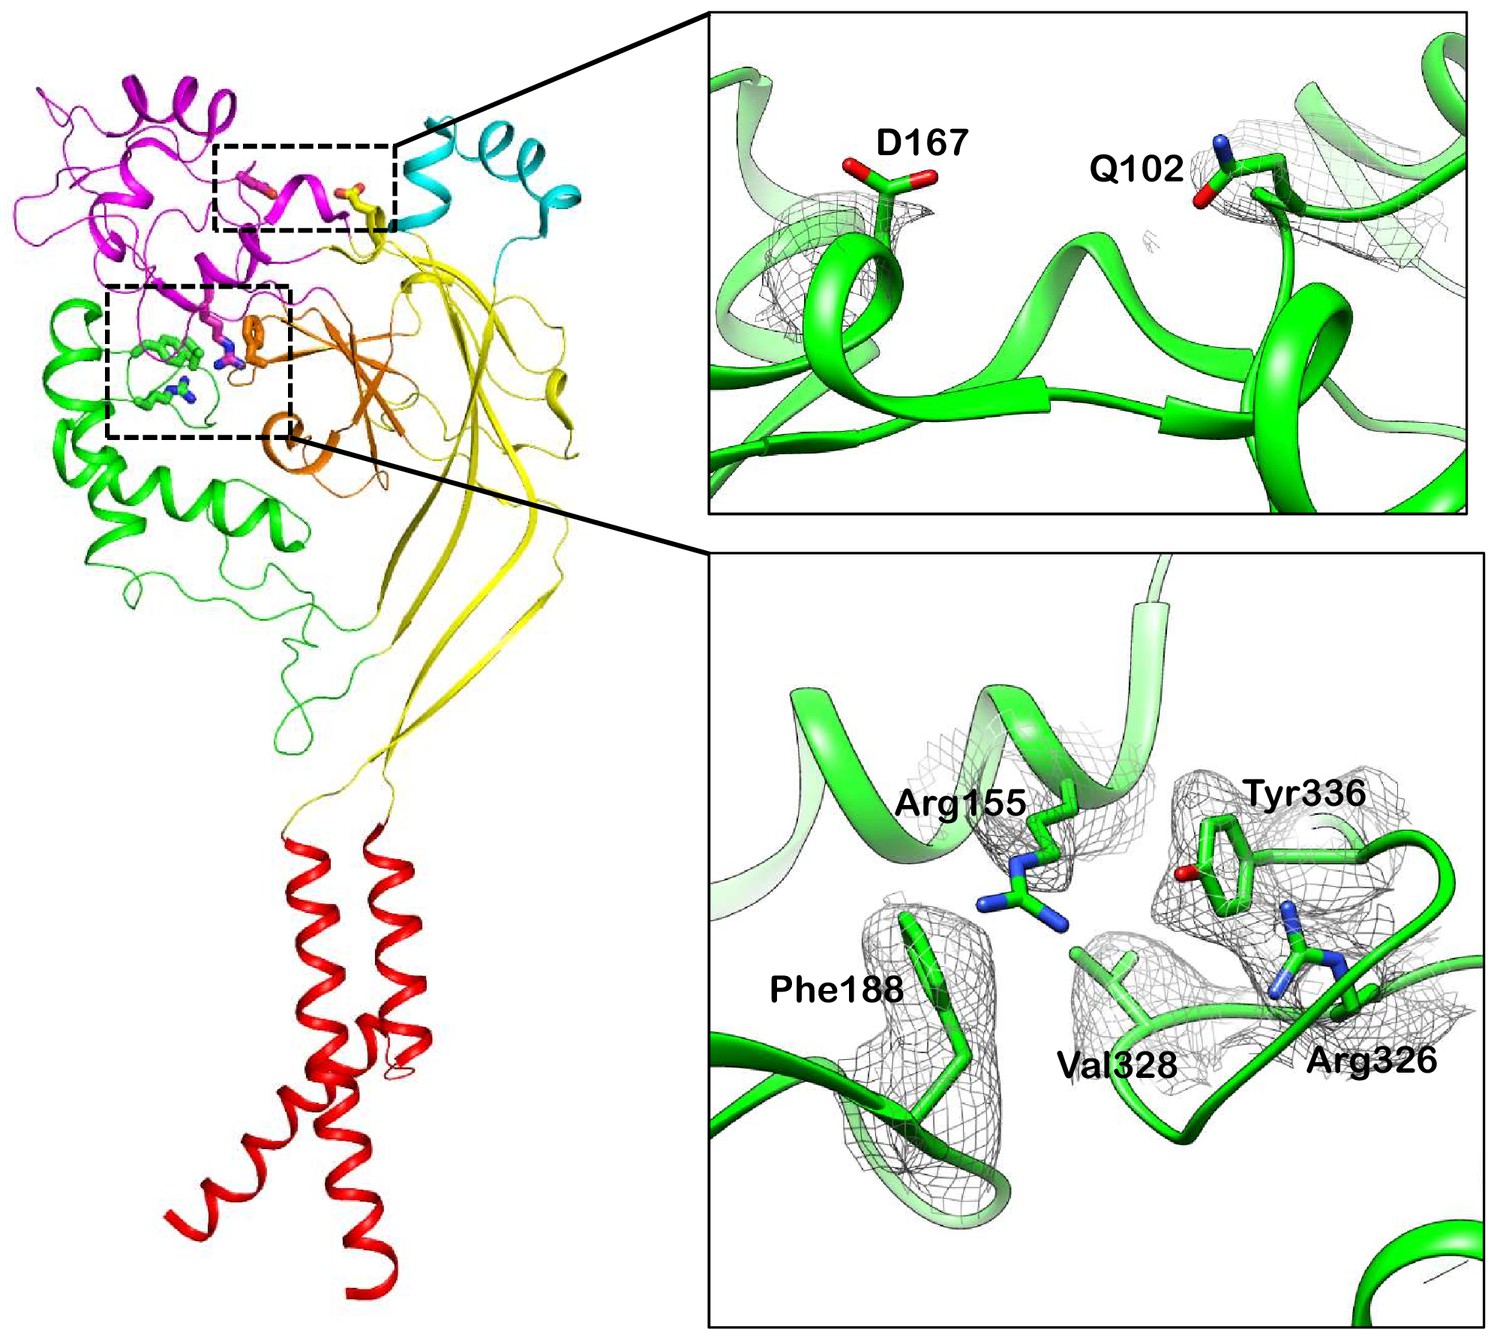
The density maps of the key residues that possibly mediate domain interactions in hASIC1a.
Author response image 1
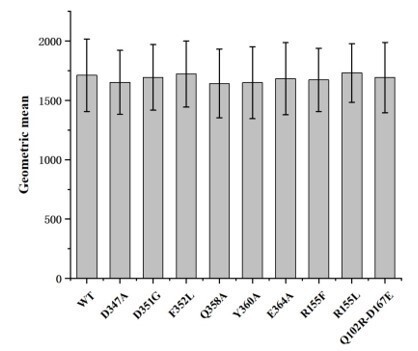
Cell surface expression levels of wild-type hASIC1a and hASIC1a mutants.
Cell surface expression level of the protein were determined by flow cytometry. The data represent mean ± S.D. from 3 independent experiments. Data were analyzed using one-way analysis of variance and t-test in which each mutant was compared to the wild-type channel (WT). The P values are among 0.8-0.9, indicating that the cell surface expression of each hASIC1a mutant is not significantly different from the wild-type hASIC1a.
Author response image 2
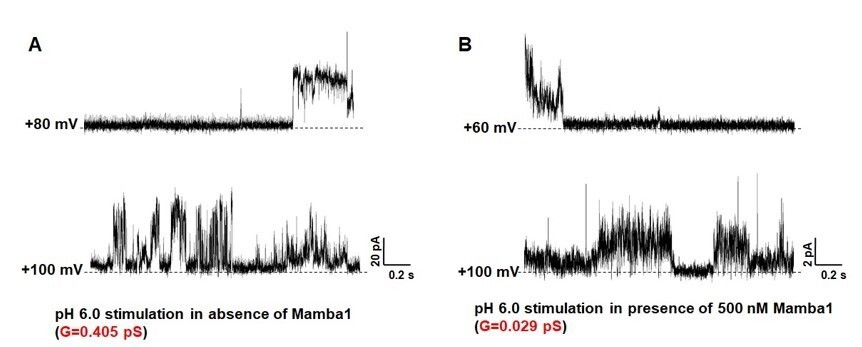
Single-channel currents of hASIC1a.
hASIC1a channel was reconstituted in POPC/POPG (3:1) lipid vesicles. The single channel currents of hASIC1a were recorded at pH 6.0 in the absence (A) and presence (B) of Mamba1 toxin respectively. The membrane potentials were set at 60 mV and 100 mV.
Author response image 3
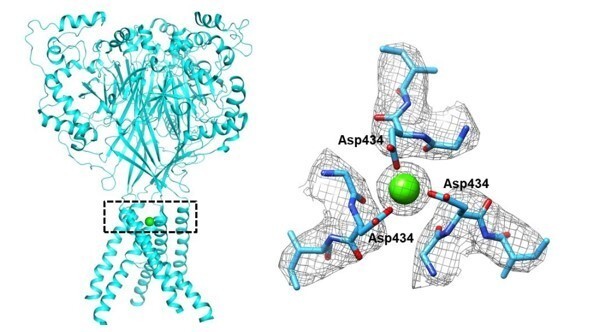
The putative Ca2+ located in the vestibule of the pore of hASIC1a∆C.
Tables
Key resources table
| Reagent type (species) or resource | Designation | Source or reference | Identifiers | Additional information |
|---|---|---|---|---|
| Gene (Homo sapiens) | hASIC1a | GeneBank | NCBI Reference Sequence: NP_001086.2 | All hASIC1a mutants transfected in the paper were obtained starting from this wild-type cDNA |
| Strain, strain background (Escherichia coli) | Top10 | Thermo Fisher Scientific | Cat# 18258012 | |
| Strain, strain background (Escherichia coli) | DH10Bac | Thermo Fisher Scientific | Cat# 10361012 | |
| Cell line (Spodoptera frugiperda) | Sf9 | Thermo Fisher Scientific | Cat# 11496015; RRID:CVCL_0549 | |
| Cell line (Homo sapiens) | HEK-293T | ATCC | Cat#: CRL-3216; RRID:CVCL_0063 | |
| Cell line (Cricetulus griseus) | CHO-K1 | ATCC | Cat# 03480/p693_CHO-K1; RRID:CVCL_0214 | |
| Recombinant DNA reagent | pFastBac1 | Invitrogen | ||
| Recombinant DNA reagent | pcDNA3.1 | Invitrogen | ||
| Chemical compound, drug | n-Dodecyl-β-D-Maltoside (DDM) | Anatrace | Cat#: D310 | |
| Chemical compound, drug | Cholesterol Hemisuccinate tris Salt (CHS) | Sigma-Aldrich | Cat#: C6013 | |
| Peptide, recombinant protein | Mamba1 | This paper | UniProtKB: P0DKR6 | Mamab1 and mutants were obtained by chemical synthesis |
| Software, algorithm | Gctf | Zhang, 2016 | https://www2.mrc-lmb.cam.ac.uk/research/locally-developed-software/zhang-software/#gctf | |
| Software, algorithm | RELION 3.1 | Zivanov et al., 2018 | http://www2.mrclmb.cam.ac.uk/relion; RRID:SCR_016274 | |
| Software, algorithm | SerialEM | Mastronarde, 2005 | RRID:SCR_017293 | |
| Software, algorithm | PHENIX | Liebschner et al., 2019 | https://www.phenixonline.org; RRID:SCR_014224 | |
| Software, algorithm | Coot | Emsley et al., 2010 | https://www2.mrc-lmb.cam.ac.uk/personal/pemsley/coot; RRID:SCR_014222 | |
| Software, algorithm | UCSF Chimera | Pettersen et al., 2004 | https://www.cgl.ucsf.edu/chimera; RRID:SCR_004097 | |
| Software, algorithm | PyMol | Schrödinger | https://pymol.org/2; RRID:SCR_000305 | |
| Software, algorithm | GraphPad Prism 7 | GraphPad Software | https://www.graphpad.com/scientific-software/prism | |
| Software, algorithm | HOLE | Smart et al., 1996 | http://www.holeprogram.org | |
| Others | QUANTIFOIL R1.2/1.3 holey carbon grids | Quantifoil | ||
| Others | Cellfectin | Invitrogen | Cat# 10362100 | |
| Others | Superose 200 Increase 10/300 GL | GE Healthcare | Cat# 28990944 |
Additional files
Download links
A two-part list of links to download the article, or parts of the article, in various formats.
Downloads (link to download the article as PDF)
Open citations (links to open the citations from this article in various online reference manager services)
Cite this article (links to download the citations from this article in formats compatible with various reference manager tools)
Structural insights into human acid-sensing ion channel 1a inhibition by snake toxin mambalgin1
eLife 9:e57096.
https://doi.org/10.7554/eLife.57096


