Ca2+-dependent release of synaptotagmin-1 from the SNARE complex on phosphatidylinositol 4,5-bisphosphate-containing membranes
- Department of Biophysics, University of Texas Southwestern Medical Center, United States
- Department of Biochemistry, University of Texas Southwestern Medical Center, United States
- Department of Pharmacology, University of Texas Southwestern Medical Center, United States
Figures
Figure 1 with 3 supplements
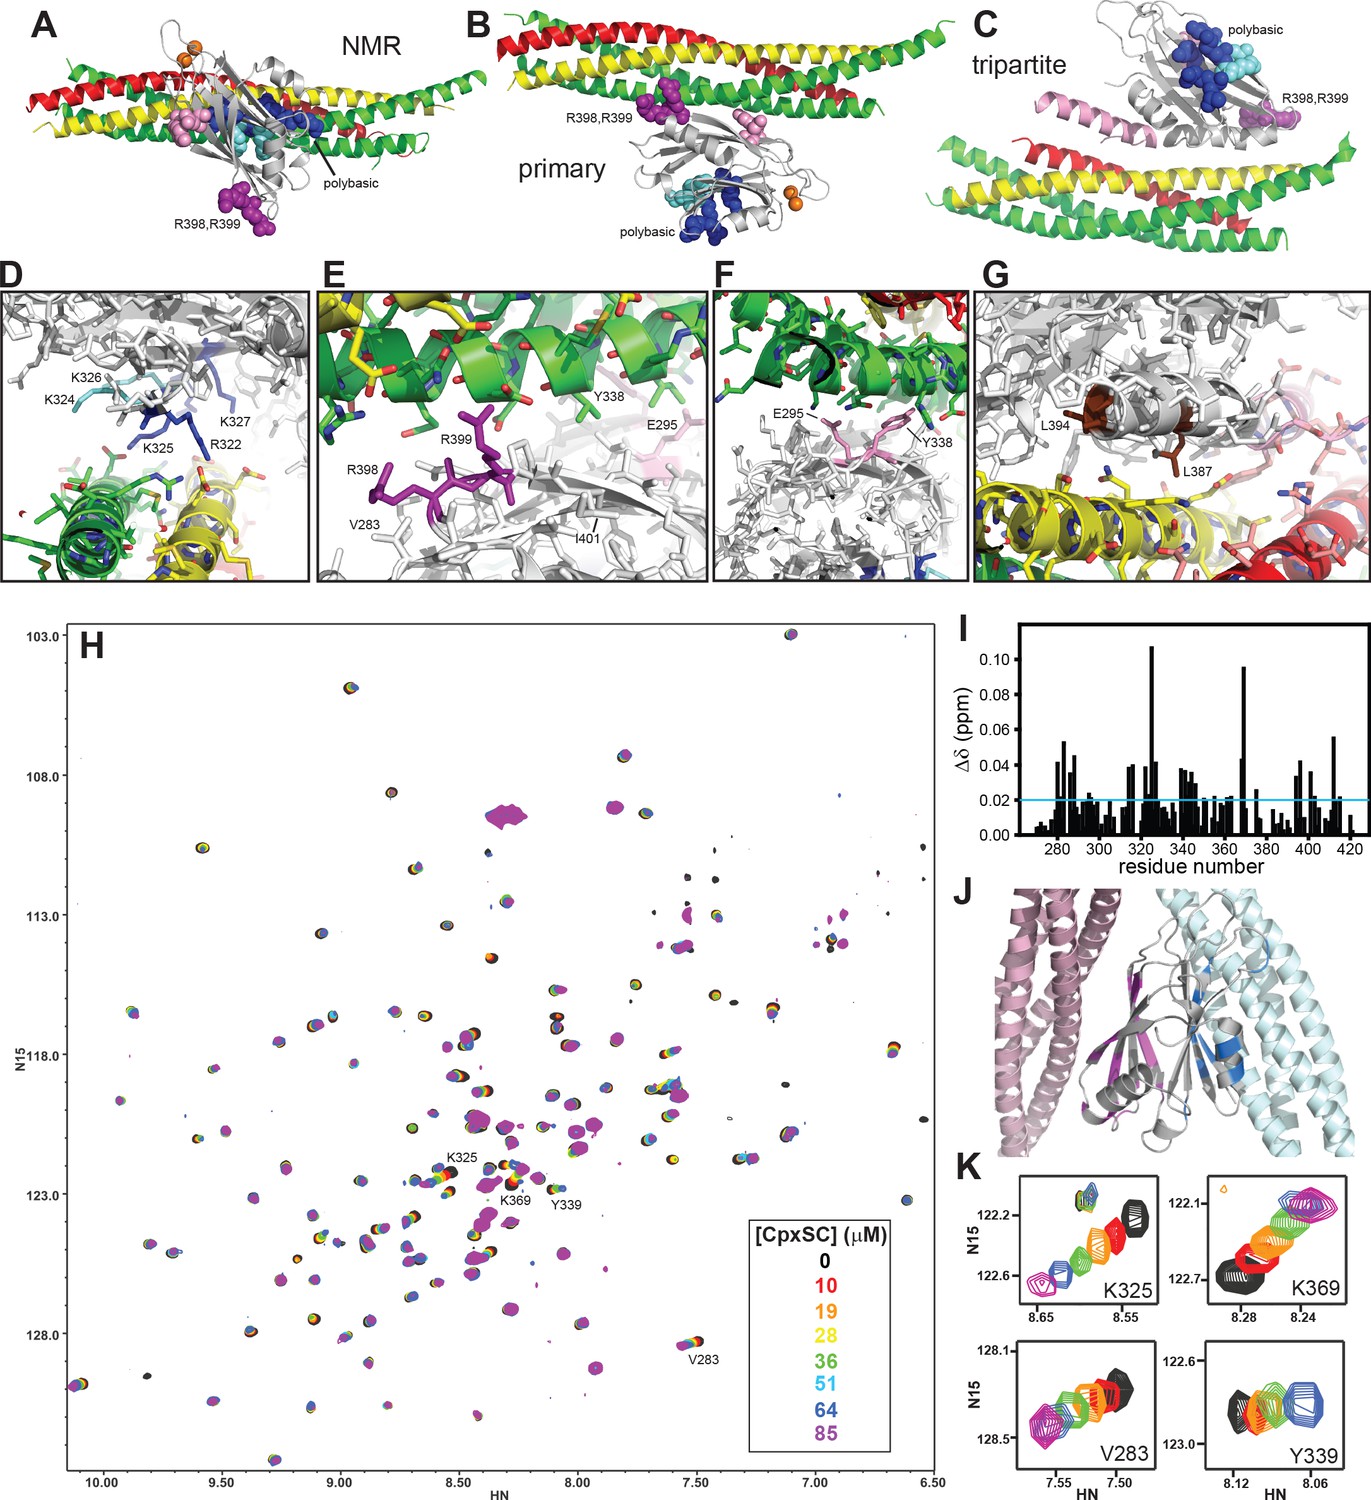
The Syt1 C2B domain binds to CpxSC through the polybasic region and the primary interface in solution.
(A–C) Ribbon diagrams illustrating the structures of the Syt1-SNARE complex solved by NMR spectroscopy (A) or X-ray crystallography without (B) or with a bound complexin-1 fragment (C), which revealed the binding modes mediated by the polybasic region, the primary interface and the tripartite interface, respectively. The PDB accession codes for the structures are 2N1T, 5KJ7 and 5W5C, respectively. Syntaxin-1 is in yellow, synaptobrevin in red, SNAP-25 in green, complexin-1 in pink and the Syt1 C2B domain in gray, with bound Ca2+ ions shown as orange spheres. The side chains of several residues from the polybasic region are shown as dark blue (K313, K321, R322, K325 and K327) or cyan spheres (K324 and K326), those of R398,R399 in primary region II as purple spheres and those of E295 and Y338 in primary region I as pink spheres. (D–G) Close-up views of the polybasic (D), primary region II (E), primary region I (F) and tripartite (G) interfaces. All side chains are shown as stick models, with the same color used in (A–C) for the C2B domain. For the SNARE complex, nitrogen atoms are in blue, oxygen atoms in red and carbon atoms in green (SNAP-25), yellow (syntaxin-1) and pink (complexin-1 and synaptobrevin). The L387 and L394 residues are colored in brown in panel G. Selected side chains are labeled. Note that the structure determined by NMR spectroscopy was highly dynamic and panels (A,D) show just one member of this dynamic ensemble that illustrates the common key feature of the ensemble, namely the involvement of the residues colored in dark blue in binding to a polyacidic patch of the SNARE complex. (H) Superposition of 1H-15N TROSY-HSQC spectra of 2H,15N-IM-13CH3-C2B domain in the absence of Ca2+ and the presence of different concentrations of CpxSC as indicated by the color code (C2B concentrations gradually decreased from 32 to 12 μM). Cross-peaks broadened gradually with increasing CpxSC concentrations and contour levels were adjusted to allow observation of most cross-peaks in each spectrum. Some cross-peaks broadened beyond detection at high CpxSC concentrations. (I) Chemical shift changes induced by 51 μM CpxSc on the 1H-15N TROSY-HSQC cross-peaks of the C2B domain. Composite Δδ values were calculated as [(Δδ1H)2+(0.17*Δδ15N)2]1/2, where Δδ1H is the chemical shift change in the 1H dimension and Δδ15N is the chemical shift change in the 15N dimension. (J) Summary of the largest chemical shift changes caused by 51 μM CpxSc on the 1H-15N TROSY-HSQC cross-peaks of the C2B domain. A ribbon diagram of the C2B domain (gray) with a SNARE complex bound to the primary interface on the left (light pink) and SNARE complex bound to the polybasic region on the right (light blue) is shown. C2B domain residues corresponding to cross-peaks with Δδ > 0.02 ppm (blue line in panel I) are highlighted in blue (polybasic region) or pink (primary interface). (K) Expansions showing the changes observed at increasing CpxSC concentrations in the cross-peaks corresponding to K325 and K369 at the polybasic region, and V283 and Y339 at the primary interface. Only spectra at selected concentrations of CpxSC are shown. The color code is the same as in panel H.
Figure 1—figure supplement 1
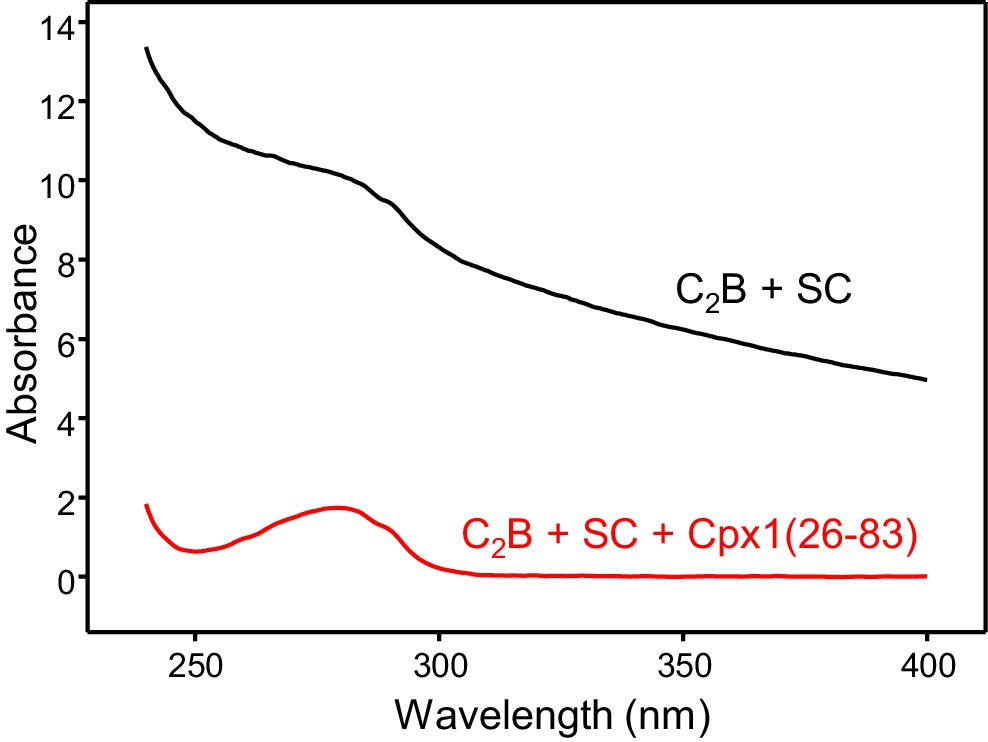
Cpx1(26-83) prevents aggregation of Syt1 C2B-SNARE complexes.
The diagram shows UV spectra of 80 μM Syt1 C2B domain in 20 mM HEPES (pH 7.4), 125 mM KCl, 1 mM Ca2+ and 30 μM SNARE complex without (black trace) or with (red trace) 30 μM Cpx126-83).
Figure 1—figure supplement 2
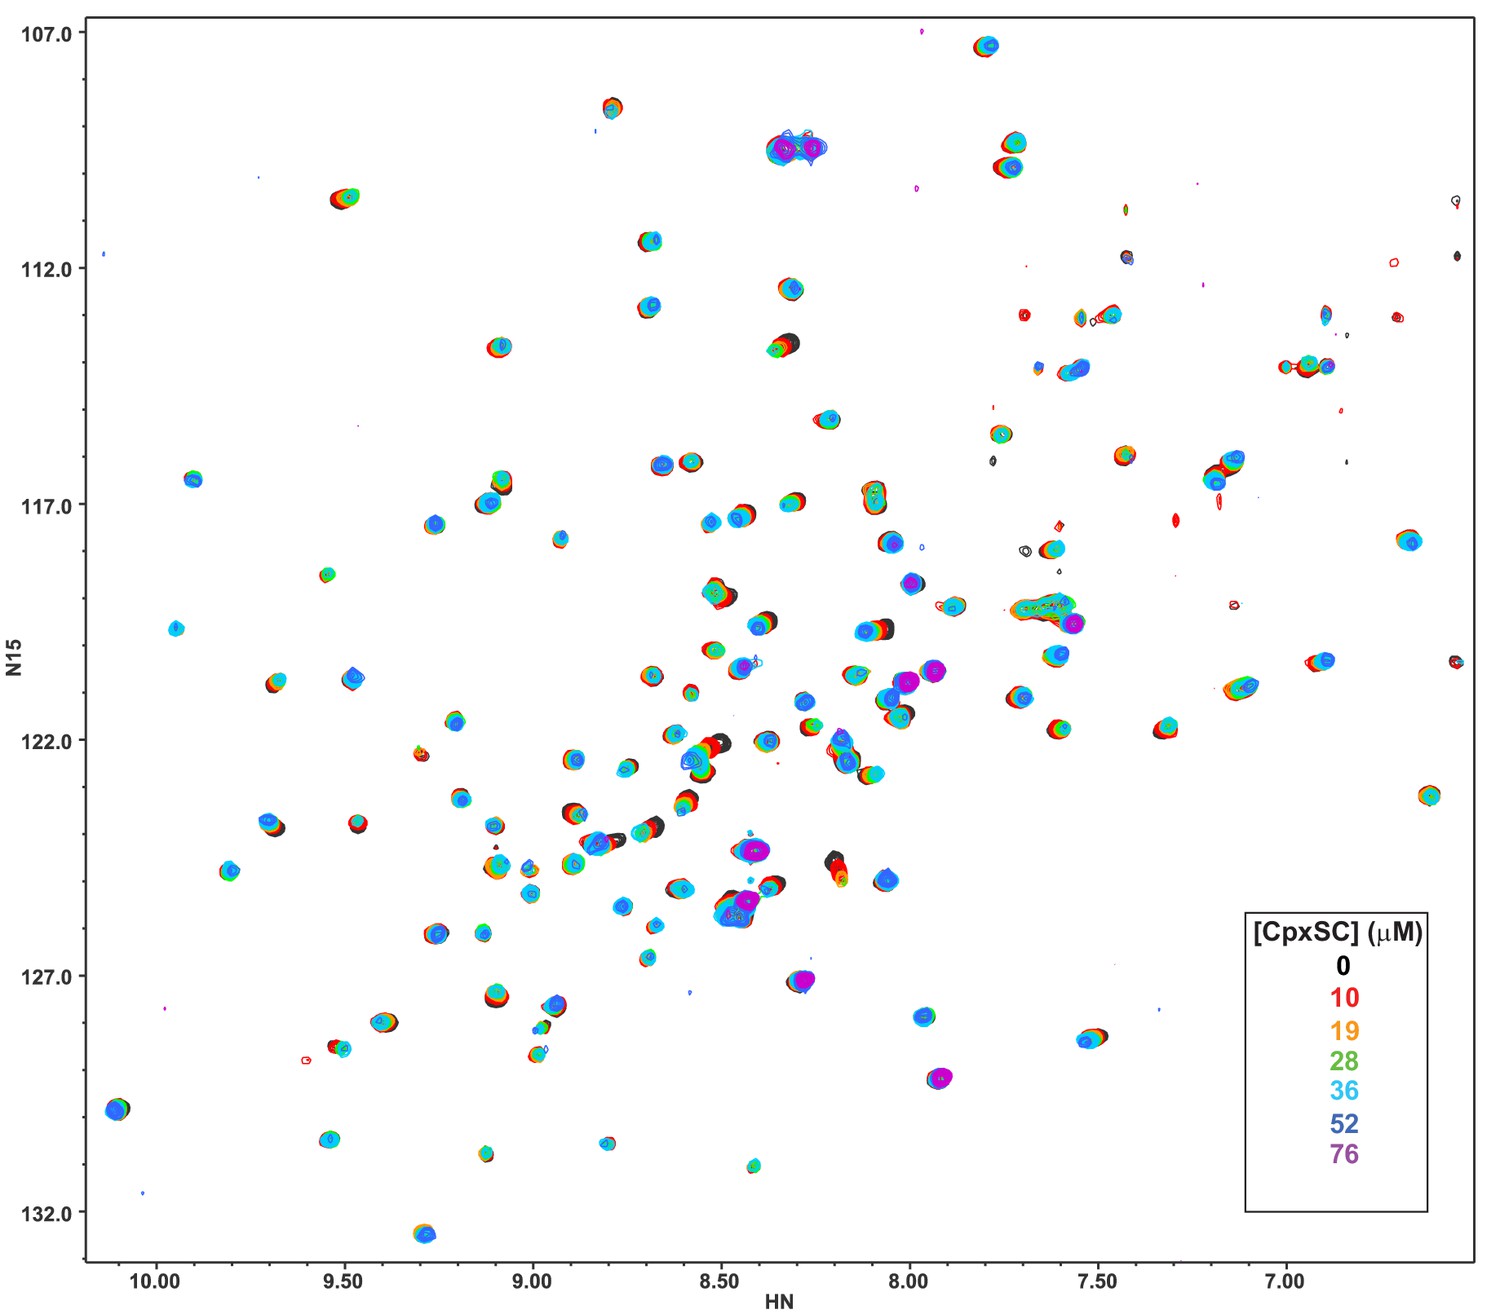
Superposition of 1H-15N TROSY-HSQC spectra of 2H,15N-IM-13CH3-C2B domain in the presence of 1 mM Ca2+ and the presence of different concentrations of CpxSC as indicated by the color code (C2B concentrations gradually decreased from 32 to 12 μM).
Note that cross-peaks broadened gradually with increasing CpxSC concentrations and contour levels were adjusted to allow observation of most cross-peaks in each spectrum. Some cross-peaks broadened beyond detection at high CpxSC concentrations.
Figure 1—figure supplement 3
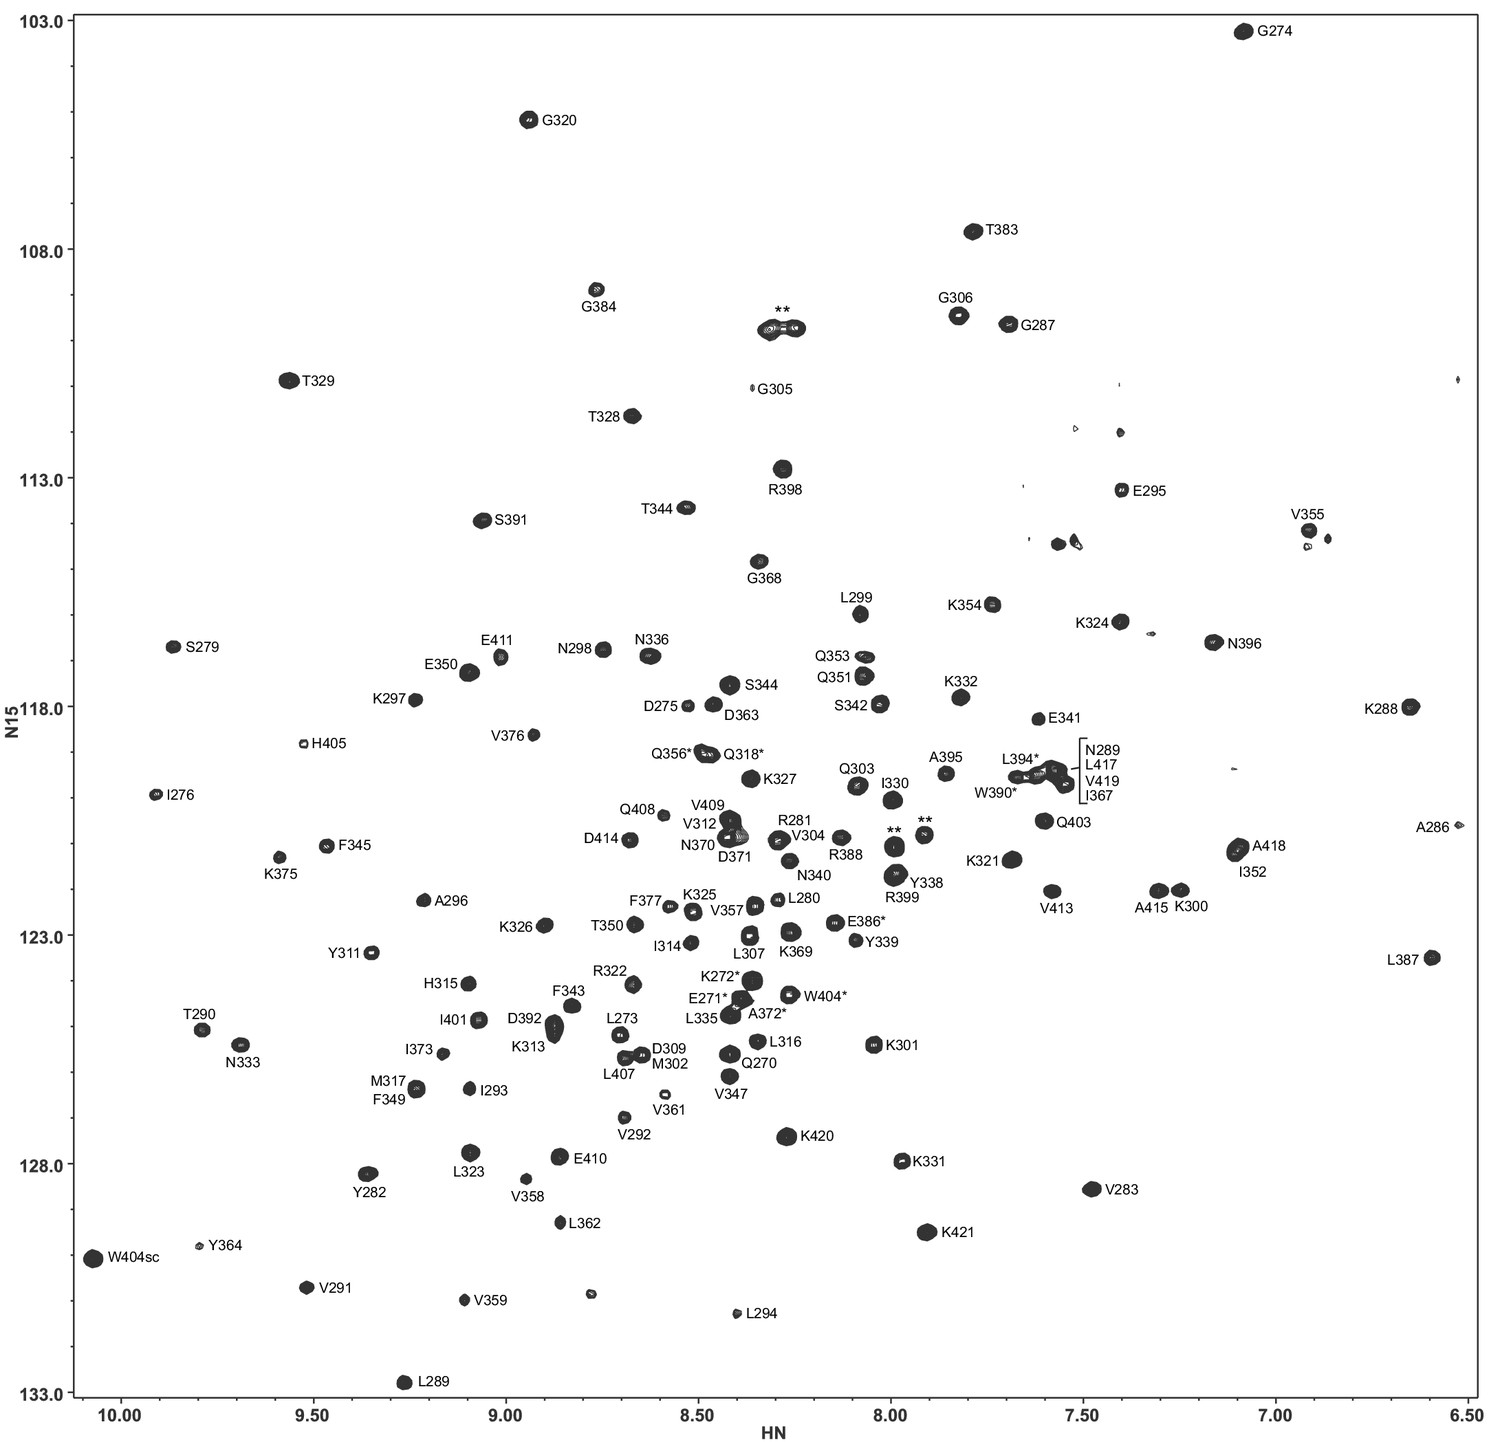
Assignments of the 1H-15N TROSY-HSQC cross-peaks of the Syt1 C2B domain in 20 mM HEPES (pH 7.4), 100 mM KCl, 1 mM EDTA, 1 mM TCEP.
Tentative assignments are indicated with a *. Cross-peaks from two isoleucines and a polyglycine tail arising from the expression vector are indicated by **.
Figure 2 with 2 supplements
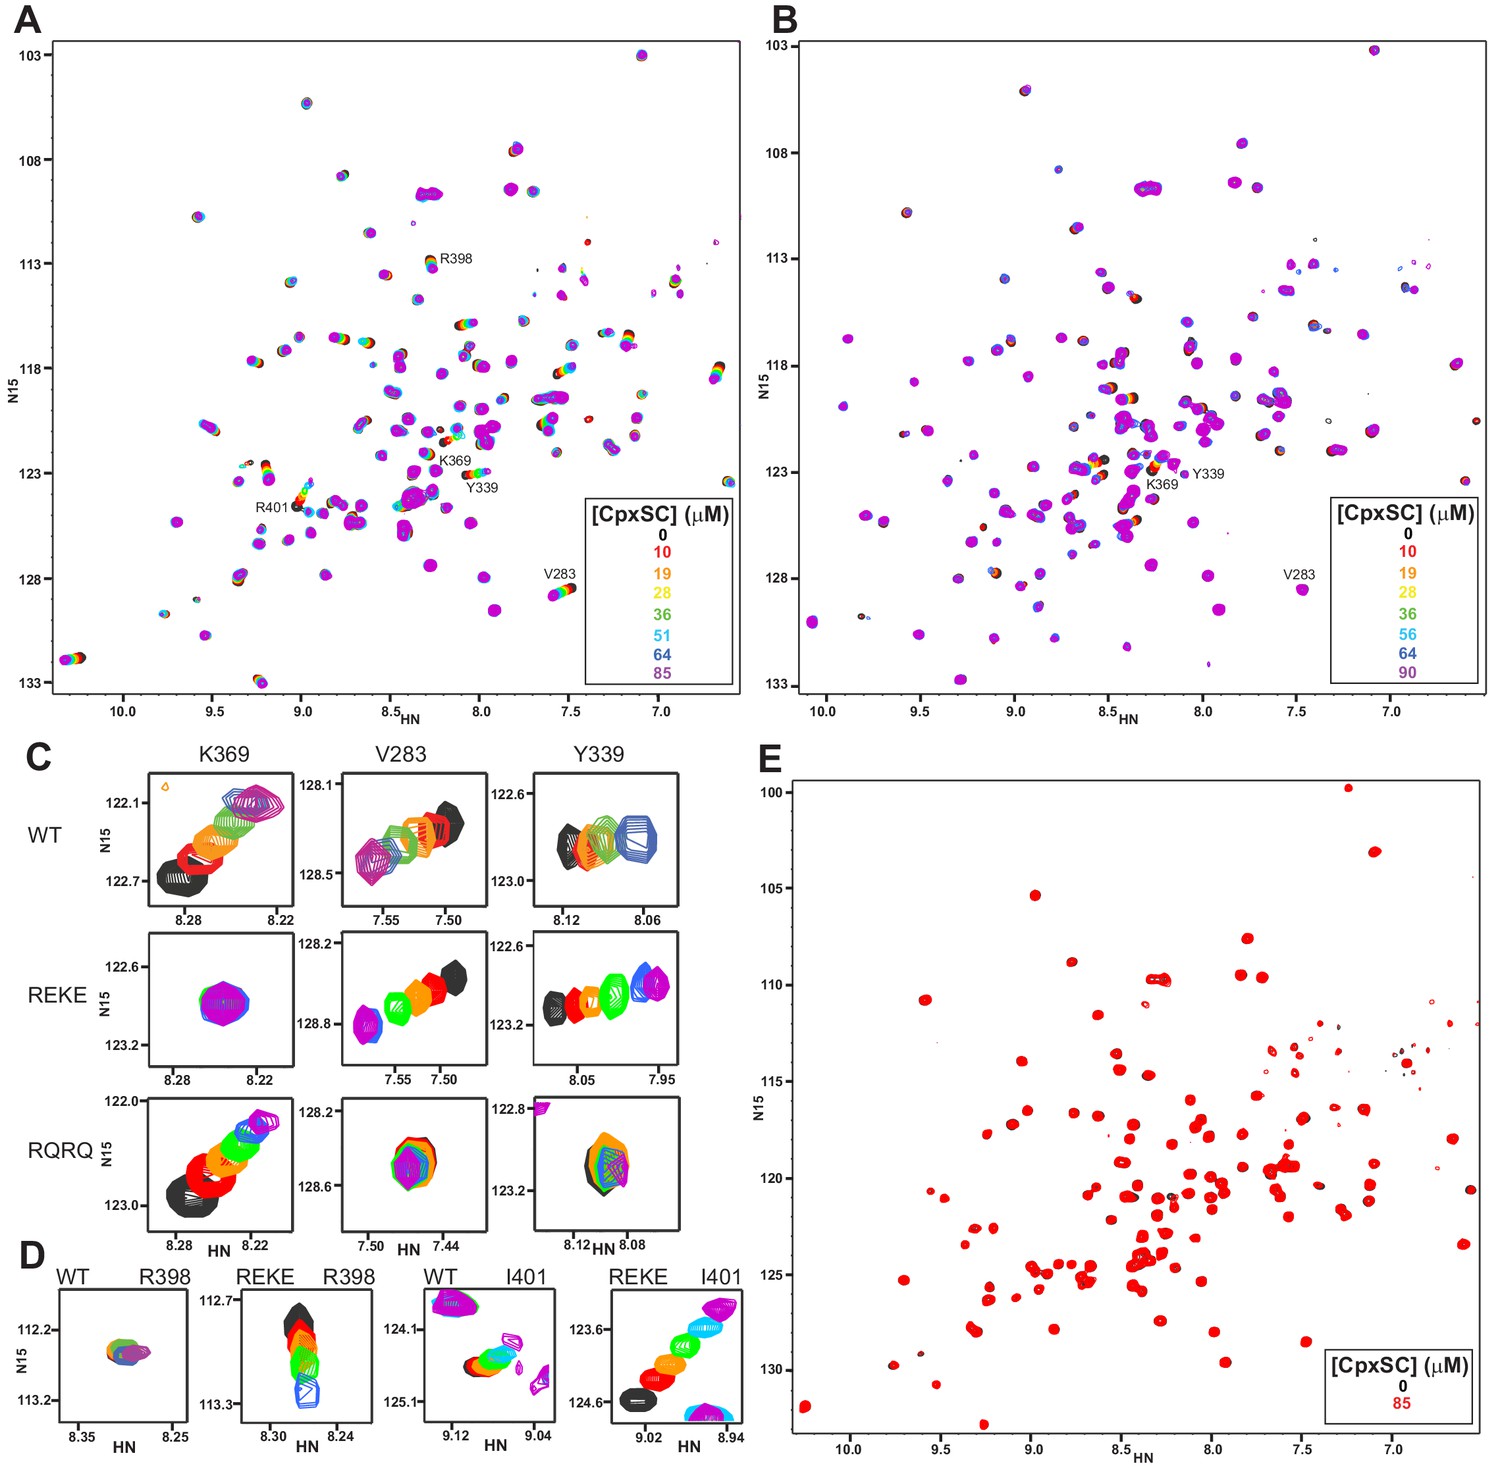
Mutations in the polybasic region and the primary interface of the C2B domain abrogate binding to CpxSC.
(A–B) Superposition of 1H-15N TROSY-HSQC spectra of R322E/K325E (A) or R398Q/R399Q (B) 2H,15N-IM-13CH3-C2B domain in the absence of Ca2+ and the presence of different concentrations of CpxSC as indicated by the color code (C2B concentrations gradually decreased from 32 to 12 μM). Cross-peaks broadened gradually with increasing CpxSC concentrations and contour levels were adjusted to allow observation of most cross-peaks in each spectrum. Some cross-peaks broadened beyond detection at high CpxSC concentrations. (C–D) Expansions showing the changes observed at increasing CpxSC concentrations in selected cross-peaks from WT, R322E/K325E (REKE) or R398Q/R399Q (RQRQ) C2B domain as indicated by the labels. Only spectra at selected concentrations of CpxSC are shown. The color code is the same as in panels A,B. (E) Superposition of 1H-15N TROSY-HSQC spectra of R322E/K325E/R398Q/R399Q 2H,15N-IM-13CH3-C2B domain in the absence of Ca2+, without (black contours) or with (red contours) 85 μM CpxSC (C2B concentrations 32 to 12 μM, respectively). Note that a few cross-peaks are missing in the 1H-15N TROSY-HSQC spectra of panels A,E (e.g. those of I276 and S279 at the left side of the spectrum) because the deuterated amide groups inside the domain did not exchange to hydrogen in aqueous buffer, likely because the mutations increased the stability of this highly basic domain.
Figure 2—figure supplement 1
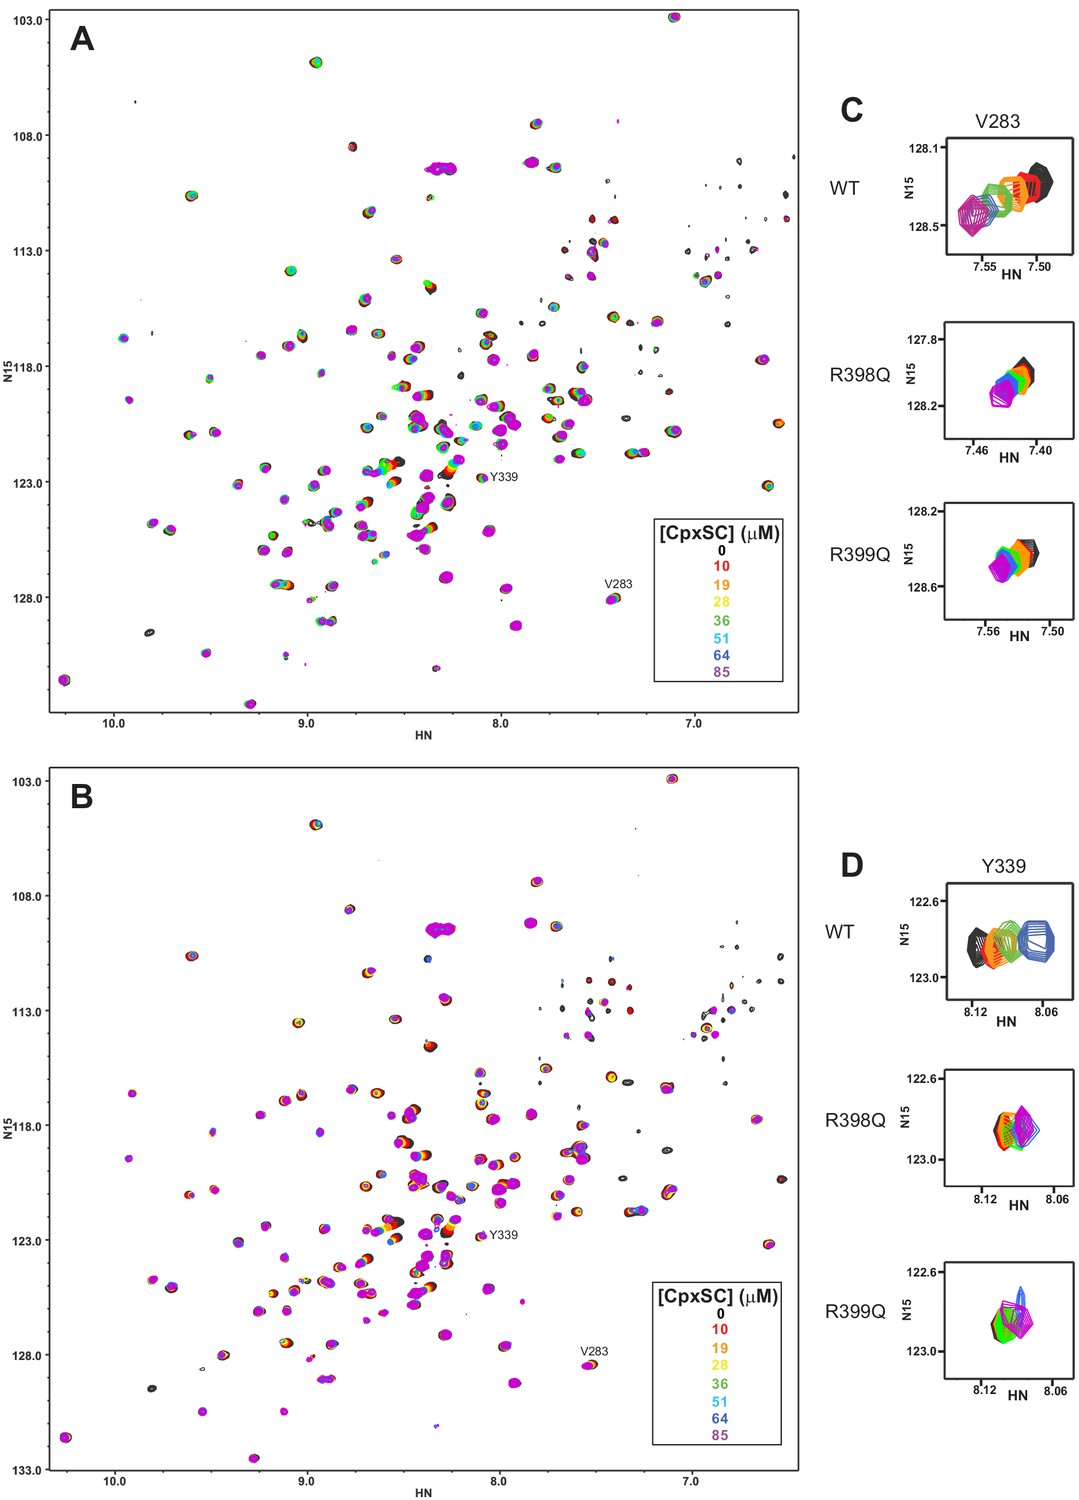
The individual R398Q and R399Q mutations impair binding of the Syt1 C2B domain to CpxSC.
(A–B) Superposition of 1H-15N TROSY-HSQC spectra of R398Q (A) or R399Q (B) 2H,15N-IM-13CH3-C2B domain in the absence of Ca2+ and the presence of different concentrations of CpxSC as indicated by the color code (C2B concentrations gradually decreased from 32 to 12 μM). Cross-peaks broadened gradually with increasing CpxSC concentrations and contour levels were adjusted to allow observation of most cross-peaks in each spectrum. Some cross-peaks broadened beyond detection at high CpxSC concentrations. (C–D) Expansions showing the changes observed at increasing CpxSC concentrations in selected cross-peaks from R398Q (C) or R399Q (D) C2B domain. Only spectra at selected concentrations of CpxSC are shown. The color code is the same as in panels A,B.
Figure 2—figure supplement 2

The R322E/K325E/R398Q/R399Q mutation abrogates binding of the Syt1 C2B domain to CpxSC.
(A–C) Plots of normalized 1H-15N TROSY-HSQC intensities of WT (solid circles) or R322E/K325E/R398Q/R399Q mutant (solid squares) 2H,15N-IM-13CH3-C2B domain as a function of CpxSC concentration for selected cross-peaks that correspond to distinct regions of the C2B domain and could be assigned in the spectrum of the R322E/K325E/R398Q/R399Q mutant: T329 and K375 (polybasic region), E410 (C-terminal α-helix), V283 and Y339 (primary interface), K332 (Ca2+-binding loop), T383, L387 and R388 (α-helix at the tripartite interface). The cross-peak intensities observed at each CpxSC concentration were first normalized by the number of scans and the C2B domain concentration, and then divided by the intensity observed in the absence of CpxSC. (D) Ratios of the intensities of the cross-peaks from the 1H-15N TROSY-HSQC spectrum of R322E/K325E/R398Q/R399Q 2H,15N-IM-13CH3-C2B in the presence of 85 μM CpxSC divided by the intensities observed in the absence of CpxSC. Because we do not have assignments of multiple cross-peaks of this quadruple mutant, the intensity ratios are plotted as a function of cross-peak number rather than residue number.
Figure 3 with 1 supplement
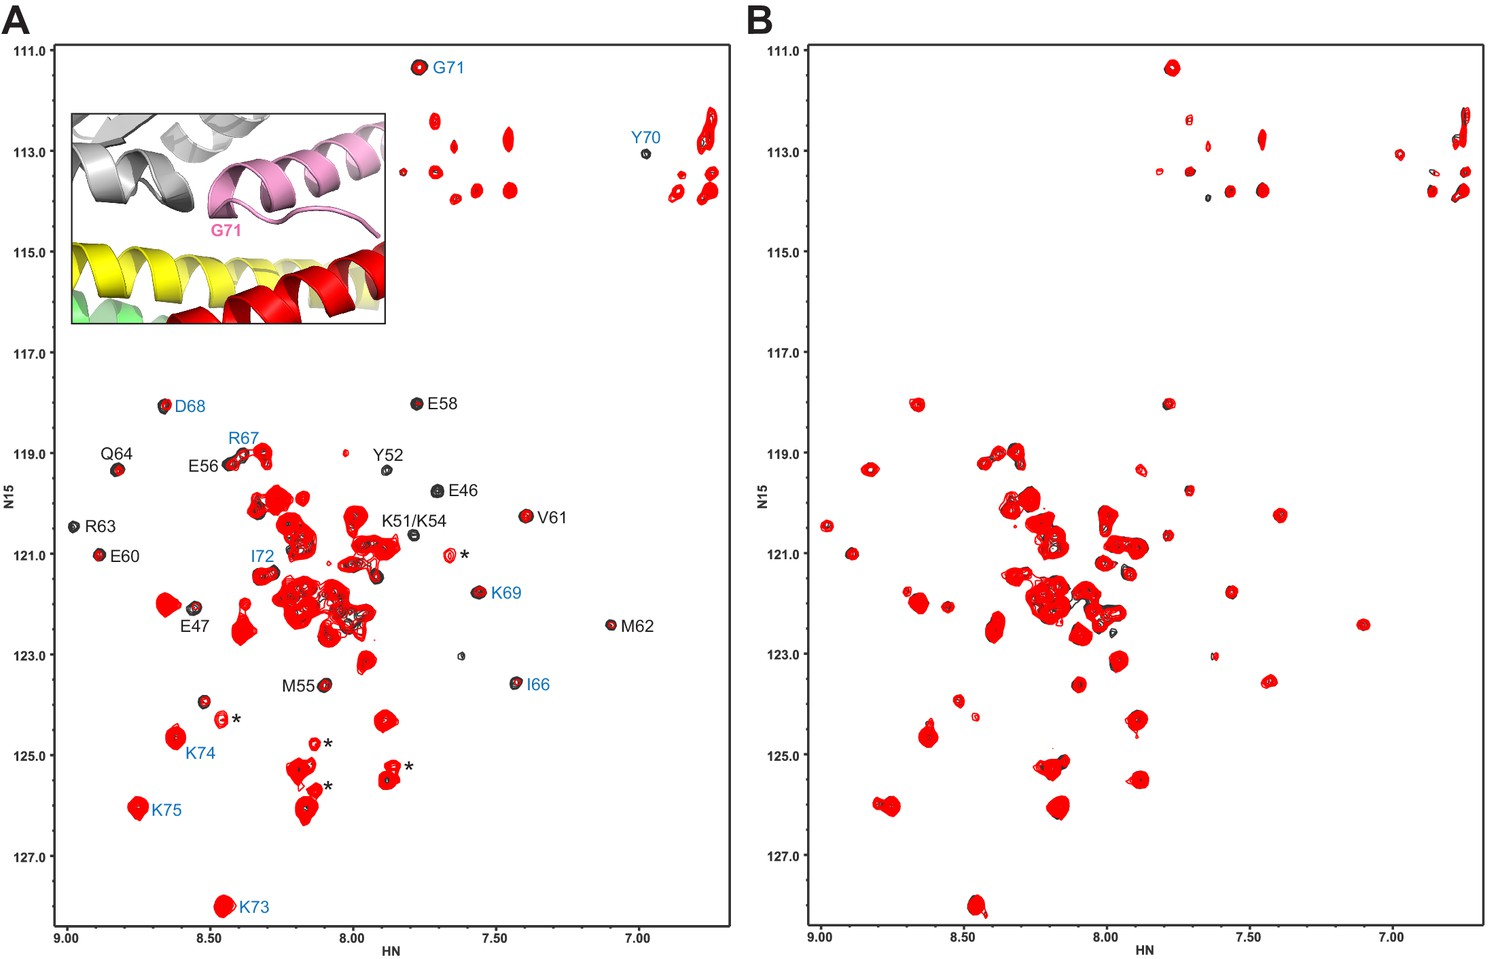
The Syt1 C2B domain does not bind at the tripartite interface of CpxSC at concentrations of tens of micromolar.
(A,B) 1H-15N TROSY HSQC spectra of 40 μM 2H,15N-Cpx1(26-83) in the absence (black contours) and presence (red contours) of 40 μM WT (A) or R322E/K325E/R398Q/R399Q mutant (B) C2B domain. In panel A, Assignments of the cross-peaks that are most broadened upon binding to WT C2B domain are labeled. They correspond to the central α-helix that binds to the SNARE complex and nearby residues. Cross-peaks from other residues do not exhibit as much broadening because they remain flexible. The assignments of residues of Cpx1(26-83) around the corner that contacts the Syt1 C2B domain in the structure of the tripartite complex are colored in blue. The inset shows a close up of the region where complexin-1 (pink), the C2B domain (gray) and the SNARE complex (syntaxin-1 yellow, SNAP-25 green, synaptobrevin red) form the tripartite interface. The location of Gly71 is labeled.
Figure 3—figure supplement 1
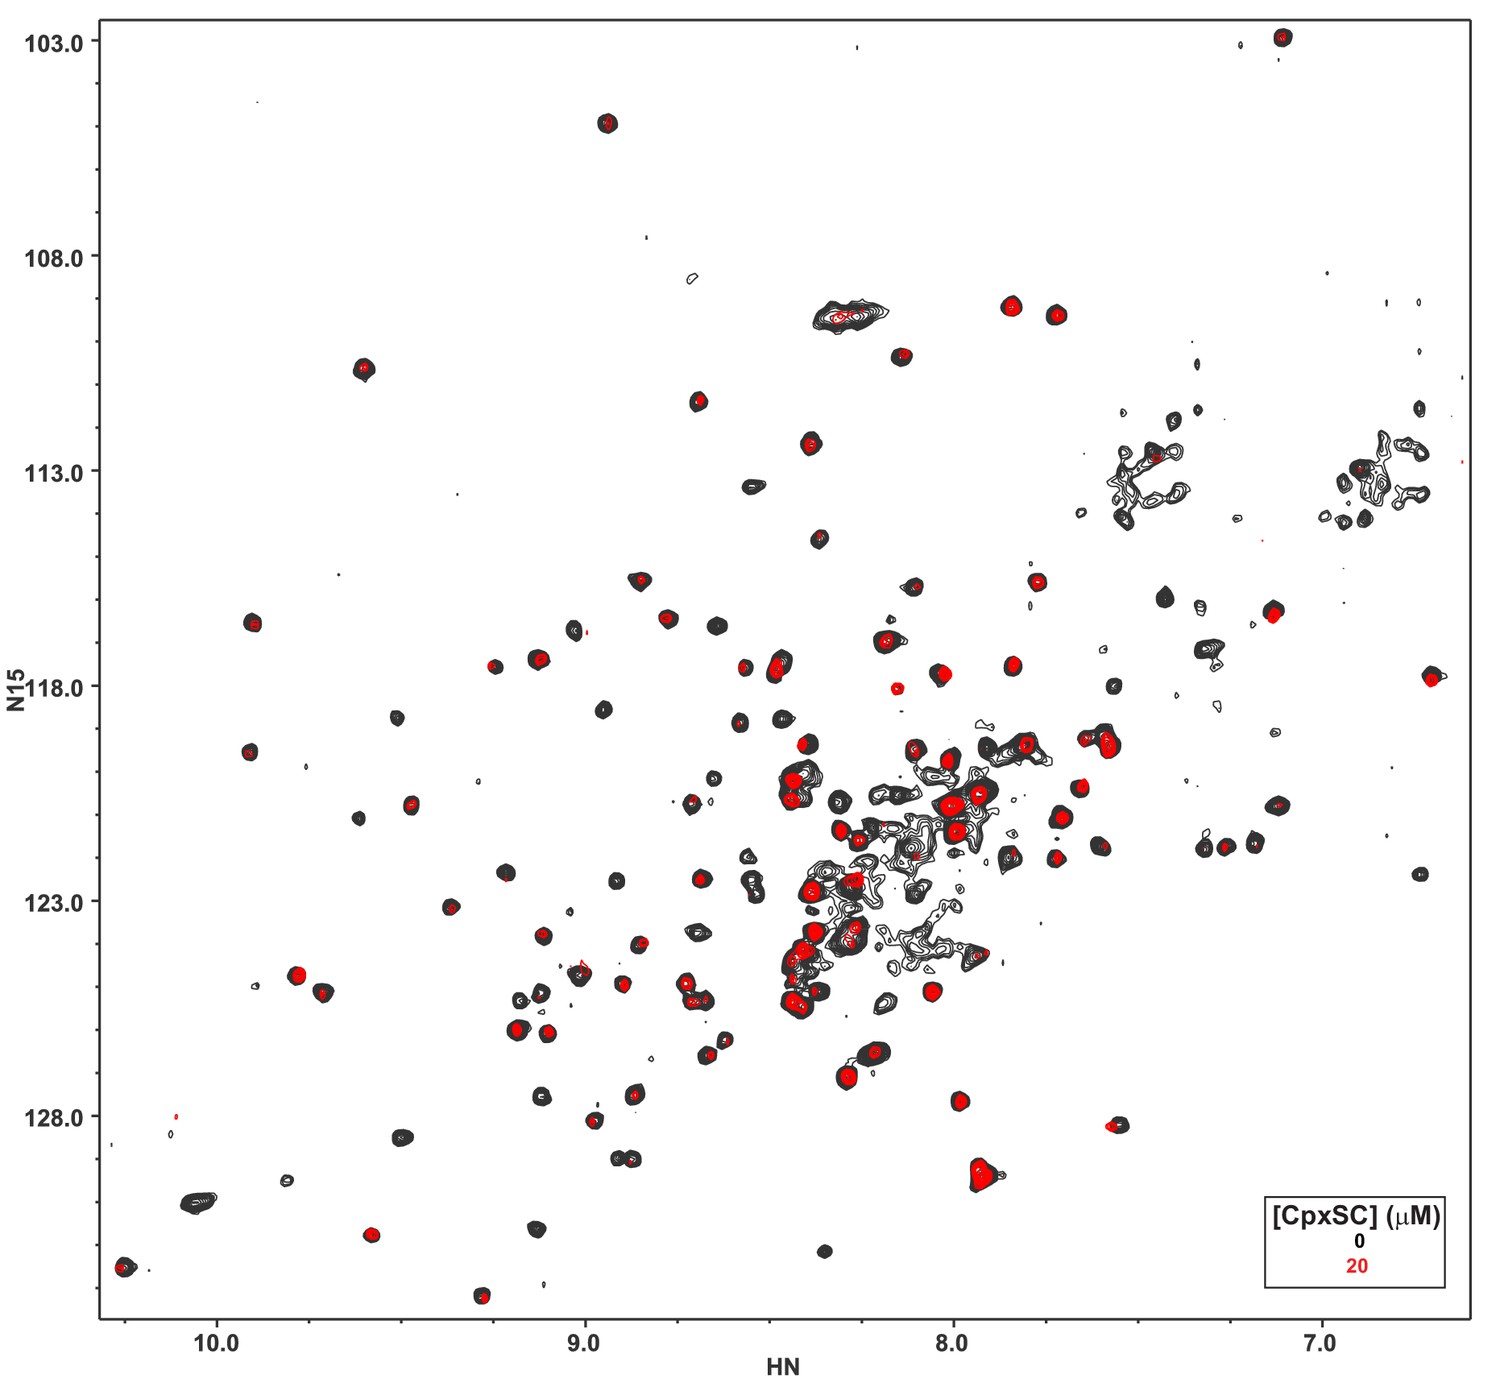
The L387Q/L394Q Syt1 C2B domain mutant is unstable.
The diagram shows a superposition of 1H-15N TROSY-HSQC spectra of 32 μM L387Q/L394Q 2H,15N-IM-13CH3-C2B domain in the absence of Ca2+, without (black contours) or with (red contours) 20 μM CpxSC.
Figure 4 with 1 supplement

The E295A/Y338W mutation enhances the affinity of the Syt1 C2B domain primary interface for CpxSC.
(A) Superposition of 1H-15N TROSY-HSQC spectra of E295A/Y338W 2H,15N-IM-13CH3-C2B domain in the absence of Ca2+ and the presence of different concentrations of CpxSC as indicated by the color code (C2B concentrations gradually decreased from 32 to 12 μM). Cross-peaks broadened gradually with increasing CpxSC concentrations and contour levels were adjusted to allow observation of most cross-peaks in each spectrum. Some cross-peaks broadened beyond detection at high CpxSC concentrations. (B) Ribbon diagram of the Syt1 C2B domain (PDB accession code 1UOV) showing the location of the residues corresponding to the cross-peaks highlighted in the other panels to illustrate that the enhanced binding caused by the E295A/Y338W mutations occurs at the primary interface. (C–D) Expansions showing the changes observed at increasing CpxSC concentrations in selected cross-peaks from WT and E295A/Y338W mutant C2B domain as indicated by the labels. Only spectra at selected concentrations of CpxSC are shown. The color code is the same as in panel A.
Figure 4—figure supplement 1
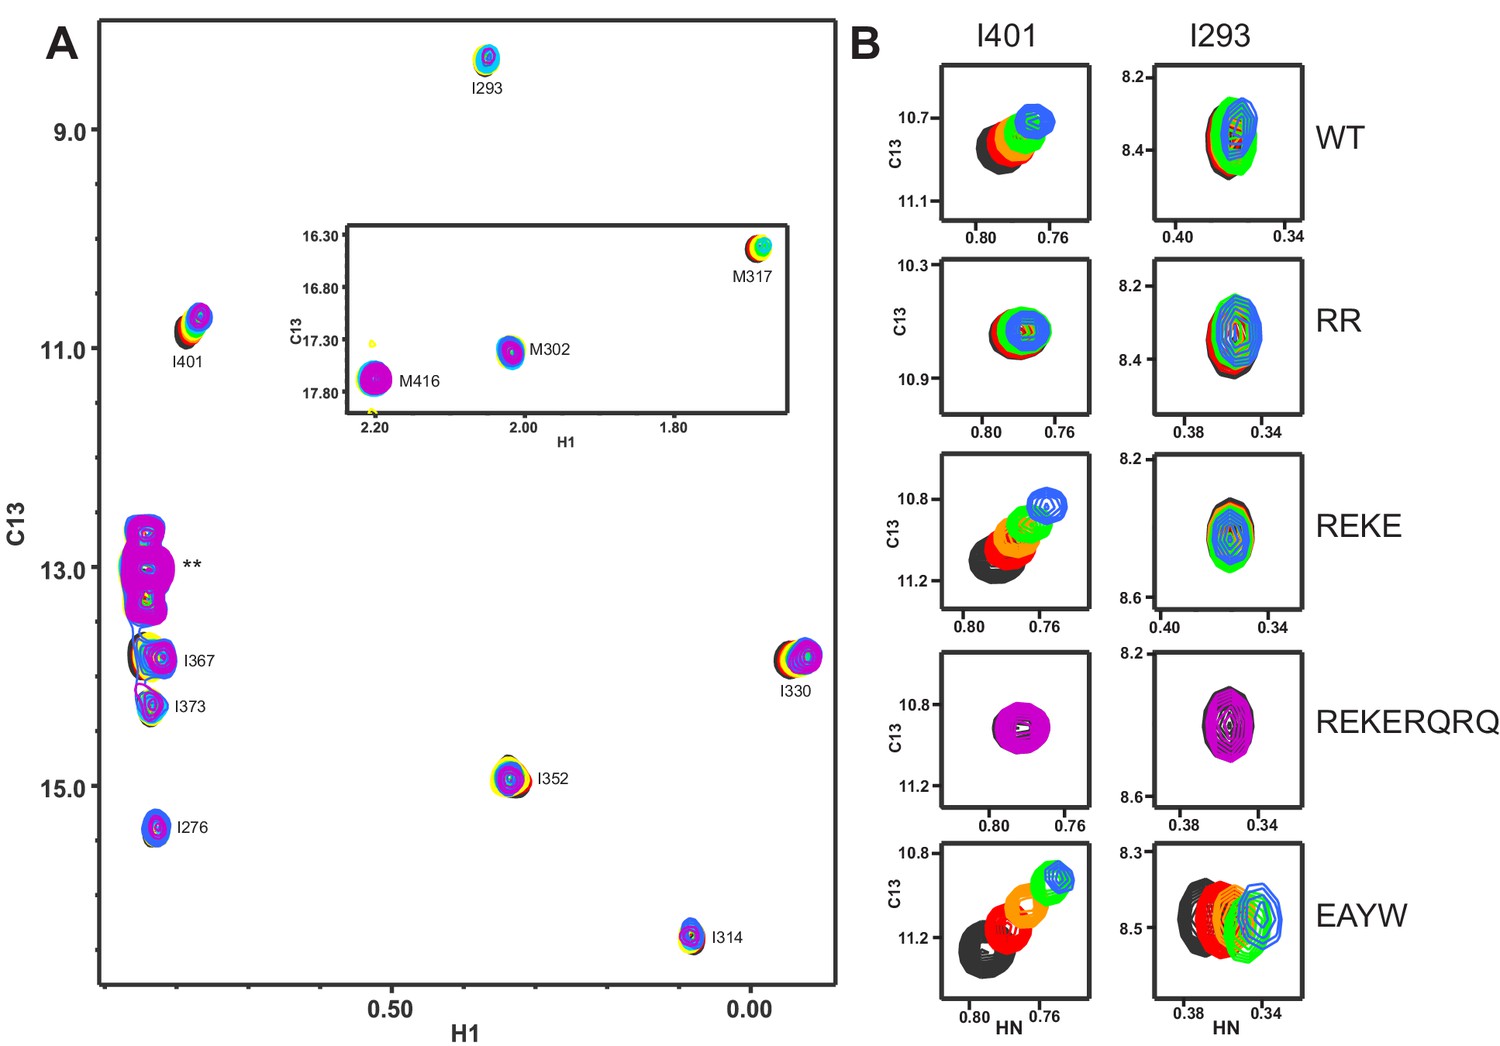
Titrations of WT and mutant Syt1 C2B domains with CpxSC monitored by 1H-13C HMQC spectra.
(A) Superposition of 1H-13C HMQC spectra of WT 2H,15N-IM-13CH3-C2B domain in the absence of Ca2+ and the presence of different concentrations of CpxSC (C2B concentrations gradually decreased from 32 to 12 μM). The color code is the same as in the corresponding 1H-15N TROSY-HSQC spectra (Figures 1, 2 and 4). Cross-peaks broadened gradually with increasing CpxSC concentrations and contour levels were adjusted to allow observation of most cross-peaks in each spectrum. Cross-peak assignments are indicated. Cross-peaks from two isoleucines arising from the expression vector are indicated by **. (B) Expansions showing the changes observed at increasing CpxSC concentrations in the cross-peaks corresponding to the I293 and I401 δ1 methyls from WT, R398Q/R399Q (RQRQ), R322E/K325E (REKE), R322E/K325E/R398Q/R399Q (REKERQRQ) or E295A/Y338W (EAYW) C2B domain as indicated by the labels. Only spectra at selected concentrations of CpxSC are shown.
Figure 5 with 2 supplements
Analysis of interactions between Syt1 C2AB* and SNARE complexes anchored on nanodiscs using FRET.
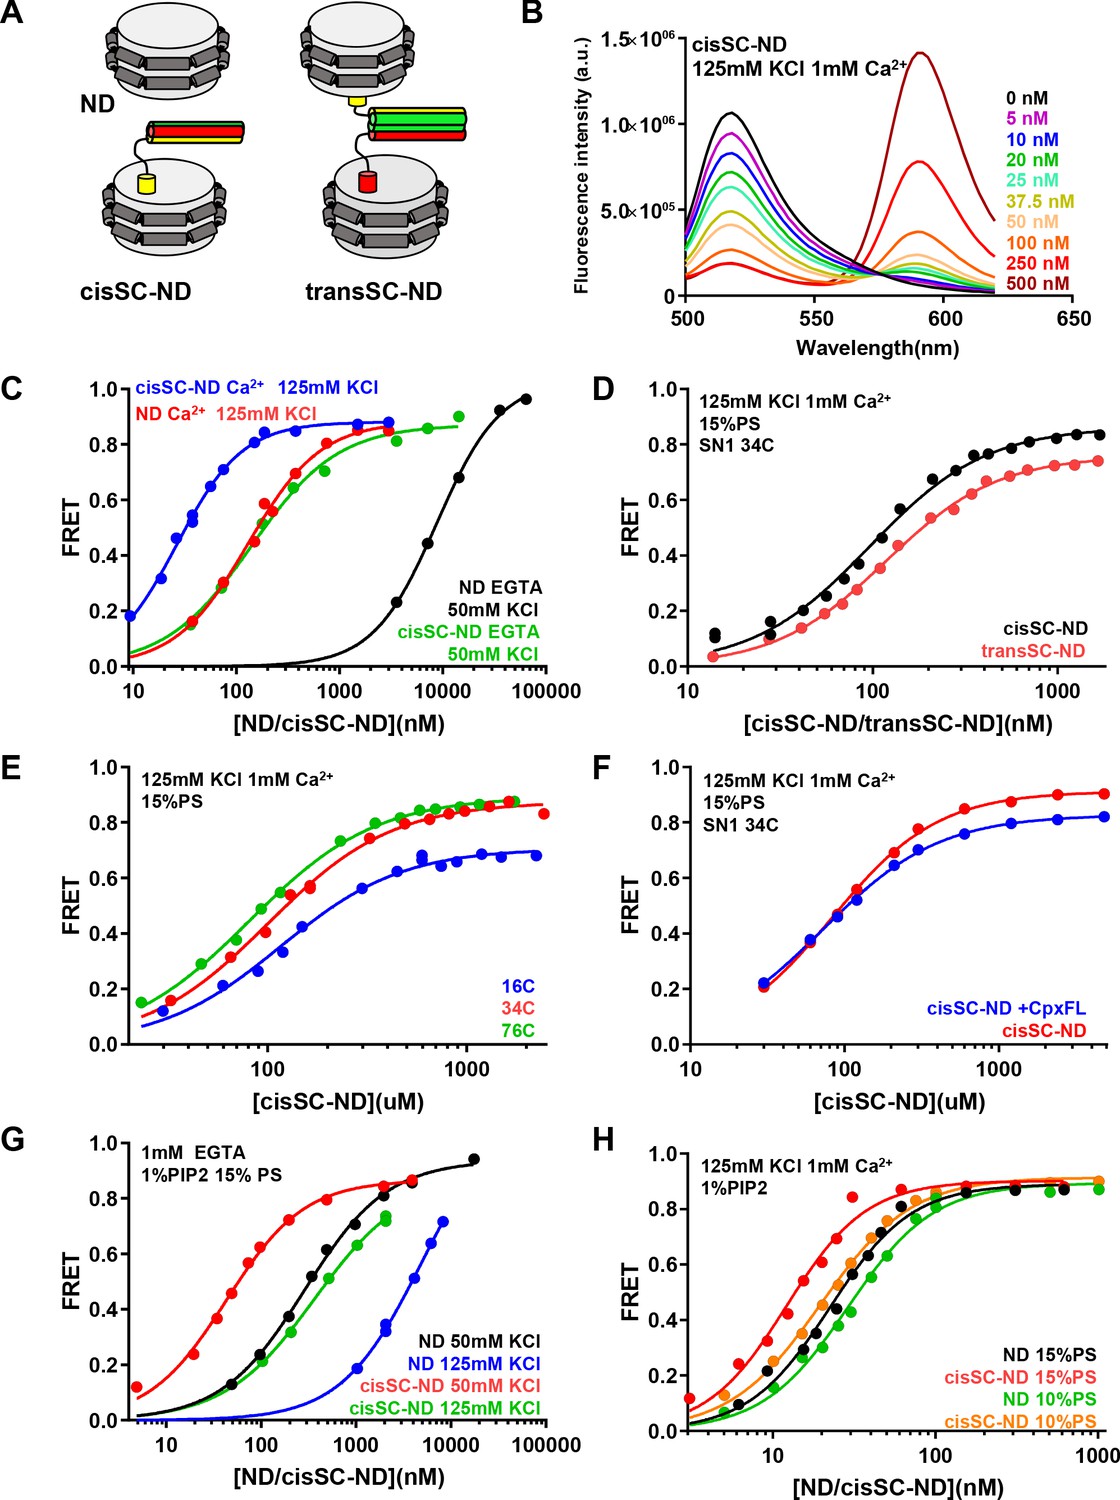
(A) Diagrams illustrating NDs, cisSC-NDs and transSC-NDs. Syntaxin-1 is in yellow, SNAP-25 in green and synaptobrevin in red. Although we used full-length syntaxin-1 to make the nanodisc-anchored SNARE complexes, the N-terminal region preceding the SNARE motif of syntaxin-1 is not shown for simplicity. (B) Fluorescence emission spectra of C2AB* (labeled with Alexa488 at residue 346) in the presence of increasing concentrations of cisSC-NDs (15% PS, 5% Rho-PE), in 125 mM KCl and 1 mM Ca2+. (C) FRET efficiencies observed in titrations of C2AB* with NDs or cisSC-NDs (15% PS, 5% Rho-PE) in the presence of 50 mM KCl and 1 mM EGTA, or 125 mM KCl and 1 mM Ca2+. (D) FRET efficiencies observed in titrations of C2AB* with cisSC-NDs or transSC-NDs (15% PS, 5% Rho-PE) in the presence of 125 mM KCl and 1 mM Ca2+. (E) FRET efficiencies observed in titrations of C2AB* with cisSC-NDs (15% PS) labeled with Rho at position 16, 34 or 76 of SNAP-25 in the presence of 125 mM KCl and 1 mM Ca2+. (F) FRET efficiencies observed in titrations of C2AB* with cisSC-NDs (15% PS) labeled at residue 34 of SNAP-25 in the presence of 125 mM KCl and 1 mM Ca2+, with or without complexin-1. (G) FRET efficiencies observed in titrations of C2AB* with NDs or cisSC-NDs (15% PS, 5% Rho-PE, 1% PIP2) in the presence of 1 mM EGTA and 50 or 125 mM KCl. (H) FRET efficiencies observed in titrations of C2AB* with NDs or cisSC-NDs (15% PS, 5% Rho-PE, 1% PIP2; or 10% PS, 5% Rho-PE, 1% PIP2) in the presence of 125 mM KCl and 1 mM Ca2+. All data were fit with a Hill equation (see Materials and methods).
-
Figure 5—source data 1
Summary of apparent KDs.
- https://cdn.elifesciences.org/articles/57154/elife-57154-fig5-data1-v3.xlsx
Figure 5—figure supplement 1
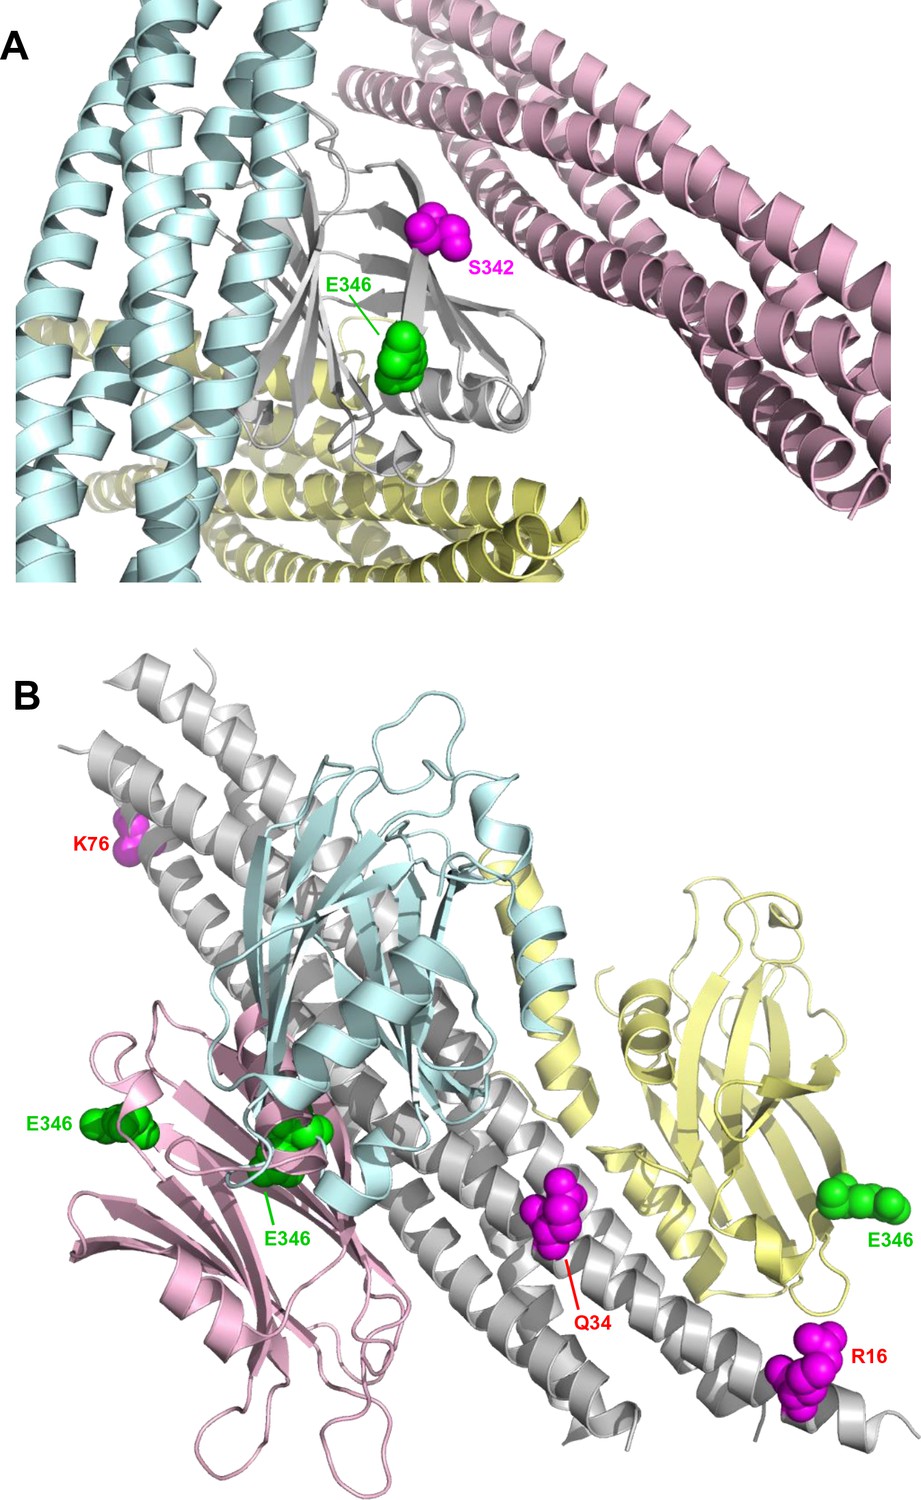
Locations of the fluorescent probes used for the titrations of C2AB* with NDs, cisSC-NDs and transSC-NDs.
(A) Ribbon diagram of the Syt1 C2B domain (gray) with three SNARE complexes bound, one to the polybasic region (light blue), another to the primary interface (light pink) and another to the tripartite interface and a complexin-1 fragment (light yellow). The diagram shows that residue 346 (green spheres), where we placed the Alexa488 label, is not in any of the three interfaces. In contrast, residue 342 (magenta spheres), where a fluorescence probe was placed to analyze Syt1-SNARE complex interactions in Park et al., 2015, is very close to the primary interface. Hence, a fluorescence probe in this location might have abolished binding to the primary interface. (B) Ribbon diagram of the SNARE complex (gray) with three Syt1 C2B domains bound, one to the polybasic region (light blue), another to the primary interface (light pink) and another to the tripartite interface (light yellow). Residue 346 of the C2B domains is shown as green spheres. Residues 16, 34 and 76 of SNAP-25, where we placed a TMR acceptor probe, are shown as magenta spheres. The approximate distances from the side chain of residue 346 of the C2B domain to the side chains of residues 16, 34 and 76 of SNAP-25 in the complex formed through the primary interface are 67, 41 and 36 Å, respectively, and in the tripartite complex they are 21, 31 and 82 Å, respectively. The complex formed through the polybasic region includes a large ensemble of orientations of the C2B domain with respect to the SNARE complex; using five poses representative of this ensemble (Brewer et al., 2015), the average distances from the C2B 346 side chain to the side chains of residues 16, 34 and 76 of SNAP-25 are 65, 39 and 35 Å, respectively. The Forster radius for the Alexa488-TMR pair is expected to be very similar to that measured for the fluorescein-TMR pair [54 Å, (Kosk-Kosicka et al., 1989) because the spectral properties of Alexa488 and fluorescein are almost identical (https://www.thermofisher.com/us/en/home/life-science/cell-analysis/labeling-chemistry/fluorescence-spectraviewer.html#!/). Hence, the Syt1-SNARE complexes formed through the primary or polybasic interfaces are consistent with the high FRET efficiencies observed at saturating cisSC-ND concentrations when TMR was placed on residues 34 and 76 of SNAP-25, and the lower FRET efficiencies observed with TMR on residue 16 of SNAP-25 (Figure 5E).
Figure 5—figure supplement 2
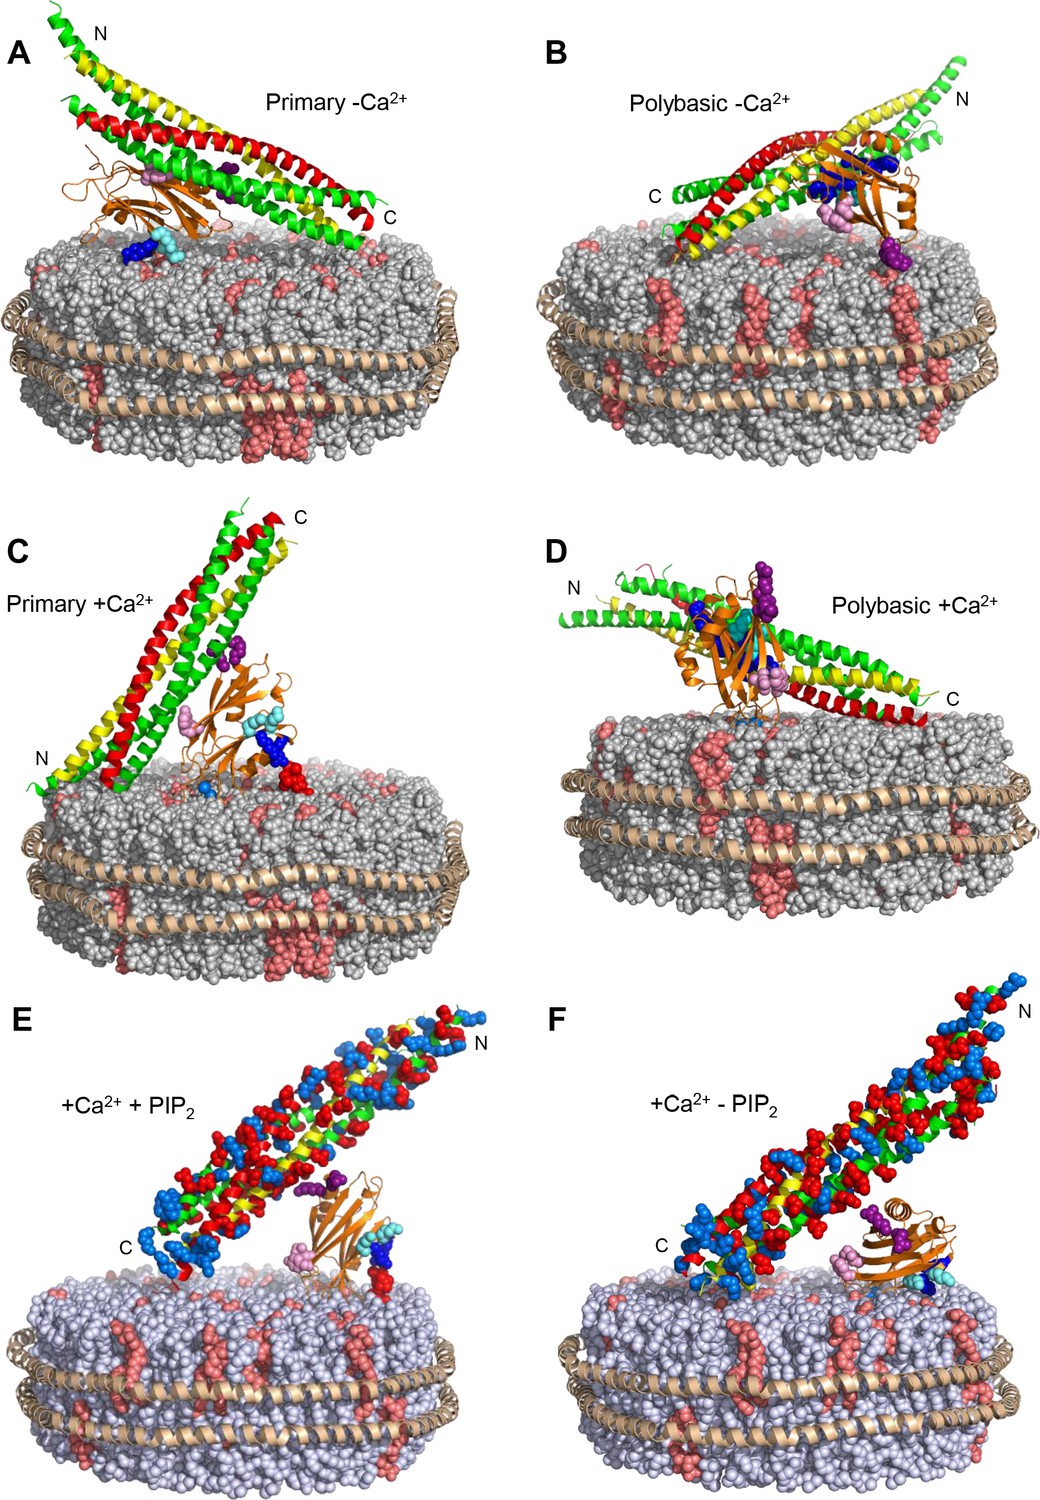
Models illustrating plausible and impossible binding modes of the Syt1 C2B domain to the SNARE complex on nanodiscs.
The lipids of the nanodiscs are shown as spheres, with PC in gray, PS in salmon and PIP2 in red. The proteins are represented by ribbon diagrams, with the scaffold MSP1E3D1 in wheat, the Syt1 C2B domain in orange, syntaxin-1 in yellow, SNAP-25 in green and synaptobrevin in red. K324 and K326 of the C2B domain are shown as cyan spheres, R322 and K325 as dark blue spheres, R398 and R399 as purple spheres, and E295 and Y338 as pink spheres. The N- and C-termini of the syntaxin-1 SNARE motif are indicated. Note that the C-terminus should be close to the membrane, as it is covalently linked to the TM region (not shown) anchored on the nanodisc. In panels E–F, acidic and basic side chains of the SNARE complex are shown as red and blue spheres, respectively. (A) Model of how the C2B domain can bind to the SNARE complex through the primary interface and to the nanodisc membrane through the polybasic region in the absence of Ca2+. (B) Model of how the C2B domain can bind to the SNARE complex through the polybasic interface and to the nanodisc membrane through R398,R399 in the absence of Ca2+. (C) Model showing the C2B domain bound to the nanodisc membrane in an approximate perpendicular orientation induced upon Ca2+ binding (Araç et al., 2006; Rufener et al., 2005) that readily allows interactions of PIP2 with R322 and K325, but not with K324 and K326. The model also shows how it is impossible for the C2B domain to bind at the same time to the SNARE complex through the primary interface because the C-terminus of syntaxin-1 would be placed far away from the membrane where it is anchored. (D) Model showing how Ca2+-depending binding of the C2B domain to the nanodisc membrane may be compatible with simultaneous interactions of the polybasic region with the SNARE complex and with membrane anchoring of syntaxin-1, although this type of binding mode should be disfavored by PIP2 in the membrane because it is expected to compete with the SNARE complex for binding to the C2B polybasic region. (E) Model showing how non-specific interactions of R398,R399 with acidic residues of the SNARE complex can occur upon Ca2+-dependent binding of the C2B domain to the nanodisc membrane in a perpendicular orientation that allows interactions of R322 and K325 with PIP2. (F) Model showing how R398,R399 might also bind to acidic residues of the SNARE complex at the same time that the Ca2+-bound C2B domain binds to the nanodisc membrane in a more slanted orientation that allows interactions of R322, K324, K325 and K326 with PS in the membrane in the absence of PIP2. Such orientation is more favorable in the absence of Ca2+ (e.g. in the model of panel A) because the negatively charged Ca2+-binding region cannot insert into the membrane (Fernandez et al., 2001).
Figure 6 with 6 supplements
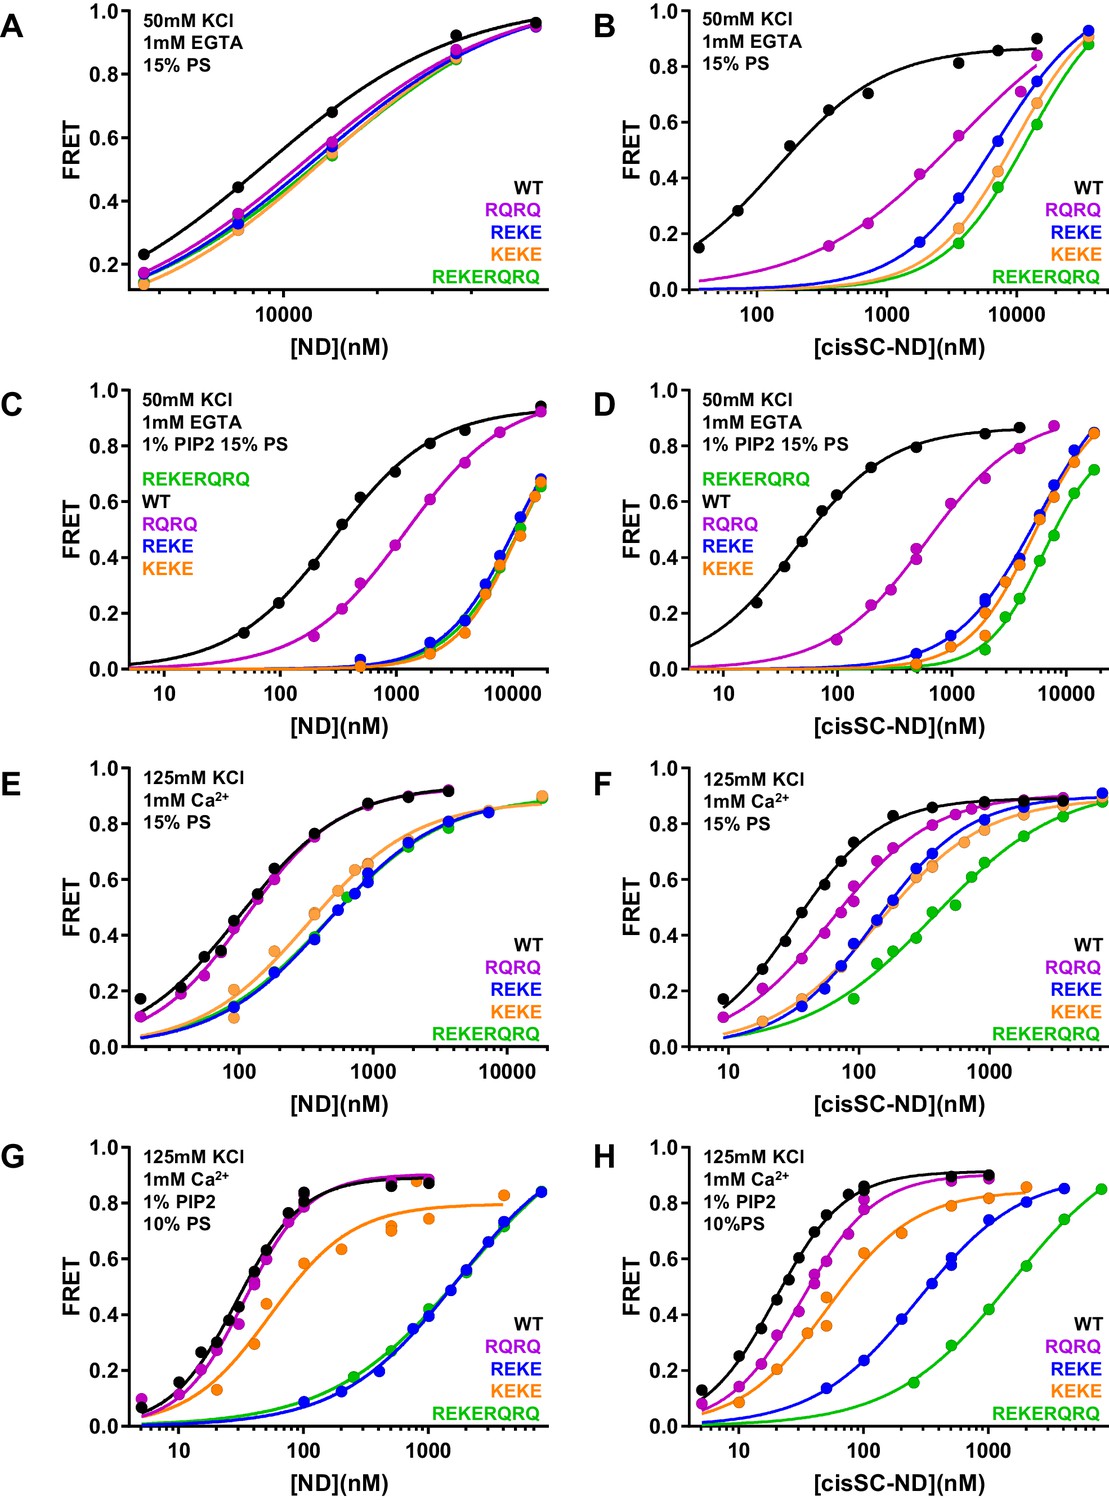
Effects of mutations in the Syt1 C2B domain on Ca2+-independent and Ca2+-dependent binding of C2AB* to NDs and cisSC-NDs.
(A–H) FRET efficiencies observed in titrations of WT, R398Q/R399Q (RQRQ), R322E/K325E (REKE), K324E/K326E (KEKE) or R322E/K325E/R398Q/R399Q (REKERQRQ) C2AB* with NDs (A,C,E,G) or cisSC-NDs (B,D,F,H) containing 15% PS and 5% Rho-PE (A,B,E,F), 15% PS, 5% Rho-PE and 1% PIP2 (C,D), or 10% PS, 5% Rho-PE and 1% PIP2 (G,H) in the presence of 1 mM EGTA and 50 mM KCl (A–D), or 1 mM Ca2+ and 125 mM KCl (E–H). All data were fit with a Hill equation (see Materials and methods).
-
Figure 6—source data 1
Cooperativity factors.
- https://cdn.elifesciences.org/articles/57154/elife-57154-fig6-data1-v3.xlsx
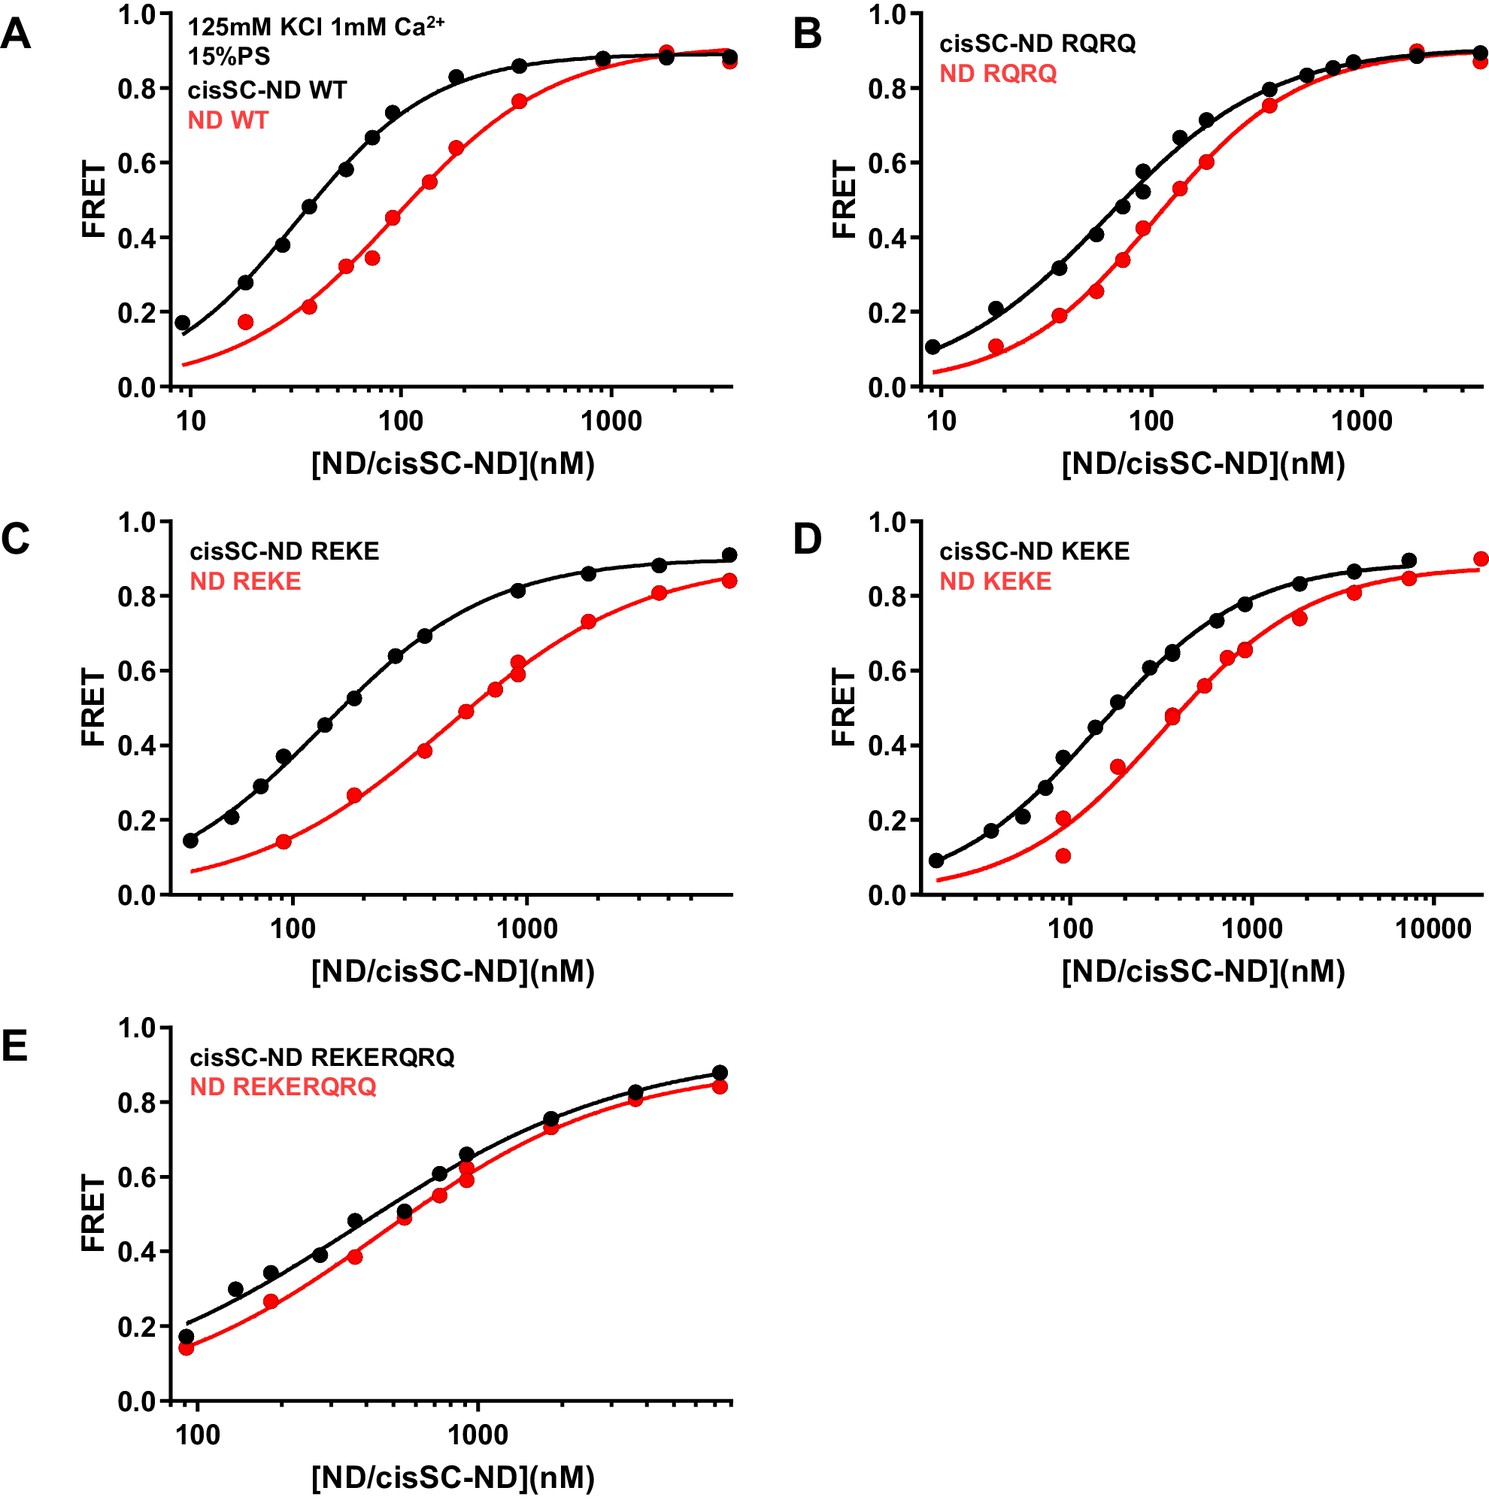
Figure 6—figure supplement 1
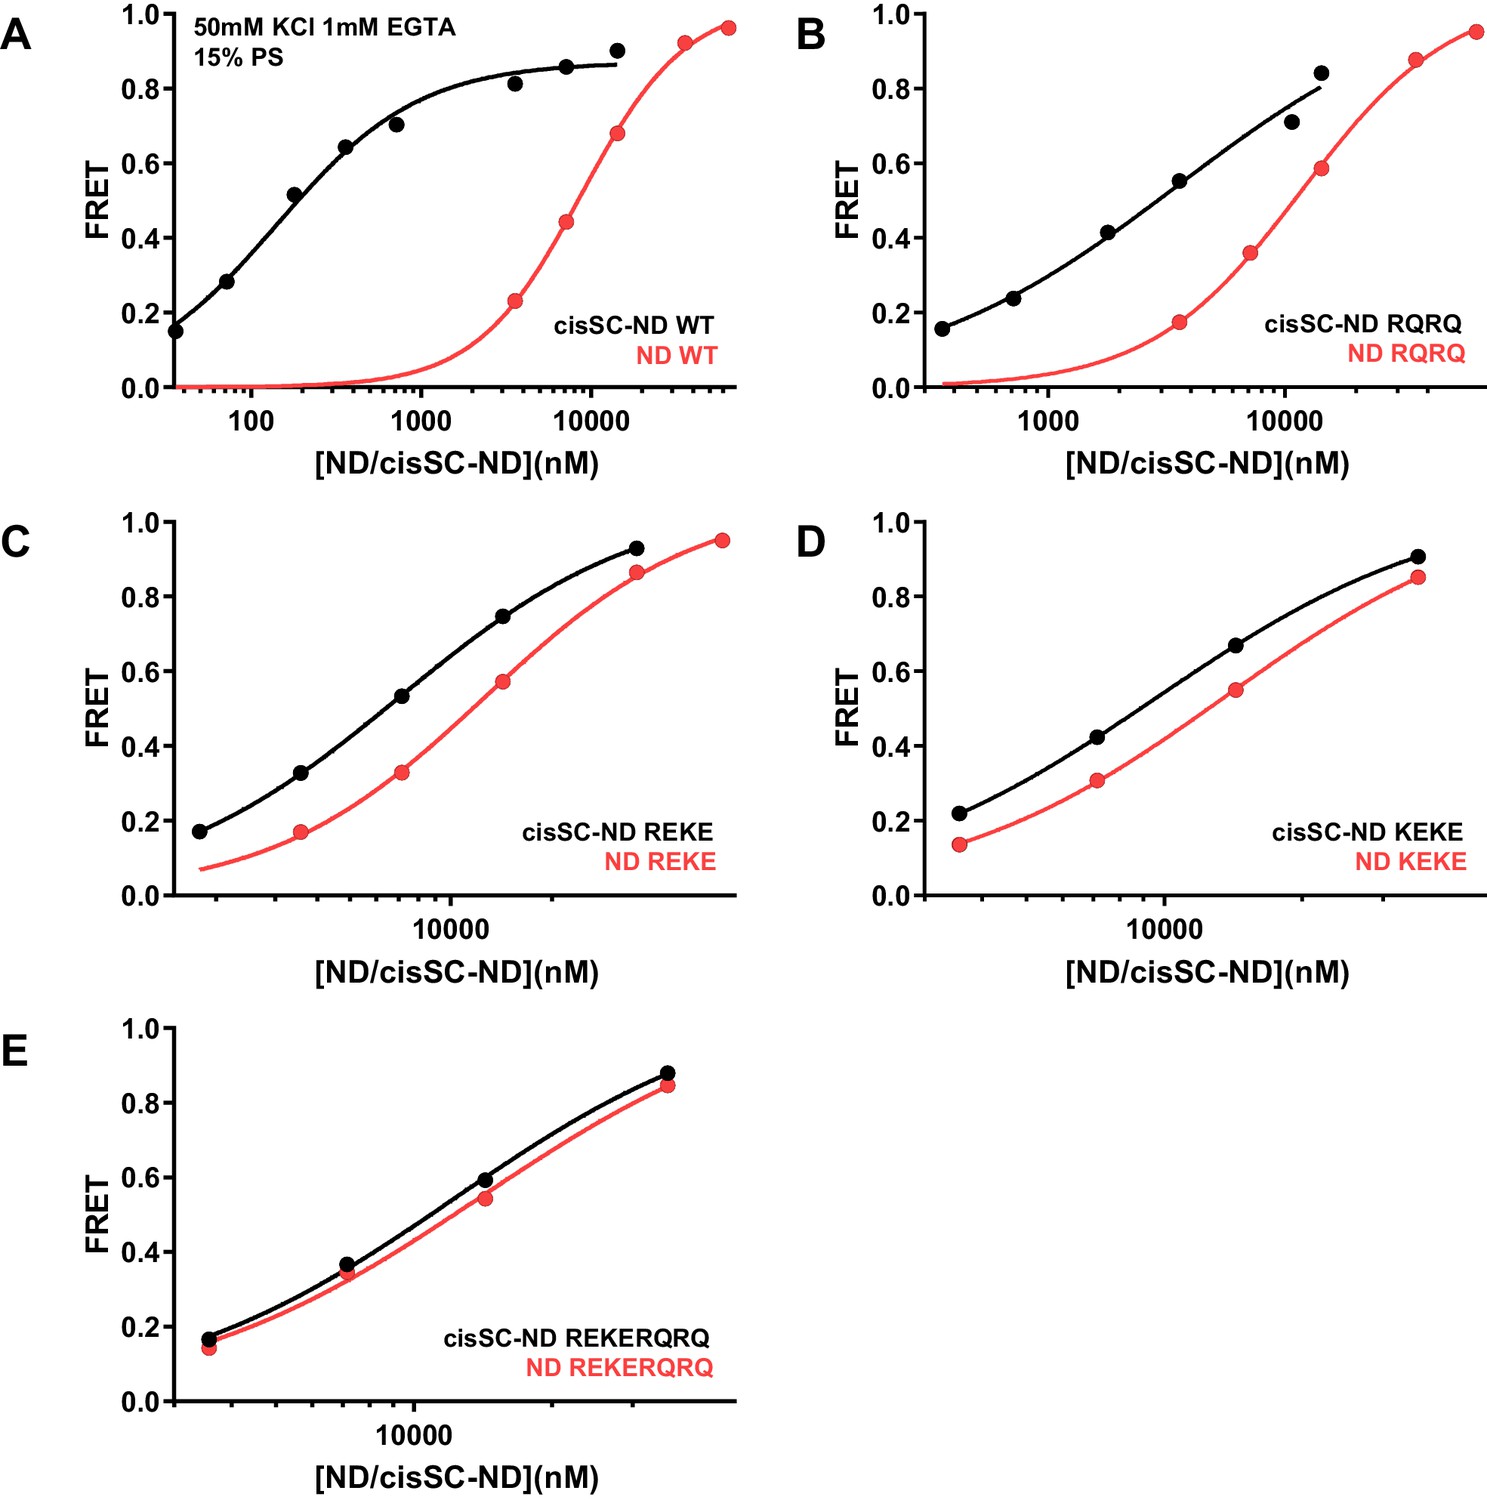
Effects of mutations in the Syt1 C2B domain on Ca2+-independent and Ca2+-dependent binding of C2AB* to NDs and cisSC-NDs.
FRET efficiencies observed in titrations of WT (A), R398Q/R399Q (RQRQ) (B), R322E/K325E (REKE) (C), K324E/K326E (KEKE) (D) or R322E/K325E/R398Q/R399Q (REKERQRQ) (E) C2AB* with NDs (black traces) or cisSC-NDs (red traces) containing 15% PS and 5% Rho-PE in the presence of 1 mM EGTA and 50 mM KCl. These are the same results shown in Figure 6A,B but presented in a different form to illustrate the differences in binding to NDs and cisSC-NDs for a given C2AB* version. All data were fit with a Hill equation (see Materials and methods).
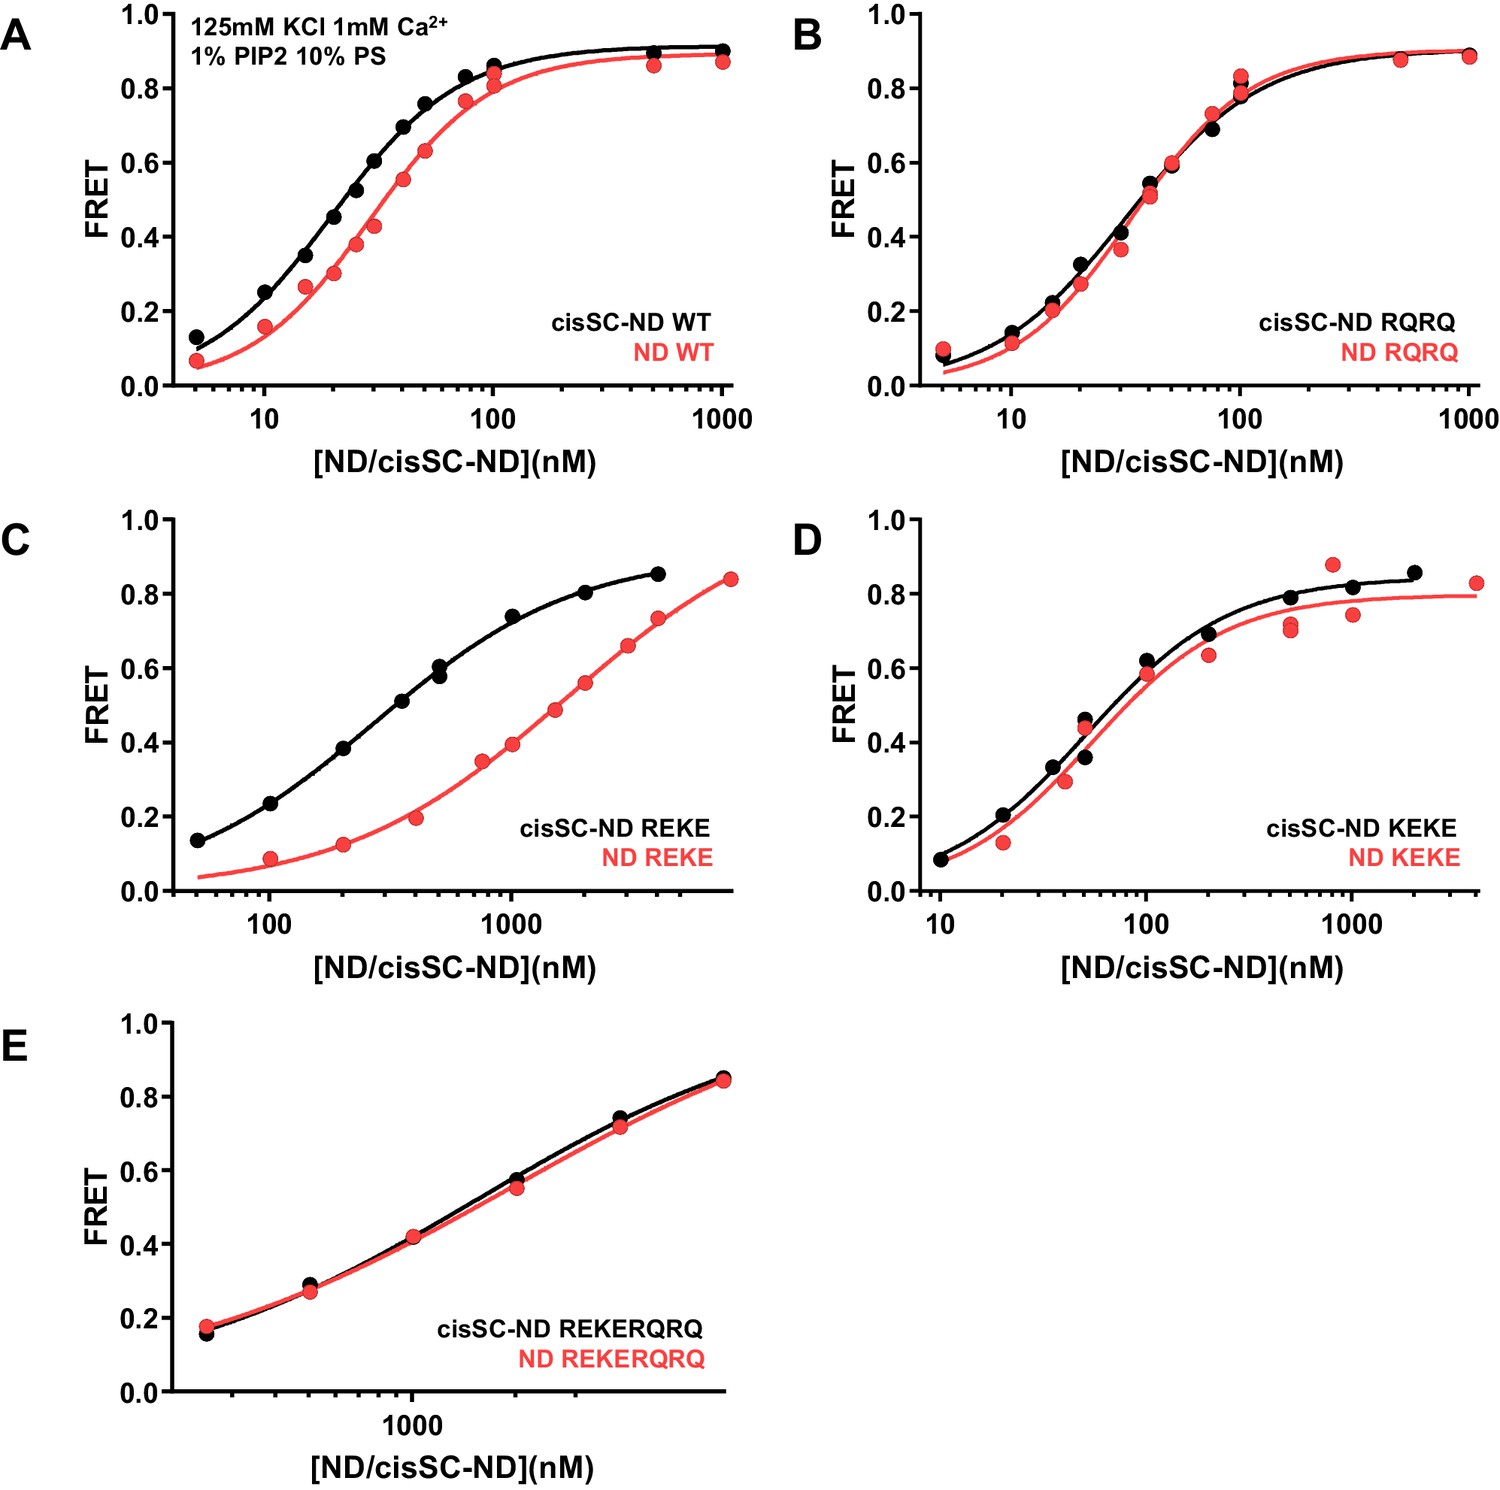
Figure 6—figure supplement 2
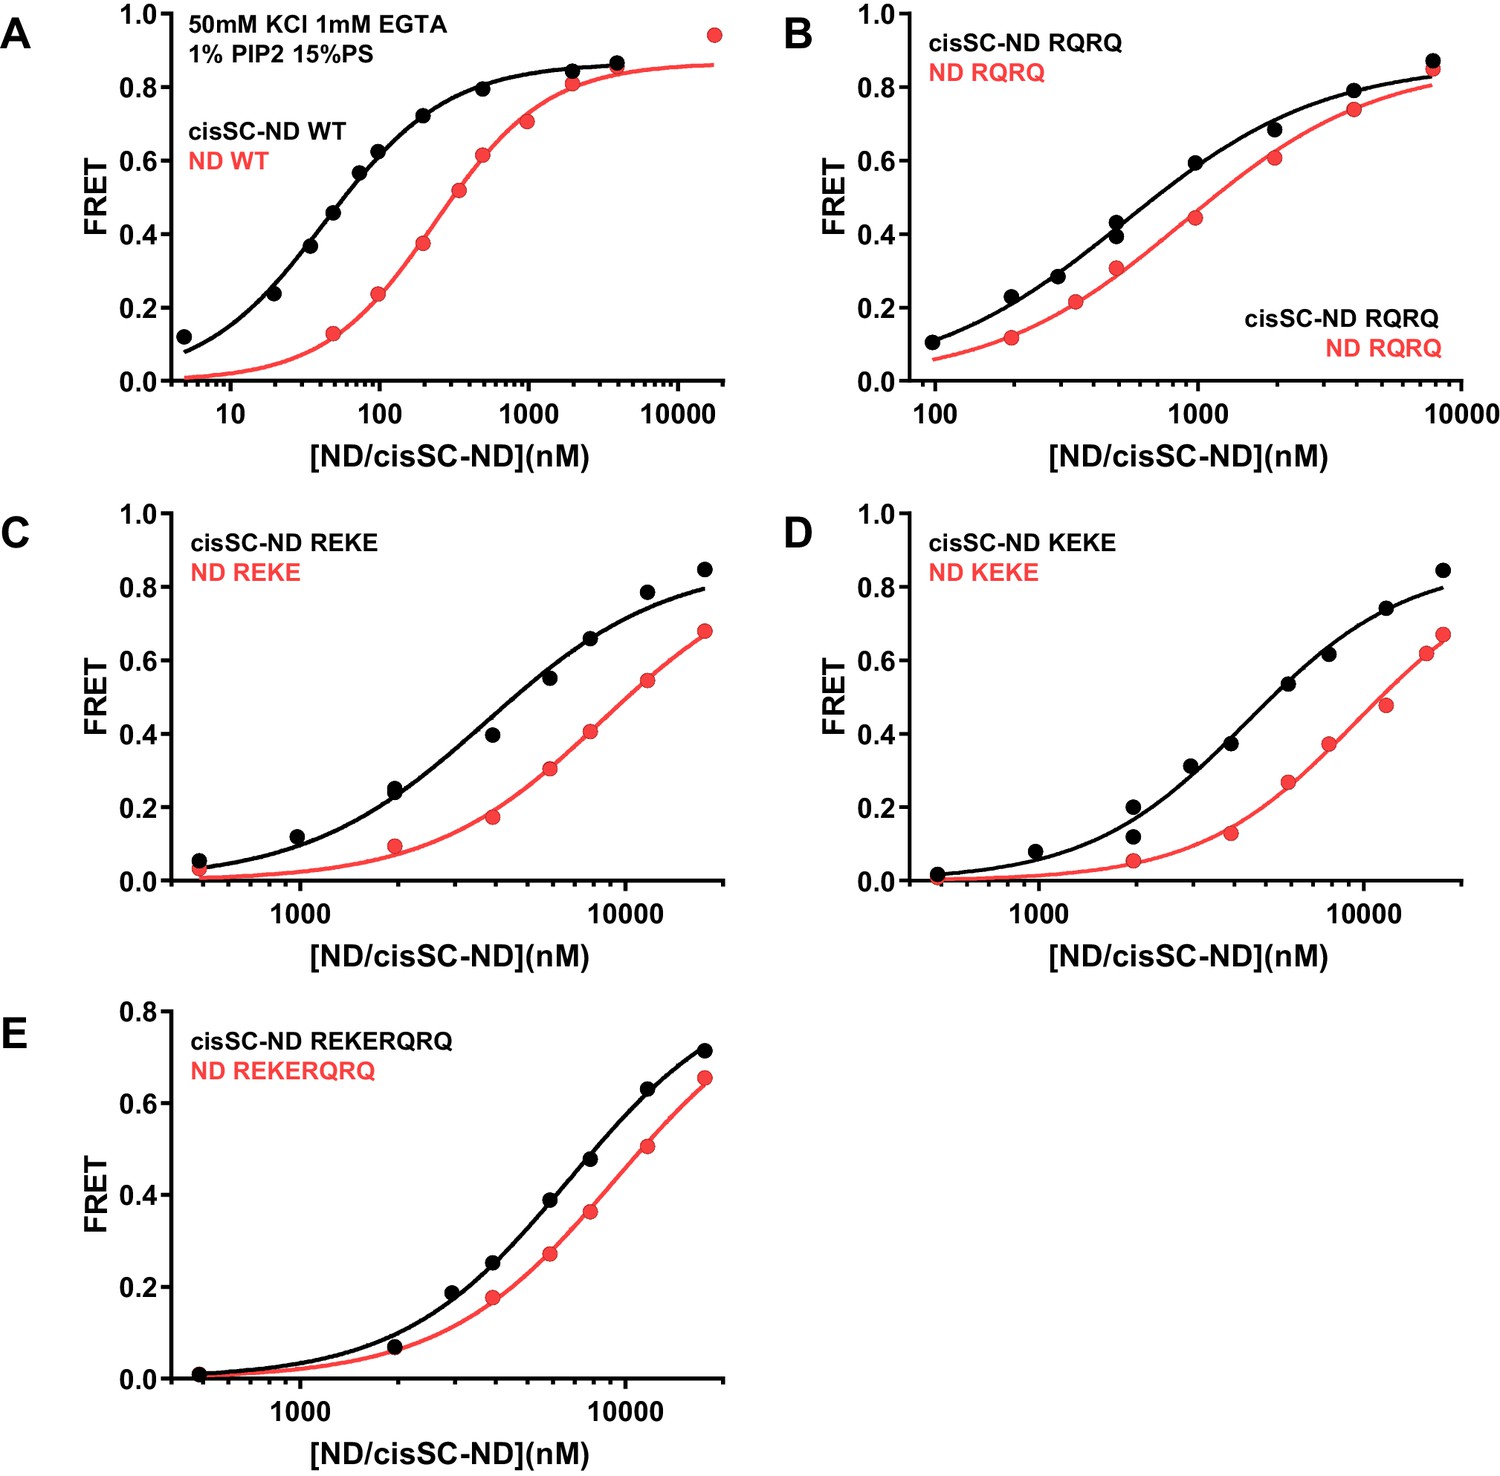
Effects of mutations in the Syt1 C2B domain on Ca2+-independent and Ca2+-dependent binding of C2AB* to NDs and cisSC-NDs.
FRET efficiencies observed in titrations of WT (A), R398Q/R399Q (RQRQ) (B), R322E/K325E (REKE) (C), K324E/K326E (KEKE) (D) or R322E/K325E/R398Q/R399Q (REKERQRQ) (E) C2AB* with NDs (black traces) or cisSC-NDs (red traces) containing 15% PS, 5% Rho-PE and 1% PIP2 in the presence of 1 mM EGTA and 50 mM KCl. These are the same results shown in Figure 6C,D but presented in a different form to illustrate the differences in binding to NDs and cisSC-NDs for a given C2AB* version. All data were fit with a Hill equation (see Materials and methods).
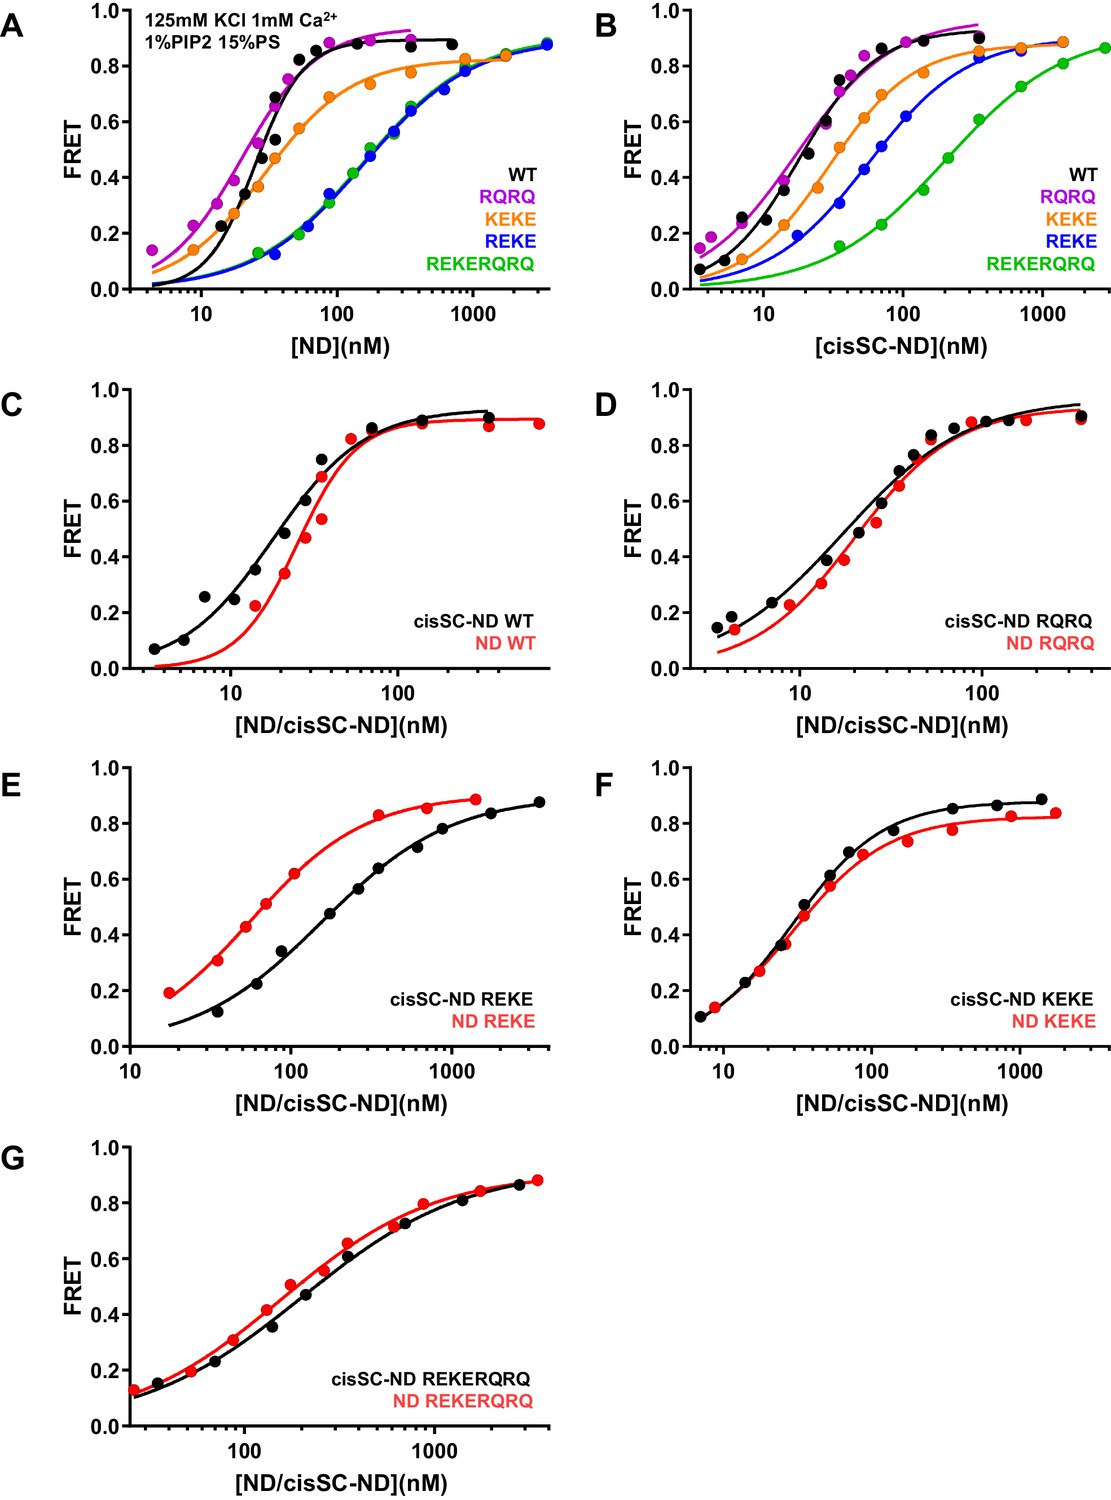
Figure 6—figure supplement 3
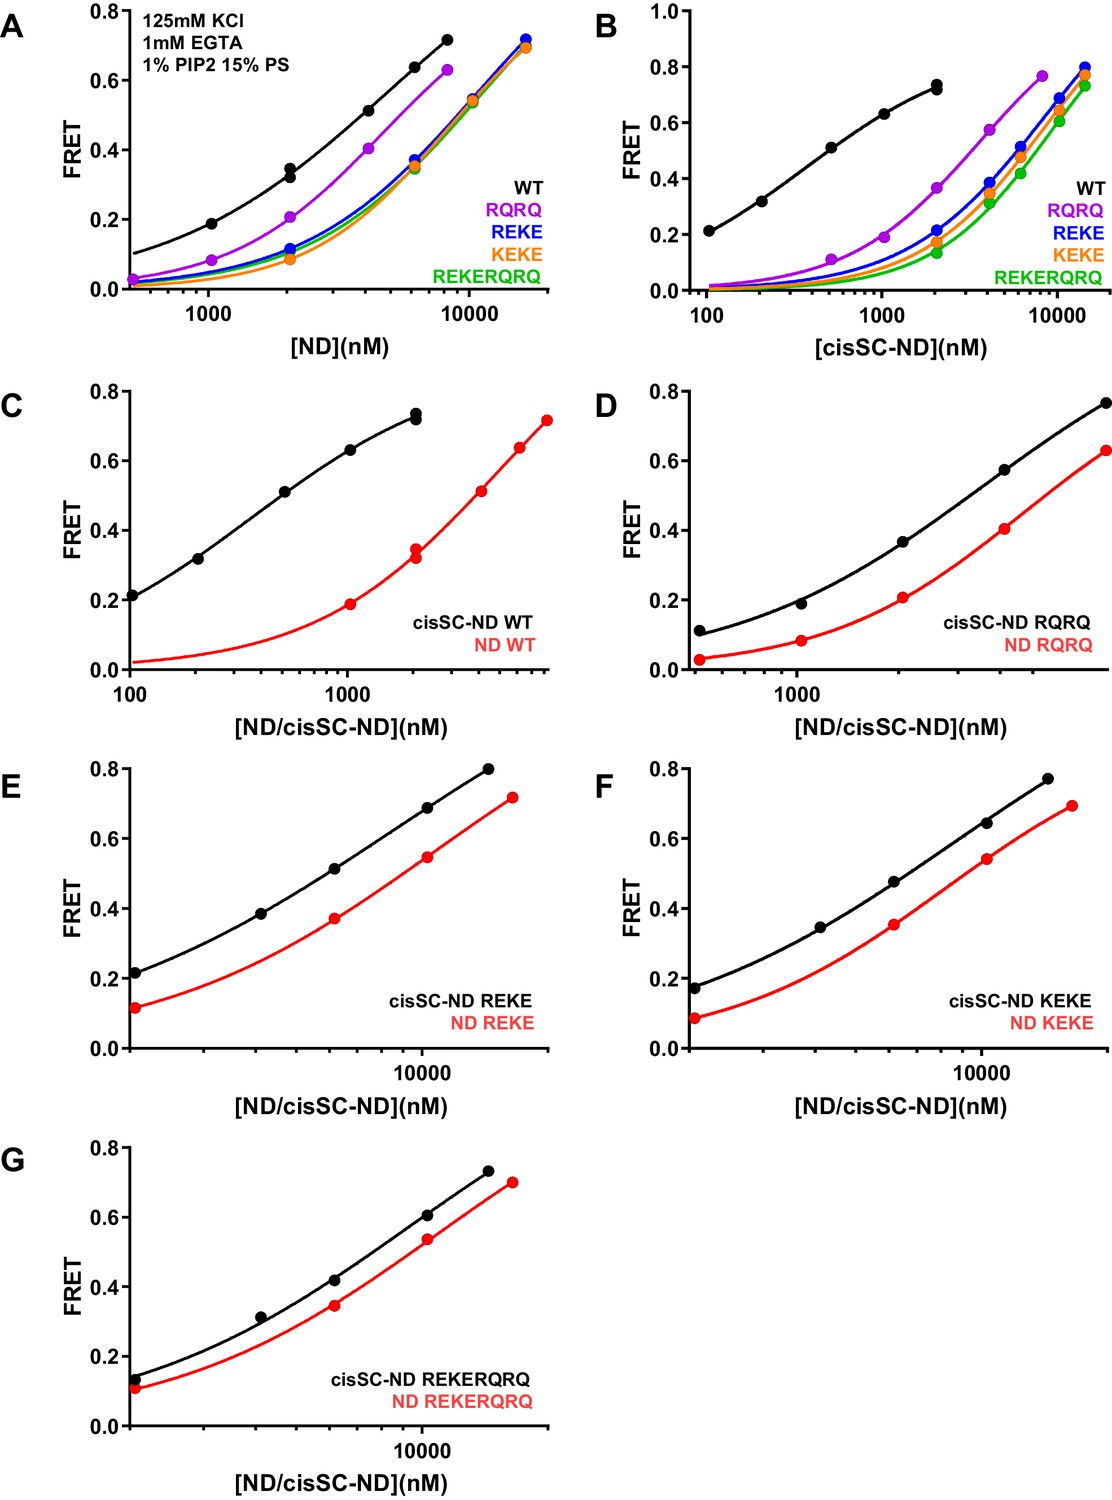
Effects of mutations in the Syt1 C2B domain on Ca2+-independent and Ca2+-dependent binding of C2AB* to NDs and cisSC-NDs.
(A–B) FRET efficiencies observed in titrations of WT, R398Q/R399Q (RQRQ), R322E/K325E (REKE), K324E/K326E (KEKE) or R322E/K325E/R398Q/R399Q (REKERQRQ) C2AB* with NDs (A) or cisSC-NDs (B) containing 15% PS, 5% Rho-PE and 1% PIP2 in the presence of 1 mM EGTA and 125 mM KCl. (C–G) The same data shown in panels A–B but presented in a different form to illustrate the differences in binding to NDs and cisSC-NDs for a given C2AB* version. All data were fit with a Hill equation (see Materials and methods).
-
Figure 6—figure supplement 3—source data 1
Source data for Figure 6—figure supplement 3.
- https://cdn.elifesciences.org/articles/57154/elife-57154-fig6-figsupp3-data1-v3.xlsx
Figure 6—figure supplement 4
Effects of mutations in the Syt1 C2B domain on Ca2+-independent and Ca2+-dependent binding of C2AB* to NDs and cisSC-NDs.
FRET efficiencies observed in titrations of WT (A), R398Q/R399Q (RQRQ) (B), R322E/K325E (REKE) (C), K324E/K326E (KEKE) (D) or R322E/K325E/R398Q/R399Q (REKERQRQ) (E) C2AB* with NDs (black traces) or cisSC-NDs (red traces) containing 15% PS and 5% Rho-PE in the presence of 1 mM Ca2+ and 125 mM KCl. These are the same results shown in Figure 6E,F but presented in a different form to illustrate the differences in binding to NDs and cisSC-NDs for a given C2AB* version. All data were fit with a Hill equation (see Materials and methods).
Figure 6—figure supplement 5
Effects of mutations in the Syt1 C2B domain on Ca2+-independent and Ca2+-dependent binding of C2AB* to NDs and cisSC-NDs.
FRET efficiencies observed in titrations of WT (A), R398Q/R399Q (RQRQ) (B), R322E/K325E (REKE) (C), K324E/K326E (KEKE) (D) or R322E/K325E/R398Q/R399Q (REKERQRQ) (E) C2AB* with NDs (black traces) or cisSC-NDs (red traces) containing 10% PS, 5% Rho-PE and 1% PIP2 in the presence of 1 mM Ca2+ and 125 mM KCl. These are the same results shown in Figure 6G,H but presented in a different form to illustrate the differences in binding to NDs and cisSC-NDs for a given C2AB* version. All data were fit with a Hill equation (see Materials and methods).
Figure 6—figure supplement 6
Effects of mutations in the Syt1 C2B domain on Ca2+-independent and Ca2+-dependent binding of C2AB* to NDs and cisSC-NDs.
(A–B) FRET efficiencies observed in titrations of WT, R398Q/R399Q (RQRQ), R322E/K325E (REKE), K324E/K326E (KEKE) or R322E/K325E/R398Q/R399Q (REKERQRQ) C2AB* with NDs (A) or cisSC-NDs (B) containing 15% PS, 5% Rho-PE and 1% PIP2 in the presence of 1 mM Ca2+ and 125 mM KCl. (C–G) The same data shown in panels A–B but presented in a different form to illustrate the differences in binding to NDs and cisSC-NDs for a given C2AB* version. All data were fit with a Hill equation (see Materials and methods).
-
Figure 6—figure supplement 6—source data 1
Source data for Figure 6—figure supplement 6.
- https://cdn.elifesciences.org/articles/57154/elife-57154-fig6-figsupp6-data1-v3.xlsx
Figure 7

The E295A/Y338W mutation in the C2B domain primary interface enhances binding of C2AB* to cisSC-NDs.
(A–D) FRET efficiencies observed in titrations of WT or E295A/Y338W (EAYW) C2AB* with NDs or cisSC-NDs containing 15% PS, 5% Rho-PE and 1% PIP2 (A,C), 15% PS and 5% Rho-PE (B), or 10% PS, 5% Rho-PE and 1% PIP2 (D) in the presence of 1 mM EGTA and 50 mM KCl (A), or 1 mM Ca2+ and 125 mM KCl (B–D). All data were fit with a Hill equation (see Materials and methods).
-
Figure 7—source data 1
Source data for Figure 7.
- https://cdn.elifesciences.org/articles/57154/elife-57154-fig7-data1-v3.xlsx
Figure 8 with 1 supplement
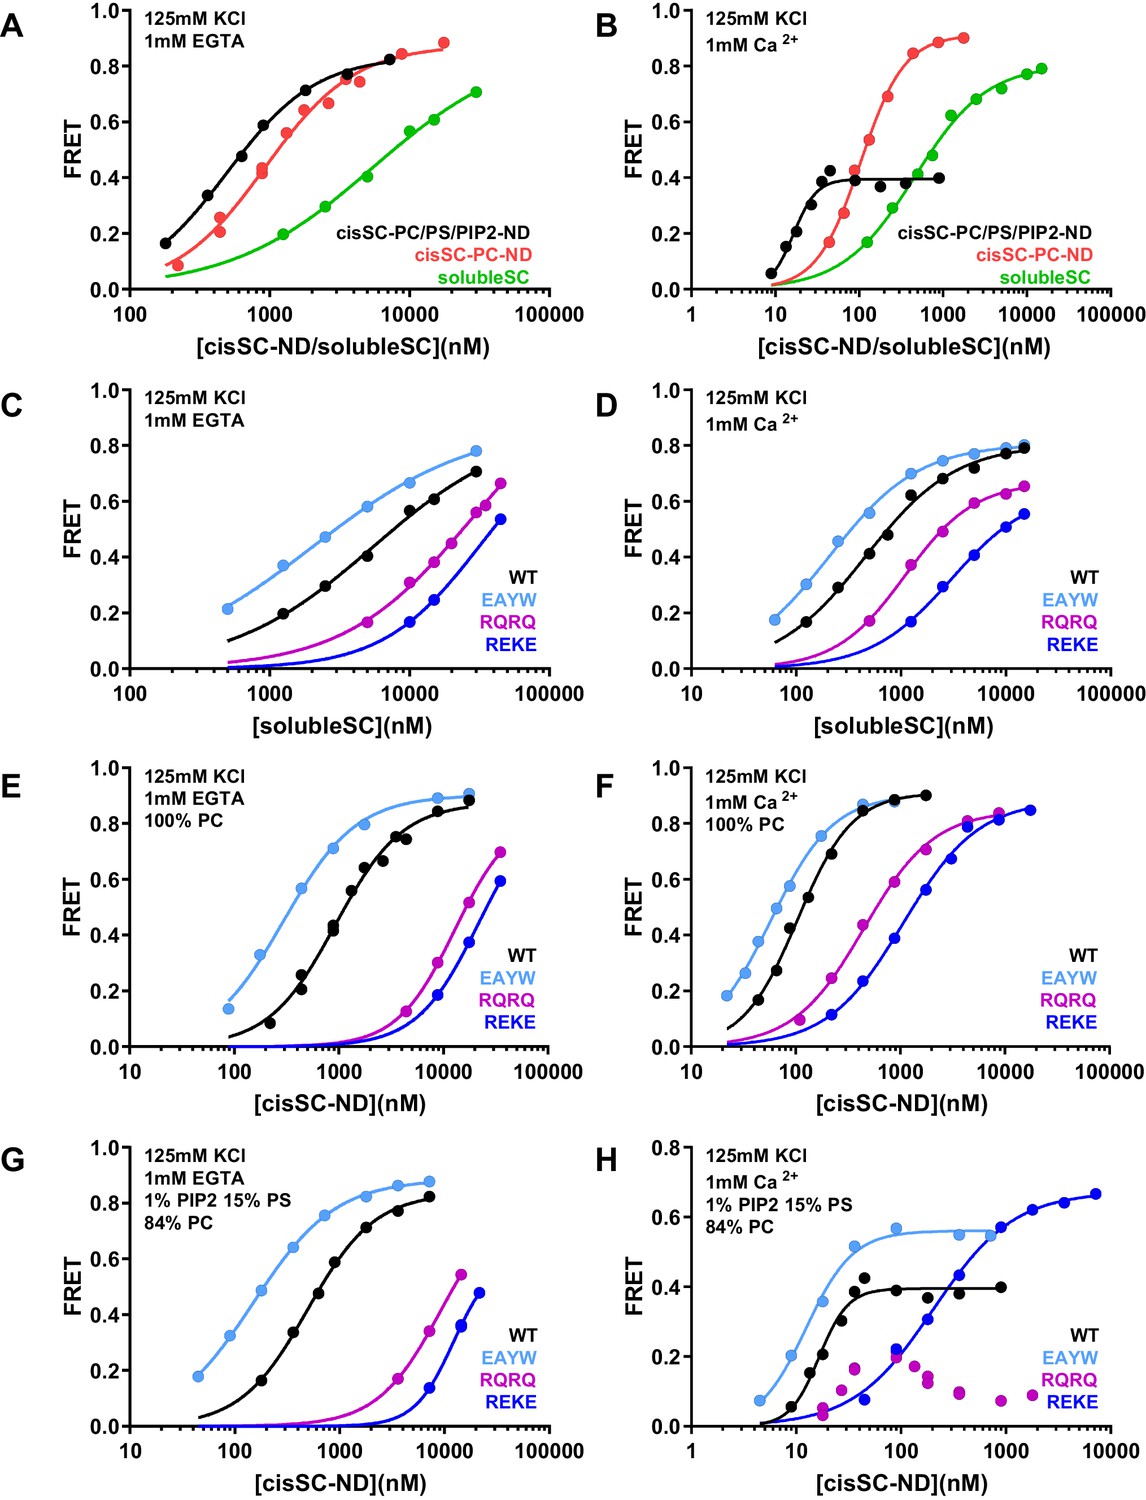
Effects of phospholipids on C2AB* binding to the SNARE complex.
(A–B) FRET efficiencies observed in titrations of WT C2AB* with solubleSC, cisSC-PC-NDs (containing only PC) or cisSC-PC/PS/PIP2-NDs (containing 15% PS,1% PIP2, 84% PC) labeled with TMR at residue 76 of SNAP-25 in the presence of 1 mM EGTA (A) or 1 mM Ca2+ (B). (C–H) FRET efficiencies in analogous titrations of WT, R398Q/R399Q (RQRQ), R322E/K325E (REKE) or E295A/Y338W (EAYW) C2AB* with solubleSC (C–D), cisSC-PC-NDs (E–F) or cisSC-PC/PS/PIP2-NDs (G–H) in the presence of 1 mM EGTA (C, E, G) or 1 mM Ca2+ (D, F, H). All data were fit with a Hill equation (see Materials and methods).
-
Figure 8—source data 1
Source data for Figure 8.
- https://cdn.elifesciences.org/articles/57154/elife-57154-fig8-data1-v3.xlsx
Figure 8—figure supplement 1
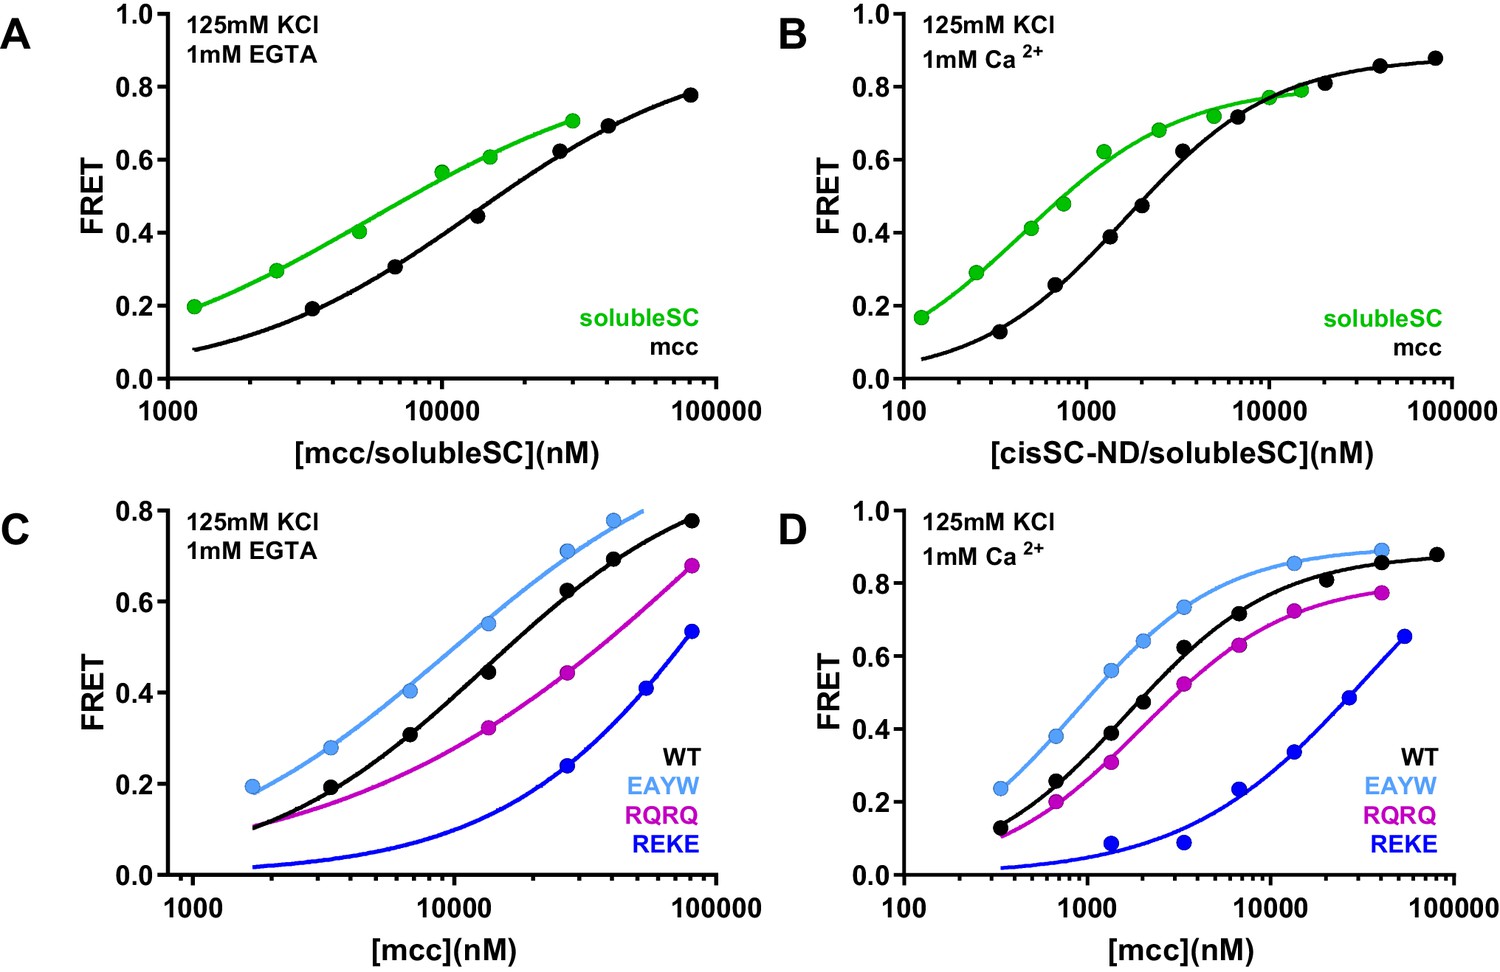
Effects of phospholipids on C2AB* binding to the SNARE complex.
(A–B) FRET efficiencies observed in titrations of WT C2AB* with solubleSC or SNARE complex containing the SNARE motif of syntaxin-1 (residues 191–253) (mcc) instead of syntaxin-1 (2–253), both labeled with TMR at residue 76 of SNAP-25, in the presence of 1 mM EGTA (A) or 1 mM Ca2+ (B). (C–D) FRET efficiencies in analogous titrations of WT, R398Q/R399Q (RQRQ), R322E/K325E (REKE) or E295A/Y338W (EAYW) C2AB* with mcc in the presence of 1 mM EGTA (C) or 1 mM Ca2+ (D). All data were fit with a Hill equation (see Materials and methods).
-
Figure 8—figure supplement 1—source data 1
Source data for Figure 8—figure supplement 1.
- https://cdn.elifesciences.org/articles/57154/elife-57154-fig8-figsupp1-data1-v3.xlsx
Figure 9 with 4 supplements
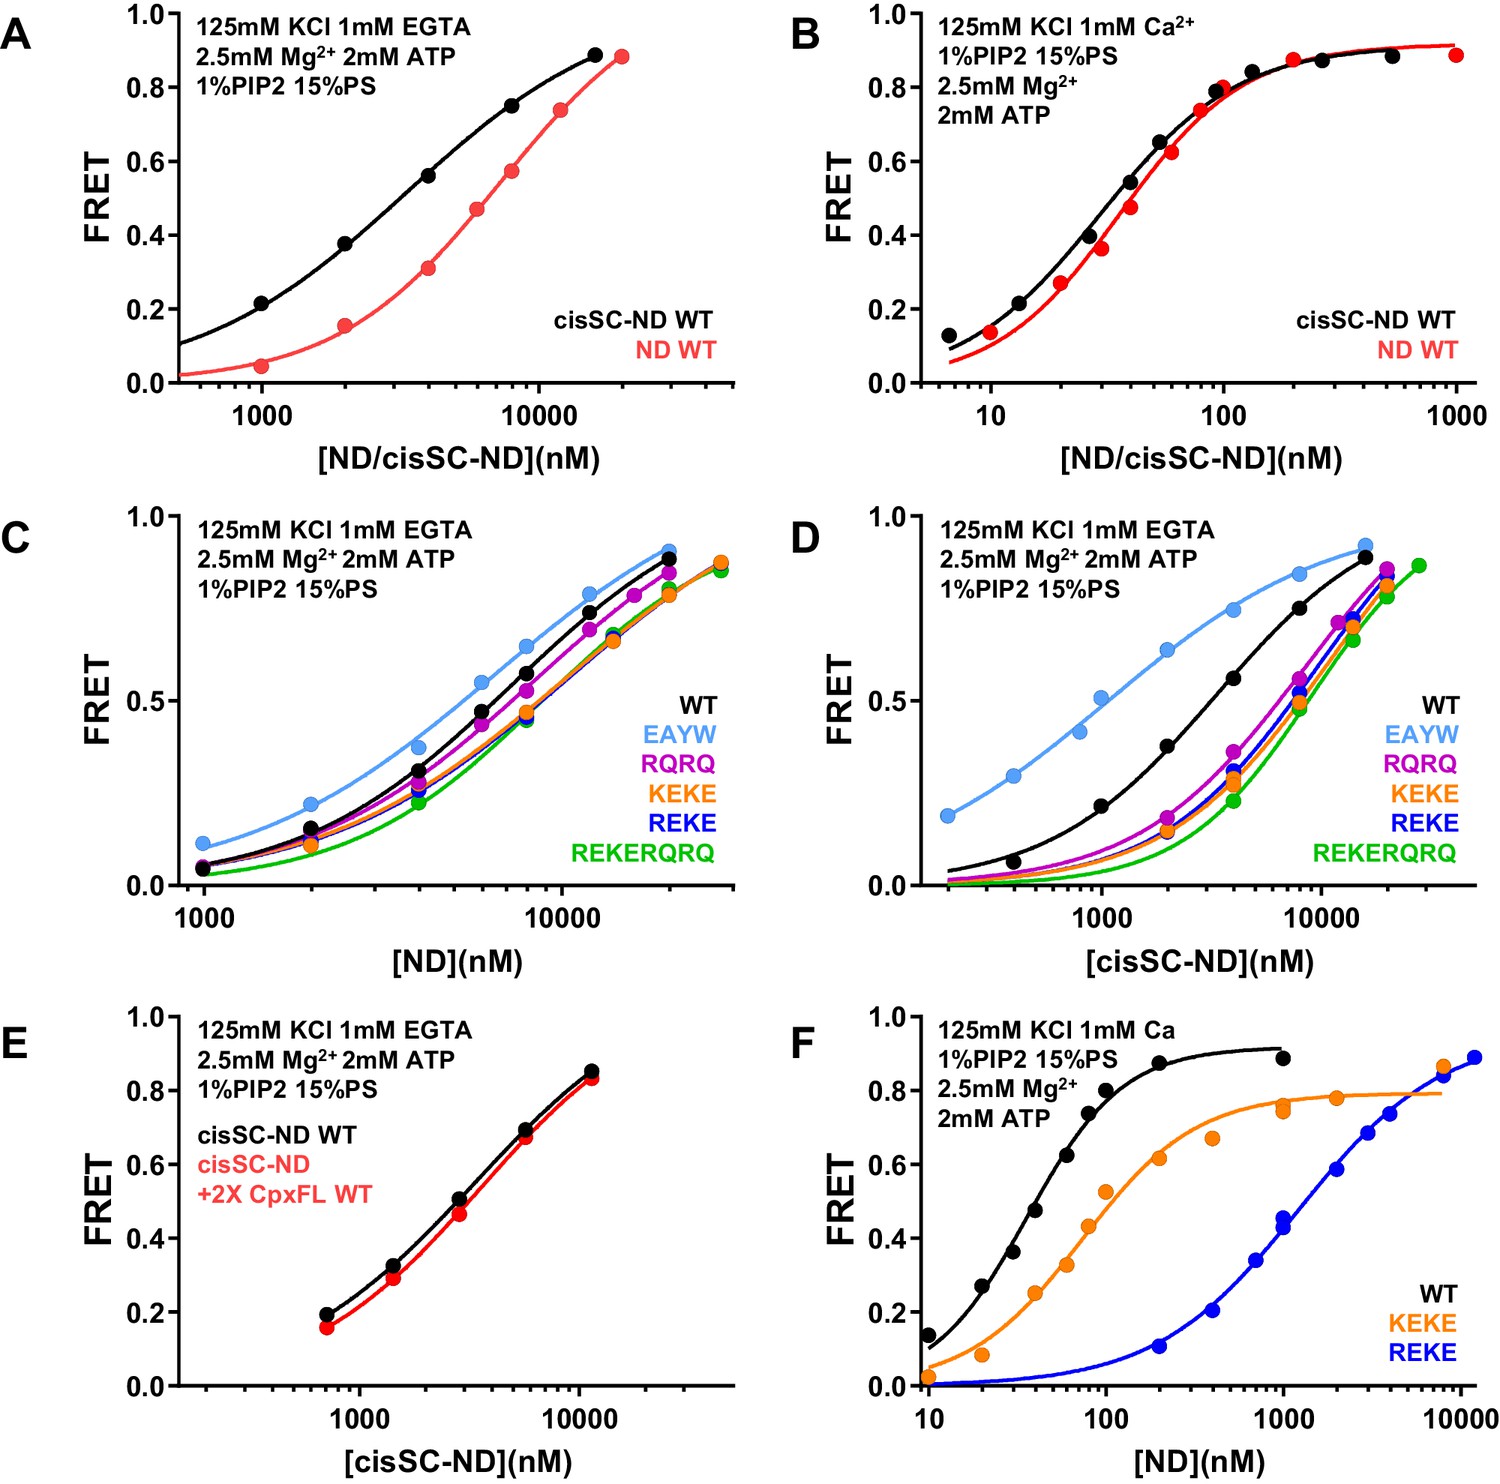
ATP almost abolishes Ca2+-dependent binding but not Ca2+-independent binding of C2AB* to SNARE complexes in cisSC-NDs.
(A–B) FRET efficiencies observed in titrations of WT C2AB* with NDs or cisSC-NDs containing 15% PS, 5% Rho-PE and 1% PIP2 in the presence of 2.5 mM Mg2+ and 2 mM ATP, and 1 mM EGTA plus 50 mM KCl (A), or 1 mM Ca2+ plus 125 mM KCl (B). (C–D) FRET efficiencies observed in titrations of WT, E295A/Y338W (EAYW), R398Q/R399Q (RQRQ), R322E/K325E (REKE), K324E/K326E (KEKE) or R322E/K325E/R398Q/R399Q (REKERQRQ) C2AB* with NDs (C) or cisSC-NDs (D) containing 15% PS, 5% Rho-PE and 1% PIP2 in the presence of 2.5 mM Mg2+, 2 mM ATP, 1 mM EGTA and 50 mM KCl. (E) FRET efficiencies observed in titrations of C2AB* with cisSC-NDs containing 15% PS, 5% Rho-PE and 1% PIP2 in the presence of 2.5 mM Mg2+, 2 mM ATP, 1 mM EGTA and 50 mM KCl, with or without complexin-1. (F) FRET efficiencies observed in titrations of WT, R322E/K325E (REKE) or K324E/K326E (KEKE) C2AB* with NDs containing 15% PS, 5% Rho-PE and 1% PIP2 in the presence of 2.5 mM Mg2+, 2 mM ATP, 1 mM Ca2+ and 125 mM KCl.
-
Figure 9—source data 1
Source data for Figure 9.
- https://cdn.elifesciences.org/articles/57154/elife-57154-fig9-data1-v3.xlsx
Figure 9—figure supplement 1

ATP does not abolish Ca2+-independent binding of C2AB* to SNARE complexes in cisSC-NDs.
(A–C) Fluorescence emission spectra of 50 nM C2AB* alone (black traces) or in the presence of 2 μM NDs (red traces) or 2 μM cisSC-NDs (green traces) in 1 mM EGTA and 125 mM KCl without (A) or with 2.5 mM Mg2+ (B) or 2.5 mM Mg2+ plus 2 mM ATP (C). (D) Quantification of the FRET efficiencies observed in the experiments shown in panels A–C. Bars show average from repeat experiments performed in triplicate under the same conditions, and error bars show standard deviations. The large differences between the FRET efficiencies observed in the presence of NDs or cisSC-NDs shows that C2AB* binds to the SNARE complexes anchored on the nanodiscs.
-
Figure 9—figure supplement 1—source data 1
Source data for Figure 9—figure supplement 1.
- https://cdn.elifesciences.org/articles/57154/elife-57154-fig9-figsupp1-data1-v3.xlsx
Figure 9—figure supplement 2
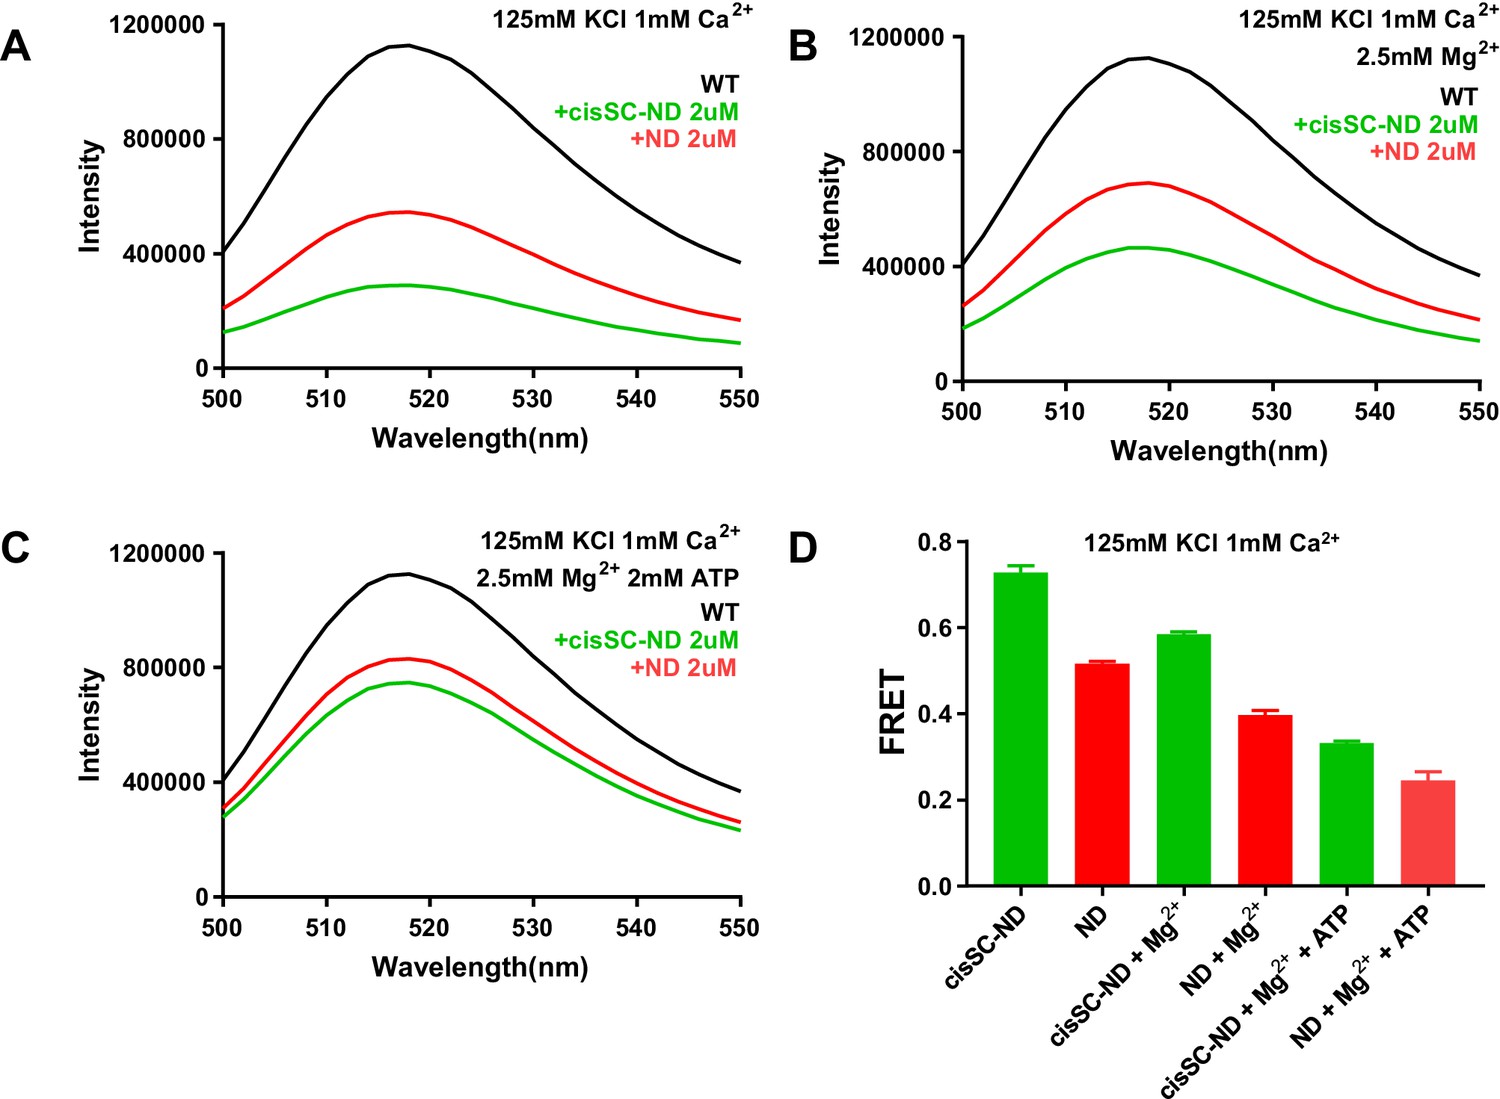
ATP does almost abolishes Ca2+-dependent binding of C2AB* to SNARE complexes in cisSC-NDs.
(A–C) Fluorescence emission spectra of 50 nM C2AB* alone (black traces) or in the presence of 2 μM NDs (red traces) or 2 μM cisSC-NDs (green traces) in 1 mM Ca2+ and 125 mM KCl without (A) or with 2.5 mM Mg2+ (B) or 2.5 mM Mg2+ plus 2 mM ATP (C). (D) Quantification of the FRET efficiencies observed in the experiments shown in panels A–C. Bars show average from repeat experiments performed in triplicate under the same conditions, and error bars show standard deviations. The small difference between the FRET efficiencies observed in the presence of NDs or cisSC-NDs for experiments performed in the presence of 2.5 mM Mg2+ plus 2 mM ATP shows that binding of C2AB* to the SNARE complexes anchored on the nanodiscs is almost abolished under these conditions.
-
Figure 9—figure supplement 2—source data 1
Source data for Figure 9—figure supplement 2.
- https://cdn.elifesciences.org/articles/57154/elife-57154-fig9-figsupp2-data1-v3.xlsx
Figure 9—figure supplement 3
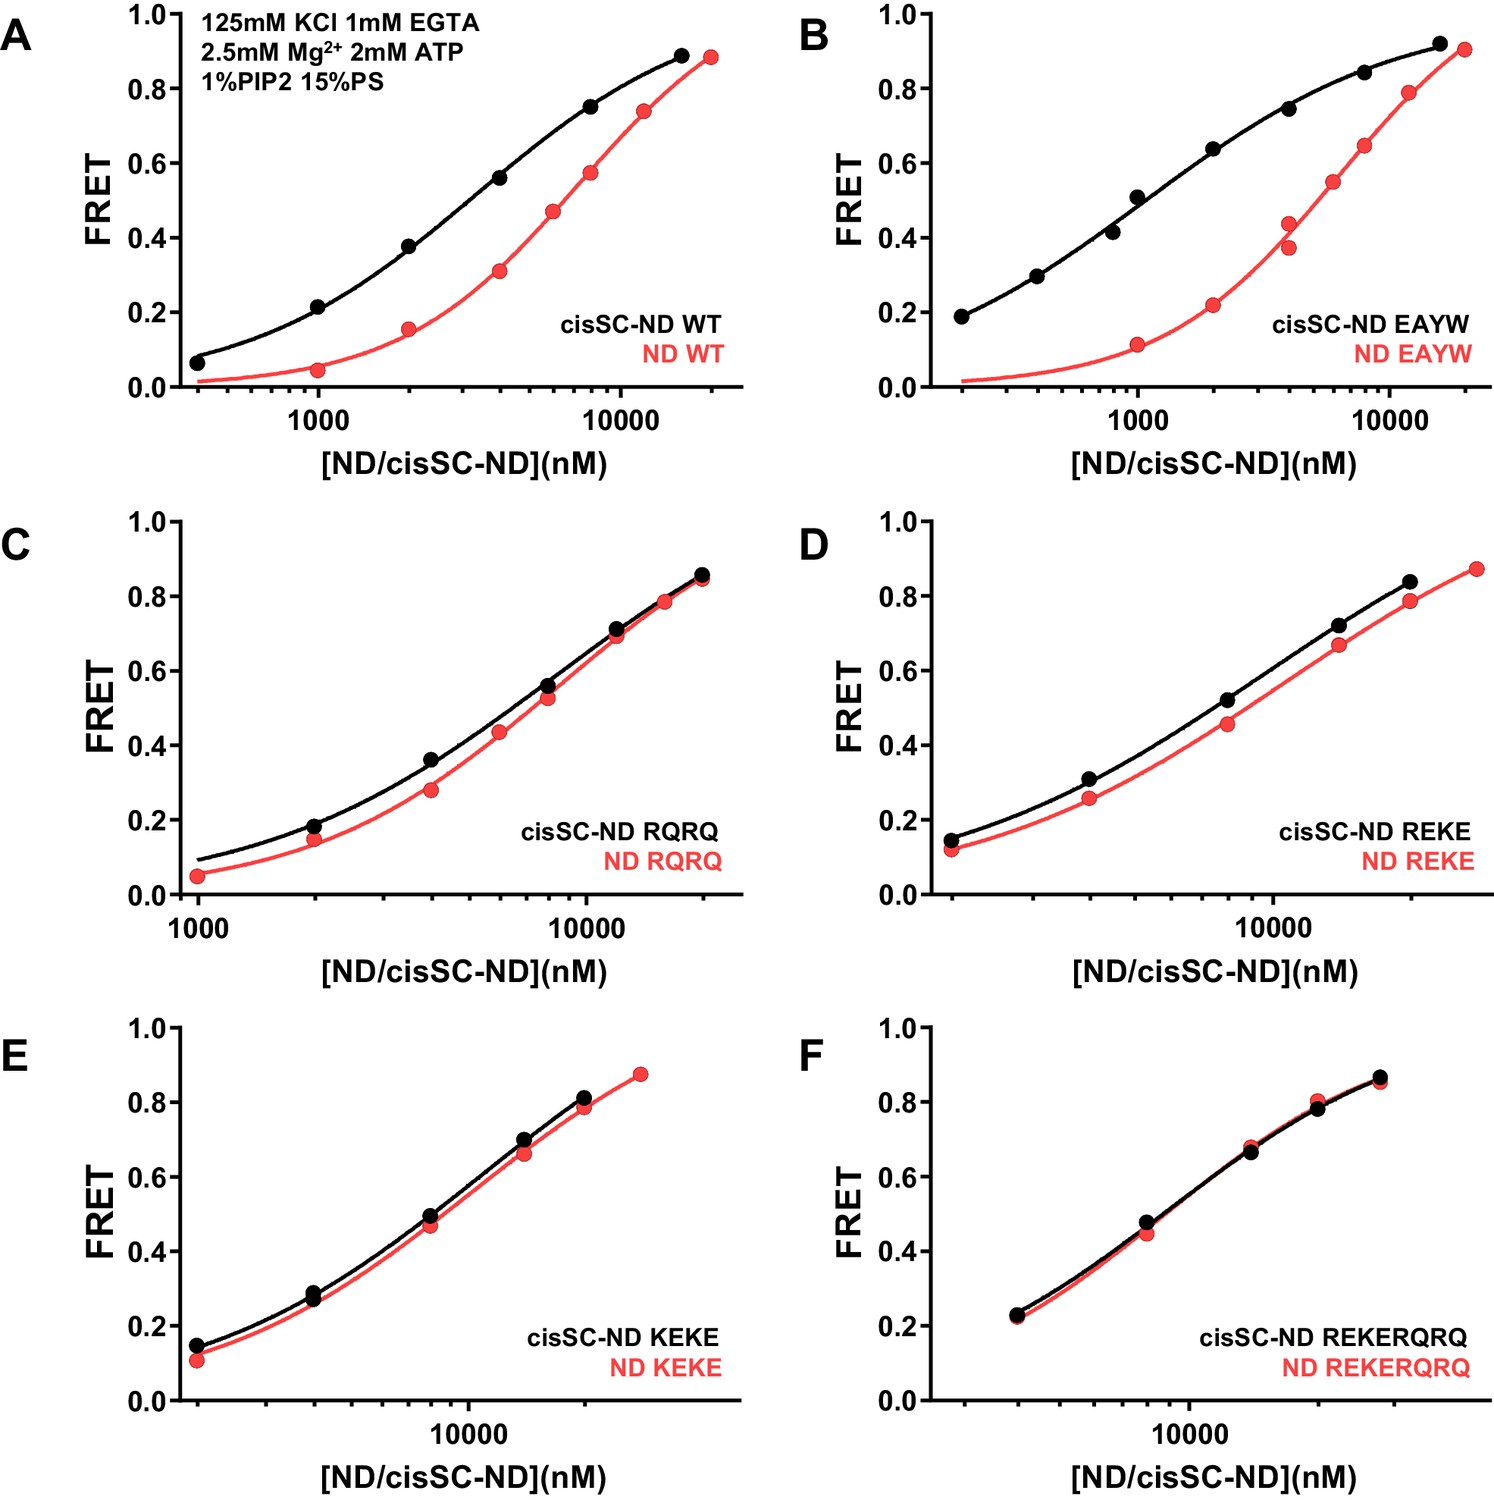
Effects of mutations in the Syt1 C2B domain on Ca2+-independent binding of C2AB* to NDs and cisSC-NDs in the presence of ATP.
FRET efficiencies observed in titrations of WT (A), E295A/Y338W (EAYW) (B), R398Q/R399Q (RQRQ) (C), R322E/K325E (REKE) (D), K324E/K326E (KEKE) (E) or R322E/K325E/R398Q/R399Q (REKERQRQ) (F) C2AB* with NDs (black traces) or cisSC-NDs (red traces) containing 15% PS, 5% Rho-PE and 1% PIP2 in the presence of 1 mM EGTA, 125 mM KCl, 2.5 mM Mg2+ and 2 mM ATP. These are the same results shown in Figure 9C,D but presented in a different form to illustrate the differences in binding to NDs and cisSC-NDs for a given C2AB* version. All data were fit with a Hill equation (see Materials and methods).
Figure 9—figure supplement 4
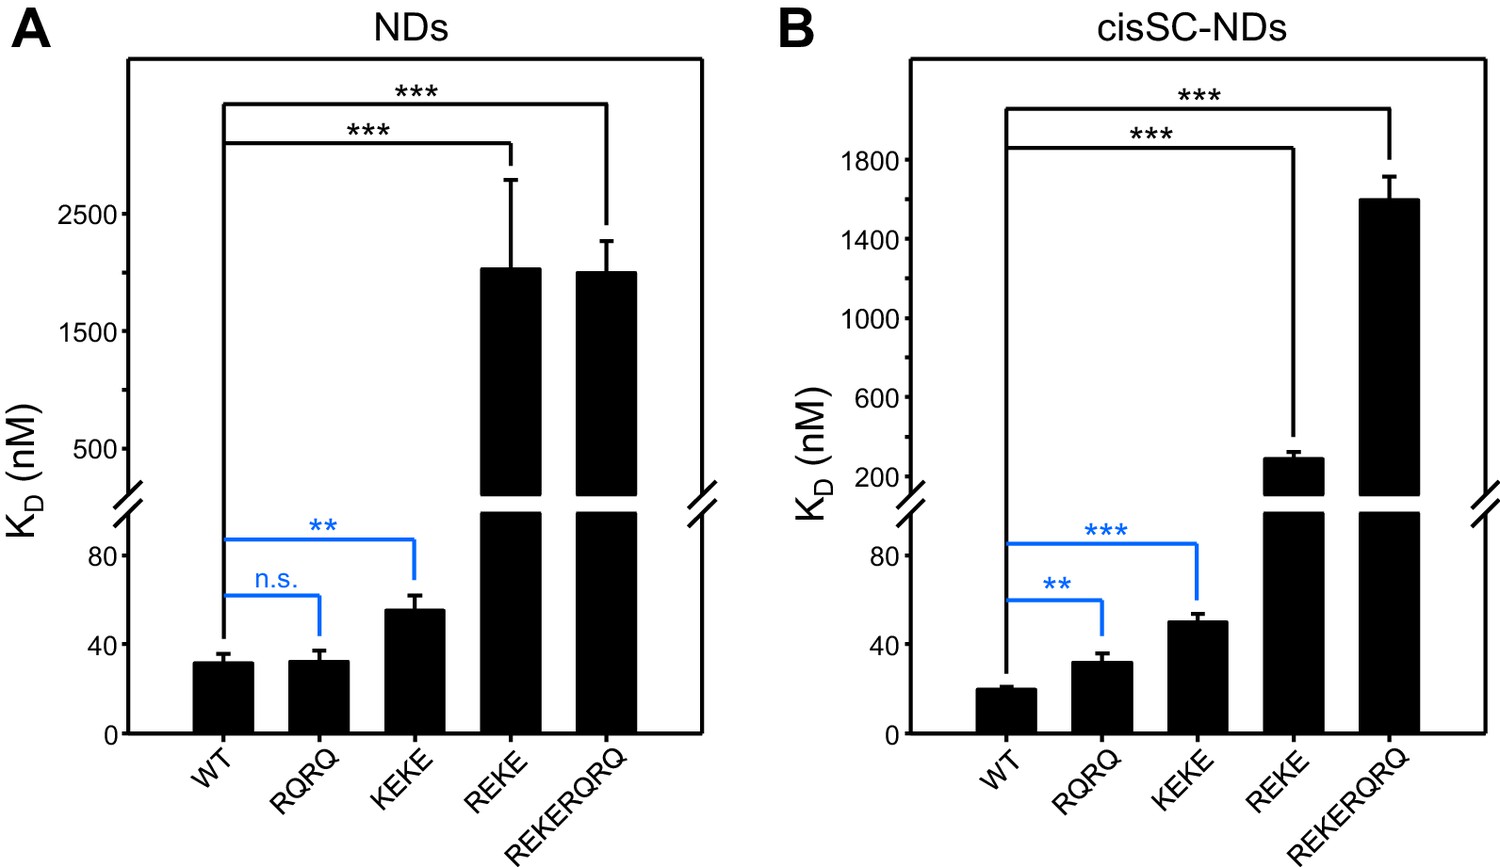
Reproducibility of titrations of C2AB* with NDs and cisSC-NDs.
(A–B) The graphs sumarize the KDs measured in titrations of WT, R398Q/R399Q (RQRQ), K324E/K326E (KEKE), R322E/K325E (REKE) or R322E/K325E/R398Q/R399Q (REKERQRQ) C2AB* with NDs (A) or cisSC-NDs (B) containing 84% PC, 10% PS, 1% PIP2 and 5% Rho-PE, in the presence of 1 mM Ca2+. Bars indicate the means of the KDs measured in three independent experiments performed with different preparations and error bars indicate standard deviations. The KDs of individual experiments are listed in Supplementary file 1. The large differences observed between the KDs measured for WT C2AB* and the R322E/K325E or R322E/K325E/R398Q/R399Q mutants in the experiments performed with NDs or cisSC-NDs where clearly statistically significant. The large KDs and associated errors of the KDs measured for these mutations hindered statistical comparisons of WT with the other mutants in the group. Removing R322E/K325E or R322E/K325E/R398Q/R399Q data, some of the differences between the KDs measured for WT C2AB* and for the R398Q/R399Q or K324E/K326E mutants were also statistically significant, as indicated by the blue lines (n.s., not significant). Statistical significance and P values were determined by one-way analysis of variance (ANOVA) with Holm-Sidak test (**p<0.01; ***p<0.001).
Figure 10
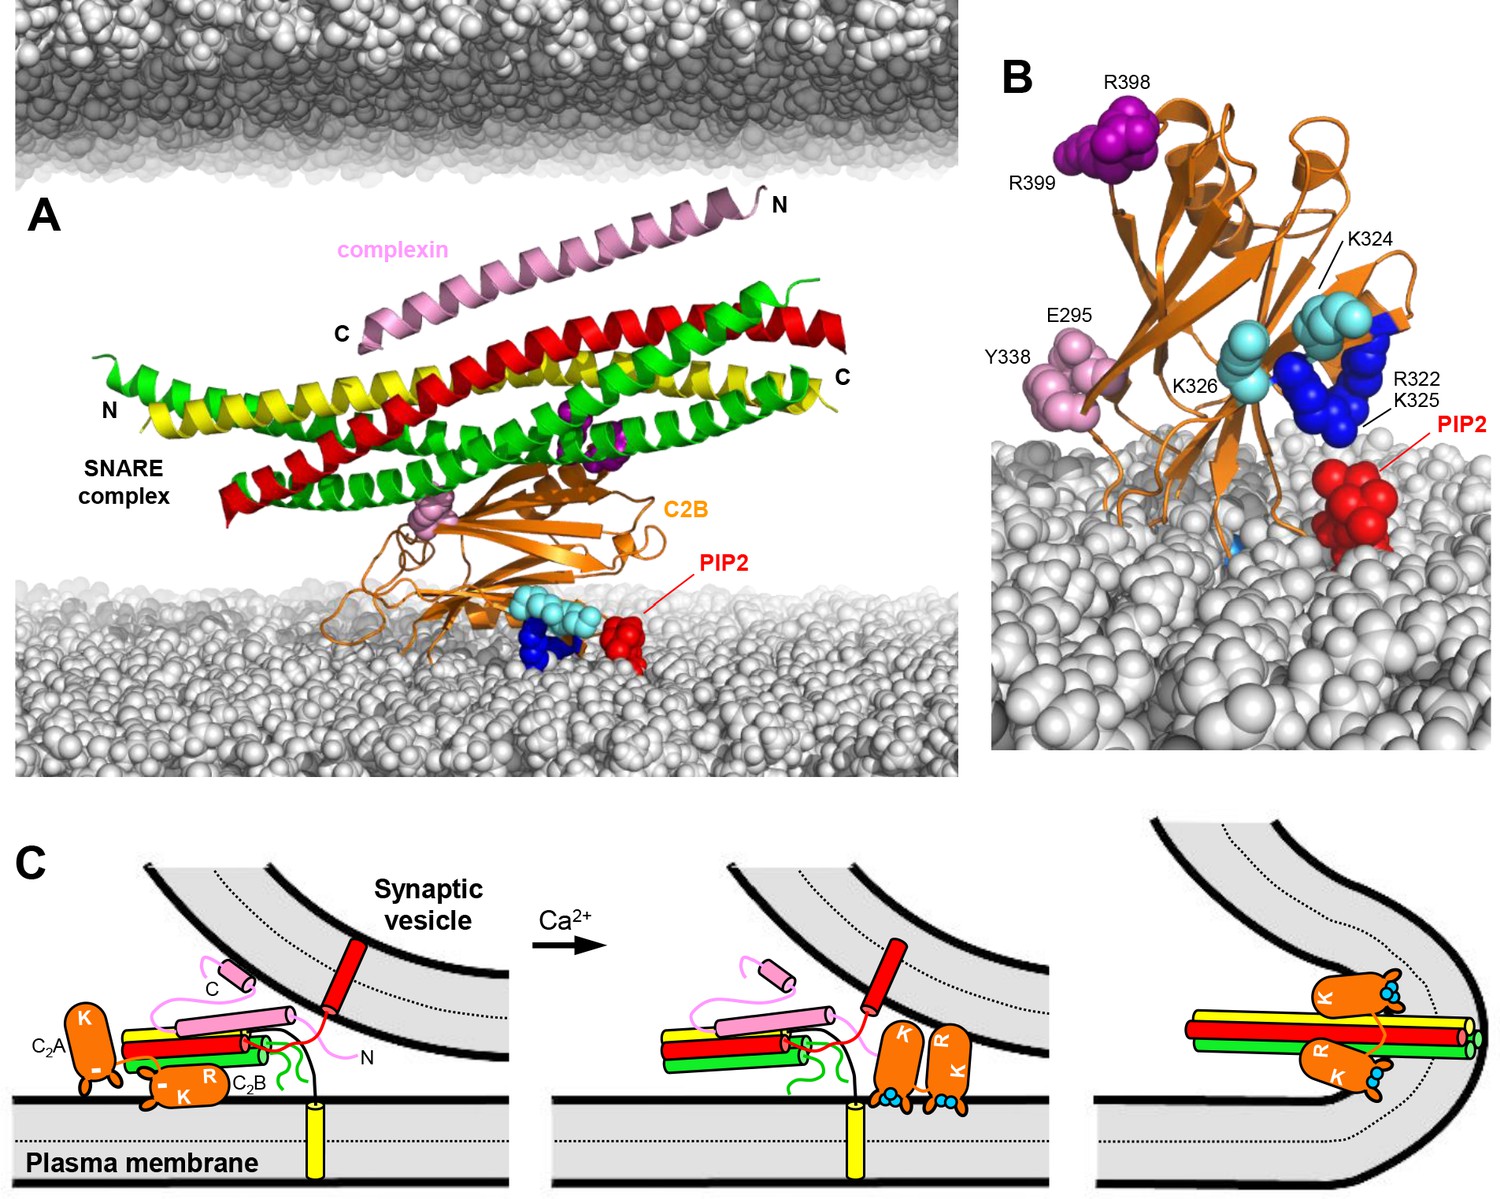
Working model for the function of Syt1 in neurotransmitter release.
(A) Model of how the Syt1 C2B domain (orange) can bind to the SNARE complex (syntaxin-1 yellow, SNAP-25 green, synaptobrevin red) through the primary interface and at the same time to the plasma membrane through the polybasic region. Complexin-1 (26–83) bound to the other side of the SNARE complex is also shown (pink). The N- and C-termini of the SNARE for-helix bundle and complexin-1 (26–83) are indicated. The plasma membrane is shown below and the vesicle membrane above (both in gray). The model shows how, in this orientation, K324 and K326 (cyan spheres) on one side of a β-strand are readily accessible for binding to PIP2 (red) on the plasma membrane, similar to R322 and K325 (dark blue spheres) on the other side of the same β-strand. R398 and R399 are shown as purple spheres, and E295 and Y338 as pink spheres. The model also shows how this binding mode hinders C-terminal zippering of the SNARE complex because the C-terminus of the syntaxin-1 SNARE motif would be far from the plasma membrane. Complexin-1 also hinders zippering because its accessory helix bumps with the vesicle membrane. The model was constructed by superimposing the structures of the complexes formed by the SNARE complex with the C2B domain and complexin-1 (26–83) (PDB accession codes 5kj7 and 1KIL). (B) Model showing how Ca2+-induced insertion of the Syt1 C2B domain Ca2+-binding loops into the plasma membrane is expected to yield an approximately perpendicular orientation that allows binding of R322 and K325 to PIP2, whereas K324 and K326 cannot reach PIP2 because they point in the opposite direction. (C) Proposed model of neurotransmitter release whereby the Syt1 C2B domain is bound to the SNARE complex and the plasma membrane before Ca2+ influx, while complexin-1 is bound on the other side (as shown in more detail in panel A). The N- and C-terminal sequences of complexin-1 are shown as pink curves that represent unfolded structure, except for a helix at the C-terminus that is believed to bind to the vesicle membrane (Snead et al., 2014). The location of the Syt1 C2A domain is arbitrary. The polybasic region of C2B is indicated by K, while R398,R399 at the bottom of C2B is indicated by an R. A basic sequence at the bottom of C2A is indicated by K. The model proposes that the inhibition of membrane fusion in this state is rapidly relieved by Ca2+- and PIP2-dependent binding of both Syt1 C2 domains to the plasma membrane, releasing the interaction with the SNAREs and bridging the two membranes (middle panel) to facilitate C-terminal SNARE zippering (Ca2+ ions shown as blue circles). Induction of positive curvature by insertion of the C2 domain Ca2+-binding loops into the membranes may cooperate with SNARE zippering in catalyzing membrane fusion (right panel). Note that the curvature of the membrane fusion diagram in the plane perpendicular to the paper is positive.
Tables
Key resources table
| Reagent type (species) or resource | Designation | Source or reference | Identifiers | Additional information |
|---|---|---|---|---|
| Recombinant DNA reagent | pGEX-KG-GST-Syt1_C2B | Brewer et al., 2015 | Protein expression plasmid for E. coli (rat synaptotagmin-1 C2AB domain, residues 271–421) | |
| Recombinant DNA reagent | pGEX-KG-GST-Syt1_C2AB | Araç et al., 2006 | Protein expression plasmid for E. coli (rat synaptotagmin-1 C2AB domain, residues 140–421) | |
| Recombinant DNA reagent | pMSP1E3D1 | Addgene | 20066 | Protein expression plasmid for E. coli (MSP1E3D1) |
| Chemical compound, drug | DEUTERIUM OXIDE (D, 99.8%) | Cambridge Isotope Laboratories, Inc | DLM-4–99.8 | |
| Chemical compound, drug | AMMONIUM CHLORIDE (15N, 99%) | Cambridge Isotope Laboratories, Inc | NLM-467 | |
| Chemical compound, drug | D-GLUCOSE (1,2,3,4,5,6,6-D7,97–98%) | Cambridge Isotope Laboratories, Inc | DLM-2062 | |
| Chemical compound, drug | L-Methionine-(methyl-13C) | Sigma-aldrich | 299146 | |
| Chemical compound, drug | 2-Ketobutyric acid-4–13C,3,3-d2 sodium salt hydrate | Sigma-aldrich | 589276 | |
| Chemical compound, drug | PC | Avanti polar lipid | 850457 | 1-palmitoyl-2-oleoyl-glycero-3-phosphocholine |
| Chemical compound, drug | PS | Avanti polar lipid | 840035 | 1,2-dioleoyl-sn-glycero-3-phospho-L-serine (sodium salt) |
| Chemical compound, drug | PIP2 | Avanti polar lipid | 840046 | L-α-phosphatidylinositol-4,5-bisphosphate (Brain, Porcine) (ammonium salt) |
| Chemical compound, drug | RhoPE | Avanti polar lipid | 810158 | 1,2-dipalmitoyl-sn-glycero-3-phosphoethanolamine-N-(lissamine rhodamine B sulfonyl) (ammonium salt) |
| Chemical compound, drug | Tetramethylrhodamine-5-Maleimide | Invitrogen | T-6027 | |
| Chemical compound, drug | Alexa Fluor488 C5 Maleimide | Thermo Fisher Scientific | A10254 | |
| Chemical compound, drug | β-OG (octyl-beta-glucoside) | Gold biotechnology | O-110–50 | |
| Chemical compound, drug | Detergent Removal Resin | Thermo Fisher Scientific | 87780 |
Additional files
-
Supplementary file 1
Summary of apparent KDs calculated from the titrations of C2AB* with NDs, cisSC-NDs, transSC-NDs and solubleSCs performed under various conditions.
Most of the entries in the table correspond to the data shown in Figures 5–9 and associated figure supplements, as indicated in the second column. The first column shows whether the experiments were performed with WT C2AB* or C2AB* mutant E295A,Y338W (EAYW), R398Q,R399Q (RQRQ), R322E,K325E (REKE), K324E,K326E (KEKE) or R322E,K325E,R398Q,R399Q (REKERQRQ). The KDs, KD errors, Hill coefficients (h) and FRET efficiencies at saturating concentrations (Bmax) were calculated from fitting the data to the Hill equation described in Materials and methods. Note that Bmax values above one must be considered an artifact of the fit, as FRET efficiencies cannot be larger than 1. The three columns on the right describe the buffer conditions used, the composition of the NDs, cisSC-NDs or transSC-NDs, and where the FRET acceptor probe was placed. SNN indicates the SNAP-25 N-terminal SNARE motif. To show the reproducibility of the data, the results obtained in three independent sets of experiments performed with different preparations under the conditions of Figure 6G and H are listed. Statistical analysis of these data is presented in Figure 9—figure supplement 4.
- https://cdn.elifesciences.org/articles/57154/elife-57154-supp1-v3.xlsx
-
Supplementary file 2
Cooperativity factors calculated as ratios of KDs measured in titrations of C2AB* with: (i) NDs vs. cisSC-NDs; (ii) NDs or cisSC-NDs in EGTA in the absence vs. the presence of Mg-ATP; (iii) solubleSC vs. cisSC-NDs in the presence of EGTA or Ca2+; and (iv) soluble SC vs. cisSC-PC-PS-PIP2-NDs in the presence of EGTA or Ca2+.
The Figures showing the data used to derive the cooperativity factors are indicated. Table Supplement 1 describes the KDs used for the calculations.
- https://cdn.elifesciences.org/articles/57154/elife-57154-supp2-v3.xlsx
-
Transparent reporting form
- https://cdn.elifesciences.org/articles/57154/elife-57154-transrepform-v3.pdf
Download links
A two-part list of links to download the article, or parts of the article, in various formats.
Downloads (link to download the article as PDF)
Open citations (links to open the citations from this article in various online reference manager services)
Cite this article (links to download the citations from this article in formats compatible with various reference manager tools)
Ca2+-dependent release of synaptotagmin-1 from the SNARE complex on phosphatidylinositol 4,5-bisphosphate-containing membranes
eLife 9:e57154.
https://doi.org/10.7554/eLife.57154


